im3536 lcr meter...1 introduction introduction thank you for purchasing the hioki im3536 lcr meter....
TRANSCRIPT

IM3536 LC
R M
ETER Instruction M
anual
EN
Instruction ManualIM3536
LCR METER
Sept. 2016 Revised edition 2 IM3536A981-02 16-09H


Contents
i
When measuring conductivity and permittivity ...................................................67
3.5 Judging Measurement Results ..... 68 Setting the judgment mode .........................69 Configuring comparator function
settings (judging measurement results based on one judgment standard) ..............69
Configuring BIN function settings (judging measured values based on multiple judgment standards) ......................74
3.6 Setting Application Settings ......... 79 Range synchronization
(Setting measurement conditions for individual measurement Ranges) ...............79
Waveform averaging function (increasing measurement precision or measurement speed) ..................................82
High-Z reject function (detecting contact errors during 2-terminal measurement) ......84
Contact check function (detecting poor contact with the sample during 4-terminal measurement) .................85
Memory function (saving measurement results) ....................86
Number of effective digits of the measurement value ....................................87
LCD display auto-off (power-saving mode) 88 Key tones and judgment tones ...................89 Key-lock function (Disabling key operation) 90
4 Using Continuous Measurement Mode 93
4.1 Setting Which Panels to Use in Continuous Measurement ............. 93
4.2 Performing Continuous Measurement .................................. 94
4.3 Checking Continuous Measurement Results .................... 94
4.4 Changing the Display Timing Setting (When You Wish to Shorten the Screen Update Interval) ................. 95
4.5 Setting the LCD display auto-off (When You Wish to save the power) ............................................. 96
5 Error Correction 975.1 Setting the Cable Length
(Cable Length Correction) ............. 985.2 Open Correction ............................. 99
Before performing open correction .............99 All correction .............................................100
Contents
Introduction ................................................ 1Verifying Package Contents ..................... 1Measurement process............................... 6Safety Information ................................... 10Operating Precautions ............................ 12
1 Overview 171.1 Product Overview and Features ... 171.2 Names and Functions of Parts ..... 181.3 Screen Layout and Operation ....... 20
Screen transition diagram ...........................20 Viewing measured values
(Measurement screen) ................................22 Select the measurement mode
(MODE screen) ...........................................24 Setting detailed settings such as
measurement conditions (SET screen) ......25 Checking measurement condition
settings information .....................................26 Configuring correction functionality
(ADJ screen) ...............................................27 Configuring the instrument’s interfaces,
setting the time and date, and checking the system (SYS screen) ............................28
Displaying and manipulating files on the USB flash drive (FILE screen) ....................29
2 Measurement Preparations 31
2.1 Preparation Flowchart ................... 312.2 Pre-Operation Inspection .............. 332.3 Connecting the Power Cord .......... 342.4 Connecting the Measurement
Cables, Probes, or Fixture ............. 352.5 Turning the Power On and Off ...... 362.6 Setting the Date and Time ............. 38
3 Performing Measure-ments in LCR Mode 39
3.1 Setting Display Parameters ........... 39 To perform DC measurement
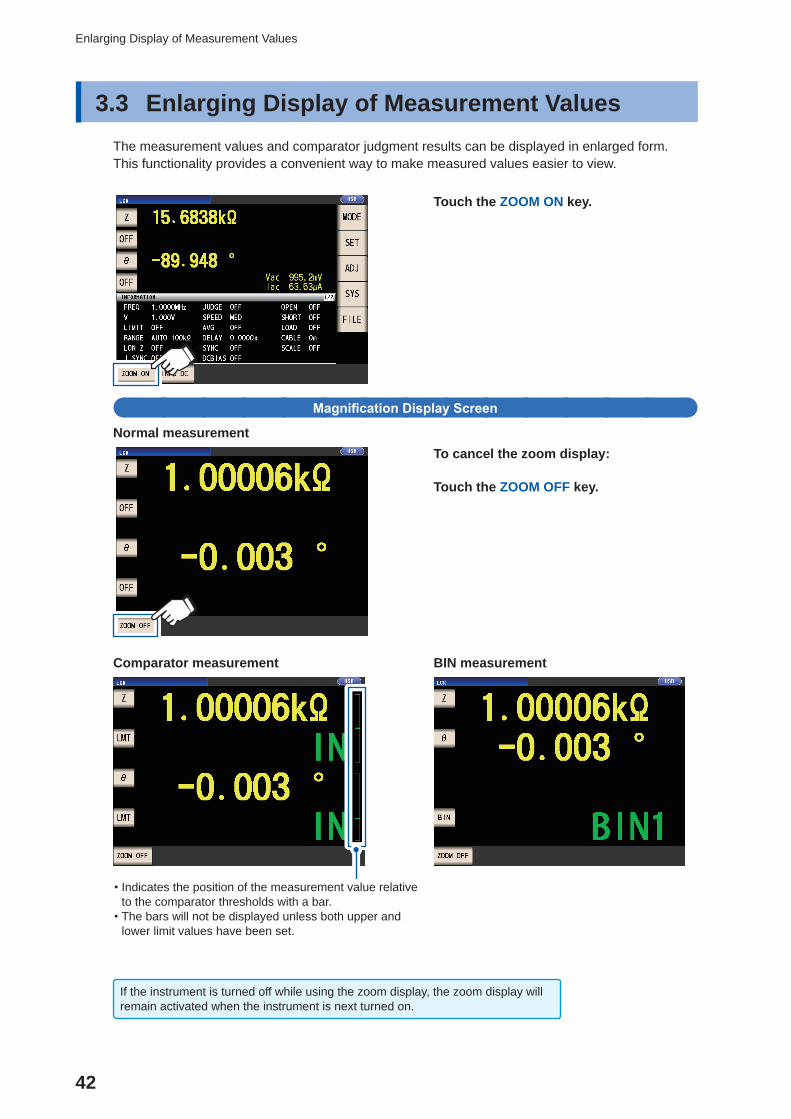
(DC resistance measurement) ....................403.2 Viewing Measured Values.............. 413.3 Enlarging Display of
Measurement Values ...................... 423.4 Setting Measurement
Conditions (basic settings) ........... 43 Required settings ........................................44 User-configurable settings ..........................54 Measurement and data acquisition timing ..65
IM3536A981-02
3
2
1
5
4
Ind.A
ppx.
10
9
8
7
6

Contents
ii
8 Using USB Flash Drive (Saving and Loading Data) 137
8.1 Inserting and Removing a USB flash drive ..................................... 138
8.2 Checking the Contents of Files on a USB flash drive .................... 139
8.3 Formatting a USB Flash Drive .... 1408.4 Saving Measurement Data .......... 141
Saving Measurement Data in text .............141 Saving a copy of the screen .....................150 To specify the save folder .........................152
8.5 Saving Settings Data ................... 153 Saving instrument settings other than
panels .......................................................153 Save all instrument settings including
panels (ALL SAVE function) ......................1548.6 Loading Instrument Settings ...... 155
Loading settings files or panel files ...........155 Loading settings files including panel
files (ALL LOAD function) .........................1568.7 Checking the Contents of a File . 1578.8 Deleting Files and Folders .......... 1588.9 Creating Folders ........................... 1598.10 Displaying the USB Flash Drive
Information ................................... 160
9 External Control 1619.1 External Input/Output Connector
and Signals ................................... 162 Instrument connector and supported
connectors ................................................162 Instrument connector signal assignments 162 Input (IN) signal function details ...............167 BCD mode function details .......................168 Output signals when errors occur .............170
9.2 Example Measurement Timing (Timing Charts) ............................. 171
9.3 Internal Circuitry .......................... 176 Circuit diagrams ........................................176 Electrical specifications .............................177 Connection examples ...............................178
9.4 External I/O Settings .................... 180 Setting the delay time (from judgment
result output to EOM―――
output) and judgment result reset operation ................181
Disabling the trigger input during measurement and setting the trigger input effective edge ...................................182
Setting the E________
OM output method and output time ................................................183
Spot correction ..........................................1035.3 Short Correction ........................... 105
Before performing open correction ...........105 All correction .............................................106 Spot correction ..........................................107
5.4 If Open or Short Correction Fails to Complete Normally ......... 109
5.5 Disabling Open and Short Correction Values ..........................111
5.6 Load Correction (Correcting Values to Match Reference Values) .........................112
Procedures for the load correction ............113 To reset the correction condition settings . 119 When load correction fails to complete
normally .................................................... 119 Disabling load correction ..........................120
5.7 Correcting Measured Values with a User-specified Correction Coefficient (Correlation Correction) .............. 121
6 Saving and Loading Measurement Condition and Correction Value Data 123
6.1 Saving Measurement Conditions and Correction Values (Panel Save Function) .................. 124
6.2 Loading Measurement Conditions and Correction Values (Panel Load Function) ................. 128
6.3 Changing a Panel Name .............. 1296.4 Deleting a Panel ........................... 130
7 Setting the System 1317.1 Setting the Interface (Controlling
the Instrument from a Computer) 1327.2 Checking the Version of the
Instrument ..................................... 1327.3 Testing the System
(Self diagnosis) ............................ 133 Panel test ..................................................133 Panel calibration .......................................134 Testing the screen display status and
LED status ................................................134 ROM/RAM test ..........................................135 Testing EXT I/O input/output signals .........135 Ind.
Appx.
10
9
8
7
6
5
4
13
12
11
Contents
iii
Outputting measured values (switching to BCD mode) *LCR mode only ................184
9.5 External control Q&A ................... 1859.6 Measurement Using a Computer 186
10 Specifications 18710.1 General Specifications ................ 18710.2 Environmental and Safety
Specifications ............................... 19210.3 Accessories and Options ............ 19310.4 Function specifications ............... 19310.5 Interfaces ...................................... 20510.6 Measurement Range and
Accuracy ....................................... 20710.7 About Measurement Times and
Measurement Speed .................... 217
11 Maintenance and Service 221
11.1 Calibration, Inspection, Repair, and Cleaning ................................. 221
Calibrations ...............................................221 Inspection and Repair ...............................221 Replaceable Parts and Operating
Lifetimes ...................................................221 Transporting the instrument ......................222 Cleaning ....................................................222
11.2 Troubleshooting ........................... 223 Before returning for repair .........................223 Initializing (System Reset) ........................228 Performing a full reset (If you are unable
to perform a system reset) ........................22911.3 Error Massage and Error Display 23011.4 Discarding the Instrument ........... 235
Appendix Appx.1Appx. 1 Measurement Param-
eters and Calculation Formula ............................. Appx.1
Appx. 2 Measurement of High Impedance Components . Appx.3
Appx. 3 Measurement of In-cir-cuit Components ............. Appx.4
Appx. 4 Countermeasures Against Incorporation of External Noise .................. Appx.5
Countermeasures against incorporation of noise from the power line .................Appx.5
Countermeasures against noise from the measurement cables .....................Appx.6
Appx. 5 Supplying DC Bias ........... Appx.6 How to supply a DC bias voltage .........Appx.7 How to supply a DC bias current .........Appx.8
Appx. 6 The Residual Charge Protection Function ......... Appx.9
Appx. 7 Series Equivalent Circuit Mode and Parallel Equivalent Circuit Mode .................... Appx.10
Appx. 8 Open Correction and Short Correction .............Appx.11
Appx. 9 Attaching Rack-mounting Hardware to the Instrument ......................................... Appx.12
Appx. 10 Dimensional Diagram .... Appx.14Appx. 11 Initial Settings Table ...... Appx.15Appx. 12 Device Compliance
Statement ....................... Appx.22
Index Ind.1
Appx.
9
8
7
6
5
4
11
10
11Ind.
3
12

Contents
iv

1
Introduction
IntroductionThank you for purchasing the HIOKI IM3536 LCR Meter. To obtain maximum performance from the instrument, please read this manual first, and keep it handy for future reference.
Verifying Package ContentsWhen you receive the instrument, inspect it carefully to ensure that no damage occurred during shipping. In particular, check the accessories, panel switch, button, and connectors. If damage is evident, or if it fails to operate according to the specifications, contact your authorized Hioki distribu-tor or reseller.
Confirm that these contents are provided.IM3536 LCR Meter ×1
Accessories
LCR Application Disc ×1
(Includes Communications Instruction Manual (PDF edition), ex-planation of communications commands, USB driver, and sample programs.)
The latest version can be downloaded from our web site
Instruction manual(This document) ×1
Power Cord ×1
• Measurement cable and fixture are not supplied with the instrument as standard equipment. You should order them separately, according to requirements.See “Options (reference: open and short correction states)” (p. 2).
• The instrument ships from the factory configured as described in”Appx. 11 Initial Settings Table” (p. Appx.15).
Precautions when transporting the instrumentStore the packaging in which the instrument was delivered, as you will need it when transporting the instrument.
10
9
8
7
6
5
4
3
2
1
付録
索引

2
Verifying Package Contents
Options (reference: open and short correction states)The following options are available for the instrument. Contact your authorized Hioki distributor or reseller when ordering.
Probe type (cord length: 1 m) Open state during open correction
Shorted state during short correction
L2000 4-Terminal Probe
Measurable range: DC to 8 MHzMaximum applied voltage: ±42 V peak (AC+DC)Maximum applied current: ±1 A peak (AC+DC)Measurement terminal hole diameter: 0.3 mm to 5 mmAlligator-clip-type measurement cables. These general-purpose dual-electrode clips fit a wide range of conductor thick-nesses.
Width of the measurement sample
Close the tips of the probes and place the probes so that they are as far apart as the width of the measurement sample.
HPOTLPOT
LCUR HCUR
Clamp the probe tips together with the V mark facing up.
9140-10 4-Terminal Probe
Measurable range: DC to 200 kHzMaximum applied voltage: ±42 V peak (AC+DC)Maximum applied current: ±1 A peak (AC+DC)Measurement terminal hole diameter: 0.3 mm to 5 mm
Width of the measurement sample
Close the tips of the probes and place the probes so that they are as far apart as the width of the measurement sample.
Clamp the probes on the short bar.
9500-10 4-Terminal Probe
Measurable range: DC to 200 kHzMaximum applied voltage: DC±40 [42 V peak (Measurement signal + bias volt-age)]Maximum applied current: 1 A peak (Measurement signal + bias voltage)Measurement terminal hole diameter: 0.3 mm to 2 mmRubber-sheathed alligator clip type
Red (High)
Black (Low)
Metal wire
Width of the measurement sampleClamp a short piece of metal wire with the HCUR and HPOT terminals (red) and the LCUR and LPOT termi-nals (black) of the probes so that they are as far apart as the width of the measurement sample.
Red (High)
Black (Low)
Metal wire
Clamp a short piece of metal wire in the following probe terminal order: HCUR, HPOT, LPOT, LCUR.

3
Verifying Package Contents
Probe type (cord length: 1 m) Open state during open correction
Shorted state during short correction
L2001 Pincher Probe*1
Measurable range: DC to 8 MHzMaximum applied voltage: DC±30 VSpace between tip electrodes: 0 mm to approx. 6 mmPincer type
Gradations on open correction fixture
Clamp the tip of the pincers at the open correction fixture gra-dation (using the same value as the length of the measurement sample), taking care to insert the pincers all the way. (For sample 1005, the length is 1.0 mm.)
Close the tip of the pincers.
Test fixture types Open state during open correction
Shorted state during short correction
9261-10 Test Fixture
Measurable range: DC to 8 MHzMaximum applied voltage: DC±40 VMeasurement terminal hole diameter: 0.3 mm to 1.5 mmCord length: 1 m
Connect the 9261-10 and the instrument with the connection cable (do not clamp anything to the fixture).
Insert the short bar all the way into the sample mounting area.
9262 Test Fixture*1
Measurable range: DC to 8 MHzMaximum applied voltage: DC±40 VMeasurable sample dimensions:Lead diameter of φ0.3 mm to φ2 mmLead pitch of 5 mm or moreThis fixture is for measuring lead com-ponents. (less than 10 mΩ residual re-sistance after zero adjustment)
In contact
Turn the knob clockwise to tighten the sample mounting area.
Insert the short bar all the way into the sample mounting area.
*1: Although the test fixture appears to use a four-terminal setup, two terminals provide contact with the sample since HPOT and HCUR as well as LPOT and LCUR are connected inside the fixture and probe. 10
9
8
7
6
5
4
3
2
1
付録
索引

4
Verifying Package Contents
Test fixture types Open state during open correction
Shorted state during short correction
9263 SMD Test Fixture*1
Measurable range: DC to 8 MHzMaximum applied voltage: DC±40 VMeasurable sample dimensions: Test sample width of 1 mm to 10 mmThis fixture is for measuring chip com-ponents. (less than 10 mΩ residual re-sistance after zero adjustment)
Turn the knob counterclockwise to open the high and low electrodes (use the width of the measure-ment sample as the open spac-ing).
Turn the knob clockwise to tighten the high and low electrodes.
9677 SMD Test Fixture*1
Measurable range: DC to 120 MHzMaximum applied voltage: DC±40 VMeasurable sample dimensions: Test sample width of 3.5±0.5 mm or less
Move the knob to open the high and low electrodes (use the width of the measurement sample as the open spacing).
Move the knob to close the high and low electrodes.
9699 SMD Test Fixture*1
ショート
オープン
Measurable range: DC to 120 MHzMaximum applied voltage: ±42 V peak (AC+DC)Measurable sample dimensions: Test sample width of 1 mm to 4 mmTest sample height of 1.5 mm or lessThis fixture is for the lower electrode.
ショート
オープン
Turn both knobs counterclock-wise to loosen them (do not place anything in the sample mounting area).
ショート
オープン
Position the included short bar in the sample mounting area and turn the knobs clockwise to secure the measurement sample in place.
*1: Although the test fixture appears to use a four-terminal setup, two terminals provide contact with the sample since HPOT and HCUR as well as LPOT and LCUR are connected inside the fixture and probe.

5
Verifying Package Contents
Test fixture types Open state during open correction
Shorted state during short correction
IM9100 SMD Test Fixture
Measurable range: DC to 8 MHzMaximum applied voltage: DC±40 VMaximum applied current: 0.15 A rms (±0.15 ADC)Measurable sample dimensions: JIS (EIA): L mm × W mm0402 (01005) : 0.4 mm × 0.2 mm0603 (0201) : 0.6 mm × 0.3 mm1005 (0402) : 1.0 mm × 0.5 mmFor use with SMD components
12
Mount the open correction fix-ture for the 1005 in the test head measurement area with a pair of pincers.
1
2
3
1. Remove the template.2. Mount the short correction
fixture in the test head mea-surement area, passing the guide pins through the holes on the fixture.
3. Push the tip of the tip pin gradually into the short cor-rection fixture.
DC Bias Unit Open state during open correction
Shorted state during short correction
9268-10 DC Bias Voltage Unit
Measurable range: 40 Hz to 8 MHzMaximum applied voltage: DC±40 V
Connect the following items to the 9268-10: • Measurement cables and fixture or probe (in the open correction state)
• Bias application cable • External DC bias power supply (with the 0 V output setting on)
Connect the following items to the 9268-10: • Measurement cables and fixture or probe (in the short correction state)
• Bias application cable • External DC bias power supply (with the 0 V output setting on)
9269-10 DC Bias Current Unit
Measurable range: 40 Hz to 2 MHzMaximum applied current: DC 2 A
Connect the following items to the 9269-10: • Measurement cables and fixture or probe (in the open correction state)
• Bias application cable • External DC bias power supply (setting off)
(Do not connect the bias applica-tion cable.)
Connect the following items to the 9269-10: • Measurement cables and fixture or probe (in the short correction state)
• Bias application cable • External DC bias power supply (setting off)
(Do not connect the bias applica-tion cable.)
Connection cords
9637 RS-232C Cable
9-pin to 9-pin cross type, Cord length: 1.8 m
9151-02 GP-IB Connector Cable
Cord length: 2 m
*1: Although the test fixture appears to use a four-terminal setup, two terminals provide contact with the sample since HPOT and HCUR as well as LPOT and LCUR are connected inside the fixture and probe.
10
9
8
7
6
5
4
3
2
1
付録
索引

6
Measurement process
Measurement processThis section uses AC measurement of a laminated ceramic capacitor as an example to provide an overview of the instrument’s functionality.
Items to be prepared:9263 SMD Test Fixture, Laminated ceramic capacity you want to measure
1 Inspect the instrument before measurement. (p. 33)
2 Connect the power cord to the instrument. (p. 34)
3 Turn on the power. (p. 36)(A 60-minute warm-up period is necessary before performing the correction process de-scribed in Step 9.)
4 Set the date and time. (p. 38)
5 Connect the 9263 SMD test fixture to the measurement terminals.
• Overview of connections: p. 35(The connection method varies with the probes and fixture being used. For more information, see each prod-uct’s user manual.)
• Optional probes and fixtures: p. 2
6 Set the measurement mode to LCR. (Default setting: LCR)
2
3
1
Use the CONTINUOUS setting if you wish to take continuous measurements under multiple sets of conditions. (In LCR mode, you must first set and save the measurement conditions.)See “4 Using Continuous Measurement Mode” (p. 93).
7
Measurement process
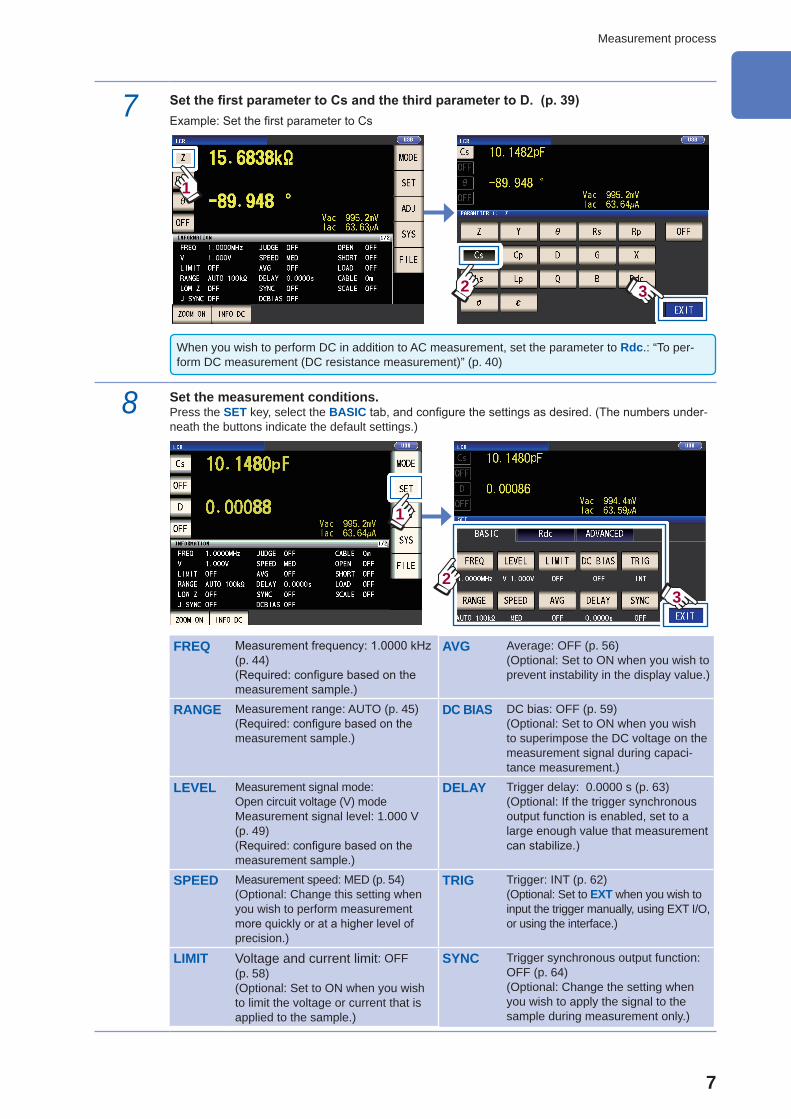
7 Set the first parameter to Cs and the third parameter to D. (p. 39)Example: Set the first parameter to Cs
1
32
When you wish to perform DC in addition to AC measurement, set the parameter to Rdc.: “To per-form DC measurement (DC resistance measurement)” (p. 40)
8 Set the measurement conditions.Press the SET key, select the BASIC tab, and configure the settings as desired. (The numbers under-neath the buttons indicate the default settings.)
1
32
FREQ Measurement frequency: 1.0000 kHz (p. 44) (Required: configure based on the measurement sample.)
AVG Average: OFF (p. 56)(Optional: Set to ON when you wish to prevent instability in the display value.)
RANGE Measurement range: AUTO (p. 45)(Required: configure based on the measurement sample.)
DC BIAS DC bias: OFF (p. 59)(Optional: Set to ON when you wish to superimpose the DC voltage on the measurement signal during capaci-tance measurement.)
LEVEL Measurement signal mode: Open circuit voltage (V) modeMeasurement signal level: 1.000 V (p. 49) (Required: configure based on the measurement sample.)
DELAY Trigger delay: 0.0000 s (p. 63)(Optional: If the trigger synchronous output function is enabled, set to a large enough value that measurement can stabilize.)
SPEED Measurement speed: MED (p. 54)(Optional: Change this setting when you wish to perform measurement more quickly or at a higher level of precision.)
TRIG Trigger: INT (p. 62)(Optional: Set to EXT when you wish to input the trigger manually, using EXT I/O, or using the interface.)
LIMIT Voltage and current limit: OFF (p. 58)(Optional: Set to ON when you wish to limit the voltage or current that is applied to the sample.)
SYNC Trigger synchronous output function: OFF (p. 64)(Optional: Change the setting when you wish to apply the signal to the sample during measurement only.)
10
9
8
7
6
5
4
3
2
1
付録
索引
8
Measurement process
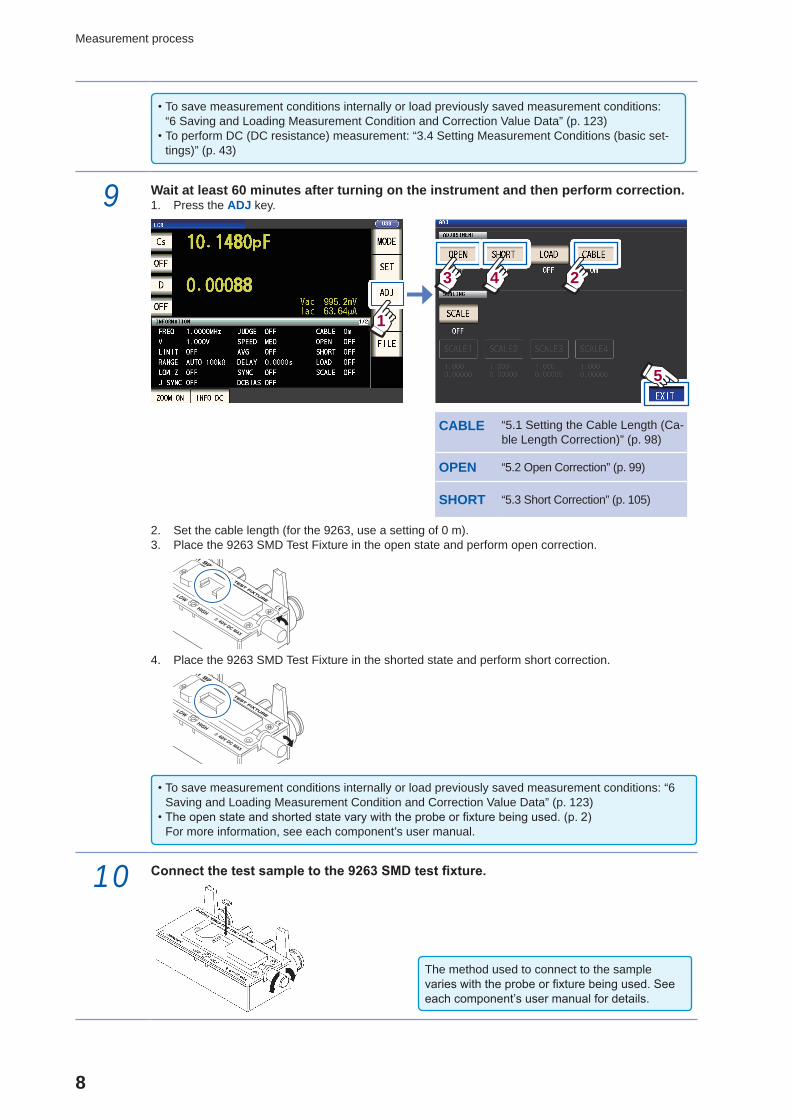
• To save measurement conditions internally or load previously saved measurement conditions: “6 Saving and Loading Measurement Condition and Correction Value Data” (p. 123)
• To perform DC (DC resistance) measurement: “3.4 Setting Measurement Conditions (basic set-tings)” (p. 43)
9 Wait at least 60 minutes after turning on the instrument and then perform correction. 1. Press the ADJ key.
CABLE “5.1 Setting the Cable Length (Ca-ble Length Correction)” (p. 98)
OPEN “5.2 Open Correction” (p. 99)
SHORT “5.3 Short Correction” (p. 105)
1
5
23 4
2. Set the cable length (for the 9263, use a setting of 0 m).3. Place the 9263 SMD Test Fixture in the open state and perform open correction.
4. Place the 9263 SMD Test Fixture in the shorted state and perform short correction.
• To save measurement conditions internally or load previously saved measurement conditions: “6 Saving and Loading Measurement Condition and Correction Value Data” (p. 123)
• The open state and shorted state vary with the probe or fixture being used. (p. 2)For more information, see each component’s user manual.
10 Connect the test sample to the 9263 SMD test fixture.
The method used to connect to the sample varies with the probe or fixture being used. See each component’s user manual for details.

9
Measurement process
11 Check the measurement results. (p. 41)
• To enlarge the measured value display: p. 42 • To change the number of digits used to display measured values: p. 87
• When you want to judge the measurement results:To perform comparator measurement (p. 69), To perform BIN measurement (p. 74)
• When you want to save the measurement results:To save the desired number of measurement data points (p. 86)To save one measurement data point before the save was performed to the USB flash drive in the CSV format (p. 141)
An error message or error display will be shown:
Error massageReference Value: No measured value accuracy guaranteeMemory Full: Memory fullHi Z: Hi Z reject error Error display
See “11.3 Error Massage and Error Display” (p. 230).
The following functionality is also available
Measuring conductivity and dielectric constant p. 67
Measuring at a high level of precision p. 55
Limiting instability of display values p. 56
Setting measurement conditions for each measurement range p. 79
Increasing the measurement precision or measurement speed p. 82
Detecting contact errors during two-terminal measurement p. 84
Detecting poor contact with the sample during four-terminal measurement p. 85
Changing the key tone or judgment tone p. 89
Disabling key operation (key lock function) p. 90
Performing measurement by outputting a signal from an external device to the instrument p. 62, p. 161
Controlling the instrument by sending commands from a computer p. 132
Saving settings data to the USB flash drive p. 153
Loading settings data from the USB flash drive p. 155
10
9
8
7
6
5
4
3
2
1
付録
索引

10
Safety Information
Safety InformationThis instrument is designed to conform to IEC 61010 Safety Standards, and has been thoroughly tested for safety prior to shipment. However, using the instrument in a way not described in this manual may negate the provided safety features.Before using the instrument, be certain to carefully read the following safety notes.
DANGERMishandling during use could result in injury or death, as well as damage to the instrument. Be certain that you understand the instructions and precautions in the manual before use.
WARNINGWith regard to the electricity supply, there are risks of electric shock, heat gen-eration, fire, and arc discharge due to short circuits. If persons unfamiliar with electricity measuring instrument are to use the instrument, another person famil-iar with such instruments must supervise operations.
NotationIn this manual, the risk seriousness and the hazard levels are classified as follows.
DANGER Indicates an imminently hazardous situation that will result in death or serious injury to the operator.
WARNING Indicates a potentially hazardous situation that may result in death or serious injury to the operator.
CAUTION Indicates a potentially hazardous situation that may result in minor or moderate injury to the operator or damage to the instrument or malfunction.
IMPORTANT Indicates information related to the operation of the instrument or maintenance tasks with which the operators must be fully familiar.
Indicates a high voltage hazard.If a particular safety check is not performed or the instrument is mishandled, this may give rise to a hazardous situation; the operator may receive an electric shock, may get burnt or may even be fatally injured.
Indicates the prohibited action.
Indicates the action which must be performed.
* Additional information is presented below.
Bold Names and keys on the screen are indicated in boldface.
Unless otherwise specified, “Windows” represent Windows Vista, Windows 7, Windows 8.
Registered Trademarks • Microsoft and Windows are either registered trademarks or trademarks of Microsoft Corporation in the United States and other countries.
• Microsoft and Windows Vista, Windows 7, Windows 8 are either registered trademarks or trade-marks of Microsoft Corporation in the United States and other countries.
11
Safety Information
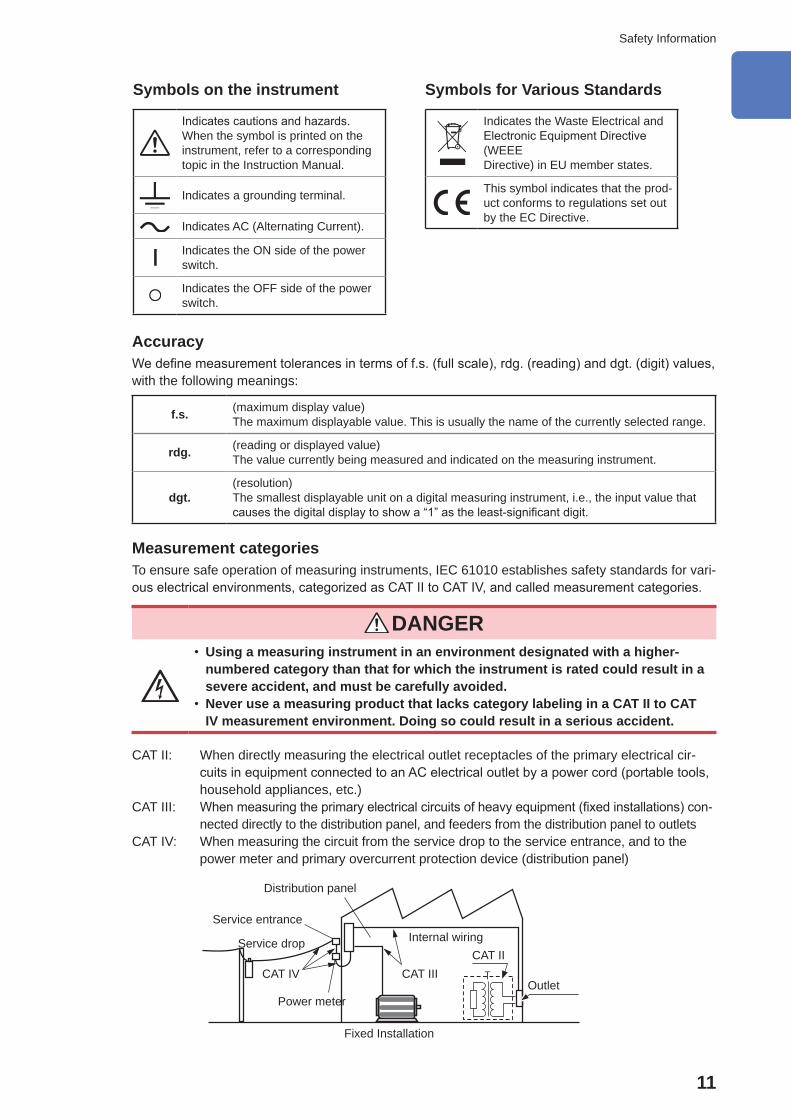
Symbols on the instrument
Indicates cautions and hazards. When the symbol is printed on the instrument, refer to a corresponding topic in the Instruction Manual.
Indicates a grounding terminal.
Indicates AC (Alternating Current).
Indicates the ON side of the power switch.
Indicates the OFF side of the power switch.
Symbols for Various Standards
Indicates the Waste Electrical and Electronic Equipment Directive (WEEEDirective) in EU member states.
This symbol indicates that the prod-uct conforms to regulations set out by the EC Directive.
AccuracyWe define measurement tolerances in terms of f.s. (full scale), rdg. (reading) and dgt. (digit) values, with the following meanings:
f.s. (maximum display value)The maximum displayable value. This is usually the name of the currently selected range.
rdg. (reading or displayed value)The value currently being measured and indicated on the measuring instrument.
dgt.(resolution)The smallest displayable unit on a digital measuring instrument, i.e., the input value that causes the digital display to show a “1” as the least-significant digit.
Measurement categoriesTo ensure safe operation of measuring instruments, IEC 61010 establishes safety standards for vari-ous electrical environments, categorized as CAT II to CAT IV, and called measurement categories.
DANGER • Using a measuring instrument in an environment designated with a higher-numbered category than that for which the instrument is rated could result in a severe accident, and must be carefully avoided.
• Never use a measuring product that lacks category labeling in a CAT II to CAT IV measurement environment. Doing so could result in a serious accident.
CAT II: When directly measuring the electrical outlet receptacles of the primary electrical cir-cuits in equipment connected to an AC electrical outlet by a power cord (portable tools, household appliances, etc.)
CAT III: When measuring the primary electrical circuits of heavy equipment (fixed installations) con-nected directly to the distribution panel, and feeders from the distribution panel to outlets
CAT IV: When measuring the circuit from the service drop to the service entrance, and to the power meter and primary overcurrent protection device (distribution panel)
T Outlet
CAT IIInternal wiring
Distribution panel
Service entrance
Service drop
CAT IV
Power meter
CAT III
Fixed Installation
10
9
8
7
6
5
4
3
2
1
付録
索引

12
Operating Precautions
Operating PrecautionsFollow these precautions to ensure safe operation and to obtain the full benefits of the various functions.
DANGERIf the probes, cords or the instrument is damaged, there is a risk of electric shock. Before using the instrument, perform the following inspection. • Before using the instrument, check that the coating of the probes or cords are neither ripped nor torn and that no metal parts are exposed. Using the instru-ment under such conditions could result in electric shock. Replace the probes or cords with those specified by our company.
• Verify that the instrument operates normally to ensure that no damage occurred during storage or shipping. If you find any damage, contact your authorized Hioki distributor or reseller.
Instrument InstallationInstallation environment
WARNINGInstalling the instrument in inappropriate locations may cause a malfunction of instrument or may give rise to an accident. Avoid the following locations. • Exposed to direct sunlight or high temperature • Exposed to corrosive or combustible gases • Exposed to a strong electromagnetic field or electrostatic charge • Near induction heating systems (such as high-frequency induction heating sys-tems and IH cooking equipment)
• Susceptible to vibration • Exposed to water, oil, chemicals, or solvents • Exposed to high humidity or condensation • Exposed to high quantities of dust particles
Installation instructions
CAUTION • Do not place the device on an unstable table or an inclined place. Dropping or knock-ing down the device can cause injury or damage to the device.
• Leave sufficient space around the instrument when positioning it. Failure to do so may result in damage to the instrument or fire.
• Install with the bottom surface facing downward. • Vents must not be obstructed.
50 mm or more 50 mm or more 10 mm or moreVents
Back
The instrument can be used with the stand (p. 18).It can also be rack-mounted (p. Appx.12).

13
Operating Precautions
Shipping precautionsHioki disclaims responsibility for any direct or indirect damages that may occur when this instrument has been combined with other devices by a systems integrator prior to sale, or when it is resold.
Handling the InstrumentThis instrument may cause interference if used in residential areas. Such use must be avoided un-less the user takes special measures to reduce electromagnetic emissions to prevent interference to the reception of radio and television broadcasts.
DANGERTo avoid electric shock, do not remove the instrument’s case. The internal com-ponents of the instrument carry high voltages and may become very hot during operation.
CAUTION • Note that the instrument may be damaged if the applied voltage or current exceeds the measurement range.
• Do not use excessive force on the touch panel, and do not use sharp objects that could damage the touch screen.
• Do not apply heavy downward pressure with the stand extended. The stand could be damaged.
• If the instrument exhibits abnormal operation or display during use, review the infor-mation in “11.2 Troubleshooting” (p. 223) and “11.3 Error Massage and Error Dis-play” (p. 230) before contacting your dealer or Hioki representative.
• To avoid damage to the instrument, protect it from physical shock when transporting and handling. Be especially careful to avoid physical shock from dropping.
• After use, always turn OFF the power.
Before Turning Power On
WARNING • Before turning the instrument on, make sure the supply voltage matches that indicated on its power connector. Connection to an improper supply voltage may damage the instrument and present an electrical hazard.
• To avoid electrical accidents and to maintain the safety specifications of this instrument, connect the power cord provided only to a 3-contact (two-conductor + ground) outlet.
• Be sure to ground the power cord. Failure to do so will cause the enclosure to have a voltage equal to half the supply voltage, resulting in electric shock.
• To avoid shock and short circuits, turn off all power before connecting probes or cords.
CAUTIONDo not connect the supply voltage improperly. Doing so may destroy the instrument’s internal circuitry.
DC resistance measurement onlyTo suppress noise, the instrument needs to be set to match the frequency of the power source. Before operating, set the instrument to the frequency of your commercial power. If the supply frequency is not set properly, measurements will be unstable.See “Line frequency (DC)” (p. 53).
10
9
8
7
6
5
4
3
2
1
付録
索引
14
Operating Precautions
Handling the cords, fixtures, and probes
WARNINGIf the insulation on a cord melts, the metal conductor may be exposed. Do not use any cord whose metal conductor is exposed. Doing so could result in electric shock, burns, or other hazard.
CAUTION • To avoid breaking the cords or probes, do not bend or pull them. • Avoid stepping on or pinching cords, which could damage the cord insulation. • Keep in mind that, in some cases, conductors to be measured may be hot. • To avoid damage to the instrument, do not short-circuit the measurement terminals and do not input voltage to the measurement terminals.
• For safety reasons, disconnect the power cord when the instrument is not used. • To avoid damaging the power cord, grasp the plug, not the cord, when unplugging it from the power outlet.
• To prevent damage to the BNC connector or junction, be sure to release the locking mechanism, grip the head of the connector (not the cord), and pull it out.
• Put the protective cap back on the connector when not in use. If the protective cap is not properly inserted, dust or other foreign matter may enter the connector and cause damage.
IMPORTANTUse only the specified connection cords. Using a non-specified cable may result in incorrect measurements due to poor connection or other reasons.
Before using a fixture or the like, read the instruction manual supplied with the product tobe used.
Before Using the USB Flash Drive
CAUTION • Do not transport the instrument while a USB flash drive is connected. Damage could result. • Inserting a USB flash drive upside down, backwards or in the wrong direction may damage the USB flash drive and/or the instrument.
• Some USB flash drives are susceptible to static electricity. Exercise care when using such products because static electricity could damage the USB flash drive or cause malfunc-tion of the instrument.
IMPORTANT • USB flash drives have a limited usable lifetime. After long-term use, data reading and writing will fail, at which time the USB flash drives must be replaced.
• When a USB flash drive is accessed, the color of the USB icon changes from blue to red. Do not turn off the power of the instrument while the USB flash drive is being accessed. Also, never remove the USB flash drive from the instrument. Doing so may result in the data in the USB flash drive being lost.
• Hioki cannot recover data from damaged or faulty storage media resulting from abnormalities. We are also unable to provide compensation for such data loss,regardless of the contents or cause of the failure or damage. We recommend making a backup of all important data on a computer or other storage devices..
15
Operating Precautions
With some USB flash drives, the instrument may not start up if power is turned on while the USB flash drive is inserted. In such a case, turn power on first, and then insert the USB flash drive. It is recom-mended to try out operation with a USB flash drive before starting to use it for actual measurements.
Before Connecting EXT I/O
WARNING • The ISO_5V pin of the EXT I/O connector is a 5V power output. Do not apply external power to this pin.
To avoid electric shock or damage to the equipment, always observe the follow-ing precautions when connecting to EXT I/O connectors. • Always turn off the power to the instrument and to any devices to be connected before making connections.
• Be careful to avoid exceeding the ratings of EXT I/O connectors. (p. 178) • During operation, a wire becoming dislocated and contacting another conduc-tive object can be serious hazard. Use screws to secure the external connec-tors.
• Ensure that devices and systems to be connected to the EXT I/O terminals are properly isolated.
CAUTIONTo avoid damage to the instrument, observe the following cautions: • Do not apply voltage or current to the EXT I/O terminals that exceeds their ratings. • Do not short the ISO_5V and ISO_COM EXT I/O connectors.See “Instrument connector signal assignments” (p. 162).
• When driving relays, be sure to install diodes to absorb counter-electromotive force.
Handling the LCR application disc • Exercise care to keep the recorded side of discs free of dirt and scratches. When writing text on a disc’s label, use a pen or marker with a soft tip.
• Keep discs inside a protective case and do not expose to direct sunlight, high temperature, or high humidity.
• Hioki is not liable for any issues your computer system experiences in the course of using this disc.
10
9
8
7
6
5
4
3
2
1
付録
索引

16
Operating Precautions

17
Product Overview and Features
1 Overview
1.1 Product Overview and FeaturesThe HIOKI IM3536 LCR Meter is an impedance measuring instrument which achieves high speed and high accuracy.It can be used in a wide range of applications thanks to its broad range of measurement frequen-cies and its ability to set measurement conditions based on measurement signal levels.
Wide range of measurement condi-tionsMeasurement frequencies: 4 Hz to 8 MHzMeasurement signal levels: 10 mV to 5 V
Capable of high-speed measure-mentUp to 1 ms (typical values)
Continuous measurement modeAllows measurements to be performed con-tinuously using preconfigured measurement conditions. This function enables, for example, making pass/fail judgment with different mea-surement conditions.(Example: Performing C-D measurement with 120 Hz and Rs measurement with 100 kHz in succession)
Various interfaces supportedSupports the most suitable EXT I/O (handler interface) for production lines, USB, GP-IB, RS-232C and LAN.
Comparator function (p. 69)Makes HI/IN/LO judgments based on mea-sured values and two preconfigured param-eters.
BIN function (p. 74)Ranks measured values in up to 10 categories based on 2 preconfigured parameters.
Low impedance can be measured with high degree of accuracyAllows you to configure the instrument to mea-sure low impedance values at a high level of precision. (p. 55)
1 Overview
1
Overview
18
Names and Functions of Parts
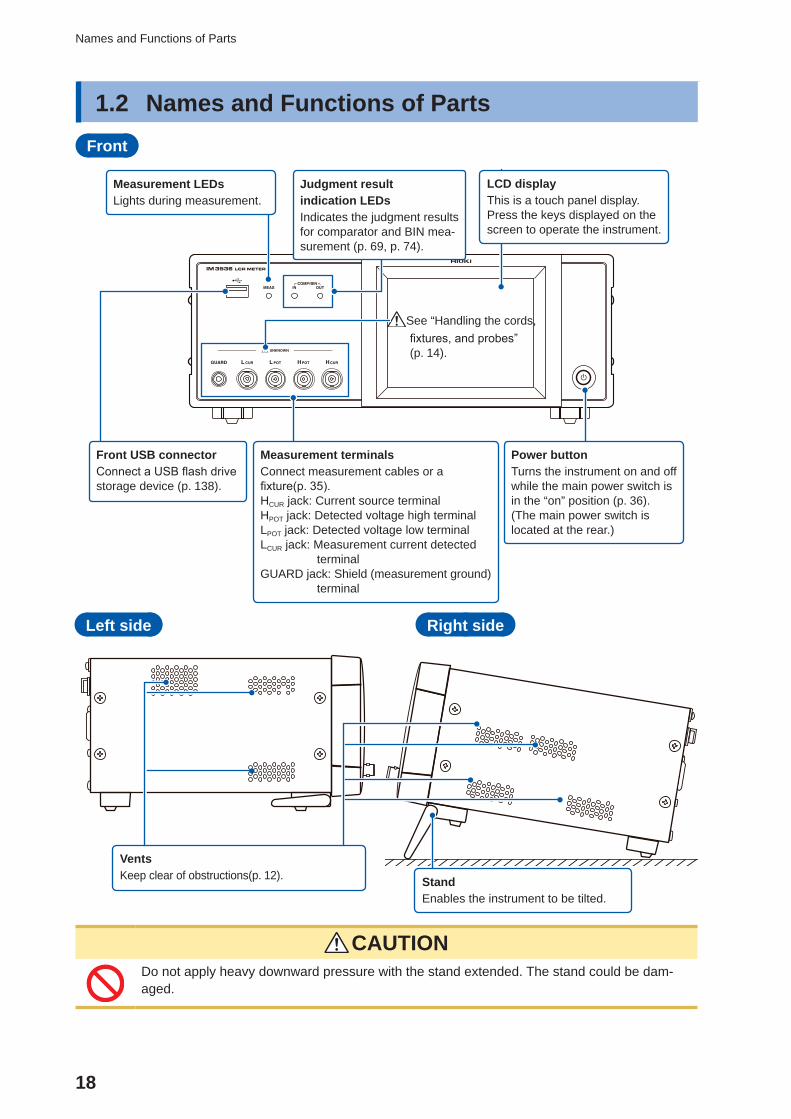
1.2 Names and Functions of PartsFront
LCD displayThis is a touch panel display.Press the keys displayed on the screen to operate the instrument.
Measurement LEDsLights during measurement.
Judgment resultindication LEDsIndicates the judgment results for comparator and BIN mea-surement (p. 69, p. 74).
Measurement terminalsConnect measurement cables or a fixture(p. 35).HCUR jack: Current source terminalHPOT jack: Detected voltage high terminalLPOT jack: Detected voltage low terminalLCUR jack: Measurement current detected
terminalGUARD jack: Shield (measurement ground)
terminal
Power buttonTurns the instrument on and off while the main power switch is in the “on” position (p. 36). (The main power switch is located at the rear.)
Front USB connectorConnect a USB flash drive storage device (p. 138).
See “Handling the cords, fixtures, and probes” (p. 14).
Left side Right side
StandEnables the instrument to be tilted.
VentsKeep clear of obstructions(p. 12).
CAUTIONDo not apply heavy downward pressure with the stand extended. The stand could be dam-aged.

19
Names and Functions of Parts
Rear
Main power switchTurns the power on and off (p. 36).
Rear USB connectorConnect a USB cable. Connect to a computer to control the instru-ment with communication com-mands.(Bundled LCR Application Disc - Communications Manual)
VentKeep clear of ob-structions.Keep foreign objects and other material away.
GP-IB connectorAllows you to connect the instrument to exter-nal devices using a GP-IB cable.(Bundled LCR Application Disc - Communica-tions Manual)
RS-232C connectorAllows you to connect the instrument to external devices using a RS-232C cable.(Bundled LCR Application Disc - Communications Manual)
MAC address of the LAN(Bundled LCR Application Disc - Communications Manual)
Manufacturer’s serial numberShows the serial number.Do not remove this label, as it is requiredfor product support.
LAN connectorAllows you to connect the instrument to external devices using a LAN cable.(Bundled LCR Application Disc - Communications Manual)
EXT I/O connectorAllows you to control the start of measurement and capture judgment results by connecting a PLC or I/O board.(p. 162)
See “Before Connecting EXT I/O” (p. 15).
Power inletConnect the sup-plied power cord (p. 34).
See “Before Turning Power On” (p. 13), and “Handling the cords, fixtures, and probes” (p. 14).
Bottom
This instrument can be rack mounted.
See “Appx. 9 Attaching Rack-mounting Hardware to the Instrument” (p. Appx.12).
1
Overview

20
Screen Layout and Operation
1.3 Screen Layout and OperationThis instrument allows you to use a touch panel to set and change all measurement conditions.Gently touch a key on the screen to select the item or numerical value set for that key.A selected key turns black.
This manual refers to the act of lightly placing your finger on the screen as “touching” it, and a fin-
ger mark is used on the screen to represent this action.
CAUTIONDo not use excessive force on the touch panel, and do not use sharp objects that could damage the touch screen.
Screen transition diagram
Continuous measurement mode
Measurement screen
SET screen
MODE screen
FILE screenReturn to the Measurement screen with the EXIT key.
This screen is used to view continuous measurement results (p. 22).
This screen is used to select the measurement mode (p. 24).
This screen is used to config-ure continuous measurement (p. 25).
This screen is used to check and manipulate files on the USB flash drive (p. 29).

21
Screen Layout and Operation
LCR mode
SET screen
MODE screen
ADJ screen
SYS screen
FILE screen
Return to the Measurement screen with the EXIT key.
Measurement screen
This screen is used to select the mea-surement mode (p. 24).
This screen is used to configure detailed settings such as measurement condi-tions (p. 25).
This screen is used to configure cor-rection functionality (p. 27).
This screen is used to configure the instrument’s inter-faces, to set the time and date, and to check the system (p. 28).
This screen is used to check and manipu-late files on the USB flash drive (p. 29).
This screen is used to view measured values and measurement condition set-tings information. (p. 22,p. 26)
1
Overview
22
Screen Layout and Operation
Viewing measured values (Measurement screen)
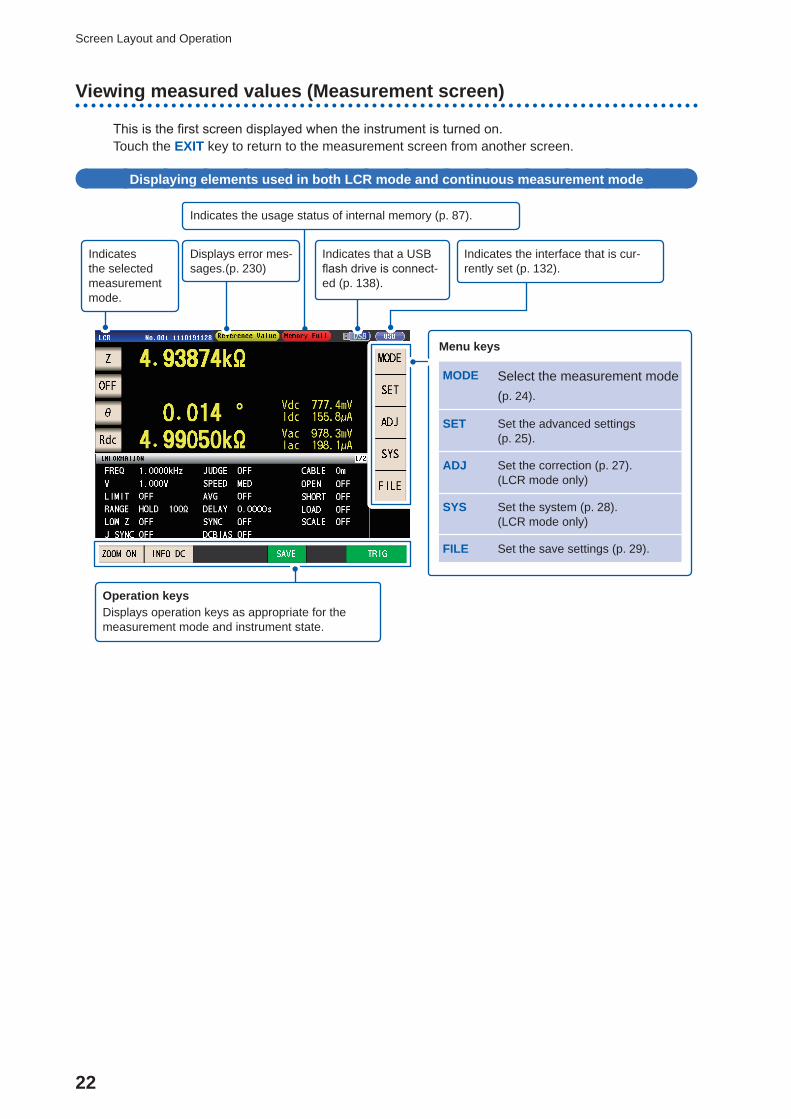
This is the first screen displayed when the instrument is turned on. Touch the EXIT key to return to the measurement screen from another screen.
Displaying elements used in both LCR mode and continuous measurement mode
Indicates the usage status of internal memory (p. 87).
Menu keys
MODE Select the measurement mode (p. 24).
SET Set the advanced settings (p. 25).
ADJ Set the correction (p. 27).(LCR mode only)
SYS Set the system (p. 28).(LCR mode only)
FILE Set the save settings (p. 29).
Displays error mes-sages.(p. 230)
Indicates the selected measurement mode.
Indicates the interface that is cur-rently set (p. 132).
Operation keysDisplays operation keys as appropriate for the measurement mode and instrument state.
Indicates that a USB flash drive is connect-ed (p. 138).

23
Screen Layout and Operation
Measurement screen in LCR mode
Monitor valuesVac, Vdc: Voltage between the sample terminalsIac, Idc: Current passing through the sample
Displays measurement condition settings informa-tion. (p. 26)
Displays measurement condition settings informa-tion.
Indicates the name of the loaded panel (p. 128).
Parameter keysSets which param-eters to display on the measurement screen (p. 39).
Measured values*Displays measured values for various parameters.
Enlarges the display of mea-sured values and comparator judgment results.(p. 42)
Switches measurement condition set-tings information (p. 26).
Saves the measurement data (p. 143).
When the external trigger is selected, activates the trigger manually.(p. 63)
*How to view measured values: See “3.2 Viewing Measured Values” (p. 41).
Measurement screen in continuous measurement mode
Panel No. Measured value* Judgment result*
Scrolls the screen.Displays a list of the panels being used to perform continuous mea-surement.
Saves the measurement data (p. 143).
Starts continuous mea-surement (p. 94).
*How to view measured value and judgment result: See “4.3 Checking Continuous Measurement Results” (p. 94).
1
Overview

24
Screen Layout and Operation
Select the measurement mode (MODE screen)
This screen is used to select the measurement mode.
1 Touch the MODE key. 2 Select the measurement mode.
Displays the measurement screen for the selected mode.
LCR LCR mode (p. 39)
CONTINUOUS Continuous measurement mode (p. 93)
After changing the measurement mode, check all settings (including correction) before performing measure-ment.(Correction values will be deleted, so you will need to repeat the correction process.)

25
Screen Layout and Operation
Setting detailed settings such as measurement conditions (SET screen)
This screen is for configuring the measurement conditions you want to change and other advanced settings.Select the measurement mode (p. 24) before configuring the advanced settings.
(Example screen: LCR mode)
For more information about the continuous measurement (CONTINUOUS) mode screen, see “4 Using Continuous Measurement Mode” (p. 93)
1 Touch the SET key.
2 Touch a tab.
BASIC Basic setting
Rdc DC resistance measurement setting (shown during LCR mode operation only)
ADVANCED Application settings
3 Touch the key for the parameter you wish to set.
The settings screen for the parameter will be displayed.
4 Configure settings for LCR mode and continuous measurement mode.See “3 Performing Measurements in LCR Mode” (p. 39), and “4 Using Con-tinuous Measurement Mode” (p. 93).
1
Overview

26
Screen Layout and Operation
Checking measurement condition settings information
Touching the INFO key switches the dis-played information. (The INFO key display will vary depending on what type of information is being dis-played.)
INFO ACInformation related to AC measurement is displayed.
INFO DCInformation related to DC measurement is displayed.
INFO COMP(When comparator function has been set)Displays information about comparator measurement judg-ment standards.
INFO BIN(When BIN function has been set)Displays information about BIN measurement judgment standards.
You can check settings information on the Mea-surement screen during LCR mode operation.
Current measurement conditions(This information is not shown when using the zoom display (p. 42)).
Touch again to display information for BIN 6 to BIN 10.(When display information is for BIN 6 to BIN 10, this key is INFO AC key.)
27
Screen Layout and Operation
The following information can be displayed:
Display Description Remarks
FREQ Measurement frequency
For AC and DC
RANGE Measurement range
LOW Z Low Z high accuracy mode*1
J SYNC JUDGE synchronization setting for the measurement range
SPEED Measurement speed
AVG Average
V Measurement signal level AC: SettingDC: Fixed to 1.00 V
DELAY Trigger delay
Used for both AC and DC.(Displayed for INFO AC only)
SYNC Trigger synchronous output
JUDGE Measurement result judgment
OPEN Open correction
SHORT Short correction
LOAD Load correction
CABLE Cable correction
SCALE Scale correction (Correlation Correction)
LIMIT LimitAC only
DC BIAS DC bias
L FREQ Line frequency
DC onlyDCR OFFSET DC adjustment value acquisition time*2
DC DELAY DC delay
ADJ DELAY Adjustment delay
*1: When set to ON, the display will show ON* if set to a measurement range or measurement frequency for which the output resistance will be 100 Ω.(See “Low Z High Accuracy Mode” (p. 55))
*2: The acquisition time will not be displayed if DC adjustment is ON. When DC adjustment is OFF, the display will show RESERVED after DC offset acquisition, and the acquisition time will be displayed once acquisition is complete.
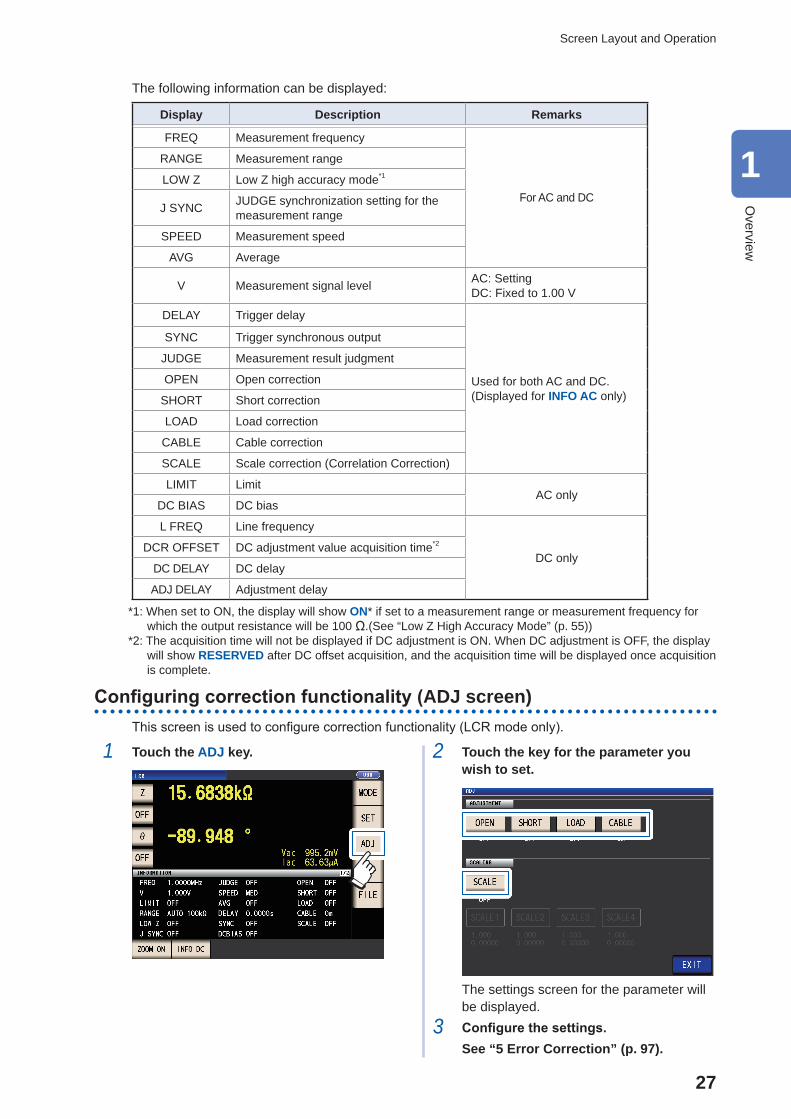
Configuring correction functionality (ADJ screen)This screen is used to configure correction functionality (LCR mode only).
1 Touch the ADJ key. 2 Touch the key for the parameter you wish to set.
The settings screen for the parameter will be displayed.
3 Configure the settings.See “5 Error Correction” (p. 97).
1
Overview

28
Screen Layout and Operation
Configuring the instrument’s interfaces, setting the time and date, and checking the system (SYS screen)
This screen is used to configure the instrument’s interfaces, to set the time and date, and to check the system. (LCR mode only)
1 Touch the SYS key.
2 Touch a tab.
I/F Configure interface settings
INFO Check the version and other system information
TEST Check the system
CLOCK Set the time
3 Touch the key for the parameter you wish to set.
The settings screen for the parameter will be displayed.
4 Check the settings and version number or perform a test measurement.See “7 Setting the System” (p. 131).

29
Screen Layout and Operation
Displaying and manipulating files on the USB flash drive (FILE screen)
This screen is used to display files saved on the USB flash drive and to configure and edit file-relat-ed settings. It is displayed after the USB flash drive is inserted into the instrument’s receptacle.
1 Touch the FILE key. 2 Touch a tab.
LIST • Display files • Load, save, or delete (initialize) files
SET Configure file-saving operation
3 Configure file-saving settings, display files, and manipulate files. See “8 Using USB Flash Drive (Sav-ing and Loading Data)” (p. 137).
1
Overview

30
Screen Layout and Operation

31
Preparation Flowchart
2 Measurement Preparations2.1 Preparation Flowchart
Before preparing for measurement, be sure to read “Operating Precautions” (p. 12).Refer to “Appx. 9 Attaching Rack-mounting Hardware to the Instrument” (p. Appx.12) for rack mount-ing.
(1) Installing the Instrument (p. 12)
(2) Connecting the Power Cord (p. 34)
(3) Connect measurement cables, optional Hioki probes or test fixture to the measurement connectors (p. 35)
Check that the instrument’s power switch is turned off.
(4) Connect the external interface (as needed)
For more information about making RS-232C, GP-IB, USB, and LAN connections, see the Com-munications Instruction Manual on the bundled LCR Application Disc.
External interface
RS-232C
GP-IB
USB
LAN
(5) Turning Power On (p. 36)
2 Measurement Preparations
2
Measurem
ent Preparations

32
Preparation Flowchart
(6) Make instrument settings
• First, set the time and date (p. 38). • When measuring DC resistance, be sure to set the line frequency before performing measurement (p. 53).
After allowing the instrument to warm up for at least 60 minutes, perform open correction and short correction and connect the instrument to the sample (p. 36).
33
Pre-Operation Inspection
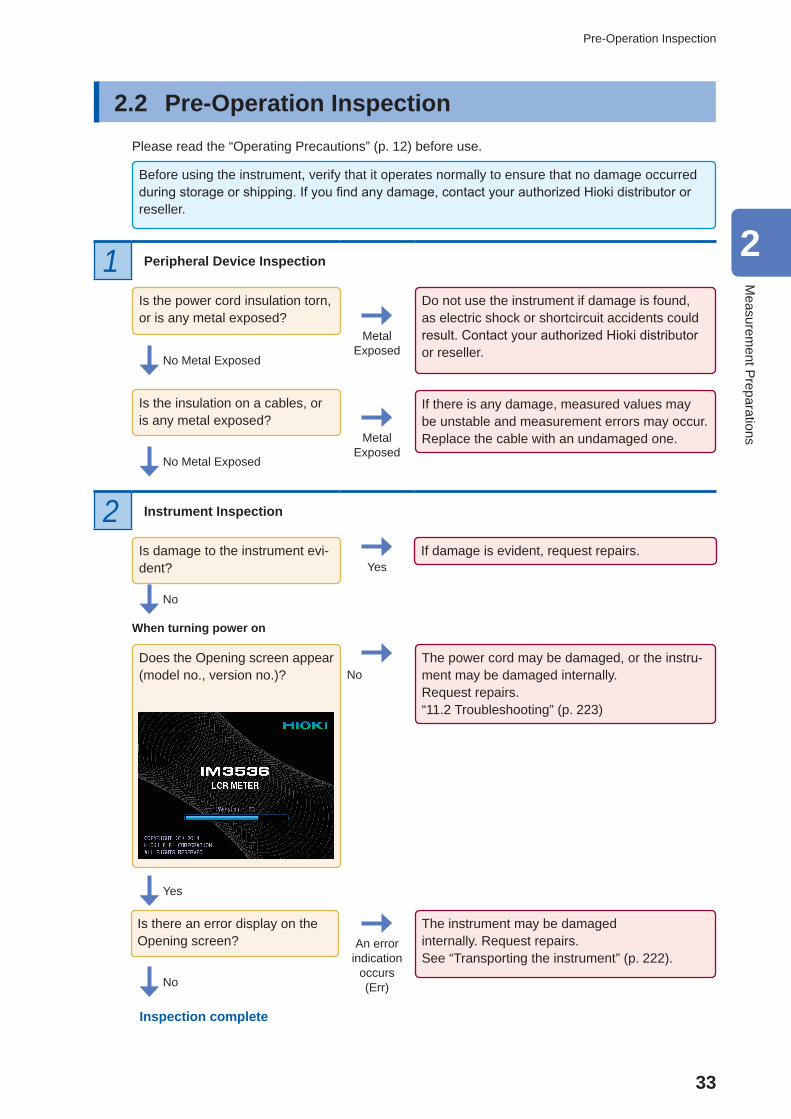
2.2 Pre-Operation InspectionPlease read the “Operating Precautions” (p. 12) before use.
Before using the instrument, verify that it operates normally to ensure that no damage occurred during storage or shipping. If you find any damage, contact your authorized Hioki distributor or reseller.
1 Peripheral Device Inspection
Is the power cord insulation torn, or is any metal exposed?
No Metal Exposed
Metal Exposed
Do not use the instrument if damage is found, as electric shock or shortcircuit accidents could result. Contact your authorized Hioki distributor or reseller.
Is the insulation on a cables, or is any metal exposed?
No Metal Exposed
Metal Exposed
If there is any damage, measured values may be unstable and measurement errors may occur. Replace the cable with an undamaged one.
2 Instrument Inspection
Is damage to the instrument evi-dent? Yes
If damage is evident, request repairs.
No
When turning power on
Does the Opening screen appear (model no., version no.)? No
The power cord may be damaged, or the instru-ment may be damaged internally.Request repairs.“11.2 Troubleshooting” (p. 223)
Yes
Is there an error display on the Opening screen?
No
An error indication
occurs (Err)
The instrument may be damagedinternally. Request repairs.See “Transporting the instrument” (p. 222).
Inspection complete
2
Measurem
ent Preparations

34
Connecting the Power Cord
2.3 Connecting the Power CordBe sure to read the “Before Turning Power On” (p. 13), and “Handling the cords, fixtures, and probes” (p. 14) before connecting the power cord.Connect the power cord to the power inlet on the instrument, and plug it into an outlet.
1 Check that the instrument’s power is turned off.
2 Connect a power cord that matches the line voltage to the power inlet on the instrument. (100 V AC to 240 V AC)
Rear
Power inlet
3 Plug the other end of the power cord into an outlet.
Turn off the power before disconnecting the power cord.

35
Connecting the Measurement Cables, Probes, or Fixture
2.4 Connecting the Measurement Cables, Probes, or Fixture
Be sure to read the “Handling the cords, fixtures, and probes” (p. 14) before connecting mea-surement cables, probes or test fixture.Connect your measurement cables, optional Hioki probes or test fixture to the measurement termi-nals. Refer to “Options (reference: open and short correction states)” (p. 2) for details. See the instructions provided with the fixture for operating details.
Example: Hioki optional test fixture
Connect directly to the measurement jacks with the label side up, and affix with the le-vers on the left and right.
Example: Hioki optional Model 9140-10
Connect the red plugs to the HCUR and HPOT jacks, and the black plugs to the LCUR and LPOT jacks. Black
Red
Red
Black
Example: Hioki optional Model 9500-10
Connect the HCUR, HPOT, LCUR, and LPOT BNC plugs to the corresponding terminals on the instru-ment.
Points to pay attention to when making your own probe • Use 50 Ω coaxial cable for the measurement cable. • When it ships from the factory, the instrument has been adjusted for the length of its cable. Since use of a cable with a different capacitance value between the coaxial cable’s core wire and the shielding will introduce a measurement error, use a cable whose capacitance value is as close as possible to that used when adjusting the instrument prior to its shipment (1 m: 111 pF/cable; 2 m: 215 pF/cable; 4 m: 424 pF/cable).
• Make the portion of the core wire that is exposed as short as possible. • Connect the HCUR, LCUR, HPOT, and LPOT shield pairs at the measurement sample side.(Ensure that a shield is not connected to a core wire.)
• In general, Hioki optional parts (p. 2) should be used for measurement cables and fixtures. If you use a probe yourself, it may not be able to satisfy the specifications of this instrument.
• If all four terminals are disconnected, a meaningless number may be displayed on the unit.
Measurement Terminal Configuration
Fixture
Normal mode
2
Measurem
ent Preparations

36
Turning the Power On and Off
2.5 Turning the Power On and OffBefore turning on the instrument, be sure to read “Before Turning Power On” (p. 13).
Once you have connected measurement cables or an optional Hioki probe or test fixture, turn on the instrument’s main power switch. Once the main power switch has been turned on, the instru-ment can be turned on and off using the power button on the front panel.
This feature is convenient when embedding the instrument in an automated tester or on a produc-tion line. (If the main power switch is turned off in the suspended state, the instrument will power on in the suspended state when the main power switch is next turned on.)
Rear FrontMain power switchPower button

37
Turning the Power On and Off
Turning main power on
Place the main power switch in the “on” (I).
The power button’s green indicator will light up.
Turning main power offPlace the main power switch in the “off” ( ).
The power button’s indicator will turn off.
• When the power supply is interrupted by a power failure or the like, the instrument recovers in the measurement mode used before the power failure.
• Instrument settings will be retained (backed up) even if the main power switch is turned off.
Placing the instrument in the suspended state
ON the main power in the state, hold down the front Standby Key 2 seconds approxi-mately.
2 seconds
The power button’s red indicator will light up.
What is the suspended state?The instrument is turned off in the suspended state. (Only the circuit needed to light up the power button’s indicator will operate.)
To cancel the suspended state
The instrument is in suspended state, press the power button on the front.
Red indicator is lit up
The power button’s green indicator will light up.
To perform measurements at the level of accuracy indicated in the instrument’s specifications, allow it to warm up for at least 60 minutes after turning on the main power switch or canceling the sus-pended state.
2
Measurem
ent Preparations

38
Setting the Date and Time
2.6 Setting the Date and TimeSet the instrument’s date and time. Data is recorded and managed based on the set date and time.
1 Press the SYS key.
2 Touch the CLOCK tab, and set the date and time with the key.(Year-Month-Day Hour-Minute-Second)
1
2
Settable range :00:00:00, January 1, 2000, to23:59:59, December 31, 2099
3 Press the SET key to accept the setting.
4 Press the EXIT key.The measurement screen will be displayed.

39
Setting Display Parameters
3 Performing Measurements in LCR Mode
The LCR mode allows you to measure the impedance, phase angle, and other items by applying any frequency or level (effective value) signal to the element you want to measure. This function is suitable for evaluating the passive element of a capacitor, coil, or the like.First, set the measurement mode to LCR mode (p. 24).
3.1 Setting Display ParametersYou can select up to 4 of the 16 measurement parameters to display on the measurement screen. These parameters are set on the measurement screen.<Example> No. 1 parameter: Cs, No. 3 parameter: D (See "Parameters" (p. 40).)
1 Touch the No. 1 parameter key.
2 Touch the Cs key and then the EXIT key to accept the settings.
12
3 Touch the No. 3 parameter key.
4 Touch the D key and then the EXIT key to accept the setting.
12
Cs and D are set as the parameters.
If OFF is selected in the parameter setting, a measurement value is not displayed.
3 Performing Measurements in LCR Mode
3
Performing M
easurements in LC
R M
ode

40
Setting Display Parameters
Parameters
The following parameters are available:
Parameters Description Parameters Description
Z Impedance (Ω) Cs Capacitance (F) (Equivalent series capacitance)
Y Admittance (S) Cp Capacitance (F) (Equivalent parallel capacitance)
θ Impedance phase angle (°)*1 Q Q-factor
Rs Effective resistance= ESR (Ω) (Equivalent series resistance) D Loss factor= tanδ
Rp Effective resistance (Ω) (Equivalent parallel resistance) Rdc DC resistance (Ω)
X Reactance (Ω) σ Conductivity (See p. 67.)*2
G Conductance (S) ε Permittivity (See p. 67.)*2
B Susceptance (S) OFF No display
Ls Inductance (H)(Equivalent series inductance)
Lp Inductance (H)(Equivalent parallel inductance)
• Parameters other than Rdc are measured using an AC signal (AC measurement). • Rdc measures DC resistance (DC measurement). • For more information about series equivalent circuit mode and parallel equivalent circuit mode, see p. Appx.10.
*1: The phase angle θ is shown based on the impedance Z.*2: The following message will be displayed when you select either σ or ε as a parameter: “Please set the
area and length of DUT.” Touch the EXIT key to clear the message.
To perform DC measurement (DC resistance measurement)
When Rdc is set as a parameter, you can measure the DC resistance Rdc.For more information about measurement condition settings, see "3.4 Setting Measurement Condi-tions (basic settings)" (p. 43).When Rdc is set as a parameter along with other parameters, DC resistance is measured (DC measurement) after other parameters are measured using an AC signal (AC measurement). DC measurement is performed automatically using the following series of operations:
Example: When the number of average iterations is 1
Change in settings • Change from AC measurement to DC measurement
• Change in range
Adjustment delay(default value: 0.0030 sec.)(See shaded area below.)
1 OffsetMeasurement
DC delay(default value: 0 sec.)(See shaded value below.)
2 DC resistance measurement
Measurement complete3 (Measured value output)
1 The DC resistance is measured after setting the generated voltage to 0 V, and the result is used as the offset value. (See "DC adjustment (reducing measurement error) (DC)" (p. 60).)
2 The DC resistance is measured after outputting 1.0 V.
3 The measurement error is reduced using the offset value, and the Rdc measured value is output.
• When the sample is a capacitor, it may not be possible to perform DC resistance measurement normally. • The time required until the DC signal level stabilizes differs depending on the test sample to be measured. To facilitate more accurate measurement, observe the measurement waveform in advance and set delay times (adjustment delay and DC delay) to allow the DC signal level to stabilize adequately. (See "Mea-surement and data acquisition timing" (p. 65).)
41
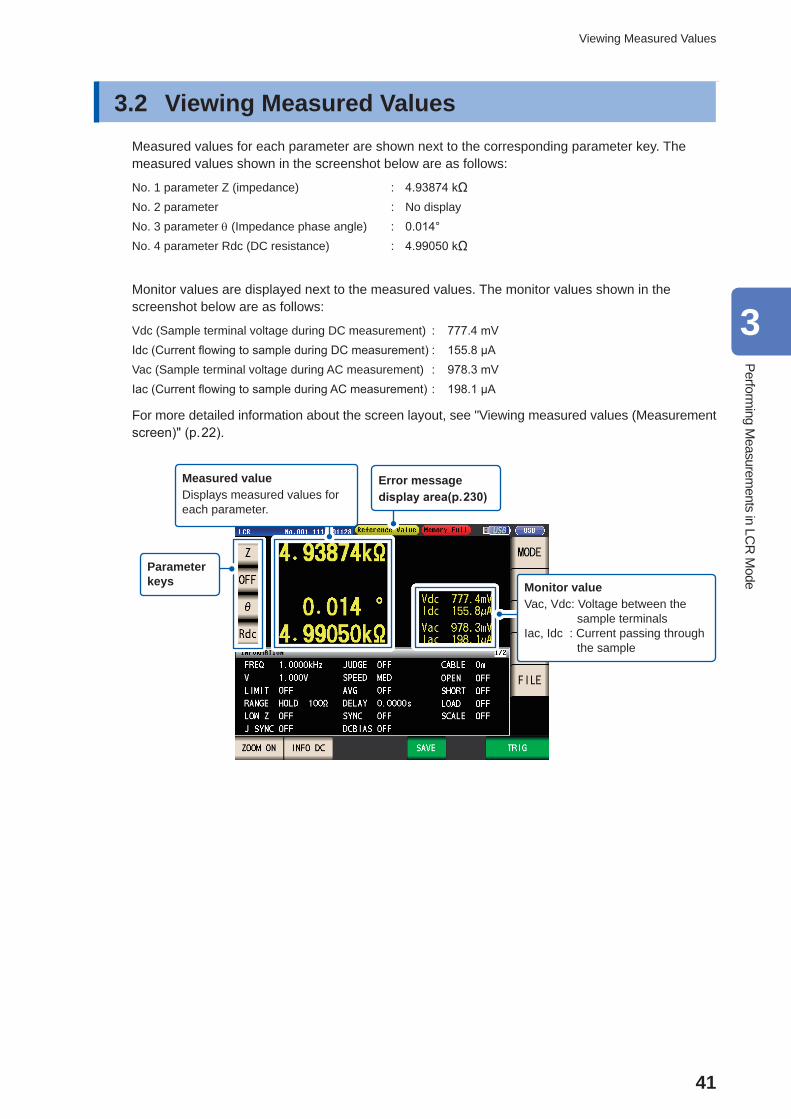
Viewing Measured Values
3.2 Viewing Measured ValuesMeasured values for each parameter are shown next to the corresponding parameter key. The measured values shown in the screenshot below are as follows:
No. 1 parameter Z (impedance) : 4.93874 kΩNo. 2 parameter : No displayNo. 3 parameter θ (Impedance phase angle) : 0.014°No. 4 parameter Rdc (DC resistance) : 4.99050 kΩ
Monitor values are displayed next to the measured values. The monitor values shown in the screenshot below are as follows:
Vdc (Sample terminal voltage during DC measurement) : 777.4 mVIdc (Current flowing to sample during DC measurement) : 155.8 µAVac (Sample terminal voltage during AC measurement) : 978.3 mVIac (Current flowing to sample during AC measurement) : 198.1 µA
For more detailed information about the screen layout, see "Viewing measured values (Measurement screen)" (p. 22).
Monitor valueVac, Vdc: Voltage between the
sample terminalsIac, Idc : Current passing through
the sample
Parameter keys
Measured valueDisplays measured values for each parameter.
Error message display area(p. 230)
3
Performing M
easurements in LC
R M
ode
42
Enlarging Display of Measurement Values
3.3 Enlarging Display of Measurement ValuesThe measurement values and comparator judgment results can be displayed in enlarged form.This functionality provides a convenient way to make measured values easier to view.
Touch the ZOOM ON key.
Magnification Display Screen
Normal measurementTo cancel the zoom display:
Touch the ZOOM OFF key.
Comparator measurement BIN measurement
• Indicates the position of the measurement value relative to the comparator thresholds with a bar.
• The bars will not be displayed unless both upper and lower limit values have been set.
If the instrument is turned off while using the zoom display, the zoom display will remain activated when the instrument is next turned on.

43
Setting Measurement Conditions (basic settings)
3.4 Setting Measurement Conditions (basic set-tings)
(There are two types of measurement: AC measurement and DC measurement (p. 40).The measurement conditions set for AC measurement and DC measurement differ. Required: Be sure to set.Optional: Change setting as necessary.
Setting
During AC measurement
(When the parameter is other than Rdc)
During DC measurement
(When the parameter is other than Rdc)
Ref. Overview
Measurement frequency Required - p. 44
Configure based on the mea-surement sample.Measurement range Required Required p. 45
Measurement signal level Required - p. 49
Line frequency - Required p. 53 Set to the power supply’s fre-quency.
Measurement speed Optional Optional p. 54
When you wish to perform mea-surement more quickly: FASTWhen you wish to perform mea-surement at a higher level of precision: SLOW, or SLOW2
Low Z high accuracy mode
Optional(default value: OFF)
Optional(default value: OFF) p. 55
To perform high-precision mea-surement, set to ON.To measure at high speed: OFF
Average Optional(default value: OFF)
Optional(default value: OFF) p. 56 To limit variability of displayed
values, set to ON.
Limit Optional(default value: OFF) - p. 58
To limit the voltage or current that is applied to the sample, set to ON.
DC bias Optional(default value: OFF) - p. 59
To superimpose a DC voltage on the measurement signal during measurement, set to ON.
DC adjust - Optional(default value: OFF) p. 60
To reduce measurement error: ONTo measure at high speed: OFF
Trigger Synchronous Output
Trigger Synchronous delay*
Optional(default value: OFF, default value: 0.0010 s)
p. 64
To apply the signal during mea-surement only, set to ON.
Optional (default value: 0.0010 s)
Set to a sufficiently large value when you wish to stabilize mea-surement.
DC delay* - Optional(default value: 0 s) p. 61
Adjustment delay* - Optional(default value: 0.0030 s) p. 62
Trigger Optional (Default setting: INT)Measurement is repeated automatically. p. 62
To input signals and commands from an external source, set to EXT.
Trigger delay* Optional (default value: 0 s) p. 63If the trigger function is enabled, set to a large enough value that measurement can stabilize.
*Delay time (For more information about delay timing, see "Measurement and data acquisition timing" (p. 65).
3
Performing M
easurements in LC
R M
ode
44
Setting Measurement Conditions (basic settings)
Refer to the “AC,” “DC,” “AC/DC,” and “Common” notation next to settings.
(AC) Set when performing AC measurement.
(DC) Set when performing DC measurement.
(AC/DC)
• Set when performing AC or DC measurement.Set on the BASIC tab screen for AC measurement and on the [Rdc] tab screen for DC measurement. (This explanation uses the [Basic] screen to explain the setting method, which is the same for both.)
• AC measurement settings do not apply to DC measurement. • DC measurement settings do not apply to AC measurement.
(Common) The setting applies to both AC and DC measurement and is set on the [Basic] tab screen.
Required settings
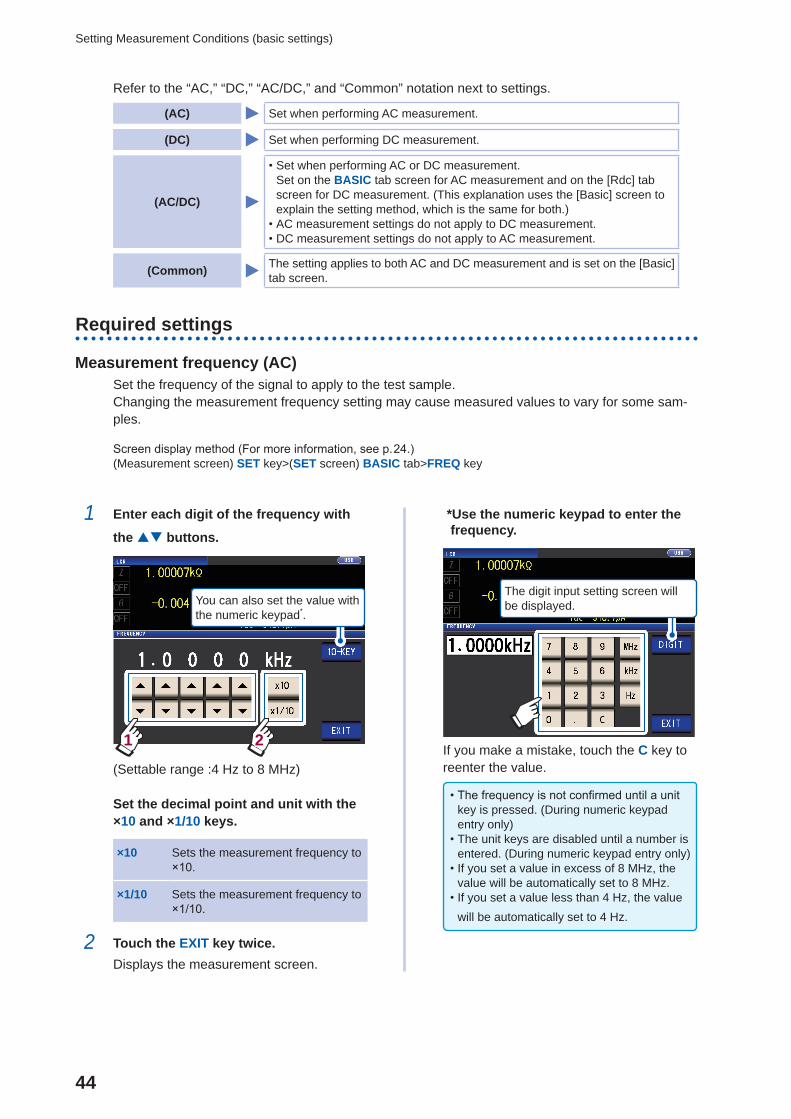
Measurement frequency (AC)Set the frequency of the signal to apply to the test sample.Changing the measurement frequency setting may cause measured values to vary for some sam-ples.
Screen display method (For more information, see p. 24.)(Measurement screen) SET key>(SET screen) BASIC tab>FREQ key
1 Enter each digit of the frequency with
the buttons.
You can also set the value with the numeric keypad*.
1 2
(Settable range :4 Hz to 8 MHz)
Set the decimal point and unit with the ×10 and ×1/10 keys.
×10 Sets the measurement frequency to ×10.
×1/10 Sets the measurement frequency to ×1/10.
2 Touch the EXIT key twice.Displays the measurement screen.
*Use the numeric keypad to enter the frequency.
The digit input setting screen will be displayed.
If you make a mistake, touch the C key to reenter the value.
• The frequency is not confirmed until a unit key is pressed. (During numeric keypad entry only)
• The unit keys are disabled until a number is entered. (During numeric keypad entry only)
• If you set a value in excess of 8 MHz, the value will be automatically set to 8 MHz.
• If you set a value less than 4 Hz, the value will be automatically set to 4 Hz.

45
Setting Measurement Conditions (basic settings)
Measurement range (AC/DC)There are the following three methods for setting the measurement range.
AUTO (p. 46)The most suitable test range is set automatically.(This setting is useful when measuring a sample whose impedance varies great-ly with measurement frequency or when measuring an unknown sample.)
HOLD (p. 47) The measurement range is fixed. The range is set manually.(High-speed measurement is possible.)
JUDGE SYNC(JUDGE synchroni-
zation)(p. 48)
The optimal range is set automatically based on the comparator or BIN mea-surement judgment standard.(This setting is useful when measuring a sample whose impedance varies great-ly with measurement frequency.)
• Ranges consist of impedance values. Consequently, values for measurement parameters other than im-pedance are calculated based on the measured |Z| and θ values.See "Appx. 1 Measurement Parameters and Calculation Formula" (p. Appx.1).
• Enabling the HOLD setting or AUTO setting while the JUDGE SYNC setting is on will cause the JUDGE SYNC setting to be turned off.
• The selection of ranges that can be set during AC measurement varies with the measurement frequency, DC bias on/off setting, and cable length setting. For more information, see p. 211 of "10.6 Measurement Range and Accuracy".
• The guaranteed accuracy range varies depending on the measurement conditions. Check the accuracy assured ranges in "Guaranteed accuracy measurement level range" (p. 213).
• The range of impedance for each range for which accuracy is guaranteed refers to the total impedance for the sample and measurement cables (probe and fixture) (p. 190).
• When the measurement value is outside the guaranteed accuracy range, the following • icon appears at the top of the screen.
This issue may be the result of the following causes. Check the guaranteed accuracy range as described in "Guaranteed accuracy measurement level range" (p. 213) and either change the measurement signal level and measurement range or use the measured value for reference purposes only. • The test signal level is too low: Increase the test signal level. • The current measurement range is not appropriate: Either change the measurement range or change to the AUTO setting so that the instrument can select an optimal range automatically.
3
Performing M
easurements in LC
R M
ode

46
Setting Measurement Conditions (basic settings)
Setting AUTO rangingScreen display method (For more information, see p. 24.):
AC measurement: (Measurement screen) SET key>(SET screen) BASIC tab>RANGE key DC measurement: (Measurement screen) SET key>(SET screen) Rdc tab>RANGE key
1 Touch the AUTO key. 2 Touch the EXIT key twice.Displays the measurement screen.
• If the instrument is being used outside the limits of its specification, the suitable range may not be set in auto ranging function. Check the accuracy assured ranges in "Guaranteed accuracy measurement level range" (p. 213) and then change the test conditions.
• Manually changing the set range while us-ing the AUTO setting will cause the instru-ment to switch to the HOLD setting.
The AUTO range limit function allows you to limit the AUTO ranging range.1 Touch the MIN key.
2 Select the AUTO range lower limit range.
3 Touch the EXIT key.The display will return to the screen shown in step 1.
4 Touch the MAX key, and select the
AUTO range upper limit range.
5 Touch the EXIT key twice.Displays the measurement screen.
The AUTO range scope is the selection of ranges within which the AUTO range is selected. If the AUTO range scope has been limited, the instrument will not select a range that lies outside that scope. For more information about the AUTO range scope, see "Measurement range" (p. 190).
• When canceling the AUTO range limit function, set the lower limit range to 100 mΩ and the upper limit range to 100 MΩ.Range selection screen when the AUTO range scope has been limited
Example: When the lower limit range is set to 1 kΩ and the up-per limit range is set to 1 MΩ
Ranges that fall outside the AUTO range scope will not be shown.

47
Setting Measurement Conditions (basic settings)
Setting the ranging to HOLDScreen display method (For more information, see p. 24.):
AC measurement: (Measurement screen) SET key>(SET screen) BASIC tab>RANGE key DC measurement: (Measurement screen) SET key>(SET screen) Rdc tab>RANGE key
1 Touch the HOLD key and then select the
meausrement range.
2
1
The measurement range is set based on the total impedance of the sample, mea-surement cable, and probe or test fixture.
2 Touch the EXIT key twice.Displays the measurement screen.For more information about the guaranteed ac-curacy range for each measurement range, see "Measurement range" (p. 190).
• If you change the measurement frequency during AC measurement using the HOLD setting of a sample whose impedance varies with frequency, you may not be able to perform measurement using the same
range. In this case, change the measurement range setting. • If OVER FLOW (UNDER FLOW) is indicated as the measured value, measurement cannot be performed with the current measurement range. Change the measurement range or change to the AUTO setting so that the instrument can select an optimal range automatically.
• The measurement range is set based on the total impedance of the sample and measurement cable. Consequently, you may not be able to perform measurement if you set the measurement range using the HOLD setting based solely on the sample’s impedance (for example, if the measurement cable’s parasitic Z [Y] value is large, as it is in long cables). In this case, perform correction, check the sample’s impedance and the fixture’s residual component, and determine the measurement range based on those values.(See "5.2 Open Correction" (p. 99), "5.3 Short Correction" (p. 105), and "Appx. 8 Open Correction and Short Correction" (p. Appx.11).)
• Available range settings are limited based on the measurement frequency and cable length settings. (See p. 211 of "10.6 Measurement Range and Accuracy"..)
3
Performing M
easurements in LC
R M
ode

48
Setting Measurement Conditions (basic settings)
Judgment synchronization setting
When the JUDGE SYNC setting is turned on, the instrument will select the optimal range automati-cally based on the comparator measurement or BIN measurement judgment standard. (See "Judg-ing Measurement Results" (p. 68).)This setting is useful when performing comparator measurement or BIN measurement of a variety of impedance samples, including samples whose impedance varies greatly with frequency.Screen display method (For more information, see p. 24.):AC measurement: (Measurement screen) SET key>(SET screen) BASIC tab>RANGE key DC measurement: (Measurement screen) SET key>(SET screen) Rdc tab>RANGE key
(Example: Comparator)
1 Touch the JUDGE SYNC ON key.
2 Touch the EXIT key twice.Displays the measurement screen.
• This setting is only available when the judgment standards have been set for comparator and BIN measurement
• When the comparator and BIN measurement judgment standards have been set with this set-ting enabled, the instrument will automatically switch to the optimal range. If no judgment stan-dard has been set, the instrument will function the same as when the AUTO setting is enabled.
• If only the θ, D, or Q measurement parameter has been set, the instrument will function the same as when the AUTO setting is enabled.
• During AC measurement, because the phase angle cannot be calculated for some combina-tions of parameters, the range is determined from ideal values. For more information, see the table below.(See also "Appx. 1 Measurement Parameters and Calculation Formula" (p. Appx.1)).
Parameter combination conditions for the judgment synchronization settingYou may be unable to enable the JUDGE SYNC setting for certain combinations of No. 1 and No. 3 parameters.(1) AC measurement
No. 3 parameter
No.
1 p
aram
eter
AC OFF Z Y Rs Rp X G B Ls Lp Cs Cp θ D Q σ εOFF × × × × × ×
Z Y
Rs Rp X G B Ls Lp Cs Cp θ × × × × × ×D × × × × × ×Q × × × × × ×σ × × × × × ×ε × × × × × ×
×: Invalid setting (Same operation as AUTO setting), : Set from ideal value since phase angle cannot be calculated., : Configurable(2) DC measurement
No. 3 parameter
No.
1
para
met
er
OFF Rdc
OFF ×
Rdc ×: Invalid setting (Same operation as AUTO setting), : Configurable

49
Setting Measurement Conditions (basic settings)
Measurement signal level (AC)Sets the measurement signal level to apply to the sample.The measurement signal level applied to the sample can be set using the following three modes: (See "About the measurement signal mode" (p. 52).)
Open circuit voltage (V) mode The value of the open circuit voltage is set.
Constant voltage (CV) mode The value of the voltage between the terminals of the object under test is set.
Constant current (CC) mode The value of the current flowing through the object under test is set.
Selecting constant-voltage or constant-current mode will result in longer measurement times (due to the use of software feedback control).For some samples, changing the measurement signal level setting will cause measured values to vary.
CAUTIONDo not switch between V, CV and CC while the test sample is still connected to the measurement terminals because doing so may damage the test sample.
Screen display method (For more information, see p. 24.):(Measurement screen) SET key>(SET screen) BASIC tab>LEVEL key
1 Select the measurement signal mode.
V Open circuit voltage (V) mode
CV Constant voltage (CV) mode
CC Constant current (CC) mode
2 Use the key to enter voltage level or current level.
Measurement signal mode Settable range
V, CV
4 Hz to 1.0000 MHz:0.010 V to 5.000 V1.0001 MHz to 8 MHz:0.010 V to 1.000 V
CC
4 Hz to 1.0000 MHz:0.01 mA to 50.00 mA1.0001 MHz to 8 MHz:0.01 mA to 10.00 mA
3 Touch the EXIT key twice.Displays the measurement screen.
• When low-Z high-precision mode (p. 55) is on, the valid setting range will vary.
Measurement signal mode Settable range
V, CV 0.010 V to 1.000 V
CC
• When the output im-pedance is 10 Ω:0.01 mA to 100.00 mA
• When the output im-pedance is 100 Ω:0.01 mA to 10.00 mA
See: "For setting range and accuracy" (p. 50)
• The accuracy of testing varies according to the test signal level.See: "Guaranteed accuracy measurement level range" (p. 213)
3
Performing M
easurements in LC
R M
ode
50
Setting Measurement Conditions (basic settings)
For setting range and accuracy
Open circuit voltage (V) mode and Constant voltage (CV) mode setting
Normal operation When low-Z high-precision mode (p. 55) is on
Open circuit voltage setting range 0.010 V to 5.000 V 0.010 V to 1.000 V
Open circuit voltage accuracy 1 MHz or less: ±10% rdg. ±10 mV,1.0001 MHz or more: ±20% rdg. ±10 mV
Output impedance 100 Ω ±10 Ω 10 Ω ±2 Ω
For some samples, you may not be able to perform constant-voltage measurement (measurement in con-stant-voltage mode) In this situation, the following error will be displayed:
Constant voltage measurement will not be performed. Change the constant-voltage value to a value that is less than or equal to the value displayed for Vac.(Example: Constant-voltage measurable range when measuring a C value of 1 µF at 10 kHz)The sample impedance Zm is as follows:
Zm = Rm + jXm = 0 [Ω] - j15.9 [Ω] Xm = -1
(2πfC)
The impedance Zm’ as seen from the instrument’s voltage generator is as follows:Zm’ = Ro + Zm = 100[Ω] - j15.9 [Ω] Ro: Output resistance (100 [Ω])Accordingly, the voltage Vm across both leads of the sample is as follows:
Vm = |Zm|×Vo|Zm’|
= 15.9 [Ω]×Vo101.3 [Ω]
Vo: generator output
Since the instrument’s voltage generator output range is 10 [mV] to 5 [V] as per the above table, the con-stant-voltage measurable range is Vm = 1.6 [mV] to 0.78 [V] based on the above formula. When low-Z high-precision mode is enabled, the output resistance Ro will be 10 [Ω].

51
Setting Measurement Conditions (basic settings)
Constant current (CC) mode setting
Low Z high accuracy mode (p. 55) is set to OFF
Low Z high accuracy mode (p. 55) is set to ON
Constant current setting range 0.01 mA to 50.00 mA 0.01 mA to 100.00 mA
Constant current accuracy ±1%±10 µA
Output impedance 100 Ω ±10 Ω 10 Ω ±2 Ω
For some samples, you may not be able to perform constant-current measurement (measurement in con-stant-current mode). In this case, the following error will be displayed:
Constant current measurement will not be performed. Change the constant-current value to a value that is less than or equal to the value displayed for Iac.(Example: Constant-current measurable range when measuring an L value of 1 mH at 1 kHz)Sample impedance Zm becomes as follows:
Zm = Rm + jXm = 0 [Ω] - j6.28 [Ω] Xm = 2πfLThe impedance Zm’ as seen from the instrument’s voltage generator is as follows:
Zm’ = Ro + Zm = 100 [Ω] - j6.28 [Ω] Ro: Output resistance (100 [Ω])Accordingly, the current Im across both leads of the sample is as follows:
Im = Vo
|Zm’| =
Vo100.2 [Ω]
Vo: generator output
Since the instrument’s voltage generator output range is 10 [mV] to 5 [V] as per the above table, the con-stant-voltage measurable range is Im = 0.10 [mA] to 49.9 [mA] based on the above formula. When low-Z high-precision mode is enabled, the output resistance Ro will be 10 [Ω].
• When the measurement value is outside the guaranteed accuracy range, the following error massage ap-pears at the top of the screen.
In this case, you should consider the following possible causes, and you should either change the mea-surement signal level and measurement range while checking the accuracy assured ranges "Guaranteed accuracy measurement level range" (p. 213), or you should consider the measured values as values for reference. • Measurement signal level is too low: Increase the test signal level. • The current measurement range is inappropriate (when using the HOLD setting): set again in the AUTO • range, or change the range by manual.
3
Performing M
easurements in LC
R M
ode

52
Setting Measurement Conditions (basic settings)
About the measurement signal mode
Relationship between the measurement signal mode of the instrument and the sample is as follows.
V
CC
CV
Output imped-ance
H L
Constant current (CC) modeYou should select this if you wish to set the current passing through the object to be tested to a constant value.
Constant voltage (CV) modeYou should select this if you wish to set the voltage across the terminals of the object to be tested to a constant value.
Open circuit voltage (V) modeThis voltage value is the value which is applied across the two terminals of the series combination of the object which is being tested and the output impedance. As for the voltage which is applied across the terminals of the object which is being tested (by itself), if required, you should either check the monitor voltage value, or select constant voltage (CV) and set a voltage value across these terminals.
Measurement sample
Constant-voltage (CV) mode operationWhen the sample’s impedance is higher than the previous measurement, a voltage that is greater than the set voltage level will be applied, and this may damage the sample. This is due to the fact that the output voltage is controlled, and the set voltage level applied, by means of a software feedback process that observes the voltage across the sample’s terminals when the same voltage level is applied as during the previous measure-ment.
Constant-current (CC) mode operationWhen the sample’s impedance is less than the previous measurement, a current that is greater than the set current level may be applied. This is due to the fact that the output voltage is controlled, and the set cur-rent level applied, by means of a software feedback process that observes the voltage across the sample’s terminals when the same voltage level is applied as during the previous measurement.

53
Setting Measurement Conditions (basic settings)
Line frequency (DC)When performing DC measurement, be sure to set the line frequency of the power supply being used.
Screen display method (For more information, see p. 24.):(Measurement screen) SET key>(SET screen) Rdc tab>LINE FREQ key
1 Select the line frequency.
50 Hz Sets the line frequency to 50 Hz.
60 Hz Sets the line frequency to 60 Hz.
2 Touch the EXIT key twice.Displays the measurement screen.
To suppress noise, the instrument needs to be set to match the frequency of the power source. Before operating, set the instrument to the frequency of your commercial power. If the supply frequency is not set properly, measurements will be unstable.
3
Performing M
easurements in LC
R M
ode
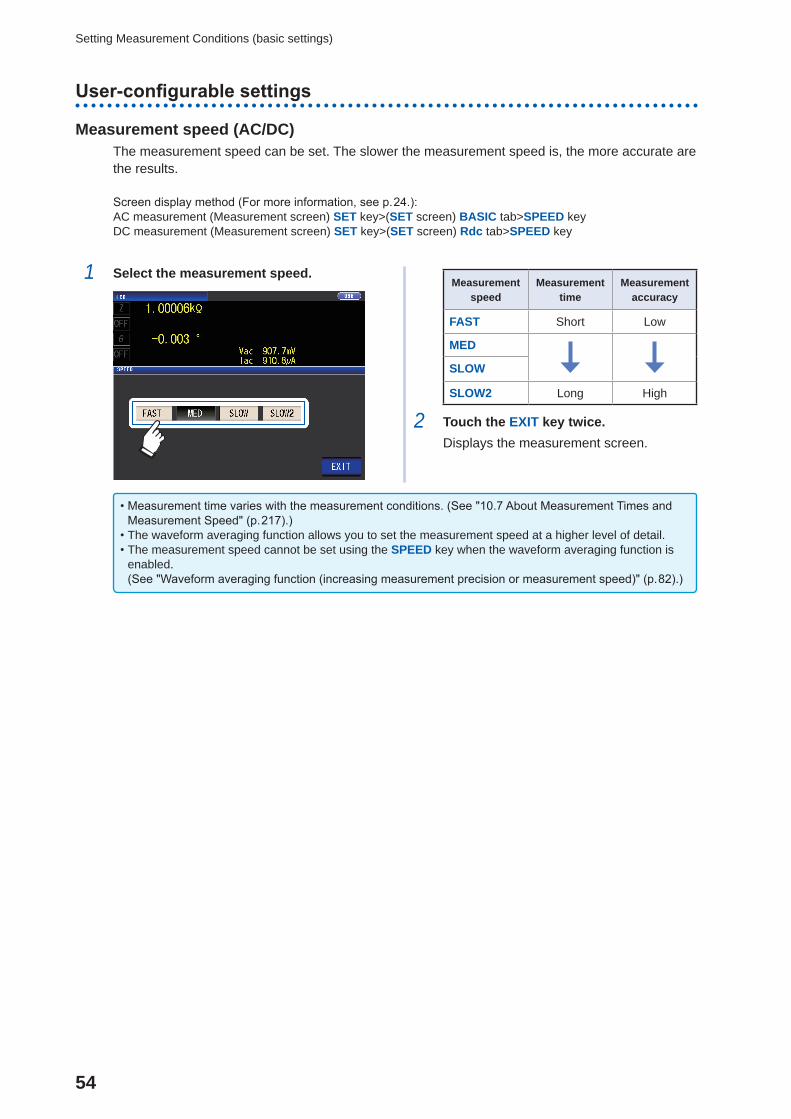
54
Setting Measurement Conditions (basic settings)
User-configurable settings
Measurement speed (AC/DC)The measurement speed can be set. The slower the measurement speed is, the more accurate are the results.
Screen display method (For more information, see p. 24.):AC measurement (Measurement screen) SET key>(SET screen) BASIC tab>SPEED key DC measurement (Measurement screen) SET key>(SET screen) Rdc tab>SPEED key
1 Select the measurement speed.Measurement
speedMeasurement
timeMeasurement
accuracy
FAST Short Low
MED
SLOW
SLOW2 Long High
2 Touch the EXIT key twice.Displays the measurement screen.
• Measurement time varies with the measurement conditions. (See "10.7 About Measurement Times and Measurement Speed" (p. 217).)
• The waveform averaging function allows you to set the measurement speed at a higher level of detail. • The measurement speed cannot be set using the SPEED key when the waveform averaging function is enabled.(See "Waveform averaging function (increasing measurement precision or measurement speed)" (p. 82).)

55
Setting Measurement Conditions (basic settings)
Low Z High Accuracy Mode (high-precision measurement) (AC/DC)Enabling low-Z high-precision mode will switch the output resistance to 10 Ω, enabling high-preci-sion measurement by allowing an adequate amount of current to flow to the measurement sample.
Screen display method (For more information, see p. 24.):AC measurement (Measurement screen) SET key>(SET screen) BASIC tab>RANGE key DC measurement (Measurement screen) SET key>(SET screen) Rdc tab>RANGE key
1 Touch the LOW Z ON key.
2 Touch the EXIT key twice.Displays the measurement screen.
• In low-Z high-precision mode, the measure-ment signal level setting range changes. (p. 50)
• Changing the low Z high accuracy mode setting while open correction, short correc-tion, or load correction is enabled causes the correction values to be disabled.
• Low-Z high-precision mode can only be enabled while using the 100 mΩ, 1 Ω, or 10 Ω range. See the table below.
Measurement range
DC measure-ment
AC measurement (measurement frequency)
to 1 kHz to 10 kHz to 100 kHz to 1 MHz to 5 MHz to 8 MHz
100 MΩ
10 MΩ None
1 MΩ
100 kΩ
10 kΩ Even if low-Z high-precision mode is set to ON, the output resistance will remain 100 Ω.(The measurement signal level will be limited to 1 V or less.)
1 kΩ
100 Ω
10 ΩLow-Z high-precision mode is enabled.
(When low-Z high-precision mode is off, the output resistance will be 100 Ω.)
1 Ω
100 mΩ
3
Performing M
easurements in LC
R M
ode

56
Setting Measurement Conditions (basic settings)
Averaging (limiting display value instability) (AC/DC)With the averaging function, the measured values can be averaged. This function can be used to limit instability of displayed measured values.
AC measurement
With internal trigger
A rolling average of the tested values over the set number of times for averaging is always calculated backwards from the present.(When the sample to be tested is changed over, it takes a little time for a certain stabilization time period until the results is reliable.)
With external trigger Average over the number of averaging times based on trigger input.
DC measurementAveraging processing during DC measurement calculated an arithmetic average regardless of the trigger setting.
Screen display method (For more information, see p. 24.):AC measurement (Measurement screen) SET key>(SET screen) BASIC tab>AVG key DC measurement (Measurement screen) SET key>(SET screen) Rdc tab>AVG key
1 Use key to enter the number of averaging times.
Settable range: 1 to 256
To disable the averaging function, touch
the C key.(The setting will be set to 001.)
2 Touch the EXIT key twice.Displays the measurement screen.
When the range is changed, including by auto-range operation, averaging processing up to that point is cleared and then resumed.
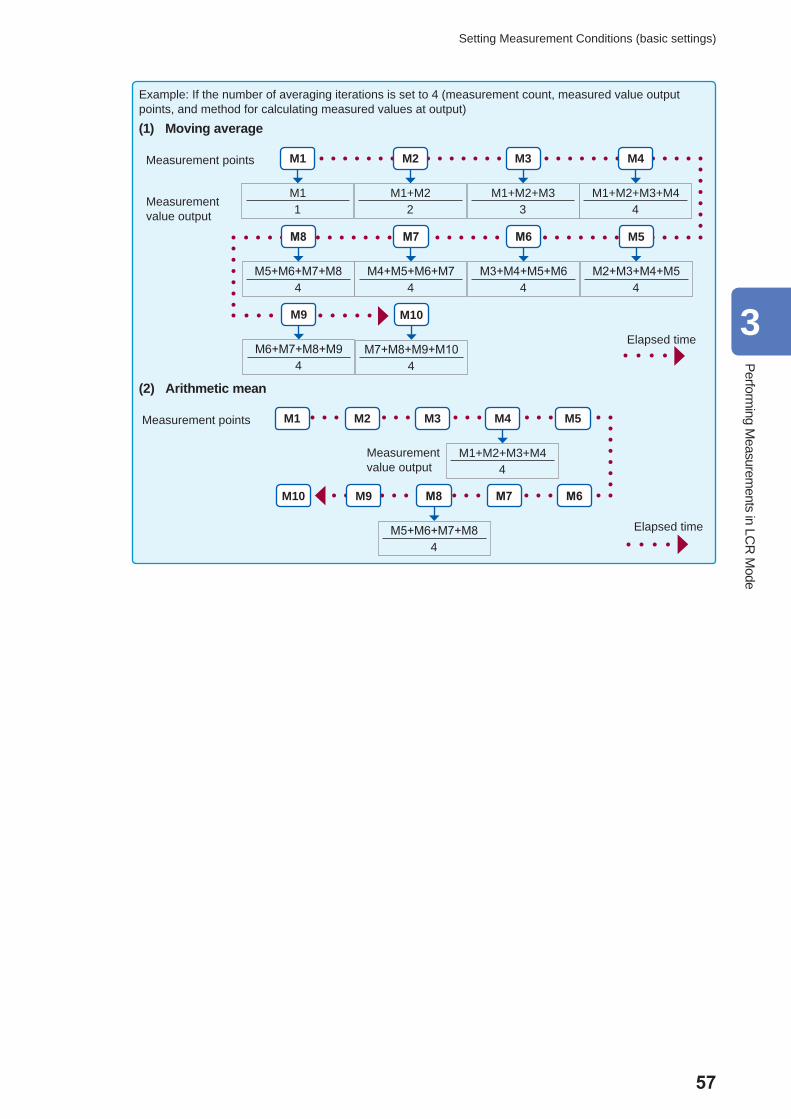
57
Setting Measurement Conditions (basic settings)
Example: If the number of averaging iterations is set to 4 (measurement count, measured value output points, and method for calculating measured values at output)(1) Moving average
M1+M2+M3+M44
M4
M1+M2+M33
M3
M1+M22
M2
M11
M1
M5+M6+M7+M84
M8
M4+M5+M6+M74
M7
M3+M4+M5+M64
M6
M2+M3+M4+M54
M5
M6+M7+M8+M94
M9
M7+M8+M9+M104
M10
Measurement points
Measurement value output
Elapsed time
(2) Arithmetic mean
M1+M2+M3+M44
M4M3M2M1
M5+M6+M7+M84
M8 M7 M6
M5
M9M10
Measurement points
Measurement value output
Elapsed time
3
Performing M
easurements in LC
R M
ode

58
Setting Measurement Conditions (basic settings)
Limit (limiting the voltage and current applied to the sample) (AC)Depending on the measurement signal level, in some cases it is possible to damage the sample which is being measured by applying to it a voltage or a current greater than its rated value.(See"Constant voltage (CV) mode" (p. 52), and "Constant-current (CC) mode operation" (p. 52).)To prevent such damage, you can set limits on the voltage that will be applied to the sample or the current that will flow to the sample.Enabling the limit function increases the measurement time (due to the use of software feedback control).
When open circuit voltage (V) mode or constant voltage (CV) mode is set Set the current limit.
When constant current (CC) mode is set Set the voltage limit.
Screen display method (For more information, see p. 24.):(Measurement screen) SET key>(SET screen) BASIC tab>LIMIT key
1 Touch the ON key.(Example screen: When the measurement signal mode is V or CV)
2 Use the key to enter the limit value.
You can check the voltage and current between the sample terminals using monitor values. Moni-tor values differ depending on the measurement signal mode setting (V, CV, CC).
Measurement signal mode
Limit set Settable range
V, CV Current limit 0.01 mA to 100.00 mA
CC Voltage limit 0.01 V to 5 V
Current limit accuracy: ±1%±10 µAVoltage limit accuracy :±1%±10 mV
3 Touch the EXIT key twice.Displays the measurement screen.
• First set the measurement signal level, and thereafter set the voltage or current limit.
• The screen used to set the limit function varies depending on the measurement signal mode that has been selected (V, CV mode: current limit; CC mode: voltage limit).See "Measurement signal level (AC)" (p. 49).

59
Setting Measurement Conditions (basic settings)
When the limit function is ON, you may encounter a display such as the following. (Example: When constant voltage (CV) setting)
ERR: If the voltage or current which is applied to the sample under test exceeds the limit value (the current exceeding the limit value flows through the sample even when the open-circuit voltage is set to minimum value.)Lower the measurement signal level so that the limit value is not exceeded.
LMT: When a lower signal level than the setting is being applied to the sample due to the voltage limit or current limit value settingAt this time, the voltage or current which exceeds the limit value is not being applied to the sample under test. You should change the test signal level so that it does not exceed the limit value.
DC bias (superimposing a DC voltage on the measurement signal)(AC)You can superimpose a DC voltage on the measurement signal during capacitor measurement.Screen display method (For more information, see p. 24.):(Measurement screen) SET key>(SET screen) BASIC tab>DC BIAS key
1 Touch the ON key.
Touch this button when using an external DC bias unit (option).The DC bias will be set to ON, and the bias value will be set to 0.00 V.
2 Set the DC voltage value to superim-
pose with the keys.
Settable range 0 V to 2.5 VIf you make a mistake, touch the C key and reenter the value.
3 Touch the EXIT key twice.Displays the measurement screen.
If low-Z high-precision mode (p. 55) is en-abled, the valid setting range will differ.(0 V to 1.0 V)
• The DC bias function is specifically for capacitor measurement. If it is used for resistor, inductor, and other elements with low DC resistance, the following are likely. • Normal measurement is not possible. • AUTO ranging is unable to determine a range.
• If the parameter has been set to Rdc, you will not be able to enable the DC bias function. • When superimposing a DC voltage that falls outside the valid setting range for the DC bias function, refer to "How to supply a DC bias voltage" (p. Appx.7).
• When superimposing a DC voltage on a coil or the like, refer to "How to supply a DC bias current" (p. Appx.8). • If the total value for the measurement signal level (AC level setting value × √2 + DC bias setting value) will become >5√2 [V], the measurement signal and DC bias value cannot be raised any higher. Reduce the measurement signal level or DC bias value, and then configure the setting. In low Z high accuracy mode, the measurement signal level and DC bias value can be set when the total value is in the range of √2 [V] or below.
• The selection of ranges that can be set varies depending on whether the DC bias function is enabled or disabled. For more information, see p. 211 of "10.6 Measurement Range and Accuracy".
3
Performing M
easurements in LC
R M
ode

60
Setting Measurement Conditions (basic settings)
DC adjustment (reducing measurement error) (DC)Enabling the DC adjustment function causes the instrument to set the generated voltage to 0 V and acquire the offset value generated by its internal circuitry in order to reduce measurement error.(Default setting: ON)
Disabling the DC adjustment function allows high-speed DC resistance measurement since the
offset value is not acquired before each measurement is performed.
11 ・・・ ・・・ nn
1 2 ・・・ n
DC adjustment onWith n average iterations
AC measurement complete
DCdelay
Adjustmentdelay
During auto-range operation, the instrument performs measurement to determine the range (the result is not applied to measured values).
DCdelay
DC resistance valueacquisition
Adjustment valueacquisition
DCdelay
AC measurement/DC measurement switching
Adjustmentdelay
AC measurement/DC measurement switching
DC resistance valueacquisition
DC adjustment offWith n average iterations
• Disabling DC adjustment may cause the measurement error to increase. • When using the instrument with DC adjustment disabled, acquire the adjustment value with the sample (or a circuit with equivalent DC resistance [Rdc]) connected.
• Because the adjustment value will vary when the sample’s Rdc or ambient temperature changes, disabling DC adjustment will prevent accurate measurement.
Screen display method (For more information, see p. 24.):(Measurement screen) SET key>(SET screen) Rdc tab>DC ADJ key
1 Touch the ON key.
OFF Acquires the offset value at the time shown below.
ON Obtains the offset value for each measurement.
GET DCR OFFSET
Acquires the DC adjustment value.(Valid only when the DC ADJ setting is disabled.)
Selecting OFF will cause the following message to be displayed."Please Get DCR Offset." (Acquire the DCR offset value.)
Touching EXIT will close the message.
2 Touch the EXIT key twice.Displays the measurement screen.

61
Setting Measurement Conditions (basic settings)
• Measurement is switched between 1 V and 0 V to acquire the offset value. Set the DC delay (p. 61) and adjustment delay (p. 62) so that the measurement sample's inductance does not affect measured val-ues. Start with a long value for both and gradually shorten it while observing measured values.
• When the DC adjustment function is enabled, measurement will include both the normal measurement time and the offset measurement time, resulting in measurement times that are about twice as long as when the DC adjustment function is disabled.
• Offset measurement is performed as follows when the DC function setting is off (once the first trigger signal is received under the following conditions, the offset value is acquired when output reaches 0 V and the adjustment delay is in effect): • When changing the Rdc measurement range (including the AUTO range) • When enabling or disabling Rdc low-Z high-precision mode (for ranges from 100 mΩ to 10 Ω) • When changing the adjustment delay time (See "Measurement and data acquisition timing" (p. 65).) • When the GET DCR OFFSET key is touched (Touching the GET DCR OFFSET key again before the trigger signal is received will cancel offset measurement.)
• When the CALIB signal is input from an external device to the EXT I/O connector (p. 162) • When the :DCResistance:ADJust:DEMand interface communications command is sent from an ex-ternal device
• If the parameter has not been set to Rdc, the GET DCR OFFSET key will be disabled.
DC delay (setting the DC measurement delay time) (DC)Sets the time allowed to elapse before starting DC measurement after AC measurement. This delay time is used to delay measurement until the DC signal level stabilizes.
For more information about DC delay timing, see the figures in "Measurement and data acquisition timing" (p. 65).Screen display method (For more information, see p. 24.):(Measurement screen) SET key>(SET screen) Rdc tab>DC DELAY key
1 Use the key to enter the DC delay time.
Settable range: 0 s to 9.9999 s
To disable the DC delay setting, touch the C key.
(The delay will be set to 0 sec.)
2 Touch the EXIT key twice.Displays the measurement screen.
The time required until the DC signal level stabilizes differs depending on the test sample to be measured. To ensure measurement is performed accurately, observe the measurement waveform in advance and then set the delay time required until the DC signal level stabilizes.
3
Performing M
easurements in LC
R M
ode

62
Setting Measurement Conditions (basic settings)
Adjustment delay (setting the offset measurement delay time) (DC)This delay time serves to delay measurement until offset measurement (0 V DC) stabilizes.For more information about adjustment delay timing, see the figures in "Measurement and data acquisition timing" (p. 65).Screen display method (For more information, see p. 24.):
(Measurement screen) SET key>(SET screen) Rdc tab>ADJ DELAY key
1 Change the adjustment delay time with the keys.
Settable range: 0.0030 s to 9.9999 s
To revert the setting to the default value,
touch the C key.(The set time is set to 0.0030 s.)
2 Touch the EXIT key twice.Displays the measurement screen.
The time required until the DC signal level stabilizes differs depending on the test sample to be measured. To ensure measurement is performed accurately, observe the measurement waveform in advance and then set the delay time required until the DC signal level stabilizes.
Trigger (perform measurements with user-defined timing) (Common)Trigger functionality allows you to start and stop recording based on a particular signal.When recording is started or stopped by a specific signal, we say the trigger is "gapplied" or "trig-gering occurs".With this instrument, you can select the following two types of trigger.
Internal Trigger Generates the trigger signal internally and repeats measurement automatically.
External trigger
Accepts input of signals and commands from an external source to control measure-ment. You can also apply the trigger manually on the instrument’s screen.
This setting applies to both AC and DC measurement.Screen display method (For more information, see p. 24.):(Measurement screen) SET key>(SET screen) BASIC tab>TRIG key
1 Select the trigger type. INT Internal triggerAutomatically repeats measure-ment.
EXT External triggerInput the trigger manually via EXT I/O or from the interface.
2 Touch the EXIT key twice.Displays the measurement screen.

63
Setting Measurement Conditions (basic settings)
External trigger input methodThere are the following three types of input method for a trigger. • Touching the TRIG key on the screen to manually apply the trigger causes the instrument to perform one measurement.
Measurement screen SET screen • Input via EXT I/O: Measurement is performed once each time a negative logic pulse signal is applied. See "9.1 External Input/Output Connector and Signals" (p. 162).
• Input from interface: Measurement is performed once when *TRG is transmitted.Refer to the Communications Instruction Manual on the bundled LCR Application Disc.
Trigger delay (inserting a delay between the trigger and measurement)(Common)The delay time period from input of the trigger signal to measurement can be set.With this function it is possible to ensure that testing is started after the connection condition of the object being tested and the test cables has stabilized.The setting applies to both AC and DC measurement.See "Trigger delay and Trigger synchronous output" (p. 64).
For more information about trigger delay timing, see the figures in "Measurement and data acquisi-tion timing" (p. 65).
Screen display method (For more information, see p. 24.):(Measurement screen) SET key>(SET screen) BASIC tab>DELAY key
1 Use the key to enter the trigger delay time.
Settable range: 0 s to 9.9999 s with resolu-tion of 0.1 msWhen you want to turn off the trigger delay setting, touch the C key.(The set time is set to 0 s.)
2 Touch the EXIT key twice.Displays the measurement screen.
When a trigger delay has been set, the measurement LED will light up from the time trigger input is received until measurement completes.
3
Performing M
easurements in LC
R M
ode

64
Setting Measurement Conditions (basic settings)
Trigger synchronous output (Applying the signal to the sample during measure-ment only) (Common)
After outputting the measurement signal at trigger input, applies the signal to the sample during measurement only. You can also set a delay time (Trigger synchronous delay) to ensure that data is acquired after the sample stabilizes.Thus reducing the generation of heat in the sample and decreasing electrode wear.The setting applies to both AC and DC measurementSee "Trigger delay and Trigger synchronous output" (p. 64).For more information about trigger synchronous delay timing, see the figures in "Measurement and data acquisition timing" (p. 65).
Screen display method (For more information, see p. 24):(Measurement screen) SET key>(SET screen) BASIC tab>SYNC key
1 Touch the ON key. 2 Use the key to change the trigger synchronous delay time.
Settable range: 0.0010 s to 9.9999 s
When you want to return the time to the initial state, touch the C key.(The set time is set to 0.0010 s.)
3 Touch the EXIT key twice.Displays the measurement screen.
• When the trigger synchronous output function is set to ON, the measurement time will increase due to the incorporation of a delay time between output of the measurement signal and data acquisition. (See "10.7 About Measurement Times and Measurement Speed" (p. 217).)
• When the trigger synchronous output function is set to ON, the set level may be output momentarily if a measurement condition is changed.
• The measurement signal is output when the trigger signal is input and stops after measurement ends. • When the contact check (p. 85) timing is set to either BOTH or BEFORE for the contact check function, the trigger synchronous output function is automatically turned on. Set the trigger synchronous delay time.
• To continue to apply the measurement signal until measurement of the last panel is complete in continu-ous measurement mode, set trigger synchronization for all panels other than the final panel to OFF.
Trigger delay and Trigger synchronous outputWhen the range synchronization feature is enabled, the ranges for which the trigger delay function and trig-ger synchronization output function will be enabled will vary depending on the parameter setting.
Parameters Ranges for which the trigger delay function and trig-ger synchronization output function are enabled
Parameters other than Rdc only(AC measurement) Range for AC measurement
Combination of Rdc and other parameters(AC measurement+DC measurement) Range for AC measurement
Rdc only (DC measurement) Range for DC measurement

65
Setting Measurement Conditions (basic settings)
Measurement and data acquisition timing
Measurement and data acquisition timing varies with the following settings:Trigger synchronous output (p. 64), Trigger delay (p. 63), Trigger synchronous delay (p. 64), DC delay (p. 61), Adjustment delay (p. 62)
When the trigger synchronization function is on
Trigger synchronousdelay Data acquisition
AC measurement (trigger synchronization on)
DCdelay
Adjustment delay
Data acquisition
Data acquisitionDC measurement
(trigger synchronization on)(DC adjustment on)
Trigger signal
DC measurement (trigger synchronization on)(DC adjustment off)
DCdelay
Data acquisition
Trigger delay
Trigger delay
Trigger delay
DC measurement after AC measurement (trigger synchronization on)(DC adjustment on)
DC measurement after AC measurement (trigger synchronization on)(DC adjustment off)
Data acquisitionSwitching time
(3.5 ms)
Data acquisition
Adjustment delay
Trigger synchronousdelayTrigger delay
Data acquisition
Switching time(3.5 ms)
DCdelay
Data acquisition
Trigger delay
Switching time1.5 ms
Switching time1.5 ms
DCdelay
Data acquisition
Switching time0.5 ms
Trigger synchronousdelay
Trigger synchronousdelay
Trigger synchronousdelay
3
Performing M
easurements in LC
R M
ode

66
Setting Measurement Conditions (basic settings)
When the trigger synchronization function is off
Trigger signal
Data acquisition
AC measurement (trigger synchronization off)
DC delay
Adjustment delay
Data acquisition
Data acquisition
DC measurement (trigger synchronization off)(DC adjustment on)
DC measurement (trigger synchronization off)(DC adjustment off)
Data acquisition
Data acquisitionSwitching time
3.5 msDC
delay
Data acquisition
Adjustment delay
Data acquisitionDC measurement
after AC measurement(trigger synchronization off)(DC adjustment on)
Trigger delay
Trigger delay
Trigger delay
Trigger delay
Data acquisitionSwitching time
3.5 msDC
delayData
acquisitionDC measurement after AC measurement(trigger synchronization off)(DC adjustment off)
Trigger delay
Trigger delay : Time from trigger to start of measurement 0.0 ms to 9.9999 sTrigger synchronization delay:Time from signal generation to data acquisition 1.0 ms to 9.9999 sDC delay : Time from signal generation to data acquisition 0.0 ms to 9.9999 sAdjustment delay : Time from DC 0 V signal to data acquisition 3.0 ms to 9.9999 s
Measurement (EXT I/O INDEX signal: Hi)
Switching time1.5 ms
DC delay
Switching time0.5 ms
Switching time depends on the measurement conditions. The value of the figure is a reference value.
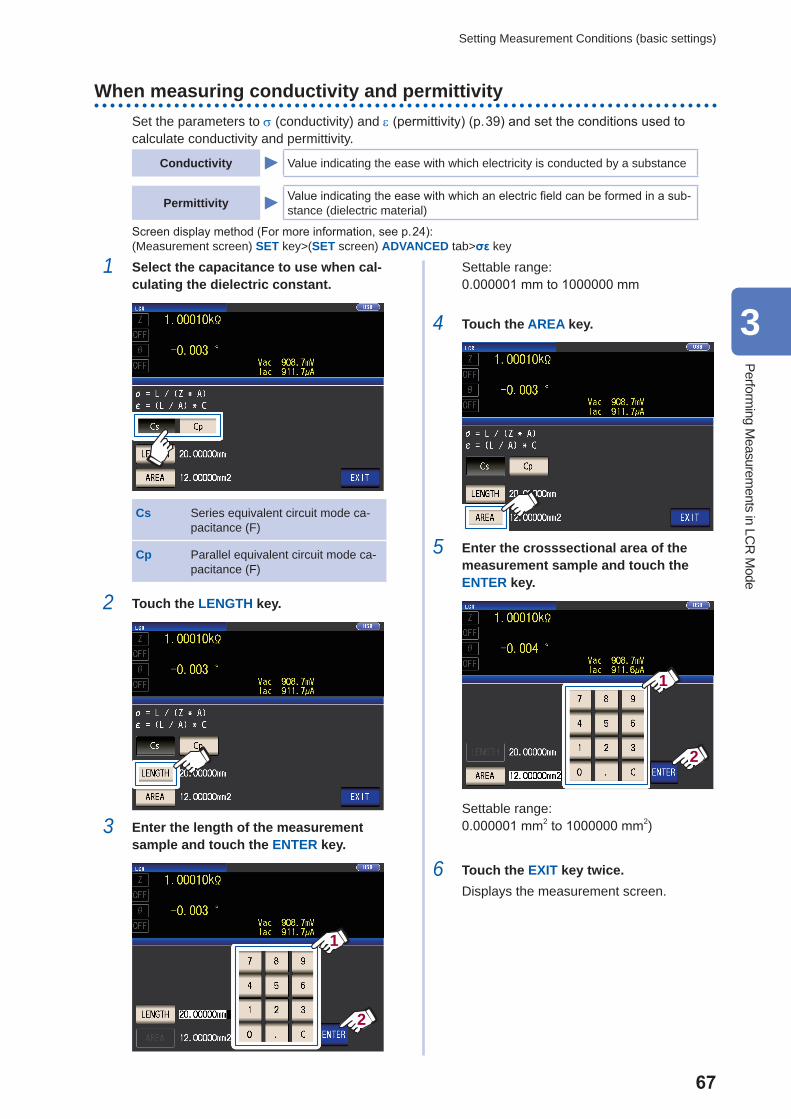
67
Setting Measurement Conditions (basic settings)
When measuring conductivity and permittivitySet the parameters to σ (conductivity) and ε (permittivity) (p. 39) and set the conditions used to calculate conductivity and permittivity.
Conductivity Value indicating the ease with which electricity is conducted by a substance
Permittivity Value indicating the ease with which an electric field can be formed in a sub-stance (dielectric material)
Screen display method (For more information, see p. 24):(Measurement screen) SET key>(SET screen) ADVANCED tab>σε key
1 Select the capacitance to use when cal-culating the dielectric constant.
Cs Series equivalent circuit mode ca-pacitance (F)
Cp Parallel equivalent circuit mode ca-pacitance (F)
2 Touch the LENGTH key.
3 Enter the length of the measurement sample and touch the ENTER key.
1
2
Settable range:0.000001 mm to 1000000 mm
4 Touch the AREA key.
5 Enter the crosssectional area of the measurement sample and touch the ENTER key.
1
2
Settable range:0.000001 mm2 to 1000000 mm2)
6 Touch the EXIT key twice.Displays the measurement screen.
3
Performing M
easurements in LC
R M
ode

68
Judging Measurement Results
3.5 Judging Measurement ResultsThe measurement results are compared to an arbitrarily set reference and then the judgment re-sults are displayed.This function is useful for quality evaluation and the like.There is comparator measurement which compares one judgment reference and the measurement values, and BIN measurement which compares multiple judgment reference values (up to 10) and the measurement values.
Judgment by comparator measurement and BIN measurement is performed for the No. 1 param-eter and No. 3 parameter.Therefore, set the measurement values you want to judge for the No. 1 parameter and No. 3 pa-rameter in advance.See "3.1 Setting Display Parameters" (p. 39).
Comparator measurement
Judgment Target Result Display
No. 1 parameter No. 2 parameter
No. 3 parameter No. 4 parameter
BIN measurement
Judgment Target Result Display
No. 1 parameterNo. 4 parameterNo. 3 parameter
(The No. 2 parameter area is shown.)

69
Judging Measurement Results
Setting the judgment mode
Select a judgment mode as described below and configure the settings.
Screen display method (For more information, see p. 24):(Measurement screen) SET key>(SET screen) ADVANCED tab>JUDGE key
1 Select the judgment mode. OFF Disables comparator and BIN func-tion.
COMP Enables comparator function. Configure the comparator function settings (p. 69).
BIN Enables BIN function. Configure the BIN function settings (p. 74).
2 Touch the EXIT key twice.Displays the measurement screen.
• When comparator measurement and BIN measurement are performed, only the first and third parameters can be set. (During BIN measurement, the No. 3 parameter will be displayed in the No. 2 parameter area.)
• During comparator measurement, the No. 2 and No. 4 parameter displays will indicate [LMT]. • During BIN measurement, the No. 4 parameter display will indicate [BIN].
Configuring comparator function settings (judging measurement re-sults based on one judgment standard)
The comparator function allows you to do the following.
Preset a reference value and upper and lower limit values as the judgment reference, and display a judgment result as HI (higher than the upper limit value), IN (within the range set for the upper and lower limit values), or LO (lower than the lower limit value).
• Output the judgment results to an external device (via the EXT I/O connector).
• Select different settings and perform judgment for up to two parameters.
• Be notified of judgment results by buzzer.See "Key tones and judgment tones" (p. 89).
• Confirm the judgment result from the judgment result indi-cation LEDs on the front panel of the instrument.
When the compar-ator measurement result is IN, the green indicator will light up.
When the compara-tor measurement result is HI or LO, the red indicator will light up.
(Judgment result indication LEDs)
HI Measured value is above upper limit
IN Upper limit value ≥ calculated value ≥ lower limit value
LO Measured value is below lower limit
- - - When no reference standards have been set
3
Performing M
easurements in LC
R M
ode

70
Judging Measurement Results
The comparator decision mode can be set as one of the following:
Absolute value (ABS) setting (p. 71)
Upper limit value HIIN
Lower limit value LO
Set absolute values for the upper limit and lower limit values of the measurement parameters.The measurement values displayed are the same as those of the measurement parameters.
Percent (%) Setting (p. 72)
Upper limit value [%] HI
Reference valueININ
Lower limit value [%] LO
Enter reference values and then set percentages corre-sponding to the reference values as the upper limit and lower limit*1 values.The measurement values displayed are the same as those of the measurement parameters.
Deviation Percent (∆%)*2 Setting(p. 72)
Upper limit value [∆%] HI
Reference valueININ
Lower limit value [∆%] LO
Enter reference values and then set percentages corre-sponding to the reference values as the upper limit and lower limit*1 values.The measurement values are displayed in deviations (Δ%) from the reference value.
*1: The following equation is used to calculate the comparison upper limit value and comparison lower limit value. (In the case of the comparison lower limit value, if a value that is lower than the reference value is set, the minus (-) sign is required for the percentage setting value.)
= reference value + |reference value| ×100
Percentage set valueUpper limit comparison value (Lower limit comparison value)
*2: The following equation is used to calculate the ∆% value.
Δ%=|reference value|
measurement value - reference value×100
The comparator and BIN judgment is made in the following order.
Judgment order State Judgment
display
1 When the measurement value is OVER FLOW(However, LO is displayed when the parameters are Y, Cs, Cp, G, and B.) HI
When the measurement value is UNDER FLOW(However, HI is displayed when the parameters are Y, Cs, Cp, G, and B.) LO
When the measurement value is SAMPLE ERR or a contact error HI
2 When measured value < lower limit value LO
3 When measured value > upper limit value HI
4 Other than 1, 2, 3 IN
No test is performed to ensure that the upper limit value is greater than the lower limit value, so no error message will be displayed if you set the upper limit value and lower limit value the wrong way around.
• If the instrument is turned off while set up for comparator measurement, it will start up in the same state the next time it is turned on.
• Comparator measurement can be used even if only the upper or lower limit value has been set.
When only an upper limit value has been set
Upper limit value
HI
IN
When only a lower limit value has been set
Lower limit value
IN
LO

71
Judging Measurement Results
Absolute value settingSet the value after setting the judgment mode (p. 69) to COMP.This explanation uses the example of setting the measurement conditions for the No. 1 parameter.
1 Touch the LMT key on the measurement screen.
2 Touch the ABS key.
3 Touch the HI key, and set the upper limit value with the numeric keypad.
2
1
×103 Step the units up.
×1/103 Step the units down.
Units: a/ f/ p/ n/ µ/ m/ none/ k/ M/ GSettable range: -9.99999 G to 9.99999 GIf you do not wish to set an upper limit value, touch the OFF key.
4 Touch the ENTER key to confirm the up-per limit value.The display will return to the screen shown in step 2.
5 Touch the LO key, set the lower limit value with the numeric keypad, and touch the ENTER key.Settable range: -9.99999 G to 9.99999 GIf you do not wish to set an lower limit value, touch the OFF key.
6 Touch the EXIT key.Displays the measurement screen.
3
Performing M
easurements in LC
R M
ode

72
Judging Measurement Results
Percentage setting and deviation percentage setting
Set the value after setting the judgment mode (p. 69) to COMP.This explanation uses the example of setting the measurement conditions for the No. 1 parameter.
1 Touch the LMT key on the measurement screen.
2 Touch the % key (persentage setting) or ∆% key (deviation percentage setting)
3 Touch the REF key, , and set the refer-ence value with the numeric keypad.
2
1
×103 Step the units up.
×1/103 Step the units down.
Units: a/ f/ p/ n/ m/ m/ none/ k/ M/ GSettable range -9.99999 G to 9.99999 G
4 Touch the ENTER key to confirm the ref-erence value.
5 Touch the HI key, and set the upper limit value with the numeric keypad.
2
1
Settable range: -999.999% to 999.999%Set the upper limit value as a percentage relative to the reference value.If you do not wish to set an upper limit value, touch the OFF key.
6 Touch the ENTER key to confirm the up-per limit value.The display will return to the screen shown in step 2.
7 Touch the LO key, set the lower limit value with the numeric keypad, and touch the ENTER key.Settable range: -999.999% to 999.999%Set the lower limit value as a percentage relative to the reference value.If you do not wish to set an lower limit value, touch the OFF key.
8 Touch the EXIT key.Displays the measurement screen.
The set reference value and upper and lower limit values are common to percentage set-ting and percentage deviation setting.

73
Judging Measurement Results
Percentage setting • The actual operation performed internally is to calculate the upper limit comparison value (or lower limit comparison value) using the following formula and then compare it to the measured value to make a judg-ment. To set an upper limit comparison value (or lower limit comparison value) that is less than the refer-ence value, give the percent setting a negative sign.
Upper limit comparison value= reference value + |reference value| ×100
Percentage set value
Lower limit comparison value= reference value + |reference value| ×100
Percentage set value
Deviation percent setting • The measurement values are displayed in deviations (Δ%) from the reference value. • The following equation is used to calculate the Δ% value.
Δ%=|reference value|
measurement value - reference value×100 3
Performing M
easurements in LC
R M
ode
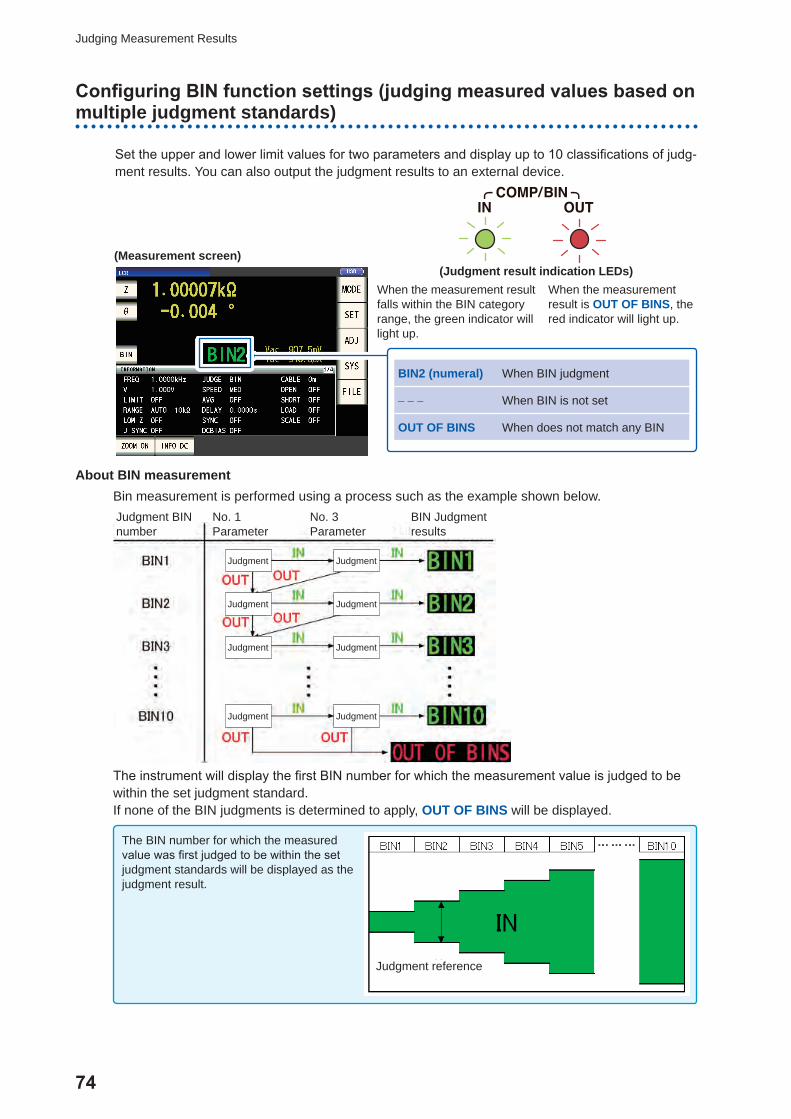
74
Judging Measurement Results
Configuring BIN function settings (judging measured values based on multiple judgment standards)
Set the upper and lower limit values for two parameters and display up to 10 classifications of judg-ment results. You can also output the judgment results to an external device.
When the measurement result falls within the BIN category range, the green indicator will light up.
When the measurement result is OUT OF BINS, the red indicator will light up.
(Judgment result indication LEDs)
BIN2 (numeral) When BIN judgment
- - - When BIN is not set
OUT OF BINS When does not match any BIN
(Measurement screen)
About BIN measurementBin measurement is performed using a process such as the example shown below.Judgment BIN number
No. 1Parameter
No. 3Parameter
BIN Judgment results
Judgment Judgment
Judgment Judgment
Judgment Judgment
Judgment Judgment
The instrument will display the first BIN number for which the measurement value is judged to be within the set judgment standard.If none of the BIN judgments is determined to apply, OUT OF BINS will be displayed.
The BIN number for which the measured value was first judged to be within the set judgment standards will be displayed as the judgment result.
Judgment reference

75
Judging Measurement Results
The BIN decision mode can be set as one of the following:Absolute value (ABS) setting (p. 76)
Upper limit value HIIN
Lower limit value LO
Set absolute values for the upper limit and lower limit val-ues of the measurement parameters.The measurement values displayed are the same as those of the measurement parameters.
Percent (%) Setting (p. 77)
Upper limit value [%] HI
Reference valueININ
Lower limit value [%] LO
Enter reference values and then set percentages corre-sponding to the reference values as the upper limit and lower limit*1 values.The measurement values displayed are the same as those of the measurement parameters.
Deviation Percent (Δ%)*2 Setting (p. 77)
Upper limit value [∆%] HI
Reference valueININ
Lower limit value [∆%] LO
Enter reference values and then set percentages corre-sponding to the reference values as the upper limit and lower limit*1 values.The measurement values are displayed in deviations (Δ%) from the reference value.
*1: The following equation is used to calculate the comparison upper limit value and comparison lower limit value. (In the case of the comparison lower limit value, if a value that is lower than the reference value is set, the minus (-) sign is required for the percentage setting value.)
= reference value + |reference value| ×100
Percentage set valueUpper limit comparison value (Lower limit comparison value)
*2: The following equation is used to calculate the ∆% value.
Δ%=|reference value|
measurement value - reference value×100
• For more information about HI/IN/LO judgment procedures, see p. 70. • By starting with a restrictive standard and setting a series of judgment standards that grow progressively more permissive, as shown in the figure to the right, you can rank measured elements.
• For a BIN number that does not require a BIN judgment, set the upper and lower limit values to OFF. • The measurement conditions that are used when normal measurement* is performed are inherited as is for the measurement conditions when BIN is performed.
• BIN measurement can be used even if only the upper or lower limit value has been set.
When only an upper limit value has been set
Upper limit value
HI
IN
When only a lower limit value has been set
Lower limit value
IN
LO
*: Indicates measurement when not using the com-parator function or BIN measurement function.
3
Performing M
easurements in LC
R M
ode

76
Judging Measurement Results
Absolute value setting
Set the value after setting the judgment mode (p. 69) to BIN.
1 Touch the BIN key on the measurement screen.
2 Touch the Z key.
The key display differs depending on the measurement parameter
3 Touch the ABS key and then touch the EXIT key.
2
1
4 Use the key to select the BIN num-ber to set, and touch the EDIT key.
12
5 Touch the HI key for the No. 1 param-eter.
No. 1 parameter
No. 3 parameter
6 Enter the upper limit value with the nu-meric keypad.
Settable range: -9.99999 G to 9.99999 GWhen you do not want to set the upper and lower limit values, touch the OFF key.
7 Touch the ENTER key to confirm the up-per limit value.The display will return to the screen shown in step 5.
8 Touch the LO key for the No. 1 parameter, set the lower limit value with the numeric keypad, and then touch the ENTER key.Settable range: -9.99999 G to 9.99999 GThe display will return to the screen shown in step 5.
9 Using the same procedure, set the up-per and lower limit values for the No. 3 parameter.
10 Touch the EXIT key twice.Displays the measurement screen.

77
Judging Measurement Results
Percentage setting and deviation percentage settingSet the value after setting the judgment mode (p. 69) to BIN.
1 Touch the BIN key on the measurement screen.
2 Touch the Z key.
The key display differs depending on the measurement parameter
3 Touch the % key (persentage setting) or ∆% key (deviation percentage setting)
4 Touch the REF key, and enter the refer-ence value with the numeric keypad.
2
1
Settable range: -9.99999 G to 9.99999 G
5 Touch the ENTER key to confirm the ref-erence value.
6 Touch the EXIT key.
7 Use the key to select the BIN num-ber to set, and touch EDIT key.
12
8 Touch the HI key for the No. 1 param-eter.
No. 1 parameter
No. 3 parameter
3
Performing M
easurements in LC
R M
ode
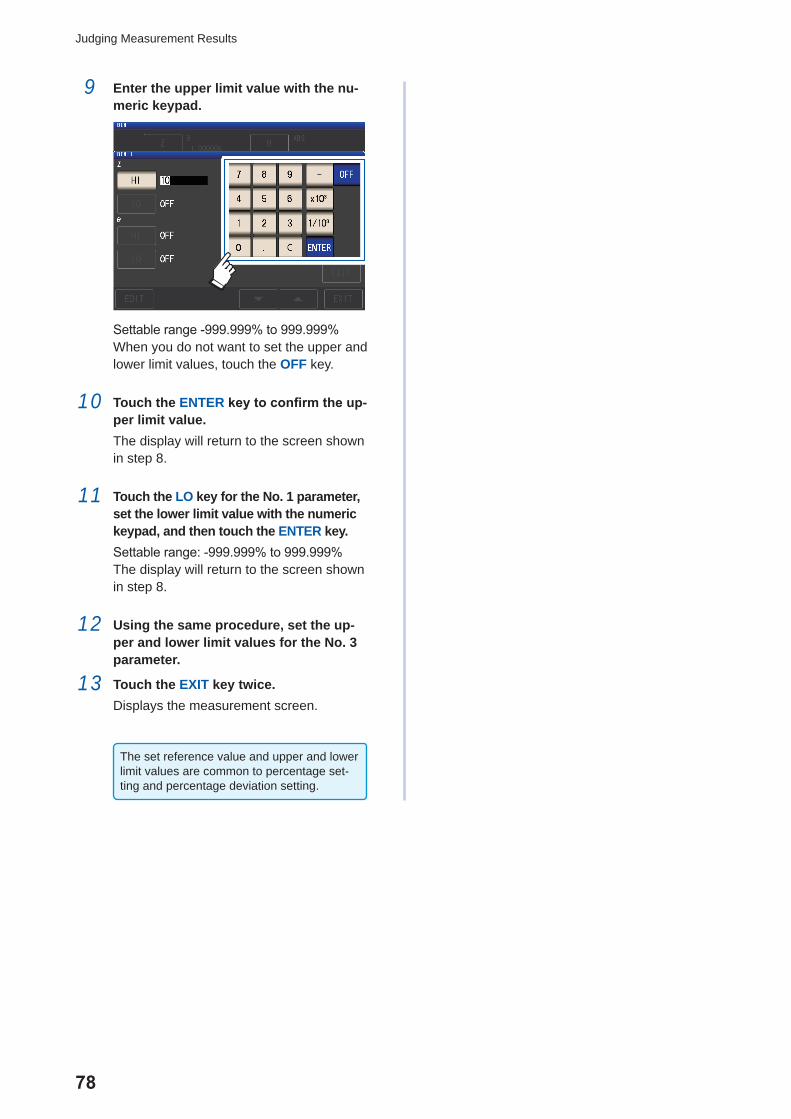
78
Judging Measurement Results
9 Enter the upper limit value with the nu-meric keypad.
Settable range -999.999% to 999.999%When you do not want to set the upper and lower limit values, touch the OFF key.
10 Touch the ENTER key to confirm the up-per limit value.The display will return to the screen shown in step 8.
11 Touch the LO key for the No. 1 parameter, set the lower limit value with the numeric keypad, and then touch the ENTER key.Settable range: -999.999% to 999.999%The display will return to the screen shown in step 8.
12 Using the same procedure, set the up-per and lower limit values for the No. 3 parameter.
13 Touch the EXIT key twice.Displays the measurement screen.
The set reference value and upper and lower limit values are common to percentage set-ting and percentage deviation setting.

79
Setting Application Settings
3.6 Setting Application Settings
Range synchronization (Setting measurement conditions for individu-al measurement Ranges)
This section describes how to set measurement conditions for individual measurement ranges.
Basic measurement conditions (BASIC)
Allows you to set the following measurement conditions for individual measurement ranges: • Measurement speed (applies to AC measurement) • Average (applies to AC measurement) • Trigger delay (applies to both AC and DC measurement) • Trigger synchronous delay (applies to both AC and DC measurement)
Measurement conditions for DC measurement (Rdc)
Allows you to set the DC measurement speed and averaging function for individual measurement ranges.
(1) Turn on the range synchronization function. Screen display method (For more information, see p. 24):(Measurement screen) SET key>(SET screen) ADVANCED tab>RNG SYNC key
1 Touch the ON key. 2 Touch the EXIT key.The instrument will return to the SET screen.
Set the measurement conditions as described in "(2) Setting measurement conditions on individual dialog boxes" (p. 80))and "(3) Setting measurement conditions on a single screen" (p. 81).
3
Performing M
easurements in LC
R M
ode
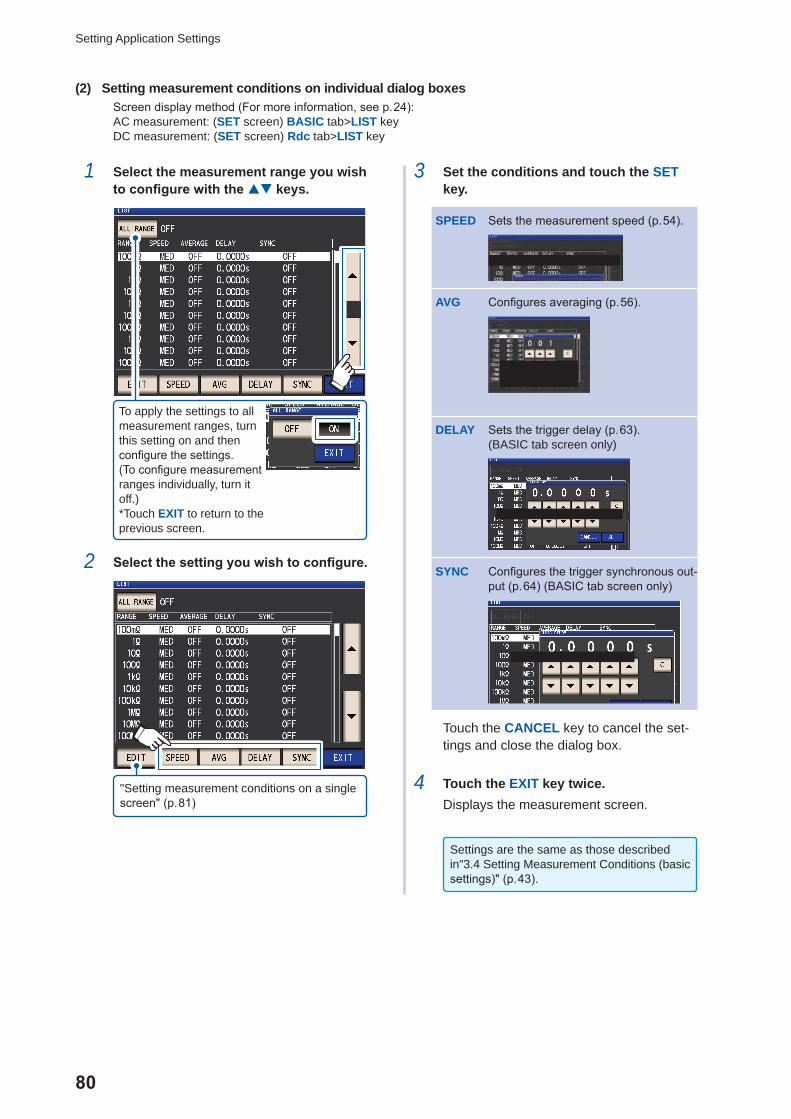
80
Setting Application Settings
(2) Setting measurement conditions on individual dialog boxesScreen display method (For more information, see p. 24):AC measurement: (SET screen) BASIC tab>LIST key DC measurement: (SET screen) Rdc tab>LIST key
1 Select the measurement range you wish to configure with the keys.
To apply the settings to all measurement ranges, turn this setting on and then configure the settings. (To configure measurement ranges individually, turn it off.)*Touch EXIT to return to the previous screen.
2 Select the setting you wish to configure.
"Setting measurement conditions on a single screen" (p. 81)
3 Set the conditions and touch the SET key.
SPEED Sets the measurement speed (p. 54).
AVG Configures averaging (p. 56).
DELAY Sets the trigger delay (p. 63). (BASIC tab screen only)
SYNC Configures the trigger synchronous out-put (p. 64) (BASIC tab screen only)
Touch the CANCEL key to cancel the set-tings and close the dialog box.
4 Touch the EXIT key twice.Displays the measurement screen.
Settings are the same as those described in"3.4 Setting Measurement Conditions (basic settings)" (p. 43).

81
Setting Application Settings
(3) Setting measurement conditions on a single screenScreen display method (For more information, see p. 24):AC measurement: (SET screen) BASIC tab>LIST key DCmeasurement: (SETscreen) Rdc tab>LIST key
1 Select the measurement range you wish to configure with key, and touch the EDIT key.
12
To apply the settings to all measurement ranges, set ALL RANGE to ON, then configure each settings.(To configure settings for an individual measurement range, set to OFF)Touch the EXIT key to re-turn to the previous screen.
2 Set conditions.
SPEED Set measurement speed (p. 54).
AVERAGE Configures averaging (p. 56).
DELAY Sets the trigger delay (p. 63). (BASIC tab screen only)
SYNC Configures the trigger synchro-nous output (p. 64) (BASIC tab screen only)
3 Touch the SET key to accept the set-tings.
Touch the CANCEL key to cancel the set-tings and close the dialog box.
4 Touch the EXIT key twice.Displays the measurement screen.
Settings are the same as those described in"3.4 Setting Measurement Conditions (basic settings)" (p. 43).
3
Performing M
easurements in LC
R M
ode
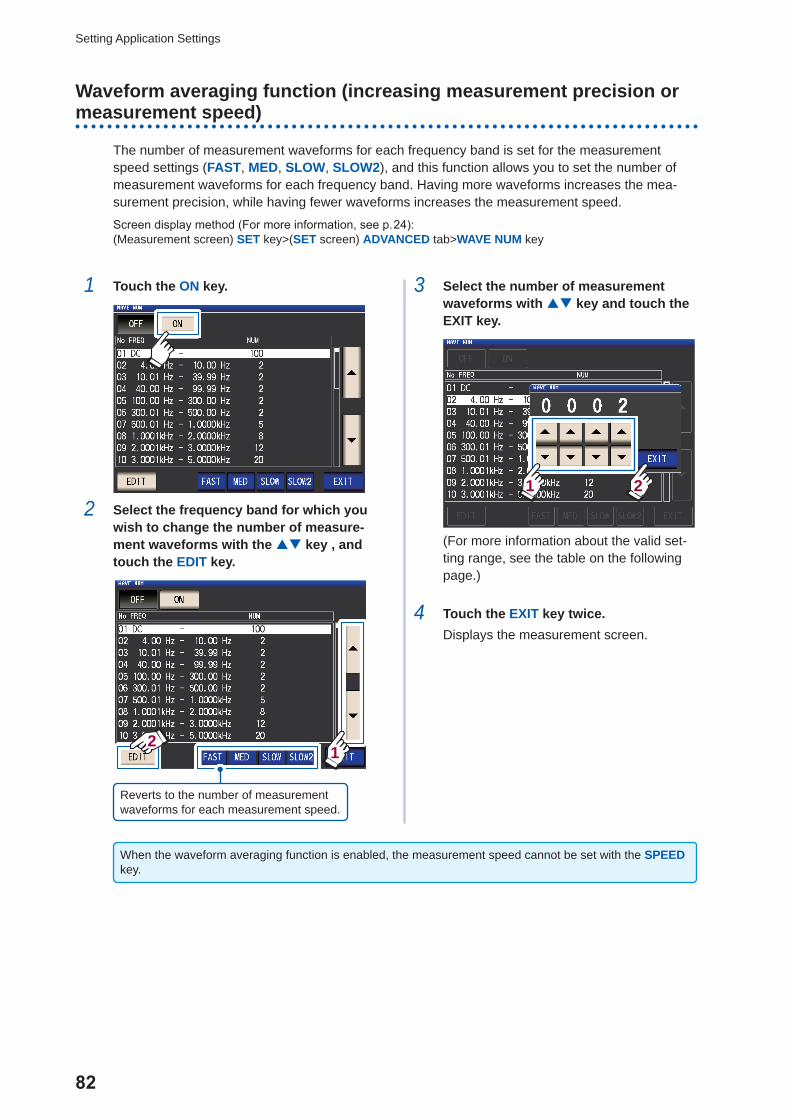
82
Setting Application Settings
Waveform averaging function (increasing measurement precision or measurement speed)
The number of measurement waveforms for each frequency band is set for the measurement speed settings (FAST, MED, SLOW, SLOW2), and this function allows you to set the number of measurement waveforms for each frequency band. Having more waveforms increases the mea-surement precision, while having fewer waveforms increases the measurement speed.
Screen display method (For more information, see p. 24):(Measurement screen) SET key>(SET screen) ADVANCED tab>WAVE NUM key
1 Touch the ON key.
2 Select the frequency band for which you wish to change the number of measure-ment waveforms with the key , and touch the EDIT key.
12
Reverts to the number of measurement waveforms for each measurement speed.
3 Select the number of measurement waveforms with key and touch the EXIT key.
21
(For more information about the valid set-ting range, see the table on the following page.)
4 Touch the EXIT key twice.Displays the measurement screen.
When the waveform averaging function is enabled, the measurement speed cannot be set with the SPEED key.
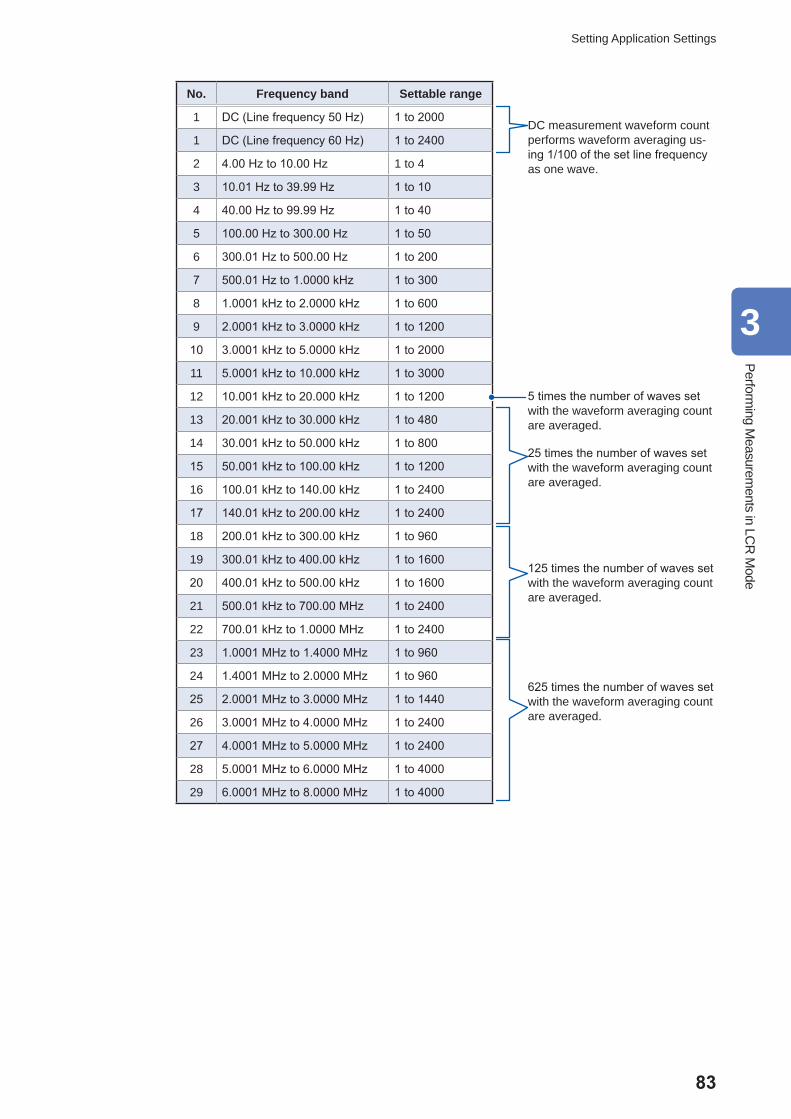
83
Setting Application Settings
No. Frequency band Settable range
1 DC (Line frequency 50 Hz) 1 to 2000
1 DC (Line frequency 60 Hz) 1 to 2400
2 4.00 Hz to 10.00 Hz 1 to 4
3 10.01 Hz to 39.99 Hz 1 to 10
4 40.00 Hz to 99.99 Hz 1 to 40
5 100.00 Hz to 300.00 Hz 1 to 50
6 300.01 Hz to 500.00 Hz 1 to 200
7 500.01 Hz to 1.0000 kHz 1 to 300
8 1.0001 kHz to 2.0000 kHz 1 to 600
9 2.0001 kHz to 3.0000 kHz 1 to 1200
10 3.0001 kHz to 5.0000 kHz 1 to 2000
11 5.0001 kHz to 10.000 kHz 1 to 3000
12 10.001 kHz to 20.000 kHz 1 to 1200
13 20.001 kHz to 30.000 kHz 1 to 480
14 30.001 kHz to 50.000 kHz 1 to 800
15 50.001 kHz to 100.00 kHz 1 to 1200
16 100.01 kHz to 140.00 kHz 1 to 2400
17 140.01 kHz to 200.00 kHz 1 to 2400
18 200.01 kHz to 300.00 kHz 1 to 960
19 300.01 kHz to 400.00 kHz 1 to 1600
20 400.01 kHz to 500.00 kHz 1 to 1600
21 500.01 kHz to 700.00 MHz 1 to 2400
22 700.01 kHz to 1.0000 MHz 1 to 2400
23 1.0001 MHz to 1.4000 MHz 1 to 960
24 1.4001 MHz to 2.0000 MHz 1 to 960
25 2.0001 MHz to 3.0000 MHz 1 to 1440
26 3.0001 MHz to 4.0000 MHz 1 to 2400
27 4.0001 MHz to 5.0000 MHz 1 to 2400
28 5.0001 MHz to 6.0000 MHz 1 to 4000
29 6.0001 MHz to 8.0000 MHz 1 to 4000
DC measurement waveform count performs waveform averaging us-ing 1/100 of the set line frequency as one wave.
5 times the number of waves set with the waveform averaging count are averaged.
25 times the number of waves set with the waveform averaging count are averaged.
125 times the number of waves set with the waveform averaging count are averaged.
625 times the number of waves set with the waveform averaging count are averaged.
3
Performing M
easurements in LC
R M
ode

84
Setting Application Settings
High-Z reject function (detecting contact errors during 2-terminal mea-surement)
This functionality outputs an error when the measurement results exceed a set judgment standard, allowing poor contact to be detected when using a 2-terminal fixture to perform measurement. Er-rors are shown on the measurement screen and output to EXT I/O. Hi Z and the error message will be shown at the top of the measurement screen. (See "11.3 Error Massage and Error Display" (p. 230).)The judgment reference is calculated from the nominal value (range name) of the current measure-ment range and the judgment reference value as shown below.Judgment reference = Nominal value of current measurement range × Judgment reference value (%)Example Current measurement range nominal value: 10 kΩ, Judgment reference value: 150%, Judgment reference = 10 kΩ × 1.50 = 15 kΩ)
Screen display method (For more information, see p. 24):(Measurement screen) SET key>(SET screen) ADVANCED tab>Hi Z key
1 Touch the ON key.
2 Use the keyto set the judgment reference value.
Settable range: 0% to 30000%If you make a mistake during input, touch the C key to cancel the input and start again.
A ratio is set using the range name as the reference value.Example: When the 1 kΩ range is used:A ratio to the value of 1 kΩ is set.
3 Touch the EXIT key twice.Displays the measurement screen.
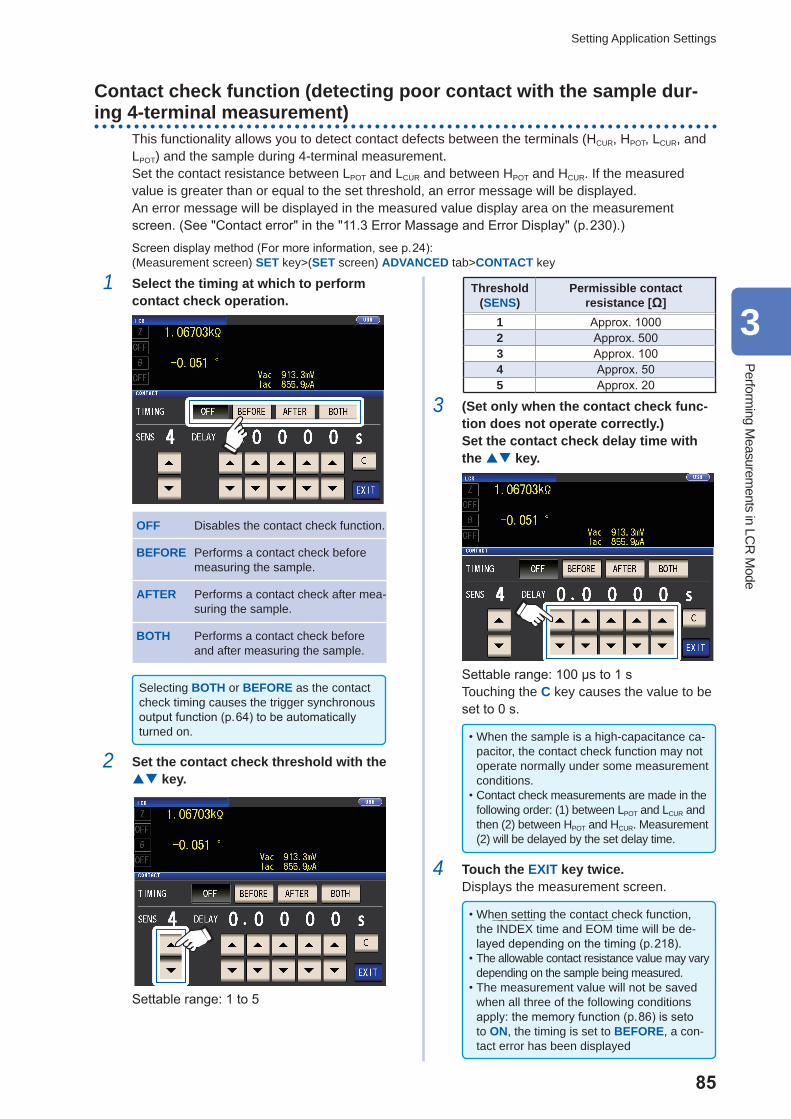
85
Setting Application Settings
Contact check function (detecting poor contact with the sample dur-ing 4-terminal measurement)
This functionality allows you to detect contact defects between the terminals (HCUR, HPOT, LCUR, and LPOT) and the sample during 4-terminal measurement.Set the contact resistance between LPOT and LCUR and between HPOT and HCUR. If the measured value is greater than or equal to the set threshold, an error message will be displayed.An error message will be displayed in the measured value display area on the measurement screen. (See "Contact error" in the "11.3 Error Massage and Error Display" (p. 230).)
Screen display method (For more information, see p. 24):(Measurement screen) SET key>(SET screen) ADVANCED tab>CONTACT key
1 Select the timing at which to perform contact check operation.
OFF Disables the contact check function.
BEFORE Performs a contact check before measuring the sample.
AFTER Performs a contact check after mea-suring the sample.
BOTH Performs a contact check before and after measuring the sample.
Selecting BOTH or BEFORE as the contact check timing causes the trigger synchronous output function (p. 64) to be automatically turned on.
2 Set the contact check threshold with the key.
Settable range: 1 to 5
Threshold (SENS)
Permissible contact resistance [Ω]
1 Approx. 10002 Approx. 5003 Approx. 1004 Approx. 505 Approx. 20
3 (Set only when the contact check func-tion does not operate correctly.)Set the contact check delay time with the key.
Settable range: 100 µs to 1 sTouching the C key causes the value to be set to 0 s.
• When the sample is a high-capacitance ca-pacitor, the contact check function may not operate normally under some measurement conditions.
• Contact check measurements are made in the following order: (1) between LPOT and LCUR and then (2) between HPOT and HCUR. Measurement (2) will be delayed by the set delay time.
4 Touch the EXIT key twice.Displays the measurement screen.
• When setting the contact check function, the INDEX
―――――
time and EOM―――
time will be de-layed depending on the timing (p. 218).
• The allowable contact resistance value may vary depending on the sample being measured.
• The measurement value will not be saved when all three of the following conditions apply: the memory function (p. 86) is seto to ON, the timing is set to BEFORE, a con-tact error has been displayed
3
Performing M
easurements in LC
R M
ode

86
Setting Application Settings
Memory function (saving measurement results)
You can save the measurement results inside the instrument (Up to 32,000 items).This function al-lows you to save previously saved measurement results to the USB flash drive and to acquire them from a computer using the :MEMory? communications command.When using communications commands, the information saved to memory reflects the :MEASure:VALid.For more information about acquiring measurement results stored in memory and how to configure the :MEASure:VALid setting, see the LCR application disc (communications commands).
IMPORTANTChanging the memory function setting will cause data stored in the instrument’s memory to be deleted.
Screen display method (For more information, see p. 24):(Measurement screen) SET key>(SET screen) ADVANCED tab>MEMORY key
1 After touching the OFF key to disable the memory function, use the keys to set the number of measurement results.
1
2
Settable range: 1 to 32000The number of measurement results can only be set when the memory function is set to OFF.
2 Touch the IN key or ON key.
Measured values in the instrument’s memory are deleted once they have been saved to the USB flash drive. The measure-ment values are saved to the MEMORY folder in the USB flash drive. The file name is automatically assigned from the date and time (p. 143).
Clears all of the saved measure-ment valuesfrom the instru-ment memory.
IN Measured values are stored in memo-ry only when all parameters judged by the comparator and BIN measurement yield a pass result. (If even one HI or LO comparator result is received or if the BIN result is OUT OF BINS, the value will not be saved.)
ON Saves all measurement values to memory.
If the comparator and BIN functions have not been configured, the IN and ON keys result in the same operation.
3 Touch the EXIT key twice.Displays the measurement screen.
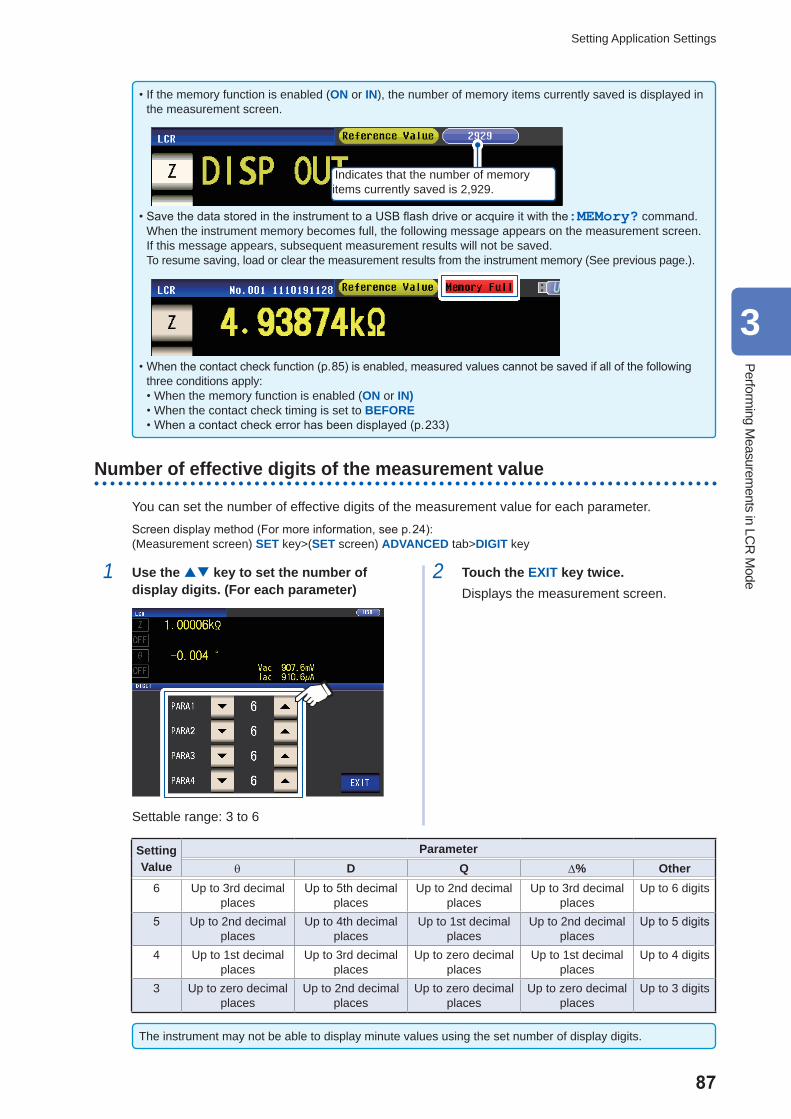
87
Setting Application Settings
• If the memory function is enabled (ON or IN), the number of memory items currently saved is displayed in the measurement screen.
Indicates that the number of memory items currently saved is 2,929.
• Save the data stored in the instrument to a USB flash drive or acquire it with the:MEMory? command.When the instrument memory becomes full, the following message appears on the measurement screen. If this message appears, subsequent measurement results will not be saved.To resume saving, load or clear the measurement results from the instrument memory (See previous page.).
• When the contact check function (p. 85) is enabled, measured values cannot be saved if all of the following three conditions apply: • When the memory function is enabled (ON or IN) • When the contact check timing is set to BEFORE • When a contact check error has been displayed (p. 233)
Number of effective digits of the measurement value
You can set the number of effective digits of the measurement value for each parameter.
Screen display method (For more information, see p. 24):(Measurement screen) SET key>(SET screen) ADVANCED tab>DIGIT key
1 Use the key to set the number of display digits. (For each parameter)
Settable range: 3 to 6
2 Touch the EXIT key twice.Displays the measurement screen.
SettingValue
Parameterθ D Q Δ% Other
6 Up to 3rd decimal places
Up to 5th decimal places
Up to 2nd decimal places
Up to 3rd decimal places
Up to 6 digits
5 Up to 2nd decimal places
Up to 4th decimal places
Up to 1st decimal places
Up to 2nd decimal places
Up to 5 digits
4 Up to 1st decimal places
Up to 3rd decimal places
Up to zero decimal places
Up to 1st decimal places
Up to 4 digits
3 Up to zero decimal places
Up to 2nd decimal places
Up to zero decimal places
Up to zero decimal places
Up to 3 digits
The instrument may not be able to display minute values using the set number of display digits.
3
Performing M
easurements in LC
R M
ode

88
Setting Application Settings
LCD display auto-off (power-saving mode)
You can set whether the LCD display remains on continuously or turns off automatically. Setting the LCD display to OFF causes the LCD display to automatically turn off after there is no panel use for 10 seconds, thereby reducing power consumption. The default setting is ON (i.e., the LCD display remains on continuously). (This setting is linked to the auto-off setting for continuous measurement mode (p. 96).)
Screen display method (For more information, see p. 24):(Measurement screen) SET key>(SET screen) ADVANCED tab>DISP key
1 Touch the OFF key or ON key.
OFF Turns OFF the LCD.The LCD turns off after approxi-mately 10 seconds elapse since the touch panel was last touched.
ON Sets the LCD to always on.
2 Touch the EXIT key twice.Displays the measurement screen.
When you want to turn the backlight on againIf you touch the touch panel while the back-light is off, the backlight will turn on again.The backlight will turn off again if you do not touch the touch panel for about 10 seconds.

89
Setting Application Settings
Key tones and judgment tones
You can set the operation sound and each of the beep sounds for judgment results.
Screen display method (For more information, see p. 24):(Measurement screen) SET key>(SET screen) ADVANCED tab>BEEP key
1 Configure beep tones.
JUDGE: Beep sound settings for when comparator judgment
OFF When a comparator judgment is made, no beep sound is emitted.
When judgment performed with 1 comparator
IN When the comparator result is IN, a beep sound is emitted.
NG When the comparator result is LO or HI, a beep sound is emitted.
When judgment performed with 2 comparators
IN When both of these comparator results are IN, a beep sound is emitted.
NG When either one is LO or HI, a beep sound is emitted.
KEY: Beep sound setting for when key pressed
OFF When a key is pressed, no beep sound is emitted.
ON When a key is pressed, a beep sound is emitted.
TONE: Beep tone type
You can select from four types (A, B, C,
and D).
2 Touch the EXIT key twice.Displays the measurement screen.
If an invalid key is pressed or an operation causes an error, an error tone will sound regardless of whether the beep tone is turned on or off.
3
Performing M
easurements in LC
R M
ode
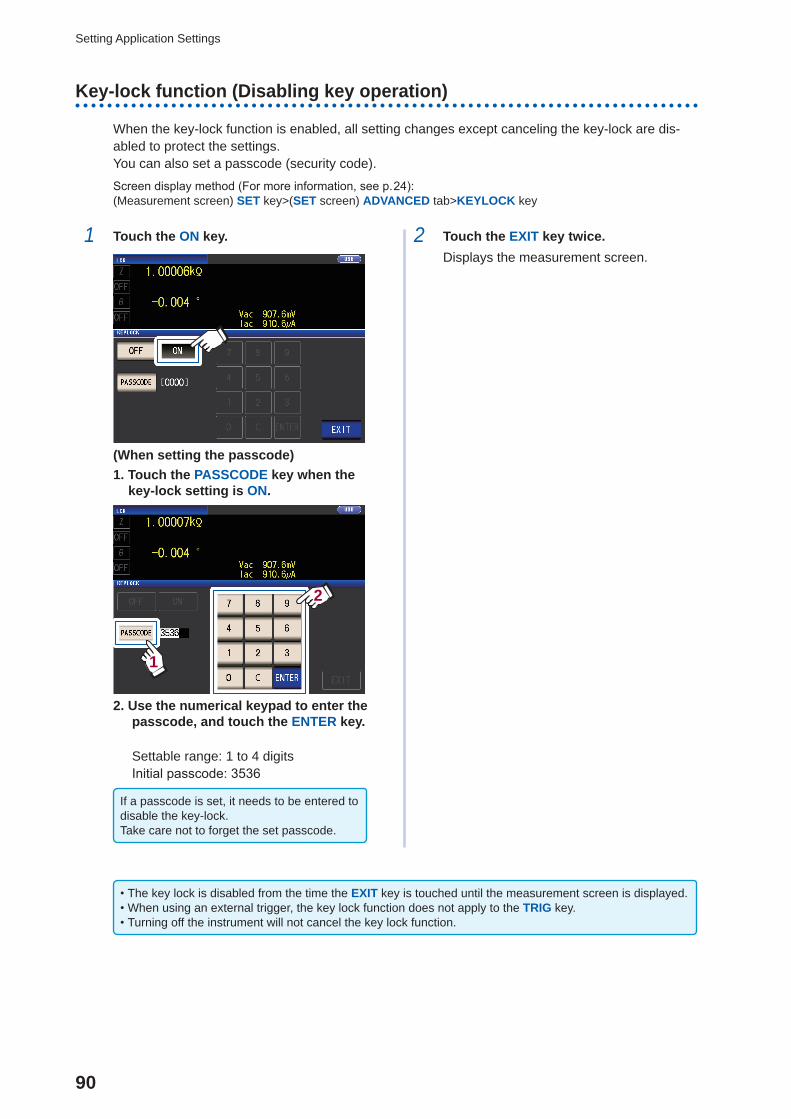
90
Setting Application Settings
Key-lock function (Disabling key operation)
When the key-lock function is enabled, all setting changes except canceling the key-lock are dis-abled to protect the settings.You can also set a passcode (security code).
Screen display method (For more information, see p. 24):(Measurement screen) SET key>(SET screen) ADVANCED tab>KEYLOCK key
1 Touch the ON key.
(When setting the passcode)1. Touch the PASSCODE key when the
key-lock setting is ON.
1
2
2. Use the numerical keypad to enter the passcode, and touch the ENTER key.
Settable range: 1 to 4 digitsInitial passcode: 3536
If a passcode is set, it needs to be entered to disable the key-lock.Take care not to forget the set passcode.
2 Touch the EXIT key twice.Displays the measurement screen.
• The key lock is disabled from the time the EXIT key is touched until the measurement screen is displayed. • When using an external trigger, the key lock function does not apply to the TRIG key. • Turning off the instrument will not cancel the key lock function.

91
Setting Application Settings
Disabling the Key-lock
1 Touch the UNLOCK key when the key-lock is enabled.
2 (When a passcode is set)
Enter the passcode and touch the UN-LOCK key.
The entered passcode is indicated as * on the screen.To cancel input, touch the C key.When you want cancel the disabling of the key-lock, touch the CANCEL key.
If the error indication shown below, check the following items.
Cause Remedy
The UNLOCK key was touched before you entered the pass-code.
Touch the C key and enter the passcode.
The entered pass-code is incorrect.
Touch the C key and enter the passcode again.
If you forget the passcode, perform a full reset to restore the instrument to the factory default settings (See "Performing a full reset (If you are unable to perform a system reset)" (p. 229).)
3
Performing M
easurements in LC
R M
ode

92
Setting Application Settings

93
Setting Which Panels to Use in Continuous Measurement
4 Using Continuous Measurement Mode
In continuous measurement mode, a series of measurement conditions saved using the panel save function (p. 124) are loaded in order, and measurement is performed continuously using multiple different sets of conditions. Measurement can be performed using up to 60 sets of conditions.
First, set the measurement mode to continuous measurement mode (p. 24).
• Setting the measurement conditions so that the measurement frequency or measurement signal level dif-fers for each panel allows you to simply evaluate the characteristics of the test sample.
• Continuous measurement can also be performed from the EXT I/O (p. 165).
4.1 Setting Which Panels to Use in Continuous Mea-surement
Before performing continuous measurement, set which panels to use.Save the measurement conditions with the panel save function in advance.See "6.1 Saving Measurement Conditions and Correction Values (Panel Save Function)" (p. 124).
Screen display method (For more information, see p. 24):(Measurement screen) SET key>(SET screen) BASIC tab
A list of the measurement conditions saved appears.
Any panel for which only the compensation value (ADJ) was saved is not displayed.
1 Use the key to select a panel for which to perform continuous measure-ment, and touch the ON key.
1
2
OFF Removes the selected panel from the targets for continuous mea-surement.
ON Sets the selected panel as a tar-get for continuous measurement.
ALL OFF Removes all panels from the tar-gets for continuous measurement.
ALL ON Sets all panels as targets for con-tinuous measurement.
INFO Display the panel information.
2 Touch the EXIT key.Displays the measurement screen.
4 Using Continuous Measurement Mode
4
Using C
ontinuous Measurem
ent Mode

94
Performing Continuous Measurement
4.2 Performing Continuous MeasurementPerform continuous measurement.
On the measurement screen, a list of the panels selected for use in continuous mea-surement will be shown on the SET screen (BASIC tab).
Touch the TRIG key.
Continuous measurement will start.
To cancel continuous measurement, touch the STOP key.
4.3 Checking Continuous Measurement ResultsMeasurement results can be checked on the measurement screen. If another screen is being dis-played, touch the EXIT key.Measured values for the selected No. 1 parameter and No. 3 parameter will be displayed.
Measrement screen
Panel No.
No. 1 parameter measured value
Measurement resultsComparator measurement:Displays judgment results for the No. 1 and No. 3 parameters.BIN measurement:Displays judgment results for the No. 1 and No. 3 parameters.
Scrolls the screen.
Displays a list of panels for which continuous measurement is to be performed.
No. 3 parameter measured value

95
Changing the Display Timing Setting (When You Wish to Shorten the Screen Update Interval)
4.4 Changing the Display Timing Setting (When You Wish to Shorten the Screen Update Interval)
You can set the display timing during continuous measurement as desired. If the display timing is set to REAL, the time for continuous measurement becomes long because the screen is updated every time measurement is performed.If it is set to AFTER to give priority to the measurement time, the screen update time becomes short. (This is because the screen is updated once after all measurements are complete.)The default setting is REAL.
Screen display method (For more information, see p. 24):(Measurement screen) SET key>(SET screen) ADVANCED tab>DRAW key
1 Touch the AFTER key.
REAL Updates the screen after measure-ment of each panel.
AFTER Displays all after all continuous mea-surements are finished.
2 Touch the EXIT key twice.Displays the measurement screen.
4
Using C
ontinuous Measurem
ent Mode

96
Setting the LCD display auto-off (When You Wish to save the power)
4.5 Setting the LCD display auto-off (When You Wish to save the power)
You can set whether the LCD display remains on continuously or turns off automatically. Setting the LCD display to OFF causes the LCD display to automatically turn off after there is no panel use for 10 seconds, thereby reducing power consumption. The default setting is ON (i.e., the LCD display remains on continuously). (This setting is linked to the auto-off setting for LCD mode [p. 88].)
Screen display method (For more information, see p. 24):(Measurement screen) SET key>(SET screen) ADVANCED tab>DISP key
1 Touch the OFF key.
OFF The LCD turns off after approximately 10 seconds elapse since the touch panel was last touched.
ON Sets the LCD to always on.
2 Touch the EXIT key twice.Displays the measurement screen.
When you want to turn the backlight on again, touch the touch panel.

97
5 Error CorrectionMeasurement cables, probes, and fixtures have stray admittance and residual impedance. Since these characteristics influence measured values, measurement accuracy can be increased by cor-recting for them.
First, set the measurement mode to LCR mode (p. 24).
Settings are configured on the ADJ screen.
Check the following before performing correction: • Turn on the instrument and allow it to warm up for at least 60 min. before performing correction. • The measurement accuracy values defined in the specifications are for when open circuit correction and short circuit correction are performed. Before performing measurement, be sure to perform open correc-tion and short correction.
• Be sure to repeat the correction process after changing measurement cables, probes, or fixtures. You will be unable to obtain correct values if measurement is performed in the correction state prior to replace-ment.
• When performing correction, make sure that there is no noise source nearby. Noise may cause an error when performing correction.ex. Servo Motor, switching power source, high-voltage cable and etc.
• Perform correction under conditions that are similar to the environment in which the sample actually will be measured.
• The corrected value is preserved in the memory of the main instrument even when power is turned off. • Before performing correction, configure the low-Z high-precision mode, cable length, and DC bias settings. Changing any of these settings will invalidate the correction values. (See "Low Z High Accuracy Mode (high-precision measurement) (AC/DC)" (p. 55), "5.1 Setting the Cable Length (Cable Length Correction)" (p. 98), and "DC bias (superimposing a DC voltage on the measurement signal)(AC)" (p. 59).)
5 Error Correction
5
Error C
orrection

98
Setting the Cable Length (Cable Length Correction)
5.1 Setting the Cable Length (Cable Length Correc-tion)
With high frequency measurement, the influence of the cable results in large measurement errors. Setting the cable length enables you to reduce the measurement errors. Use a coaxial cable with 50 Ω impedance.Before performing correction, be sure to set the cable length.
Screen display method (For more information, see p. 27):(Measurement screen) ADJ key>(ADJ screen) CABLE key
1 Select the cable length to be used.
0 m Select this when using a direct-coupled fixture or the like.
1 m Select this when the cable length is 1 m.
2 m Select this when the cable length is 2 m.
4 m Select this when the cable length is 4 m.
2 Touch the EXIT key twice.Displays the measurement screen.
• If the cable length changes, repeat open, short, and load correction. • The guaranteed accuracy range varies with the cable length. (See"E: Coefficient of the measurement cable's length" (p. 215).)
• When manufacturing your own cables, make sure that the cable length matches the length set with the instrument. (See "Points to pay attention to when making your own probe" (p. 35).)
• When using the L2000, 9140-10, 9500-10, L2001, and 9261-10, set cable length compensation to 1 m. • Available range settings vary with the cable length setting. For more information, see p. 211 of "10.6 Measurement Range and Accuracy".

99
Open Correction
5.2 Open CorrectionWith open correction, it is possible to reduce the influence of the floating impedance of the mea-surement cables and thereby to enhance the accuracy of measurement. It is effective for measure-ment samples whose impedance is relatively high.
There are the following three methods for setting the open correction.
All correction • The correction values are obtained for all measurement frequencies (p. 100). • The range of measurement frequencies to correct can be set.See "Correction range limitation function (to shorten the correction time)" (p. 101).
Spot correction The correction values are obtained at the set measurement frequency only (p. 103).
Off Open correction data becomes invalid (p. 111).
Before performing open correction
1 Review the information shown under "Check the following before performing correction:" (p. 97).
2 Follow the instructions in "5.1 Setting the Cable Length (Cable Length Correction)" (p. 98).
3 Arrange the measurement cables, probes, and fixtures as they will be when measurement will actually be performed.Changing the configuration of them may result in correction not being performed properly.For more information about how to connect the instrument, see "2.4 Connecting the Measurement Cables, Probes, or Fixture" (p. 35).
4 Adjust the distance between the HI and LO terminals of the measurement cable or Hioki op-tional probe or fixture to the width of the measurement sample and place them in the open state*.(What constitutes the open state varies with the measurement cable, probe, or fixture being used [p. 2 to p. 5]. For more information, review the appropriate user manual.)*: Defined as when the HCUR terminal and HPOT terminal, as well as the LCUR terminal and the LPOT
terminal, are connected while the HIGH terminal and LOW terminal are not connected.
5 Perform guarding.(See "Appx. 2 Measurement of High Impedance Components" (p. Appx.3).)Perform open correction after completing the above procedure.See "All correction" (p. 100), and "Spot correction" (p. 103).
5
Error C
orrection

100
Open Correction
All correctionSimultaneously acquire the open correction values for all measurement frequencies.
Screen display method (For more information, see p. 27):(Measurement screen) ADJ key>(ADJ screen) OPEN key
1 Touch the ADJUST key.
2 Touch the ALL key and then touch the EXIT key.
12
The OPEN dialog box will be closed, and the previous correction value will be dis-played. (If correction has never been per-formed, the correction values become 0.)
Check that the measurement cable is in an open circuit state.
3 Touch the EXEC key.
Touch when you wish to cancel correction. (The display will return to the screen shown in Step 2 of the process, and the open correction value will remain unchanged.)
The correc-tion range can be limited.(See p. 101)
Correction will start.Correction value acquisition time:Approx. 50 seconds
Touch when you wish to cancel correction.(The display will return to the screen shown in step 2, and the open correction value will remain unchanged.)
The next screen will be displayed once cor-rection has completed normally.
Correction results(Conductance, susceptance)
Correction No.
Measurement frequencies
• You can scroll the screen with the keys.
• Correction can be performed for imped-ances of at least 1 kΩ. If the impedance in the open state is less than 1 kΩ, an error will result.
4 Touch the EXIT key twice.Displays the measurement screen.
• If correction does not complete normally: (p. 109)
• To disable the correction value: (p. 111)

101
Open Correction
Correction range limitation function (to shorten the correction time)
In All correction, correction is performed for the entire frequency range. By setting the minimum and maximum correction frequencies with this function, you can reduce the time required to perform the correction process. The DC on/off setting as well as the correction minimum and maximum fre-quency settings apply to both open and short correction.For more information about the sequence of screens until the AREA key is displayed, see "All cor-rection" (p. 100), and (p. 106).
1 Touch the AREA key.
2 Select DC correction.
Touch when you wish to cancel the configu-ration process.
Touch when you wish to revert the settings to their default values.
ON Performs correction for AC measure-ment and DC measurement.
OFF Performs correction for AC measure-ment only.
3 Touch the MIN key and enter the correc-tion minimum frequency with the nu-meric keypad.
1
2
Settable range: 4 Hz to 8 MHz(default setting: 4 Hz)If you make a mistake, touch the C key to reenter the value.Touch the MIN key to return to the previous screen without changing the settings.
4 Press a unit key to confirm the setting.
• The frequency is not confirmed until a unit key is pressed.
• If you attempt to set a measurement fre-quency greater than 8 MHz, it will automati-cally be reduced to 8 MHz.
• If you attempt to set a measurement fre-quency lower than 4 Hz, it will automatically be increased to 4 Hz.
The display will return to the screen shown in step 2.
5 Touch the MAX key and enter the cor-rection maximum frequency with the numeric keypad.Settable range: 4 Hz to 8 MHz(default setting: 8 MHz)
x
Correction cannot be performed if limits are applied using a range that exceeds the maxi-mum valid frequency setting (see p. 215) for each cable length. Correction will be per-formed up to the maximum valid frequency setting for the set cable length if limits are applied using a range that exceeds the maxi-mum valid frequency setting (see p. 215) for each cable length.
5
Error C
orrection

102
Open Correction
6 Touch the SET key.The display will return from the ADJ>OPEN screen.
• If the maximum correction frequency is less than the minimum correction frequency, the maximum and minimum correction frequen-cies will be switched automatically.
• If the default settings are being used, the instru-ment will display MINIMUM and MAXIMUM.
7 Touch the EXEC key.Correction will be performed. Please wait for the process to complete.
8 Touch the EXIT key twice.Displays the measurement screen.

103
Open Correction
Spot correctionAcquire the correction values at the set measurement frequencies. Measurement frequencies can be set for up to five points.
Screen display method (For more information, see p. 27):(Measurement screen) ADJ key>(ADJ screen) OPEN key
1 Touch the ADJUST key.
2 Touch the SPOT key and then touch the EXIT key.
1
2
3 Select the correction point you want to set or edit with the key, and touch the EDIT key.
2
1
Touch when you wish to cancel correction.(The instrument will return to the screen shown in step 2.)
4 Enter the frequency to correct with the numeric keypad and touch the SET key to accept the setting.
1
2
The previous value will be displayed until you enter a value.
• Settable range: DC, 4 Hz to 8 MHz*
*: The maximum frequency varies with the cable length (p. 215).
• Touch the C key to cancel input.
• If you attempt to set a measurement fre-quency greater than the maximum fre-quency for each cable length setting, it will automatically be reduced to the maximum frequency for each cable length setting.
• If you attempt to set a measurement fre-quency lower than 4 Hz, it will automatically be increased to 4 Hz.
The correction values from last time are displayed in a confirmation screen.
Check that the measurement cable is in an open circuit state.
5
Error C
orrection
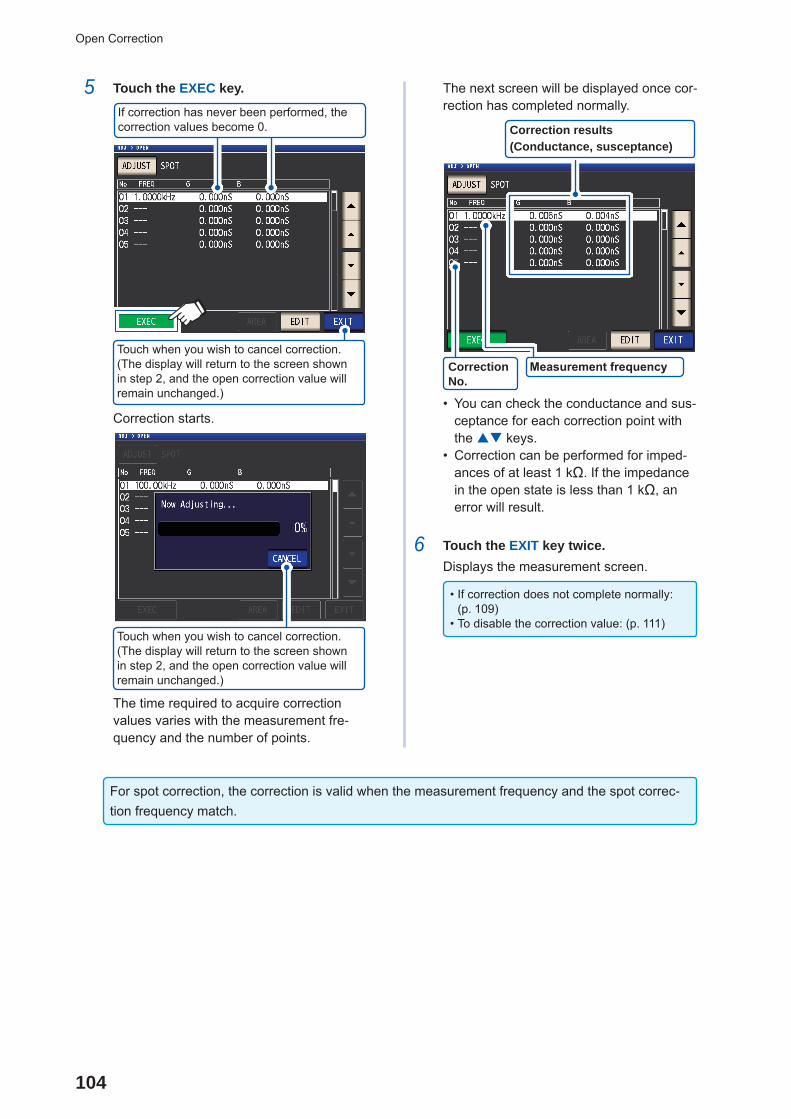
104
Open Correction
5 Touch the EXEC key.
Touch when you wish to cancel correction.(The display will return to the screen shown in step 2, and the open correction value will remain unchanged.)
If correction has never been performed, the correction values become 0.
Correction starts.
Touch when you wish to cancel correction.(The display will return to the screen shown in step 2, and the open correction value will remain unchanged.)
The time required to acquire correction values varies with the measurement fre-quency and the number of points.
The next screen will be displayed once cor-rection has completed normally.
Correction results(Conductance, susceptance)
Correction No.
Measurement frequency
• You can check the conductance and sus-ceptance for each correction point with the keys.
• Correction can be performed for imped-ances of at least 1 kΩ. If the impedance in the open state is less than 1 kΩ, an error will result.
6 Touch the EXIT key twice.Displays the measurement screen.
• If correction does not complete normally: (p. 109)
• To disable the correction value: (p. 111)
For spot correction, the correction is valid when the measurement frequency and the spot correc-tion frequency match.
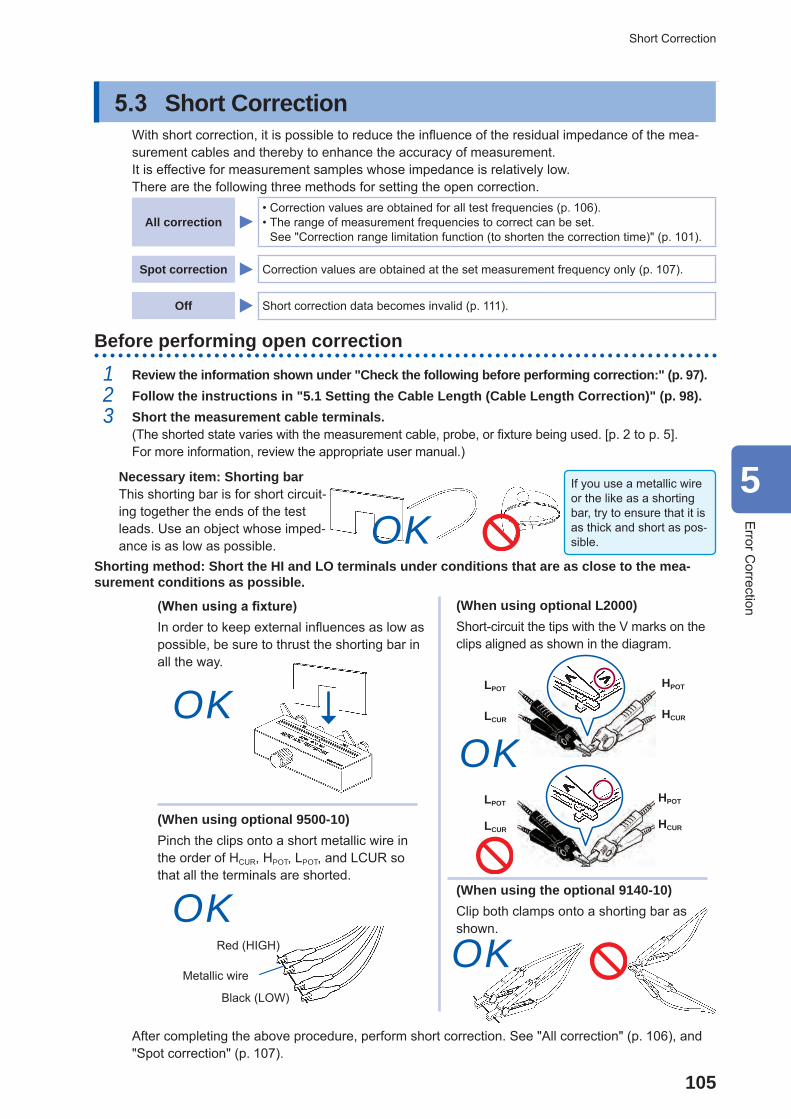
105
Short Correction
5.3 Short CorrectionWith short correction, it is possible to reduce the influence of the residual impedance of the mea-surement cables and thereby to enhance the accuracy of measurement.It is effective for measurement samples whose impedance is relatively low.There are the following three methods for setting the open correction.
All correction • Correction values are obtained for all test frequencies (p. 106). • The range of measurement frequencies to correct can be set.See "Correction range limitation function (to shorten the correction time)" (p. 101).
Spot correction Correction values are obtained at the set measurement frequency only (p. 107).
Off Short correction data becomes invalid (p. 111).
Before performing open correction
1 Review the information shown under "Check the following before performing correction:" (p. 97).2 Follow the instructions in "5.1 Setting the Cable Length (Cable Length Correction)" (p. 98).3 Short the measurement cable terminals.
(The shorted state varies with the measurement cable, probe, or fixture being used. [p. 2 to p. 5]. For more information, review the appropriate user manual.)
Necessary item: Shorting barThis shorting bar is for short circuit-ing together the ends of the test leads. Use an object whose imped-ance is as low as possible.
If you use a metallic wire or the like as a shorting bar, try to ensure that it is as thick and short as pos-sible.OK
Shorting method: Short the HI and LO terminals under conditions that are as close to the mea-surement conditions as possible.
HPOT
HPOT
HCUR
HCUR
OK
OKOK
(When using a fixture)In order to keep external influences as low as possible, be sure to thrust the shorting bar in all the way.
(When using optional L2000)Short-circuit the tips with the V marks on the clips aligned as shown in the diagram.
OK
LPOT
LPOT
LCUR
LCUR
(When using the optional 9140-10)Clip both clamps onto a shorting bar as shown.
(When using optional 9500-10)Pinch the clips onto a short metallic wire in the order of HCUR, HPOT, LPOT, and LCUR so that all the terminals are shorted.
Red (HIGH)
Black (LOW)
Metallic wire
After completing the above procedure, perform short correction. See "All correction" (p. 106), and "Spot correction" (p. 107).
5
Error C
orrection

106
Short Correction
All correctionSimultaneously acquire the short correction values for all measurement frequencies.
Screen display method (For more information, see p. 27):(Measurement screen) ADJ key>(ADJ screen) SHORT key
1 Touch the ADJUST key.
2 Touch the ALL key, and then touch the EXIT key.
12
The correction values from last time are displayed in a confirmation screen.(If correction has never been performed, the correction values become 0.)
Check that the measurement cable is in an short circuit state.
3 Touch the EXEC key.
Touch when you wish to cancel correction.(The dis-play will return to the screen shown in step 2, and the short correction value will remain unchanged.)
The correction range can be limited. (p. 101)
Correction starts.Compensation value acquisition time: Approx. 50 seconds
Touch when you wish to cancel correction.(The display will return to the screen shown in step 2, and the short correction value will remain unchanged.)
The next screen will be displayed once cor-rection has completed normally.
Correction results(Effective resistance, reactance)
Correction No.
Measurement frequency
• You can check the effective resistance and reactance at each correction point with the keys.
• The possible correction range is 1 kΩ or less for impedance. Correction cannot be performed if the measured value (cable or fixture residual impedance) is 1 kΩ or greater.
4 Touch the EXIT key twice.Displays the measurement screen.
• If correction does not complete normally: (p. 109)
• To disable the correction value: (p. 111)

107
Short Correction
Spot correctionAcquire the correction values at the set measurement frequencies. Measurement frequencies can be set for up to five points.
Screen display method (For more information, see p. 27):(Measurement screen) ADJ key>(ADJ screen) SHORT key
1 Touch the ADJUST key.
2 Touch the SPOT key, and then touch the EXIT key.
1
2
3 Select the correction point you want to set or edit with the key, and touch the EDIT key.
2
1
Touch when you wish to cancel correction.(The instrument will return to the screen shown in step 2)
4 Enter a frequency for correction, and touch the SET key to confirm it.
1
2
Until one of these keys is pressed for input of a numerical value, the previous frequency for which Spot correction was performed is displayed.
• Settable range: DC, 4 Hz to 8 MHz*
*: The maximum frequency varies with the cable length (p. 215).
• Touch the C key to cancel input.
• If you attempt to set a measurement fre-quency greater than the maximum fre-quency for each cable length setting, it will automatically be reduced to the maximum frequency for each cable length setting.
• If you attempt to set a measurement fre-quency lower than 4 Hz, it will automatically be increased to 4 Hz.
The correction values from last time are dis-played in a confirmation screen.
Check that the measurement cable is in an short circuit state.
5
Error C
orrection
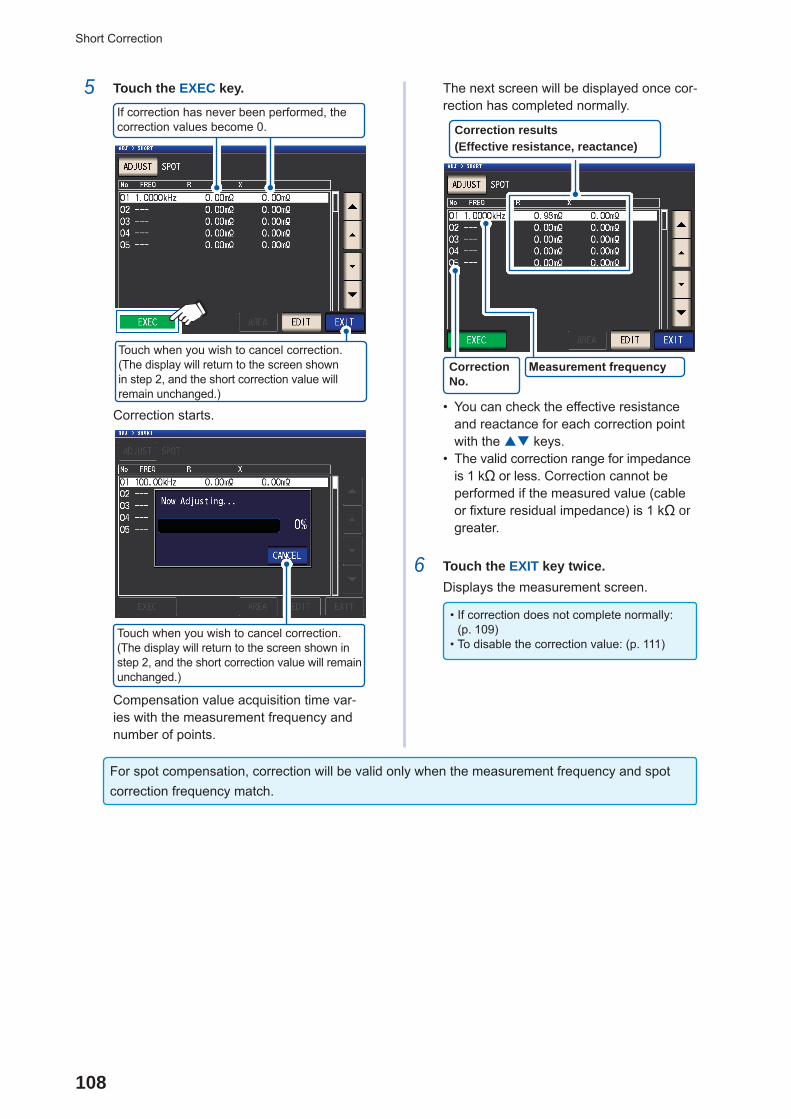
108
Short Correction
5 Touch the EXEC key.
Touch when you wish to cancel correction. (The display will return to the screen shown in step 2, and the short correction value will remain unchanged.)
If correction has never been performed, the correction values become 0.
Correction starts.
Touch when you wish to cancel correction.(The display will return to the screen shown in step 2, and the short correction value will remain unchanged.)
Compensation value acquisition time var-ies with the measurement frequency and number of points.
The next screen will be displayed once cor-rection has completed normally.
Correction results(Effective resistance, reactance)
Correction No.
Measurement frequency
• You can check the effective resistance and reactance for each correction point with the keys.
• The valid correction range for impedance is 1 kΩ or less. Correction cannot be performed if the measured value (cable or fixture residual impedance) is 1 kΩ or greater.
6 Touch the EXIT key twice.Displays the measurement screen.
• If correction does not complete normally: (p. 109)
• To disable the correction value: (p. 111)
For spot compensation, correction will be valid only when the measurement frequency and spot correction frequency match.
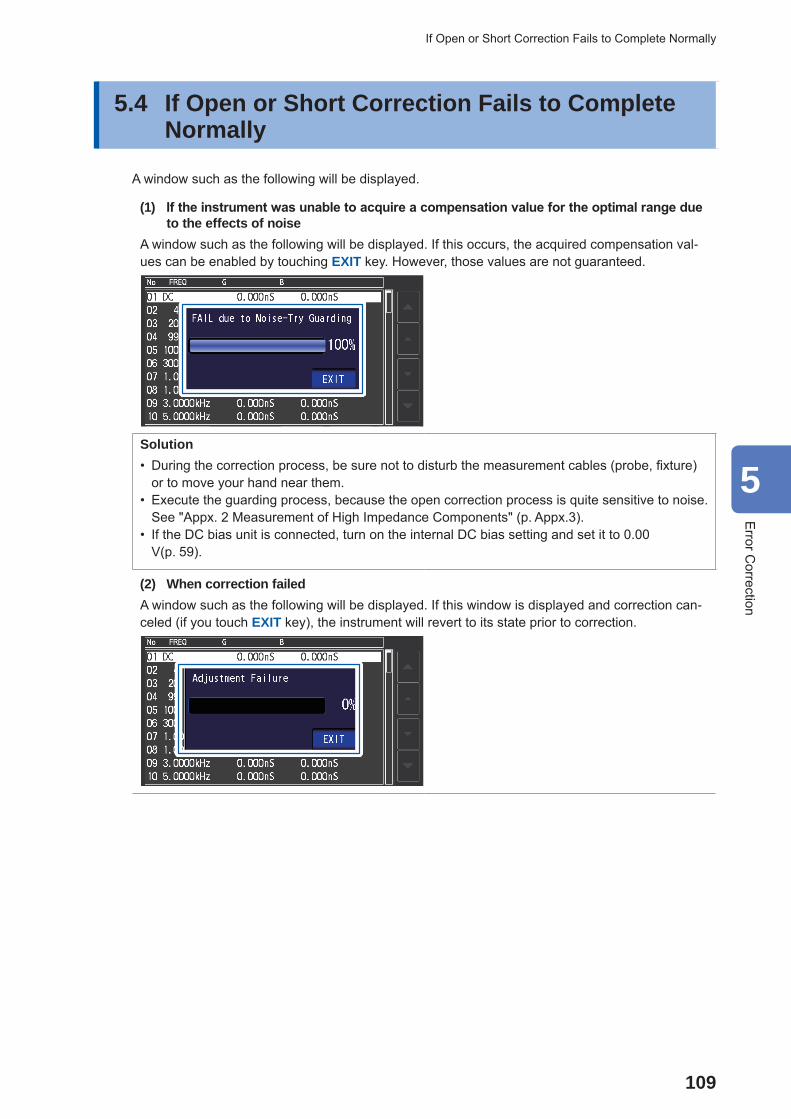
109
If Open or Short Correction Fails to Complete Normally
5.4 If Open or Short Correction Fails to Complete Normally
A window such as the following will be displayed.
(1) If the instrument was unable to acquire a compensation value for the optimal range due to the effects of noise
A window such as the following will be displayed. If this occurs, the acquired compensation val-ues can be enabled by touching EXIT key. However, those values are not guaranteed.
Solution • During the correction process, be sure not to disturb the measurement cables (probe, fixture) or to move your hand near them.
• Execute the guarding process, because the open correction process is quite sensitive to noise.See "Appx. 2 Measurement of High Impedance Components" (p. Appx.3).
• If the DC bias unit is connected, turn on the internal DC bias setting and set it to 0.00 V(p. 59).
(2) When correction failedA window such as the following will be displayed. If this window is displayed and correction can-celed (if you touch EXIT key), the instrument will revert to its state prior to correction.
5
Error C
orrection
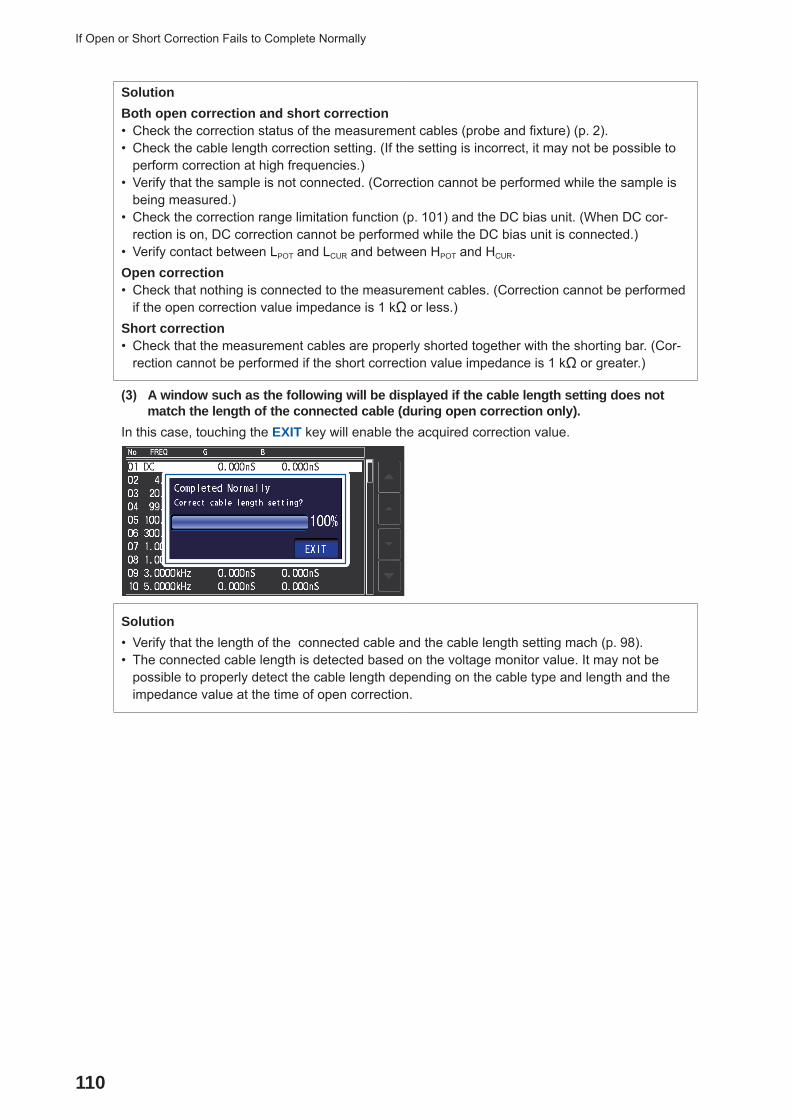
110
If Open or Short Correction Fails to Complete Normally
SolutionBoth open correction and short correction • Check the correction status of the measurement cables (probe and fixture) (p. 2). • Check the cable length correction setting. (If the setting is incorrect, it may not be possible to perform correction at high frequencies.)
• Verify that the sample is not connected. (Correction cannot be performed while the sample is being measured.)
• Check the correction range limitation function (p. 101) and the DC bias unit. (When DC cor-rection is on, DC correction cannot be performed while the DC bias unit is connected.)
• Verify contact between LPOT and LCUR and between HPOT and HCUR.Open correction • Check that nothing is connected to the measurement cables. (Correction cannot be performed if the open correction value impedance is 1 kΩ or less.)
Short correction • Check that the measurement cables are properly shorted together with the shorting bar. (Cor-rection cannot be performed if the short correction value impedance is 1 kΩ or greater.)
(3) A window such as the following will be displayed if the cable length setting does not match the length of the connected cable (during open correction only).
In this case, touching the EXIT key will enable the acquired correction value.
Solution • Verify that the length of the connected cable and the cable length setting mach (p. 98). • The connected cable length is detected based on the voltage monitor value. It may not be possible to properly detect the cable length depending on the cable type and length and the impedance value at the time of open correction.

111
Disabling Open and Short Correction Values
5.5 Disabling Open and Short Correction ValuesTurning off the correction setting will disable the correction values you have acquired.
Screen display method (For more information, see p. 27):To disable open correction: (Measurement screen) ADJ key>(ADJ screen) OPEN key To disable short correction: (Measurement screen) ADJ key>(ADJ screen) SHORT key
1 Touch the ADJUST key. 2 Touch the OFF key and then touch the
EXIT key.
12
3 Touch the EXIT key twice.Displays the measurement screen.
The correction values that are stored internally are not cleared by the operation described above. When ALL or SPOT is selected, the stored correction values can be used.
5
Error C
orrection

112
Load Correction (Correcting Values to Match Reference Values)
5.6 Load Correction (Correcting Values to Match Reference Values)
This section describes how to correct measured values based on a reference sample.A sample with a known measured value is measured. Then a correction coefficient is calculated and used to correct future measured values. The correction coefficient can be acquired using up to five compensation conditions.Up to five sets of correction conditions can be saved.
You can configure the following seven settings (in order) for each set of correction conditions:
1.Correction frequencyFREQ (p. 115)
Define the measurement fre-quency used to measure and correct the reference sample.
2. Correction rangeRANGE (p. 115) Set the range to correct.
3.Correction signal levelLEVEL (p. 116)
Set the type and value of the measurement signal mode to correct.
4. DC biasDC BIAS (p. 117)
Enable or disable DC bias and set the value.
5. Parameter type MODE (p. 117)
Set the parameter to use as the reference value.
6. Reference value 1REF1 (p. 118)
Set the Z/ Cs/ Cp/ Ls/ Lp/ Rs reference value selected for the parameter type.
7. Reference value 2REF2 (p. 118)
Set the θ/ D/ Rs/ Rp/ Q/ X reference value selected for the parameter type.
Resets the correction conditions (p. 119).
The correction coefficient is computed from the reference values of Z and θ obtained from the set values and the actual data acquired from the reference sample at each of the correction frequen-cies.
Correction coefficient of Z = (Reference value of Z)
(Actual data of Z)
Correction value of θ = (Reference value of θ) - (Actual data of θ)
The measured values of Z and θ are first compensated using the following equations, and then indi-vidual parameters from the compensated Z and θ values are employed.
Z = (Z before correction) × (Correction coefficient of Z)
θ = (θ before correction) + (Correction value of θ)

113
Load Correction (Correcting Values to Match Reference Values)
Procedures for the load correctionOnce you have set the measurement cable length, use the following procedure to configure the load correction conditions and perform correction.(See "5.1 Setting the Cable Length (Cable Length Correction)" (p. 98).)
Screen display method (For more information, see p. 27):(Measurement screen) ADJ key>(ADJ screen) LOAD key
1 Touch the ADJUST key.
2 Touch the ON key, and then touch the EXIT key.
2
1
3 Select the correction point to configure with the keys and then touch the EDIT key.
2 1
4 Set the correction conditions in the fol-lowing order and then touch the SET key:1. FREQ(p. 115)2. RANGE(p. 115)3. LEVEL(p. 116)4. DC BIAS: (p. 117)5. MODE: (p. 117)6. REF1, REF2: (p. 118)
Allows you to set the current measurement conditions as the load correction conditions. (After touching the GET key, touch the SET key to accept the settings.)
Touch to cancel con-figuration of the cor-rection conditions. (The display will return to the screen shown in step 3, and the correction con-ditions will remain unchanged.)
• You cannot skip ahead in the order of settings. • Correction cannot be performed if all set-tings have not been configured.
• When you acquire measurement conditions with the GET key, the parameters used as reference values (p. 118) will be initialized to Z - θ, and the reference values (REF1 and REF2) will be cleared.
5 Connect the reference sample to the measurement cable.
6 Touch the EXEC key, the correction val-ues are acquired.
• A beep will sound if an error occurs while acquiring correction values. In this case, the correction values will be invalid (p. 119).
• After acquiring correction values, the acquired values will become invalid if any correction con-dition is changed.
5
Error C
orrection
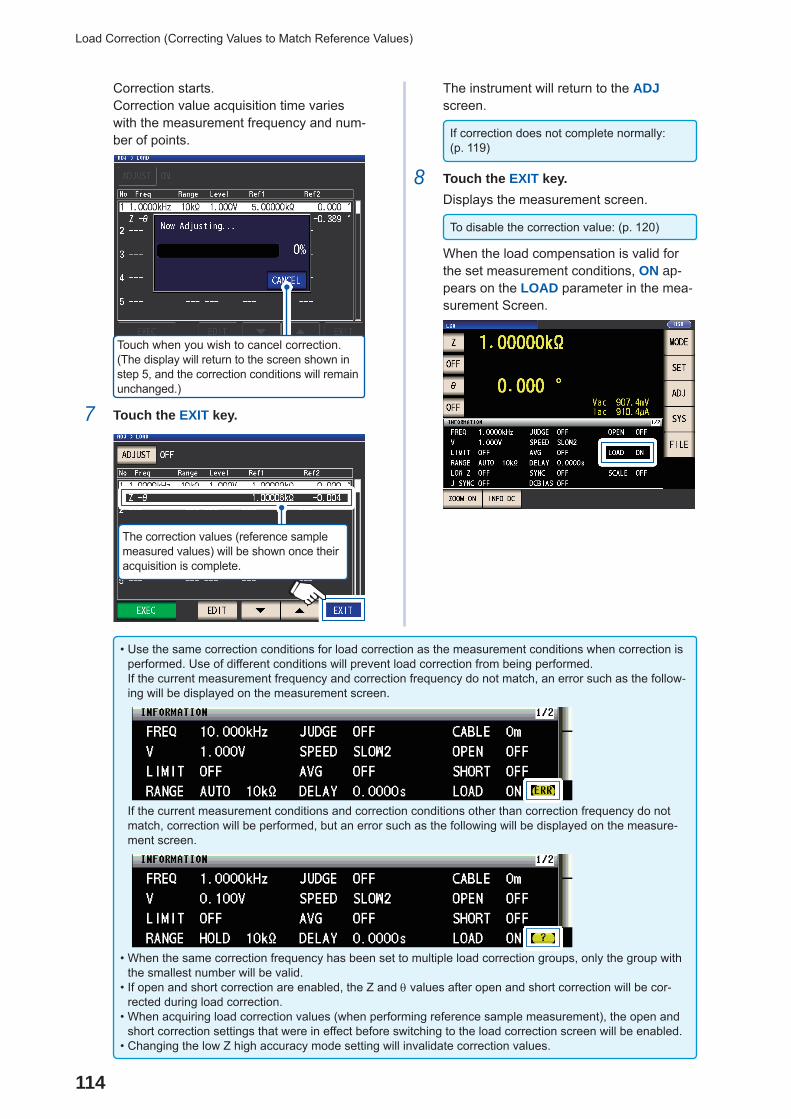
114
Load Correction (Correcting Values to Match Reference Values)
Correction starts.Correction value acquisition time varies with the measurement frequency and num-ber of points.
Touch when you wish to cancel correction.(The display will return to the screen shown in step 5, and the correction conditions will remain unchanged.)
7 Touch the EXIT key.
The correction values (reference sample measured values) will be shown once their acquisition is complete.
The instrument will return to the ADJ screen.
If correction does not complete normally: (p. 119)
8 Touch the EXIT key.Displays the measurement screen.
To disable the correction value: (p. 120)
When the load compensation is valid for the set measurement conditions, ON ap-pears on the LOAD parameter in the mea-surement Screen.
• Use the same correction conditions for load correction as the measurement conditions when correction is performed. Use of different conditions will prevent load correction from being performed. If the current measurement frequency and correction frequency do not match, an error such as the follow-ing will be displayed on the measurement screen.
If the current measurement conditions and correction conditions other than correction frequency do not match, correction will be performed, but an error such as the following will be displayed on the measure-ment screen.
• When the same correction frequency has been set to multiple load correction groups, only the group with the smallest number will be valid.
• If open and short correction are enabled, the Z and θ values after open and short correction will be cor-rected during load correction.
• When acquiring load correction values (when performing reference sample measurement), the open and short correction settings that were in effect before switching to the load correction screen will be enabled.
• Changing the low Z high accuracy mode setting will invalidate correction values.

115
Load Correction (Correcting Values to Match Reference Values)
Setting the correction frequency
1 Touch the FREQ key. 2 Enter the correction frequency with the numeric keypad, and touch the unit key to confirm the setting.
2
Touch when you wish to perform load correction during DC measurement.
1
Touch when you wish to cancel input. (This dialog box will be closed.)
Settable range: DC, 4 Hz to 8 MHz*
*: The maximum frequency varies with the cable length (p. 215).
If you make a mistake, touch the C key to reenter the value.
3 Touch the EXIT key.The dialog box will be closed.
Selecting the correction range
1 Touch the RANGE key. 2 Select the range for correction.
Touch when you wish to enable LOW Z op-eration.
3 Touch the EXIT key.The dialog box will be closed.
The selection of available ranges will vary with the correction frequency. For more information, see p. 211 of "10.6 Measurement Range and Accuracy".
5
Error C
orrection

116
Load Correction (Correcting Values to Match Reference Values)
Setting the measurement signal mode and level value for the correction signal level
1 Touch the LEVEL key.
2 Select the correction signal level measure-ment signal mode.
V Open circuit voltage (V) mode (p. 50)
CV Constant voltage (CV) mode (p. 50)
CC Constant current (CC) mode (p. 51)
3 Enter the voltage level or current level with the keys.
For settable range, see the following table.
4 Touch the EXIT key.The dialog box will be closed.
Since load correction when the frequency is set to DC is fixed to 1 V in open voltage (V) mode, the correc-tion signal level cannot be set.
LOW Z Range V, CV
OFF All range 1 V (fixed)
ON All range 1 V (fixed)
Valid voltage level and current level setting range (load correction during AC measurement)
V, CVLOW Z Range V, CV
OFF All range 4 Hz to 1.0000 MHz: 0.010 V to 5.000 V
1.0001 MHz to 8 MHz: 0.010 V to 1.000 V
ON All range 0.010 V to 1.000 V
CCLOW Z Range CC
OFF All range 4 Hz to 1.0000 MHz:0.01 mA to 50.00 mA
1.0001 MHz to 8 MHz:0.01 mA to 10.00 mA
ON All range 0.01 mA to 100.00 mA

117
Load Correction (Correcting Values to Match Reference Values)
Setting the DC bias
1 Touch the DC BIAS key.
2 Touch the ON key and enter the DC bias value with the keys.
1
2
Settable range: 0 V to 2.5 VIf you make a mistake, touch the C key to reenter the value.
3 Touch the EXIT key.The dialog box will be closed.
When low Z high-precision mode (p. 55) is enabled, the valid setting range will differ (from 0 V to 1 V).
When DC is selected for the compensation frequency setting, the DC bias setting cannot be set.
Selecting the parameters to use as reference values
1 Touch the MODE key. 2 Select the parameter mode of the refer-ence value to be set.
3 Touch the EXIT key.The dialog box will be closed.
See "Parameters" (p. 40).
• When DC is selected for the correction frequency setting, DC measurement (Rdc) is selected automati-cally and the parameter to use for the reference value setting cannot be set.
• If you change the parameter to use as the reference value, the settings of reference value 1 and reference value 2 are cleared. (See "Setting reference values" (p. 118).)
5
Error C
orrection
118
Load Correction (Correcting Values to Match Reference Values)
Setting reference values
Enter the reference value for the parameter displayed to the left of the parameter mode for REF1 and the reference value for the parameter displayed to the right of the parameter mode for REF2.
1 Touch the REF1 key.
2 Enter the reference value with the nu-meric keypad and touch a unit key to accept the setting.
2
Uses a multiple of ×1. (Touching EXIT without touching a unit key will also cause a multiple of ×1 to be used.)
Touch when you wish to cancel input. (This dialog box will be closed.)
1
Settable range:Same as the maximum display range for the selected parameter.(See "10.1 General Specifications" (p. 187))If you make a mistake, touch the C key to reenter the value.
3 Touch the EXIT key.The dialog box will be closed.
4 Touch the REF2 key and set the refer-ence value in the same manner.
When DC is selected for the correction frequency setting, only reference value 1 can be set.

119
Load Correction (Correcting Values to Match Reference Values)
To reset the correction condition settings
This section describes how to clear all settings for the selected correction condition number.
Screen display method (For more information, see p. 27):(Measurement screen) ADJ key>(ADJ screen) LOAD key
1 Select the correction condition number to reset with the keys and then touch the EDIT key.
2 1
2 Touch the RESET key and then touch the SET key.
Touch when you wish to cancel the reset. (This dialog box will be closed.)
1 2
3 Touch the EXIT key twice.Displays the measurement screen.
When load correction fails to complete normally
If correction fails, a window like the following appears. Touch EXIT to close the window and then configure the correction conditions again.
5
Error C
orrection

120
Load Correction (Correcting Values to Match Reference Values)
Disabling load correction
You can disable correction by setting the correction setting to OFF.
Screen display method (For more information, see p. 27):(Measurement screen) ADJ key>(ADJ screen) LOAD key
1 Touch the ADJUST key. 2 Touch the OFF key, and then touch the
EXIT key.
12
3 Touch the EXIT key twice.Displays the measurement screen.
121
Correcting Measured Values with a User-specified Correction Coefficient (Correlation Correction)
5.7 Correcting Measured Values with a User-specified Correction Coefficient (Correlation Correction)
This functionality enables you to correct measured values using a user-specified correction coef-ficient. This function can be used to provide compatibility among measurement devices.
Set the correction coefficients A and B for the measurement values of No. 1 to No. 4 parameters to correct by the expression on the right.(See "Appx. 1 Measurement Parameters and Calculation Formula" (p. Appx.1).)
Y = A × X + B
However, if the parameter corresponding to X is either D or Q, scaling is applied to θ as shown in the expression on the right, and then D or Q is obtained from θ '.
θ' = A × θ + B
X: No. 1 or No. 3 parameter measurement value Y: the last measurement value θ': correction value of θA: integration value of the measured value X B: the value added to measured value X
Screen display method (For more information, see p. 27):(Measurement screen) ADJ key>(ADJ screen) SCALE key
1 Touch the ON key, and then touch the EXIT key.
1
2
When you wish to cancel scalingTouch OFF.
2 Select the correction coefficient of the parameter you want to change.
The parameters and correction coefficient numbers correspond as shown below.
SCALE1 No. 1 parameter
SCALE2 No. 2 parameter
SCALE3 No. 3 parameter
SCALE4 No. 4 parameter
3 Touch the A key.
Touch when you wish to revert the setting to the default value.
Touch when you wish to cancel the setting.
4 Set correction coefficient A with the numeric keypad and then touch the EN-TER key.
1 2
Settable range: -999.999 to 999.999If you make a mistake, touch the C key to reenter the value.
Touching ENTER while nothing is being dis-played (while touching the C key) will close the dialog box without changing the setting.
The display will return to the screen shown in step 3.
5
Error C
orrection

122
Correcting Measured Values with a User-specified Correction Coefficient (Correlation Correction)
5 Touch the B key.
6 Enter the correction coefficient B with the numeric keypad, and touch the EN-TER key to accept the value.
21
×103 Step the units up.
1/103 Step the units down.
Units: a/ f/ p/ n/ µ/ m/ none/ k/ M/ GSettable range: -9.99999G to 9.99999G
If you make a mistake, touch the C key to reenter the value.
To close the dialog box without making any change to the set value, press the ENTER key when the screen is in the state with noth-ing being displayed (the state after touching the C key).
7 Touch the SET key.
8 Touch the EXIT key.Displays the measurement screen.
If you select the same parameter multiple times and set a different correction coefficient for each, scaling will be performed using the correction coefficient for the parameter with the lowest number. (The correction coefficients of the other parameter numbers become invalid.)
Example: In the case of the following settings, scaling is performed using the correction coefficient of No. 1 parameter for all Z of No. 1, 2, and 4 parameters. (The correction coefficients of No. 2 and 4 parameters are invalid.)
Display Parameter Setting Correction Coefficient Setting
No. 1 Parameter: Z A = 1.500, B = 1.50000
No. 2 Parameter: Z A = 1.700, B = 2.50000
No. 3 Parameter: θ A = 0.700, B = 1.00000
No. 4 Parameter: Z A = 1.900, B = 3.50000
123
6Saving and Loading Measure-ment Condition and Correction Value Data
This section describes how to save measurement condition data and correction value data in the instrument’s memory as well as how to load that data.
(Measurement conditions and correction values at the time the green SAVE key on the measure-
ment screen is touched will be saved.)
Data is saved as a panel.On the screen, measurement condition data is displayed as LCR, while correction value data is displayed as ADJ.
Example:Measurement conditions and cor-rection values have been saved as panel No. 1.
Correction values have been saved as panel No. 3.
Measurement conditions have been saved as panel No. 5.
First, set the measurement mode to LCR mode (p. 24).
Settings can be configured on the SET screen.
Panel save function (p. 124) Saves measurement conditions and correction values as a panel.
Panel load function (p. 128) Loads a panel.
Editing panel data • Changes the panel name (p. 129). • Deletes the panel (p. 130).
• The instrument contains a built-in backup lithium battery which offers a service life of about ten years. • When the life of the built-in lithium battery ends, the measurement conditions will no longer be able to be saved. Contact your authorized Hioki distributor or reseller.
6 Saving and Loading Measurement Condition and Correction Value Data
6
Saving and Loading M
easurement C
ondition and Correction Value D
ata

124
Saving Measurement Conditions and Correction Values (Panel Save Function)
6.1 Saving Measurement Conditions and Correction Values (Panel Save Function)
This section describes how to save measurement condition data and correction value data in the instrument’s memory. The following number of data sets can be saved:(Measurement condition: Up to 60 items, Correction value: Up to 128 items)
First, select the data type you wish to save. You can select from three types (see procedure below). Then, save the selected type of data to a panel (See p. 126).
Setting the type of data to save
Screen display method (For more information, see p. 24.)(Measurement screen) SET key>(SET screen) ADVANCED tab>PANEL key
1 Touch the SAVE TYPE key.
2 Select the type of data to save and touch the EXIT key.
12
ALL Saves all HARD and ADJ content.(Indication on screen: LCR+ADJ)
HARD Saves the measurement condition and cable length correction setting value. (Indication on screen: LCR)
ADJ Saves only each of the setting values and correction values of open correc-tion, short correction, load correction, and correlation (scaling) correction.(Indication on screen: ADJ)
3 Touch the EXIT key twice.Displays the measurement screen.
When the type of data to save is set to ALL, data is saved to one panel but counted as one set of measure-ment conditions and one set of correction values.
(Example: When data is saved after setting the type of data to save to ALL, the panel is counted as 1 LCR [measurement conditions] data set and 1 ADJ [correction values] data set.)
Each count will increase by 1.

125
Saving Measurement Conditions and Correction Values (Panel Save Function)
PANEL screen layout
Panel No.(001 to 128) Panel name
Number of data sets savedThe text color changes in accordance with the number of dataitems currently saved as shown in the table below.
Text colors: White Yellow Red
LCR (LCR mode measurement conditions) 0 to 29 30 to 59 60
ADJ (correction values) 0 to 63 64 to 127 128
InformationIn order from left
Measurement parameters Judgment mode
PARA1 - PARA2 - PARA3 - PARA4 COMPor BIN
Indicates that nothing is saved.
Mode (Type of saved data)
Notation Meaning
LCR+ADJ All LCR and ADJ content
LCR LCR measurement conditions and cable length correction setting value
ADJ Only each of the setting values and correction values of open correc-tion, short correction, load cor-rection, and correlation (scaling) correction
6
Saving and Loading M
easurement C
ondition and Correction Value D
ata

126
Saving Measurement Conditions and Correction Values (Panel Save Function)
Saving measurement conditions and correction values
Screen display method (For more information, see p. 24.)(Measurement screen) SET key>(SET screen) ADVANCED tab>PANEL key
1 Select the panel number to save with the keys and then touch the SAVE key.
1
2
Touch when you wish to check the contents of saved panels. (See p. 127)
Touch when you wish to cancel the save operation.
Panel number display range:No. 001 to No. 128
See "PANEL screen layout" (p. 125).
2 (To change the panel name)If you do not wish to change the panel name, proceed to step 5.Touch the RENAME key.
Cancels the save operation and displays the PANEL screen.
3 Enter the panel name with the numeric keypad and touch the PANEL NAME key.
Changes the key-board type.
Deletes the last character.
Deletes all input characters.
Cancels the operation to change the panel name and closes the dialog box.
Up to 10 characters
12
4 Touch the SAVE key to save the panel.

127
Saving Measurement Conditions and Correction Values (Panel Save Function)
5 (To overwrite an existing panel)The OVER WRITE dialog box will be displayed.Touch the OVER WRITE key.
Touch when you wish to cancel the save (overwrite) operation.
6 Touch the EXIT key twice.Displays the measurement screen.
When you touch the VIEW key (VIEW dialog box)
Allows you to view the contents of the previous and next dialog boxes.
Closes the VIEW dialog box.
6
Saving and Loading M
easurement C
ondition and Correction Value D
ata
128
Loading Measurement Conditions and Correction Values (Panel Load Function)
6.2 Loading Measurement Conditions and Correc-tion Values (Panel Load Function)
This section describes how to load panel data that has been saved in the instrument’s memory.The instrument’s settings will be replaced with the loaded data settings.
Screen display method (For more information, see p. 24.)(Measurement screen) SET key>(SET screen) ADVANCED tab>PANEL key
1 Select the panel number to load with the keys and then touch the LOAD key.
1
2
Touch when you wish to check the contents of saved panels. (See p. 127)
Touch when you wish to cancel the load operation.
Panel number display range:No. 001 to No. 128
See "PANEL screen layout" (p. 125).
2 Touch the LOAD key.
Cancels the load operation and closes the dialog box.
The data will start to load.Once the load operation has completed, the measurement screen will be displayed.
Displays the panel number that was loaded.

129
Changing a Panel Name
6.3 Changing a Panel NameThis section describes how to change the name of a panel saved in the instrument’s memory.
Screen display method (For more information, see p. 24.)(Measurement screen) SET key>(SET screen) ADVANCED tab>PANEL key
1 Select the panel number whose name you wish to change with the keys and then touch the OPTION>> key.
1
2
Touch when you wish to check the information of the selected panel (p. 127).
Touch when you wish to cancel the operation to change the panel name.
2 Touch the RENAME key.
3 Enter a panel name with the numeric keypad, and touch the PANEL RENAME key.
Changes the key-board type.
Deletes the last character.
Deletes all input characters.
Cancels to change the panel name and closes the dialog box.
Up to 10 characters
12
4 Touch the EXIT key twice.Displays the measurement screen.
6
Saving and Loading M
easurement C
ondition and Correction Value D
ata

130
Deleting a Panel
6.4 Deleting a PanelThis section describes how to delete a panel that has been saved in the instrument’s memory.
Screen display method (For more information, see p. 24.)(Measurement screen) SET key>(SET screen) ADVANCED tab>PANEL key
1 Select the panel number you wish to delete with the keys and then touch the OPTION>> key.
1
2
Touch when you wish to check the information of the selected panel (p. 127).
Touch when you wish to cancel the operation to delete the panel.
2 Touch the DELETE key.
The DELETE dialog box will be displayed.
(You will be able to check some of the con-tents saved in the panel.)
3 Touch the DELETE key.
Touch when you wish to cancel the delete operation. The dialog box will be closed.
A panel cannot be restored once it is deleted.
4 Touch the EXIT key twice.Displays the measurement screen.
131
7 Setting the SystemThis chapter describes how to configure the instrument’s system settings.
First, set the measurement mode to LCR mode (p. 24).
Settings are configured on the SYS screen.
Configuring interface settings (p. 132)
Allows you to configure settings used to control the instrument from a computer via its USB, GP-IB, RS-232C, or LAN inter-face.
Checking the instrument’s version (p. 132)
Allows you to check the instrument’s version and other infor-mation. (Serial number, version, MAC address, USB ID, and interfaces)
Testing the system (Self diagnosis) (p. 133)
Allows you to check the instrument’s screen, internal memory, and EXT I/O status. • Panel test • Panel calibration • Testing the screen display status and LED status • ROM/RAM test • Testing EXT I/O input and output signals
Setting the date and time (p. 38) Set the instrument’s time and date.
7 Setting the System
7
Setting the S
ystem

132
Setting the Interface (Controlling the Instrument from a Computer)
7.1 Setting the Interface (Controlling the Instrument from a Computer)
This section describes how to configure the settings that are used to control the instrument via its USB, GP-IB, RS-232C, or LAN interface.
Screen display method (For more information, see p. 28.):(Measurement screen) SYS key>(SYS screen) I/F tab
1 Select the interface you wish to config-ure.
2 Configure the selected interface.USB, RS-232C, GP-IB, and LAN settings:Refer to the Communications Instruction Manual on the bundled LCR Application Disc.
3 Touch the EXIT key.Displays the measurement screen.
7.2 Checking the Version of the InstrumentThis section describes how to check the instrument’s serial number, version, MAC address, USB ID, and interfaces.
Screen display method (For more information, see p. 28.):(Measurement screen) SYS key>(SYS screen) INFO tab
1 Check the instrument’s version and
other information.2 Touch the EXIT key.
Displays the measurement screen.
133
Testing the System (Self diagnosis)
7.3 Testing the System (Self diagnosis)Allows you to check the instrument’s screen, internal memory, and EXT I/O status.
Panel test (p. 133) Allows you to check for touch panel errors.
Panel calibration (p. 134) Allows you to calibrate the touch panel.
Testing the screen display status and LED status (p. 134) Allows you to check the screen display status and LED status.
ROM/RAM test (p. 135) Allows you to check the instrument’s internal memory (ROM and RAM) for errors.
Testing EXT I/O input and output signals (p. 135)
Allows you to verify that output signals are output normally from EXT I/O and that input signals can be read properly.
Panel test
Allows you to check for touch panel errors.
Screen display method (For more information, see p. 28.):(Measurement screen) SYS key>(SYS screen) TEST tab>TOUCH SCREEN TEST key
1 Touch the key displayed of the screen.If the pressed keys are highlighted and the
green appears, the touch panel is work-ing properly.
Normal
Ubnormal
Perform panel calibration (p. 134) if they are not highlighted or the red appears.If there is still problem after performing panel calibration, the panel may be malfunctioning. Contact your authorized Hioki distributor or reseller.
2 Touch the EXIT key twice.Displays the measurement screen.
7
Setting the S
ystem

134
Testing the System (Self diagnosis)
Panel calibration
Allows you to calibrate the touch panel.
Screen display method (For more information, see p. 28.):(Measurement screen) SYS key>(SYS screen) TEST tab>CALIBRATION key
1 Touch in the location of continu-
ously until the green appears.
2 Touch the SET key to confirm the cali-bration.
Touch when you wish to repeat panel correc-tion from the beginning.
If the SET key does not appear, the instru-ment needs to be repaired.Contact your authorized Hioki distributor or reseller.
3 Touch the EXIT key.Displays the measurement screen.
Testing the screen display status and LED status
Allows you to check the screen display status and LED status.
Screen display method (For more information, see p. 28.):(Measurement screen) SYS key>(SYS screen) TEST tab>DISPLAY & LED TEST key
1 Touch the screen and check for switch-ing on and off of screen colors and the LEDs on the front of the instrument.The screen and LED status should change each time you touch the screen.
Front panel LEDs Screen color
All lit up
Red
All turned off
Green
OUT lit up
Blue
Front panel LEDs Screen color
IN lit up
Black
MEAS lit up
White
If the entire screen does not appear to be the same color or if the LEDs do not turn on as shown in the figure on the left, the instrument needs to be repaired.Contact your authorized Hioki distributor or reseller.
The instrument will return to the SYS screen.
2 Touch the EXIT key.Displays the measurement screen.
135
Testing the System (Self diagnosis)
ROM/RAM testAllows you to check the instrument’s internal memory (ROM and RAM) for errors.
Screen display method (For more information, see p. 28.):(Measurement screen) SYS key>(SYS screen) TEST tab
1 Touch the ROM/RAM TEST key.
Starts the test. (Approx. 40 seconds)No operation is possible during the ROM/RAM test.
Never turn off the power during a test.
If the overall judgment result indication is PASS, the test ended normally.
If the overall judgment result indication is NG, the instrument needs to be repaired. Contact your authorized Hioki distributor or reseller.
2 Touch the EXIT key twice.Displays the measurement screen.
Testing EXT I/O input/output signals
Allows you to verify that output signals are output normally from EXT I/O and that input signals can be read properly.
Screen display method (For more information, see p. 28.):(Measurement screen) SYS key>(SYS screen) TEST tab>I/O HANDLER TEST key
1 (To perform an output signal test)Touch the button with the name of the signal for which you want to check the output.
(To perform an input signal test)Input a signal and verify that the signal line name* is displayed in the window.
To perform an output signal test
To perform an input signal test
*: Names of signals that are being input (LO)
2 Touch the EXIT key twice.Displays the measurement screen.
On the test screen, an input signal does not cause the trigger to be enabled or panel to be loaded.
7
Setting the S
ystem
136
Testing the System (Self diagnosis)

137
8 Using USB Flash Drive (Saving and Loading Data)
Before using this functionality, be sure to read "Before Using the USB Flash Drive" (p. 14).This section describes how to save measurement data, instrument settings, and other data on a USB flash drive as well as how to load data that has been saved on a USB flash drive.
Checking the Contents of Files Allows you to check the contents of files saved on a USB flash drive.
Saving data
Allows you to save data from the instrument to a USB flash drive. • Measurement results (p. 141) • Screen copy (p. 150) • Panel (measurement conditions and correction values), and instru-ment settings (p. 153)
Loading settings data
Allows you to load settings data from a USB flash drive into the instru-ment. • Panel (measurement conditions and correction values), and instru-ment settings (p. 155)
Other
• Allows you to format (initialize) a USB flash drive (p. 140). • Allows you to check the contents of files on a USB flash drive (p. 157). • Allows you to delete files and folders from a USB flash drive (p. 158) • This section describes how to create a folder on a USB flash drive (p. 159).
• Allows you to check the usage rate and file system of the USB flash drive (p. 160).
File format
The following files can be handled by the instrument.
Content Format Extension Screen display (TYPE)
- Folder - FDR
Measurement data CSV file .csv CSV
Screen copy data BMP file .bmp BMP
Instrument settings data Setting file .SET SET
Panel (measurement conditions and correction values) Panel file .PNL PNL
The instrument cannot display double-byte characters (Japanese, etc.). A double-byte characters is replaced by "??."
Supported USB flash drive specifications
Connector USB type A
Electrical specification USB2.0
Power supply 500 mA maximum
No. of ports 1
Compatible USB device USB Mass Storage Class
8 Using USB Flash Drive (Saving and Loading Data)
8
Using U
SB
Flash Drive (S
aving and Loading Data)
138
Inserting and Removing a USB flash drive
8.1 Inserting and Removing a USB flash drive
Inserting a USB flash driveInsert the USB flash drive into the USB receptacle on the front of the instrument.
• Do not insert a USB flash drive that is not Mass Storage Class compatible. • Not all commercially available USB flash drives are compatible. • If a USB flash drive is not recognized, try using another USB flash drive.
Removing a USB flash driveCheck that the USB flash drive is not being accessed (saving, read-ing, etc.) by the instrument, and then remove it.
No remove operation needs to be performed on the instrument.
Screen Display when Using USB
When a USB flash drive has been recognized properly, the USB flash drive icon is displayed at the top of the measurement screen.The icon is red while the USB flash drive is being accessed.
(Blue)When the instrument recognizes the USB flash drive(Red)When USB is being ac-cessed
139
Checking the Contents of Files on a USB flash drive
8.2 Checking the Contents of Files on a USB flash drive
This section describes how to display files and check their contents.
Screen display method (For more information, see p. 29.):(Measurement screen) FILE key>(FILE screen) LIST tab
Displays the measurement screen.
Allows you to change the sorting order by touching the FILE NAME, DATE, or SIZE.
: Ascending order
: Descending order
File sizeFile save date and time
File formatFDR: folder, CSV: text data (CSV format), BMP: screen copy data, SET: instrument set-tings data, PNL: panel data
File name
Information of the USB flash drive.Allows you to confirm details by touching this information (p. 160).
Recognizing the USB flash drive: blueUSB is being accessed : red p. 138)
The instrument can recognize file names of up to 127 single-byte characters.
8
Using U
SB
Flash Drive (S
aving and Loading Data)
140
Formatting a USB Flash Drive
8.3 Formatting a USB Flash DriveThe USB flash drive must be formatted (initialized) before it can be used. The instrument formats drives in the FAT32 format. Formatting is necessary since files on the USB flash drive can only be recognized when stored using the FAT32 file system.
Screen display method (For more information, see p. 29.):(Measurement screen) FILE key>(FILE screen) LIST tab
1 Insert the USB flash drive into the front USB connector (p. 138).
2 Touch the OPTION>> key.
3 Touch the FORMAT key.
4 Touch the FORMAT key.
Touch when you wish to cancel the format operation. (The dialog box will be closed.)
Formatting of the USB flash drive will be-gin.
No operation is possible during formatting. When formatting ends, the dialog is closed.
• When you perform a format, all of the data saved to the USB flash drive is deleted and cannot be restored. Carefully check the contents before you perform a format.
• We recommend making a backup of any important data on a USB flash drive.
• When formatting is performed with the in-strument, the volume label* of the USB flash drive becomes NO NAME.
*: A volume label is a name given to a disk drive on a USB flash drive or other media.
5 Touch the EXIT key.Displays the measurement screen.
141
Saving Measurement Data
8.4 Saving Measurement Data
Saving Measurement Data in text
Measurement data* can be saved to a USB flash drive in the CSV format. (*: Refers to one piece of data measured before the SAVE key is touched. To save all measurement data stored in the instru-ment’s memory, see "Memory function (saving measurement results)" (p. 86).)The file extension is “.csv.”
LCR mode Saves the measurement values displayed in the current screen in CSV format.
Continuous measurement mode
Saves the measurement result of each panel in CSV format.Saves all measurement conditions and measurement data for each panel in a single file.
Measurement results are saved in the following order: measuring instrument information, time and date, measurement conditions, measurement parameters, and measurement values.The header (time and date, measurement conditions, measurement parameters, delimiter, and quotation mark type) can be configured as desired.
8
Using U
SB
Flash Drive (S
aving and Loading Data)

142
Saving Measurement Data
CSV file sample
Example of saving DATE (save date and time): ON, SET (measurement conditions) ON, PARA (measurement parameters): ON, DELIM (delimiter): , (comma), QUOTE (quotaion mark) " (double quotation)
"HIOKI E.E. CORPORATION","IM3536","Ver. 1.00","Serial No. 123456789"
"DATE","11-11-30""TIME","10:10:06"
"FREQ","1.0000E+03","Hz""V","1.000","V""LIMIT","OFF""RANGE","AUTO","10k","ohm""LOW Z","OFF""JUDGE SYNC","OFF""JUDGE","OFF""SPEED","MED""TRIG","INT""AVG","OFF""DELAY","0.0000","s""TRIG SYNC","OFF""DCBIAS","OFF""OPEN","OFF""SHORT","OFF""LOAD","OFF""CABLE","0","m""SCALE","OFF"
"Z[ohm]","OFF","PHASE[deg]","OFF""4.983329E+03","","0.074",""
Instrument information
Time and date
Measurement conditions
Measurement parameters
Measurement values (see below)
Header
”,”Quotation mark
Delimiter
How to interpret measured values
Example: No. 1 parameter: Z (impedance [Ω]); No. 2 parameter: OFF;No. 3 parameter: θ (impedance phase angle [°]); No. 4 parameter: OFF
"4.983329E+03","","0.074",""No. 1 parameter mea-sured value
No. 3 parameter measured value
No. 4 parameter mea-sured value
No. 2 parameter mea-sured value
The No. 1 parameter is 4.983329 kΩ, and the No. 3 parameter is 0.074°. No measured values are shown for the No. 4 or No. 4 parameter since they are set to OFF.

143
Saving Measurement Data
ProceduresScreen display method (For more information, see p. 29.):(Measurement screen) FILE key>(FILE screen) SET tab
1 Insert the USB flash drive into the front USB connector (p. 138).
2 Touch the TYPE key.
3 Touch the TEXT ON key and then touch the EXIT key.
4 Set the header, delimiter, and quotation mark character.
DATE Sets whether to use the save date and time as the header (p. 144).
SET Sets whether to use the measure-ment condition as the header (p. 145).
PARA Sets whether to use the save measurement parameters as the header (p. 146).
DELIM Sets the delimiter type. (p. 148)
QUOTE Sets the quotation mark character. (p. 149)
5 Touch the EXIT key.Displays the measurement screen.
6 Touch the SAVE key.
The measurement data will be saved.
• Touching SAVE automatically creates a folder on the USB flash drive and saves the file there.The date is used for the name of the folder created when you press SAVE key.Example: Saved on September 30, 2014 → 20140930
• "To specify the save folder" (p. 152) • A filename will be assigned automatically based on the date and time.(Example: Saved at 16:31:44 on September 30, 2014 → 140930163144.csv)
8
Using U
SB
Flash Drive (S
aving and Loading Data)

144
Saving Measurement Data
Setting the header, delimiter, and quotation mark character
(1) DATE (save date and time)Sets whether to use the save date and time as the text file’s header.
1 Select either the ON key (save as the header) or the OFF key (do not save as the header).
2 Touch the EXIT key.The dialog box will be closed.
When ON When OFF
"HIOKI E.E. CORPORATION","IM3536","Ver. 1.00","Serial No. 123456789"
"DATE","11-11-30""TIME","10:10:06"
"FREQ","1.0000E+03","Hz""V","1.000","V""LIMIT","OFF""RANGE","AUTO","10k","ohm"
Display when ON:Save date: November 30, 2011; save time: 10:10:06
"HIOKI E.E. CORPORATION","IM3536","Ver. 1.00","Serial No. 123456789"
"FREQ","1.0000E+03","Hz""V","1.000","V""LIMIT","OFF""RANGE","AUTO","10k","ohm"

145
Saving Measurement Data
(2) SET (measurement conditions)Sets whether to use the save measurement conditions as the text file’s header.
1 Select either the ON key (save as the header) or the OFF key (do not save as the header).
2 Touch the EXIT key.The dialog box will be closed.
When ON When OFF
"HIOKI E.E. CORPORATION","IM3536","Ver. 1.00","Serial No. 123456789"
"DATE","11-11-30""TIME","10:10:06"
"FREQ","1.0000E+03","Hz""V","1.000","V""LIMIT","OFF""RANGE","AUTO","10k","ohm""LOW Z","OFF""JUDGE SYNC","OFF""JUDGE","OFF""SPEED","MED""TRIG","INT""AVG","OFF""DELAY","0.0000","s""TRIG SYNC","OFF""DCBIAS","OFF""OPEN","OFF""SHORT","OFF""LOAD","OFF""CABLE","0","m""SCALE","OFF"
"Z[ohm]","OFF","PHASE[deg]","OFF""4.983329E+03","","0.074",""
"HIOKI E.E. CORPORATION","IM3536","Ver. 1.00","Serial No. 123456789"
"DATE","11-11-30""TIME","10:10:06"
"Z[ohm]","OFF","PHASE[deg]","OFF""4.983329E+03","","0.074",""
Display when ON:Measurement frequency: 1.0000 kHz, measurement signal mode: V, measurement signal level: 1.000 V, current limit: OFF, measurement range: AUTO (10 kΩ), low Z high accuracy mode: OFF, JUDGE synchronous setting: OFF, judg-ment mode: OFF, measurement speed: MED, trigger: INT, average: OFF, trigger delay: 0.0000 s, trigger synchronous output: OFF, DC bias: OFF, open correction: OFF, short correction: OFF, load correction: OFF, cable length correction: 0 m, scaling (correlation correction): OFF
8
Using U
SB
Flash Drive (S
aving and Loading Data)

146
Saving Measurement Data
(3) PARA (measurement parameters)Sets whether to use the save measurement parameters as the text file’s header.
1 Select either the ON key (save as the header) or the OFF key (do not save as the header).
2 Touch the EXIT key.The dialog box will be closed.
When ON When OFF
"HIOKI E.E. CORPORATION","IM3536","Ver. 1.00","Serial No. 123456789"
"DATE","11-11-30""TIME","10:10:06"
"FREQ","1.0000E+03","Hz""V","1.000","V""LIMIT","OFF""RANGE","AUTO","10k","ohm""LOW Z","OFF""JUDGE SYNC","OFF""JUDGE","OFF""SPEED","MED""TRIG","INT""AVG","OFF""DELAY","0.0000","s""TRIG SYNC","OFF""DCBIAS","OFF""OPEN","OFF""SHORT","OFF""LOAD","OFF""CABLE","0","m""SCALE","OFF"
"Z[ohm]","OFF","PHASE[deg]","OFF""4.983329E+03","","0.074",""
"HIOKI E.E. CORPORATION","IM3536","Ver. 1.00","Serial No. 123456789"
"DATE","11-11-30""TIME","10:10:06"
"FREQ","1.0000E+03","Hz""V","1.000","V""LIMIT","OFF""RANGE","AUTO","10k","ohm""LOW Z","OFF""JUDGE SYNC","OFF""JUDGE","OFF""SPEED","MED""TRIG","INT""AVG","OFF""DELAY","0.0000","s""TRIG SYNC","OFF""DCBIAS","OFF""OPEN","OFF""SHORT","OFF""LOAD","OFF""CABLE","0","m""SCALE","OFF"
"4.983329E+03","","0.074",""
Display when ON:No. 1 parameter: Z (impedance [Ω]), No. 2 parameter: OFF, No. 3 parameter: θ (impedance phase angle [°]), No. 4 parameter: OFF

147
Saving Measurement Data
The following parameter symbols are used when saving text files:
Parameters Description Symbol used when saving text files
Z Impedance (Ω) Z [ohm]Y Admittance (S) Y [S]θ Impedance phase angle (°) PHASE [deg]
Rs Effective resistance= ESR (Ω)(Equivalent series resistance) RS [ohm]Rp Effective resistance (Ω) (Equivalent parallel resistance) RP [ohm]Cs Capacitance (F) (Equivalent series capacitance) CS [F]Cp Capacitance (F) (Equivalent parallel capacitance) CP [F]D Loss factor= tanδ DG Conductance (S) G[S]X Reactance (Ω) X [ohm]Ls Inductance (H) (Equivalent series inductance) LS [H]Lp Inductance (H) (Equivalent parallel inductance) LP [H]Q Q-factor QB Susceptance (S) B [S]
OFF No display No symbol
8
Using U
SB
Flash Drive (S
aving and Loading Data)

148
Saving Measurement Data
(4) DELIM (delimiter)Selects the delimiter to use in text files.
1 Select one of the available delimiters. , Sets the delimiter to a comma (,).
TAB Sets the delimiter to a tab.
; Sets the delimiter to a semicolon (;).
SPACE Sets the delimiter to a space.
2 Touch the EXIT key.The dialog box will be closed.
When comma When tab
"HIOKI E.E. CORPORATION","IM3536","Ver. 1.00","Serial No. 123456789"
"DATE","11-11-30""TIME","10:10:06"
"FREQ","1.0000E+03","Hz""V","1.000","V""LIMIT","OFF""RANGE","AUTO","10k","ohm""LOW Z","OFF""JUDGE SYNC","OFF""JUDGE","OFF""SPEED","MED""TRIG","INT""AVG","OFF"
"HIOKI E.E. CORPORATION" "IM3536" "Ver. 1.00""Serial No. 123456789"
"DATE "11-11-30""TIME" "10:11:36"
"FREQ" "1.0000E+03" "Hz""V" "1.000" "V""LIMIT" "OFF""RANGE" "AUTO" "10k" "ohm""LOW Z" "OFF""JUDGE SYNC" "OFF""JUDGE" "OFF""SPEED" "MED""TRIG" "INT""AVG" "OFF"
When semicolon When space
"HIOKI E.E. CORPORATION";"IM3536";"Ver. 1.00";"Serial No. 123456789"
"DATE";"11-11-30""TIME";"10:11:42"
"FREQ";"1.0000E+03";"Hz""V";"1.000";"V""LIMIT";"OFF""RANGE";"AUTO";"10k";"ohm""LOW Z";"OFF""JUDGE SYNC";"OFF""JUDGE";"OFF""SPEED";"MED""TRIG";"INT""AVG";"OFF"
"HIOKI E.E. CORPORATION" "IM3536" "Ver. 1.00""Serial No. 123456789"
"DATE" "11-11-30""TIME" "10:11:48"
"FREQ" "1.0000E+03" "Hz""V" "1.000" "V""LIMIT" "OFF""RANGE" "AUTO" "10k" "ohm""LOW Z" "OFF""JUDGE SYNC" "OFF""JUDGE" "OFF""SPEED" "MED""TRIG" "INT""AVG" "OFF"

149
Saving Measurement Data
(5) QUOTE (quotation mark)Selects the quotation mark character to use in text files.
1 Select one of the available quotations. OFF No quotation marks are added.
" Sets the quotation mark to a double quotation mark (").
' Sets the quotation mark to a single quotation mark (').
2 Touch the EXIT key.The dialog box will be closed.
When OFF When double quotation mark
HIOKI E.E. CORPORATION,IM3536,Ver. 1.00,Serial No. 123456789
DATE,11-11-30TIME,10:12:05
FREQ,1.0000E+03,HzV,1.000,VLIMIT,OFFRANGE,AUTO,10k,ohmLOW Z,OFFJUDGE SYNC,OFFJUDGE,OFFSPEED,MEDTRIG,INTAVG,OFF
"HIOKI E.E. CORPORATION","IM3536","Ver. 1.00","Serial No. 123456789"
"DATE","11-11-30""TIME","10:10:06"
"FREQ","1.0000E+03","Hz""V","1.000","V""LIMIT","OFF""RANGE","AUTO","10k","ohm""LOW Z","OFF""JUDGE SYNC","OFF""JUDGE","OFF""SPEED","MED""TRIG","INT""AVG","OFF"
When single quotation mark
'HIOKI E.E. CORPORATION','IM3536','Ver. 1.00','Serial No. 123456789'
'DATE','11-11-30''TIME','10:12:15'
'FREQ','1.0000E+03','Hz''V','1.000','V''LIMIT','OFF''RANGE','AUTO','10k','ohm''LOW Z','OFF''JUDGE SYNC','OFF''JUDGE','OFF''SPEED','MED''TRIG','INT''AVG','OFF'
8
Using U
SB
Flash Drive (S
aving and Loading Data)
150
Saving Measurement Data
Saving a copy of the screen
Allows you to save the screen currently displayed to the USB flash drive in bmp file format (256 colors or monochrome [2 colors]). The file extension is ".bmp".
BMP file sample
Color Monochrome

151
Saving Measurement Data
ProceduresScreen display method (For more information, see p. 29.):(Measurement screen) FILE key>(FILE screen) SET tab
1 Insert the USB flash drive into the front
USB connector (p. 138).
2 Touch the TYPE key.
3 Touch the BMP COLOR or MONO key.
OFF Disables saving of screen copies.
COLOR Saves a copy of the screen as a 256-color BMP file.
MONO Saves a copy of the screen as a monochrome (2-color) BMP file.
4 Touch the EXIT key twice.Displays the measurement screen.
5 Touch the SAVE key.
A copy of the measurement screen will
be saved.
• When the SAVE key is pressed, a folder is automatically created in the USB flash drive and the file is saved.The date is used for the name of the folder created when you press SAVE key.Example: Saved on September 30, 2014 → 20140930
• "To specify the save folder" (p. 152) • A filename will be assigned automatically based on the date and time.(Example: Saved at 16:31:44 on September 30, 2014 → 140930163144.csv)
8
Using U
SB
Flash Drive (S
aving and Loading Data)

152
Saving Measurement Data
To specify the save folder
This section describes how to set the desired folder as the data save destination.
Screen display method (For more information, see p. 29.):(Measurement screen) FILE key>(FILE screen) SET tab
1 Insert the USB flash drive into the front USB connector (p. 138).
2 Touch the SAVE TO... key.
3 Touch the MANUAL key.
AUTO Automatically creates a folder named based on the save date and saves data in that folder.
MANUAL Allows you to specify any folder and then save the data.
4 Select the folder in which you wish to save data with the keys and then touch the SET key.
Touch to cancel the configuration process. (The dialog box will be closed.)
1
2
5 Touch the EXIT key.Displays the measurement screen.
• The following folders can be specified: • The root* directory of the USB flash drive • The folder name is all single-byte characters (A folder name containing Japanese or other double-byte characters cannot be specified.)
• The folder name is no more than 12 characters • If the folder specified as the save destination is deleted, a folder of the same name will be created when saving data.
*: “Root” refers to the uppermost level on the USB flash drive.
Removable disk
Root folder

153
Saving Settings Data
8.5 Saving Settings Data
Saving instrument settings other than panels
This section describes how to save instrument settings other than panels on a USB flash drive. The extension of the setting file is “.SET.” This function is convenient for when you want to back up the setting state of the instrument.For the settings that are saved, refer to "Appx. 11 Initial Settings Table" (p. Appx.15).
Screen display method (For more information, see p. 29.):(Measurement screen) FILE key>(FILE screen) LIST tab
1 Insert the USB flash drive into the front USB connector (p. 138).
2 Touch the SAVE key.
3 Touch the SAVE key.
Touch when you wish to cancel the save operation.(The dialog box will be closed.)
Touch when you wish to change the filename of the setting file.(A filename entry dialog box will be displayed.)
The measurement data is saved.
4 Touch the EXIT key.Displays the measurement screen.
• Touching the SAVE key will cause a SETTING folder to be automatically created on the USB flash drive, and setting files will be saved there.
• Filenames are automatically assigned based on the time and date by default, but they can be changed by touching the RENAME key.(Example:Saved at 16:31:44 on September 30, 2014→140930163144.SET)
• If a setting file with the same name already exists, a dialog box confirming whether you wish to overwrite the file will be displayed.
8
Using U
SB
Flash Drive (S
aving and Loading Data)
154
Saving Settings Data
Save all instrument settings including panels (ALL SAVE function)
This section describes how to save instrument settings including panels as settings files on the USB flash drive. The file extension will be “.ALL.” At this time, settings files (extension “.SET”) and panel files (extension “.PNL”) will also be saved separately in the same folder. For the settings that are saved, refer to "Appx. 11 Initial Settings Table" (p. Appx.15).
Screen display method (For more information, see p. 29.):(Measurement screen) FILE key>(FILE screen) LIST tab
1 Insert the USB flash drive into the front USB connector (p. 138).
2 Touch the OPTION>> key.
3 Touch the ALL SAVE key.
4 Touch the SAVE key.
Touch when you wish to cancel the save operation.(The dialog box will be closed.)
Touch when you wish to change the folder name of the setting file.(A folder name entry dialog box will be displayed.)
Settings data including panels will be saved.
5 Touch the EXIT key.Displays the measurement screen.
• Touching the SAVE key will cause a SETTING folder to be automatically created on the USB flash drive, and setting files will be saved there.
• Folder names are automatically assigned based on the time and date by default, but they can be changed by touching the RENAME key.(Example: Saved at 16:31:44 on September 30, 2014→140930163144.ALL, 140930163144.SET, and 140930163144.PNL files are saved in the 140930163144 folder.)
• If a setting folder with the same name already exists, a dialog box confirming whether you wish to over-write the folder will be displayed.
155
Loading Instrument Settings
8.6 Loading Instrument Settings
Loading settings files or panel files
This section describes how to load a setting file (SET) or panel file (PNL) that is saved to the USB flash drive, and to restore the settings.Screen display method (For more information, see p. 29.):(Measurement screen) FILE key>(FILE screen) LIST tab
1 Insert the USB flash drive into the front USB connector (p. 138).
2 Select the SETTING folder with the keys and touch the SELECT key.
12
3 Select the setting file (SET) or panel file (PNL) to load with the keys and touch the LOAD key.
12
Touch when you wish to check the contents of a file. (See p. 157)
4 Touch the LOAD key.
Touch when you wish to cancel the load op-eration. (The dialog box will be closed.)
The file will be loaded and applied as the
current settings.
5 Touch the EXIT key.Displays the measurement screen.
If a load error is displayed
If an error is displayed, the following causes may be to blame: • The setting file is damaged. • The file is not a setting file that can be read by the instrument.
Touch the CANCEL key.The load operation will be canceled, and the dialog box will be closed.
8
Using U
SB
Flash Drive (S
aving and Loading Data)

156
Loading Instrument Settings
Loading settings files including panel files (ALL LOAD function)
This section describes how to load settings files (ALL) including panel files saved on the USB flash drive with the ALL SAVE function and restore the stored settings.
Screen display method (For more information, see p. 29.):(Measurement screen) FILE key>(FILE screen) LIST tab
1 Insert the USB flash drive into the front USB connector (p. 138).
2 Select the SETTING folder with the keys and touch the SELECT key.
12
3 Using the keys, select the folder which settings were saved with the all save function and touch the SELECT key.
12
4 Using the keys, select the file which TYPE is ALL and touch the ALL LOAD key.
12
5 Touch the LOAD key.
When you want to cancel loading, touch this key. (The dialog box will be closed.)
All files saved in the folder will be loaded and applied as the current settings.
6 Touch the EXIT key.Displays the measurement screen.
• When the load operation is performed, all current instrument settings will be deleted. • If the instrument is unable to load the settings file, a beep will sound. • Refer to "If a load error is displayed" (p. 155).

157
Checking the Contents of a File
8.7 Checking the Contents of a FileThis section describes how to check measurement data files (CSV), screen copy files (BMP), set-tings files (SET), and panel save files (PNL) saved on a USB flash drive on the instrument’s screen.
Screen display method (For more information, see p. 29.):(Measurement screen) FILE key>(FILE screen) LIST tab
1 Insert the USB flash drive into the front USB connector (p. 138).
2 Select a file with the keys and touch the VIEW key.
12
If the selected file is a folder (FDR), the SE-LECT key will be displayed. Touching this key will display the files in the folder.
The file’s contents will be displayed.
CSV file
BMP file
SET file
PNL file
3 Touch the EXIT key twice.Displays the measurement screen.
8
Using U
SB
Flash Drive (S
aving and Loading Data)

158
Deleting Files and Folders
8.8 Deleting Files and FoldersThis section describes how to delete files and folders saved on a USB flash drive.
Screen display method (For more information, see p. 29.):(Measurement screen) FILE key>(FILE screen) LIST tab
1 Insert the USB flash drive into the front USB connector (p. 138).
2 Select the file or folder you wish to delete with the keys and touch the OPTION>> key.
12
3 Touch the DELETE key.
2
4 Touch the DELETE key.
Touch when you wish to cancel the delete op-eration. (The dialog box will be closed.)
The selected file or folder will be deleted.
A deleted file or folder cannot be re-stored once it is deleted.
5 Touch the EXIT key.Displays the measurement screen.
If the folder to be deleted contains a file, it cannot be deleted. To delete the folder, delete all of the files in the folder.

159
Creating Folders
8.9 Creating FoldersThis section describes how to create a folder on a USB flash drive.
Screen display method (For more information, see p. 29.):(Measurement screen) FILE key>(FILE screen) LIST tab
1 Insert the USB flash drive into the front USB connector (p. 138).
2 Touch the OPTION>> key.
3 Touch the FOLDER key.
2
Enter the save name. (Up to 12 characters)
Changes the keyboard type.
Deletes the last character.
Deletes all input characters.
4 Touch the CREATE FOLDER key.
Touch when you wish to cancel the creation operation. (The dialog box will be closed.)
The folder is created.
5 Touch the EXIT key.Displays the measurement screen.
8
Using U
SB
Flash Drive (S
aving and Loading Data)
160
Displaying the USB Flash Drive Information
8.10 Displaying the USB Flash Drive InformationAllows you to check the usage rate and file system of the USB flash drive.
Screen display method (For more information, see p. 29.):(Measurement screen) FILE key>(FILE screen) LIST tab
1 Insert the USB flash drive into the front USB connector (p. 138).
2 Touch the part indicating the disc infor-mation.
File system : File system typeAll : Total sizeUsed : Space usedAvail : Space free
3 Touch the EXIT key.The dialog box will be closed.
4 Touch the EXIT key.Displays the measurement screen.

161
9 External ControlThis chapter describes how to connect the EXT I/O connector on the rear of the instrument to an external device and how to control the instrument using the following methods: • Outputting signals from the instrument to the external device (measurement complete signal, judgment results signal, etc.)
• Inputting signals from the external device to the instrument (measurement start/stop trigger sig-nal, panel load signal, etc.)
All signals are isolated by photocouplers (inputs and outputs share a common signal ground (ISO_COM signal ground).)
(1) Connecting the instrument’s EXT I/O connector to the control system (See p. 162 to p. 179)
Confirm input and output ratings, understand the safety precautions for connecting a control system, and use accordingly.
Control system(Signal output destination or signal input source)
(2) Configuring the instrument (See p. 180)
To input a signal from the external device to the instrument to start and stop measure-ment (external trigger) p. 62
To output contact errors during 2-terminal measurement (Hi Z reject function) p. 84
• To set the delay time from comparator/BIN judgment result output to measurement complete signal output (EOM
―――
[LO]) • To reset the comparator/BIN judgment results when measurement starts
p. 181
To enable trigger input during measurement and set the trigger input effective edge p. 182
To set the EOM signal’s LO and HI times so that they are sufficiently long p. 183
9 External Control
9
External C
ontrol

162
External Input/Output Connector and Signals
9.1 External Input/Output Connector and SignalsBefore connecting the terminals, be sure to read "Before Connecting EXT I/O" (p. 15).This section describes the instrument’s EXT I/O connectors, compatible connectors, connector signal assignments, input (IN) signal functionality, and output signals when errors occur.
Signal input or output is indicated as “LO (ON),” while the absence of signal input or output is indicated as “HI (OFF).” (Please note that this usage differs in meaning from “HI” and “LO” as used for judgment results.)
Instrument connector and supported connectors
The instrument provides the following EXT I/O connector and supports use of the following types of connectors:
Instrument side connector 37-pin D-sub female with #4-40 screws
Mating connectors • DC-37P-ULR (solder type) • DCSP-JB37PR (pressure weld type)
Japan Aviation Electronics Industry Ltd.
Instrument connector signal assignments
Signal assignments vary with the measurement mode.Signal logic is 0 V to 0.9 V for LO level and 5 V to 24 V for HI level.
LCR mode (LCR) operation
2 14 36 58 79
202122232425262728293031323334353637
141516171819 10111213
TRIG
――――
(Unused)
(Unused)
LD1
――
―
LD3
――
―
LD5
――
―
C1
――
ISO_5V
ISO_C
OM
ERR
――
―
BIN
1―――
―
, PAR
A1-H
I―
――
――
――, D
1-0―
――
BIN
3―――
―
, PAR
A1-LO
――
――
――
―
, D1-2
――
―
BIN
5―――
―
, PAR
A3-IN
――
――
―――
, D2-0
――
―
BIN
7―――
―
, AN
D―
――
, D2-2
――
―
BIN
9―――
―
, D3-0
――
―
D3-2
――
―
D4-0
――
―
D4-2
――
―
OU
T_OF_B
INS
――
――
――――
―
C2
――
CA
LIB ―
――――
LD0
――
―
LD2
――
―
LD4
――
―
LD6
――
―
LD_VA
LID―
――
――――
ISO_C
OM
EOM
――
―
IND
EX――
――
―
BIN
2―――
―
, PAR
A1-IN
――
――
―――
D1-1
――
―
BIN
4―――
―
, PAR
A3-H
I―
――
――
――, D
1-3―
――
BIN
6―――
―
, PAR
A3-LO
――
――
――
―
, D2-1
――
―
BIN
8―――
―
, D2-3
――
―
BIN
10―――
――
, D3-1
――
―
D3-3
――
―
D4-1
――
―
D4-3
――
―

163
External Input/Output Connector and Signals
Pin I/O*1 Signal name Function Logic
1 IN TRIG――――
External trigger(See "Input (IN) signal function details" (p. 167).)
Rising/ falling Edge
2 - (Unused) - - -
3 - (Unused) - - -
4 IN LD1―――
Select panel number(See "Input (IN) signal function details" (p. 167).) Negative Level
5 IN LD3―――
Select panel number(See "Input (IN) signal function details" (p. 167).) Negative Level
6 IN LD5―――
Select panel number(See "Input (IN) signal function details" (p. 167).) Negative Level
7 IN C1――
Switches between the high-order digit and low-order digit during BCD output. Negative Level
8 - ISO_5V Isolated 5 V power output - -
9 - ISO_COM Isolated common signal ground - -
10 OUT ERR―――
Outputs when a sampling error, overcurrent error, contact error, Hihg-Z reject error, constant voltage/constant current error, or voltage/current limit value exceeded error occurs.
Negative Level
11*2 OUT BIN1――――
Generates output when the BIN measurement result is BIN1.
Negative LevelPARA1-HI―――――――
Generates output when the comparator judgment result is HI for the No. 1 parameter.
D1-0―――
BCD output signal
12*2 OUT BIN3――――
Generates output when the BIN measurement result is BIN3.
Negative LevelPARA1-LO―――――――
Generates output when the comparator judgment result is LO for the No. 1 parameter.
D1-2―――
BCD output signal
13*2 OUT BIN5――――
Generates output when the BIN measurement result is BIN5.
Negative LevelPARA3-IN―――――――
Generates output when the comparator judgment result is IN for the No. 3 parameter.
D2-0―――
BCD output signal
14*2 OUT BIN7――――
Generates output when the BIN measurement result is BIN7.
Negative Level
AND―――
Outputs judgment results for two parameter measured val-ues (the result of a logical AND operation).Generates output when both judgment results are IN. Ad-ditionally, generates output when either of the No. 1 or No. 3 parameters is IN and the other is undetermined.
D2-2―――
BCD output signal
15 OUT BIN9――――
Generates output when the BIN measurement result is BIN9.Negative Level
D3-0―――
BCD output signal
16 OUT D3-2―――
BCD output signal Negative Level
17 OUT D4-0―――
BCD output signal Negative Level
18 OUT D4-2―――
BCD output signal- Negative Level
19 OUT OUT_OF_BINS――― ―― ――――
Generates output when the BIN judgment result does not match any BIN. Negative Level
20 IN C2――
Switches between the No. 1 parameter and No. 3 parameter during BCD output. Negative Level
21 IN CALIB―――――
DC adjustment request(See "Input (IN) signal function details" (p. 167)) Negative Level
22 IN LD0―――
Select panel number(See "Input (IN) signal function details" (p. 167).) Negative Level
9
External C
ontrol

164
External Input/Output Connector and Signals
Pin I/O*1 Signal name Function Logic
23 IN LD2―――
Select panel number(See "Input (IN) signal function details" (p. 167).) Negative Level
24 IN LD4―――
Select panel number(See "Input (IN) signal function details" (p. 167).) Negative Level
25 IN LD6―――
Select panel number(See "Input (IN) signal function details" (p. 167).) Negative Level
26 IN LD_VALID―― ―――――
Execute panel load(See "Input (IN) signal function details" (p. 167).) Negative Level
27 - ISO_COM Isolated common signal ground - -
28 OUT EOM―――
This signal indicates that measurement is complete. “HI (OFF)” indicates that measurement is in progress, while “LO (ON)” indicates that measurement is complete. When LO (ON), the comparator judgment results have been finalized.
Falling Edge
29 OUT INDEX―――――
Signal indicating that A/D conversion for the measurement circuit has completed: When this signal changes from HI (OFF) to LO (ON), the sample may be changed.
Falling Edge
30*2 OUT BIN2――――
Generates output when the BIN measurement result is BIN2.
Negative LevelPARA1-IN―――――――
Generates output when the comparator judgment result is IN for the No. 1 parameter.
D1-1―――
BCD output signal
31*2 OUT BIN4――――
Generates output when the BIN measurement result is BIN4.
Negative LevelPARA3-HI―――――――
Generates output when the comparator judgment result is HI for the No. 3 parameter.
D1-3―――
BCD output signal
32*2 OUT BIN6――――
Generates output when the BIN measurement result is BIN6.
Negative LevelPARA3-LO―――――――
Generates output when the comparator judgment result is LO for the No. 3 parameter.
D2-1―――
BCD output signal
33 OUT BIN8――――
Generates output when the BIN measurement result is BIN8.Negative Level
D2-3―――
BCD output signal
34 OUT BIN10―――――
Generates output when the BIN measurement result is BIN10.Negative Level
D3-1―――
BCD output signal
35 OUT D3-3―――
BCD output signal Negative Level
36 OUT D4-1―――
BCD output signal Negative Level
37 OUT D4-3―――
BCD output signal Negative Level
*1: IN indicates signal input to the instrument, while OUT indicates signal output from the instrument.*2: When BIN measurement is selected, refer to the top cell. When comparator measurement is selected, refer to the
middle cell. When BCD mode is selected, refer to the bottom cell.

165
External Input/Output Connector and Signals
Continuous measurement mode (CONTINUOUS) operation
2 14 36 58 79
202122232425262728293031323334353637
141516171819 10111213
TRIG
――――
(Unused)
(Unused)
(Unused)
(Unused)
(Unused)
(Unused)
ISO_5V
ISO_C
OM
ERR
――
―
No.1_PA
RA
1-HI
――
――
――
――
――
No.1_PA
RA
1-LO―
――
――
――
――
―
No.1_PA
RA
3-IN―
――
――
――
―――
AN
D―
――
No.2_PA
RA
1-―
――
――
――
―
IN ――
No.2_PA
RA
――
――
――
―
3 ―
- HI
――
No.2_PA
RA
3-―
――
――
――
―
LO―
―
(Unused)
(Unused)
(Unused)
(Unused)
(Unused)
(Unused)
(Unused)
(Unused)
(Unused)
ISO_C
OM
EOM
――
―
IND
EX――
――
―
No.1_PA
RA
1-IN―
――
――
――
―――
No.1_PA
RA
3-HI
――
――
――
――
――
No.1_PA
RA
3-LO―
――
――
――
――
―
No.2_PA
RA
1-―
――
――
――
―
HI
――
No.2_PA
RA
――
――
――
―
1 ―
- LO―
―
No.2_PA
RA
3-IN―
――
――
――
―――
(Unused)
(Unused)
Pin I/O* Signal name Function Logic
1 IN TRIG――――
External trigger(See "Input (IN) signal function details" (p. 167).)
Rising/falling Edge
2 - (Unused) - - -
3 - (Unused) - - -
4 - (Unused) - - -
5 - (Unused) - - -
6 - (Unused) - - -
7 - (Unused) - - -
8 - ISO_5V Isolated 5 V power output - -
9 - ISO_COM Isolated common signal ground - -
10 OUT ERR―――
Outputs when a sampling error, overcurrent error, contact error, High-Z reject error, constant voltage/ constant cur-rent error, or voltage/current limit value exceeded error occurs.
Negative Level
11 OUT No.1_PARA1-HI――― ―――――――
Outputs HI comparator judgment results for the first No. 1 parameter. Negative Level
12 OUT No.1_PARA1-LO――― ―――――――
Outputs LO comparator judgment results for the first No. 1 parameter. Negative Level
13 OUT No.1_PARA3-IN――― ―――――――
Outputs IN comparator judgment results for the first No. 3 parameter. Negative Level
14 OUT AND―――
Outputs when all panel judgments are IN and the instru-ment is not OUT_OF_BINS. Negative Level
15 OUT No.2_PARA1-IN――― ―――――――
Outputs IN comparator judgment results for the second No. 1 parameter. Negative Level
16 OUT No.2_PARA3-HI――― ―――――――
Outputs HI comparator judgment results for the second No. 3 parameter. Negative Level
17 OUT No.2_PARA3-LO――― ―――――――
Outputs LO comparator judgment results for the second No. 3 parameter. Negative Level
18 - (Unused) - - -
9
External C
ontrol
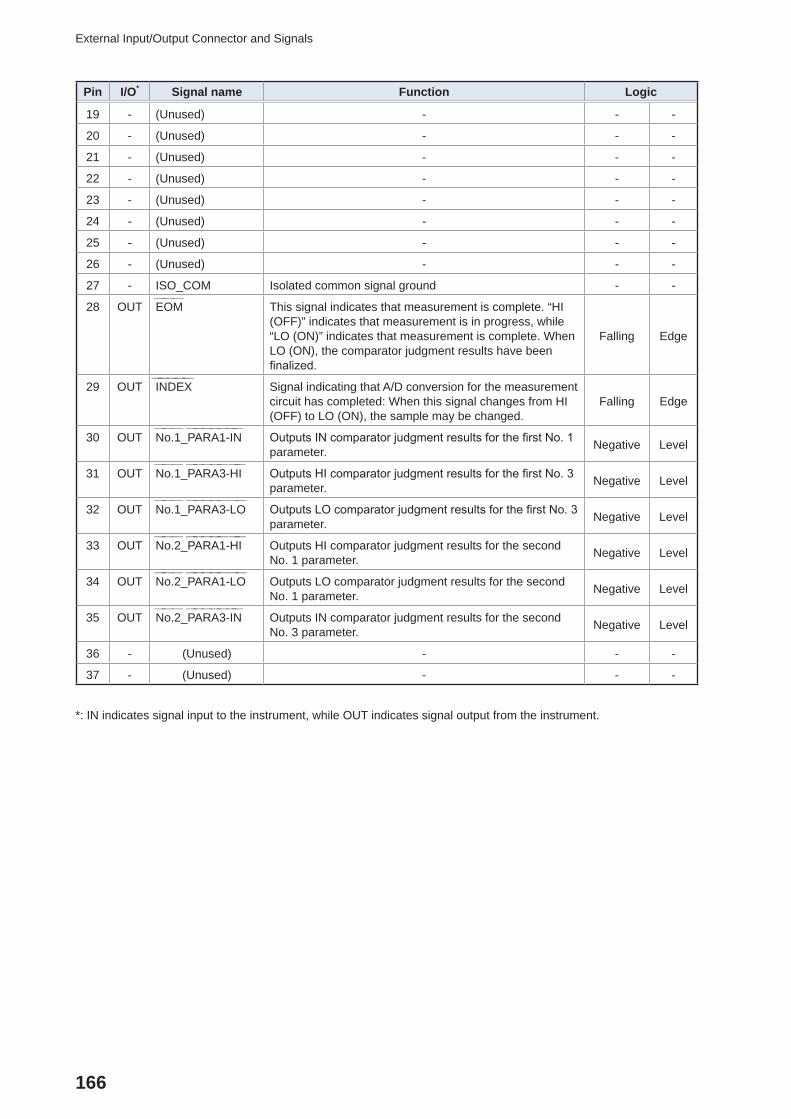
166
External Input/Output Connector and Signals
Pin I/O* Signal name Function Logic
19 - (Unused) - - -
20 - (Unused) - - -
21 - (Unused) - - -
22 - (Unused) - - -
23 - (Unused) - - -
24 - (Unused) - - -
25 - (Unused) - - -
26 - (Unused) - - -
27 - ISO_COM Isolated common signal ground - -
28 OUT EOM―――
This signal indicates that measurement is complete. “HI (OFF)” indicates that measurement is in progress, while “LO (ON)” indicates that measurement is complete. When LO (ON), the comparator judgment results have been finalized.
Falling Edge
29 OUT INDEX―――――
Signal indicating that A/D conversion for the measurement circuit has completed: When this signal changes from HI (OFF) to LO (ON), the sample may be changed.
Falling Edge
30 OUT No.1_PARA1-IN――― ―――――――
Outputs IN comparator judgment results for the first No. 1 parameter. Negative Level
31 OUT No.1_PARA3-HI――― ―――――――
Outputs HI comparator judgment results for the first No. 3 parameter. Negative Level
32 OUT No.1_PARA3-LO――― ―――――――
Outputs LO comparator judgment results for the first No. 3 parameter. Negative Level
33 OUT No.2_PARA1-HI――― ―――――――
Outputs HI comparator judgment results for the second No. 1 parameter. Negative Level
34 OUT No.2_PARA1-LO――― ―――――――
Outputs LO comparator judgment results for the second No. 1 parameter. Negative Level
35 OUT No.2_PARA3-IN――― ―――――――
Outputs IN comparator judgment results for the second No. 3 parameter. Negative Level
36 - (Unused) - - -
37 - (Unused) - - -
*: IN indicates signal input to the instrument, while OUT indicates signal output from the instrument.

167
External Input/Output Connector and Signals
Input (IN) signal function details
This section describes input (IN) signals.
Input (IN) sig-nal Detailed description
TRIG――――
• When the trigger setting is the external trigger (EXT), measurement is performed once with the falling (DOWN) or rising (UP) edge of the TRIG
――――
. The edge direction can be set in the SET screen. (Initial value: Falling [DOWN])See "Disabling the trigger input during measurement and setting the trigger input effective edge" (p. 182). (Falling: HI→LO, rising: LO→HI)
• The TRIG signal is invalid when the trigger source is set to the internal trigger (INT).See "Trigger (perform measurements with user-defined timing) (Common)" (p. 62).
• You can set whether to enable or disable TRIG――――
input during measurement (during output of the EOM
―――
(HI))."Disabling the trigger input during measurement and setting the trigger input effective edge" (p. 182).
LD0―――
to LD6―――
Selects the number of the panel to load.If a trigger signal is input in external trigger mode, the selected panel is loaded and used for measurement.Input the panel value as a binary value to LD0
―――
to LD6―――
.
<Example> OFF: HI (5 V to 24 V), ON: LO (0 V to 0.9 V)
Pin No. LD6―――
LD5―――
LD4―――
LD3―――
LD2―――
LD1―――
LD0―――
Panel 1 OFF OFF OFF OFF OFF OFF ON
Panel 2 OFF OFF OFF OFF OFF ON OFF
Panel 3 OFF OFF OFF OFF OFF ON ON
Panel 4 OFF OFF OFF OFF ON OFF OFF
Panel 5 OFF OFF OFF OFF ON OFF ON
Panel 6 OFF OFF OFF OFF ON ON
Panel 7 OFF OFF OFF OFF ON ON ON
Panel 8 OFF OFF OFF ON OFF OFF OFF
…
Panel 32 OFF ON OFF OFF OFF OFF OFF
…
Panel 127 ON ON ON ON ON ON ON
Panel 128 OFF OFF OFF OFF OFF OFF OFF
C1――
, C2――
• C1――
: Switches between the high-order digit and the low-order digit (exponent or decimal point) in BCD mode.OFF: High-order digit output; ON: low-order digit output (polarity, ERR)
• C2――
: Switches between the No. 1 parameter and the No. 3 parameter in BCD mode.OFF: No.1 parameter; ON: No. 3 parameter
• For more information about BCD mode, see "BCD mode function details" (p. 168).
LD_VALID―― ―――――
• Input a negative logic signal from an external source when performing a panel load op-eration.
• Maintain LO level after TRIG――――
input until INDEX―――――
is output.
CALIB―――――
• When the DC adjustment function is set to OFF during DC resistance measurement, acquires the offset value generated by the internal circuitry at the user-defined timing.
• Maintain LO level after TRIG――――
input until INDEX―――――
is output.
9
External C
ontrol

168
External Input/Output Connector and Signals
BCD mode function detailsLCD mode output signals operate in two modes: judgment mode and BCD mode. In BCD mode, measured values for the No. 1 parameter and the No. 3 parameter are output using the BCD sig-nals.Reference: "Outputting measured values (switching to BCD mode) *LCR mode only" (p. 184)
The BCD high-order digit and low-order digit (polarity and ERR information) can be switched with the C1 signal.
C1――
D4――
D3――
D2――
D1――
HI (high-order) No. 6 digit data No. 5 digit data No. 4 digit data No. 3 digit data
LO (low-order) No. 2 digit data No. 1 digit data Polarity ERR
Signal correspondence tableDm-3―――
Dm-2―――
Dm-1―――
Dm-0―――
Measured value
OFF OFF OFF OFF 0
OFF OFF OFF ON 1
OFF OFF ON OFF 2
OFF OFF ON ON 3
OFF ON OFF OFF 4
OFF ON OFF ON 5
OFF ON ON OFF 6
OFF ON ON ON 7
ON OFF OFF OFF 8
ON OFF OFF ON 9
(m: 4 to 1)
Output Description
Polarity OFF OFF OFF OFF Plus
OFF OFF OFF ON Minus
ERR* OFF OFF OFF OFF Normal data
OFF OFF OFF ON OVERFLOW
OFF OFF ON OFF UNDERFLOW
OFF OFF ON ON NC (Contact error)
OFF ON OFF OFF Error
*: When other than normal data, the value 9 will be output for numerical data.
The C2 signal is used to switch between the No. 1 parameter and the No. 3 parameter.
Relationship between BCD signals and the instrument display
- 8 9 . 4 7 5 °
D4-n D1-n
D3-n D2-n D4-n
D3-n
D2-n
C1=ON(LO)
C1=OFF(HI)
Display

169
External Input/Output Connector and Signals
Example outputThe decimal point is set to an appropriate position.
12.3456 µF Decimal point: 99.9999 µ
C1―― D4
――
D3――
D2――
D1――
3 2 1 0 3 2 1 0 3 2 1 0 3 2 1 0
OFF(High-order)
Decimal display
1 2 3 4
BCD output
OFF OFF OFF ON OFF OFF ON OFF OFF OFF ON ON OFF ON OFF OFF
ON(Low-order)
Decimal display
5 6 Polarity: 0 ERR: 0
BCD output
OFF ON OFF ON OFF ON ON OFF OFF OFF OFF OFF OFF OFF OFF OFF
-12.345° Decimal point: 99.9999
C1―― D4
――
D3――
D2――
D1――
3 2 1 0 3 2 1 0 3 2 1 0 3 2 1 0
OFF(High-order)
Decimal display
1 2 3 4
BCD output
OFF OFF OFF ON OFF OFF ON OFF OFF OFF ON ON OFF ON OFF OFF
ON(Low-order)
Decimal display
5 0 Polarity: 1 ERR: 0
BCD out-put
OFF ON OFF ON OFF OFF OFF OFF OFF OFF OFF ON OFF OFF OFF OFF
NC (Contact error)
C1―― D4
――
D3――
D2――
D1――
3 2 1 0 3 2 1 0 3 2 1 0 3 2 1 0
OFF(High-order)
Decimal display
9 9 9 9
BCD output
ON OFF OFF ON ON OFF OFF ON ON OFF OFF ON ON OFF OFF ON
ON(Low-order)
Decimal display
9 9 Polarity: 0 or 1 ERR: 3
BCD output
ON OFF OFF ON ON OFF OFF ON OFF OFF OFF OFF(ON)
OFF OFF ON ON
9
External C
ontrol

170
External Input/Output Connector and Signals
Output signals when errors occur
When an error occurs, the signals are as follows. When multiple errors occur, the signal with the highest precedence is output.Reference: "11.3 Error Massage and Error Display" (p. 230)
Error
Scre
en e
rror
dis
play
ERR
No.
10
Pin*1
During comparator measurement During BIN mea-surement
Prio
rity
Ord
er
Logi
cal p
rodu
ct
and
No.
14
Pin
Each
Par
amet
er
Judg
men
t Res
ult
Pin
Nos
. 11
to 1
3 an
d 30
to 3
2
BIN1
to B
IN10
Pin
N
os. 1
1 to
15
and
30 to
34
OUT
_OF_
BINS
Pin
N
o. 1
9
Sampling error
LO
HI
HI
HI LO
Hig
hLo
w
Simultaneous H and L contact errors (after measurement)
Pin Nos. 11 and 31: LO*2 (LCR mode only)
L side contact error (after measurement)
H side contact error(after measurement)
Simultaneous H and L contact errors (before measurement)
L side contact error(before measurement)
H side contact error(before measurement)
UnderflowHI
Pin Nos. 12 and 32: LO*2, 3 (LCR mode only)
Overflow Pin Nos. 11 and 31: LO*2, 4 (LCR mode only)
Outside of High-Z reject limit range
LO
Normal judgment Normal judgment Normal
judgmentNormal
judgment
Constant voltage/ constant current error
Voltage/current limit value exceeded error
Outside of guaranteed accuracy range
HINormal Measured
value
No measurement after power turned on HI HI HI HI
*1: LO output is generated if even one error for which output changes to LO occurs.*2: Pin numbers that change to LO level are shown.*3: Pin Nos. 11 and 31 will be LO when the parameters are Y, Cs, G, and B. (LCR mode only)*4: Pin Nos. 12 and 32 will be LO when the parameters are Y, Cs, G, and B. (LCR mode only)
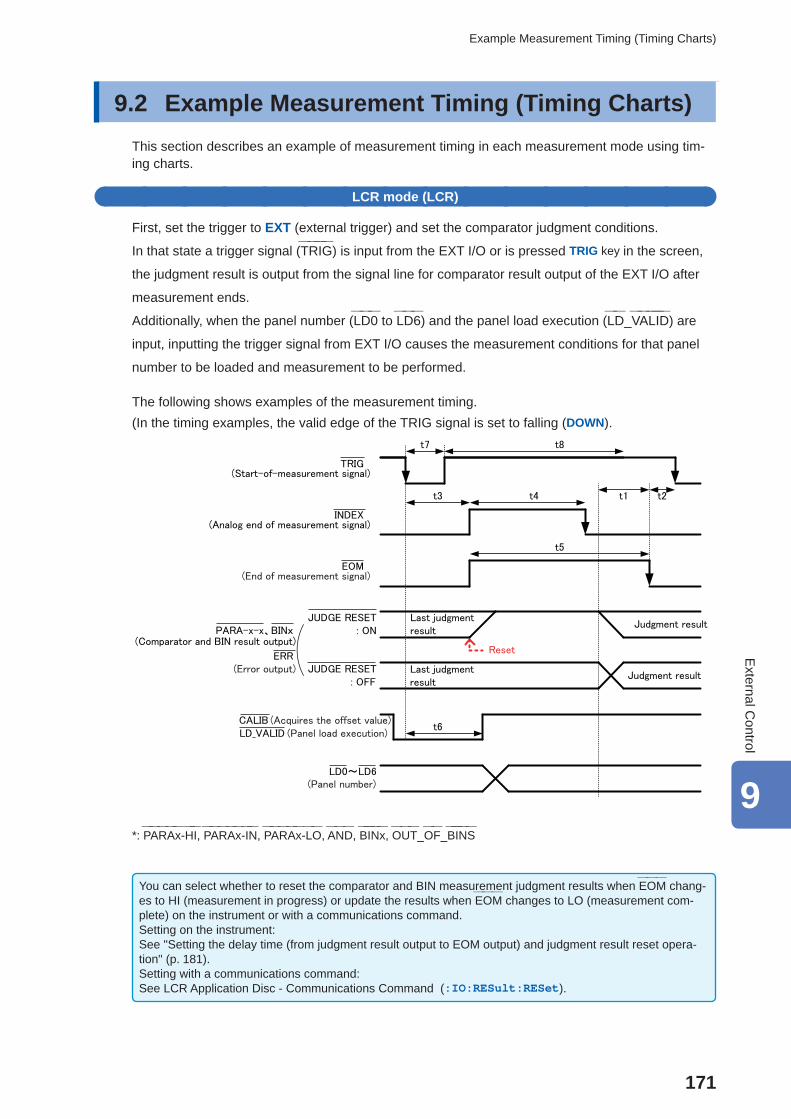
171
Example Measurement Timing (Timing Charts)
9.2 Example Measurement Timing (Timing Charts)This section describes an example of measurement timing in each measurement mode using tim-ing charts.
LCR mode (LCR)
First, set the trigger to EXT (external trigger) and set the comparator judgment conditions.
In that state a trigger signal (TRIG――――
) is input from the EXT I/O or is pressed TRIG key in the screen,
the judgment result is output from the signal line for comparator result output of the EXT I/O after
measurement ends.
Additionally, when the panel number (LD0―――
to LD6―――
) and the panel load execution (LD_VALID―― ―――――
) are
input, inputting the trigger signal from EXT I/O causes the measurement conditions for that panel
number to be loaded and measurement to be performed.
The following shows examples of the measurement timing.(In the timing examples, the valid edge of the TRIG signal is set to falling (DOWN).
Reset
TRIG(Start-of-measurement signal)
INDEX
EOM
CALIBLD_VALID
LD0~LD6
ERR
PARA-x-x、BINxJudgment result
Judgment result
JUDGE RESET: ON
JUDGE RESET: OFF
t7 t8
t3 t4
t5
t1 t2
t6
(Analog end of measurement signal)
(End of measurement signal)
(Comparator and BIN result output)
Last judgmentresult
Last judgmentresult
(Panel number)
(Panel load execution)(Acquires the offset value)
(Error output)
*: PARAx-HI―――――――
, PARAx-IN―――――――
, PARAx-LO―――――――
, AND―――
, BINx――――
, OUT_OF_BINS――― ―― ――――
You can select whether to reset the comparator and BIN measurement judgment results when EOM―――
chang-es to HI (measurement in progress) or update the results when EOM
―――
changes to LO (measurement com-plete) on the instrument or with a communications command.Setting on the instrument:See "Setting the delay time (from judgment result output to EOM output) and judgment result reset opera-tion" (p. 181).Setting with a communications command:See LCR Application Disc - Communications Command (:IO:RESult:RESet).
9
External C
ontrol

172
Example Measurement Timing (Timing Charts)
Timing chart interval descriptions
Interval Description Time(Approx.)
t1 From Comparator, BIN Judgement Result to EOM (LO): Setting value for de-lay time*1 (p. 181.)
40 µs
t2 From EOM―――
width (LO) to TRIG――――
(LO): Minimum time from end of measurement to next trigger*2
400 µs
t3 From TRIG――――
(LO) to INDEX―――――
(HI): Time from trigger to circuit response*3 400 µs
t4 INDEX―――――
width (HI): Analog measurement time (=Minimum chuck time), switch-ing chuck with INDEX
―――――
(LO) is possible*41 ms
t5 EOM―――
width (HI): Measurement time*4 1.7 ms
t6 From TRIG――――
width (LO) to LD-VALID―――――――
(HI), CALIB―――――
(HI): Time to panel load ex-ecution and DC adjustment request signal detection
At least t3
t7 Trigger pulse width (LO time) At least 100 µs
t8 Trigger off (HI time) At least 100 µs
*1: There is an approximate error of 100 µs in the delay time entered for Judgement Result↔EOM―――
for the set-ting value. t1 is the reference value for when the setting value is 0.0000 s.
*2: t2 is the reference value for when trigger input for during measurement is disabled (p. 182).*3: When the panel number is read by the panel load function, the response time is as shown in the table below.
Measurement mode
Save type for loaded data Content of loaded data Response time
LCR
LCR+ADJ Both measurement conditions and correction values Approx. 6.5 ms
LCR Measurement conditions and cable length correction setting Approx. 5 ms
ADJOpen correction, short correction, load correction, and correlation correction (scaling) settings and cor-rection values only
Approx. 1.5 ms
The trigger synchronization delay, trigger delay, and DC delay times are added to t3. When using the "External trigger" (p. 218) condition , 500 µs is added to t3.*4: Reference value for Measurement frequency: 1 kHz, Measurement speed: FAST, Range: HOLD (p. 217)
• Because the speed with which the comparator and BIN judgment results rise (LO → HI) varies with the architecture of the circuit connected to EXT I/O, using the judgment results level immediately after EOM
―――
output may result in an erroneous detection. To prevent this phenomenon, set a delay time (t1) between judgment result output and EOM
―――
output. In addition, by configuring the instrument so that the judgment result signal at EXT I/O is reset at the same time as the measurement start signal (thereby forcing the judgment results to transition to HI at the same time as TRIG
――――
input [EOM―――
HI]), the transition from LO to HI when the judgment results are output after the completion of measurement can be eliminated. As a result, the delay time set between judgment result output and EOM
―――
output can be minimized. However, be careful because the judgment result confirmation interval is until the next trigger is accepted.
• When inputting the trigger from EXT I/O or communicating using one of the instrument’s interfaces dur-ing measurement, variability in the delay time between output of comparator and BIN judgment results and EOM
―――
output may increase. Consequently, control of the instrument from an external device should be avoided during measurement to the greatest extent possible.Setting on the instrument: See "Setting the delay time (from judgment result output to EOM output) and judgment result reset opera-tion" (p. 181).Setting with a communications command:See LCR Application Disc - Communications Command (:IO:OUTPut:DELay), (:IO:RESult:RESet).

173
Example Measurement Timing (Timing Charts)
• The shorter the measurement time, the shorter the time that INDEX―――――
and EOM―――
are HI (off).The HI (OFF) time when receiving the INDEX
―――――
and EOM―――
signals may be too short depending on the input circuit. By setting the EOM output method to PULSE, an adequately long HI (OFF) time can be configured. The instrument can be configured to maintain the low (on) state for a preset time once EOM
―――
changes to LO (on) before reverting the signal to HI (off) after the completion of measurement.When trigger input is received at EOM
―――
: LO (on) and INDEX―――――
: LO (on), the signal transitions to HI (off) when measurement starts.
Setting the INDEX―――――
and EOM―――
output methodSetting on the instrument:See"Setting the EOM output method and output time" (p. 183).Setting with a communications command:See LCR Application Disc - Communications Command (:IO:EOM:MODE).
Setting the pulse width for which LO (on)
EOM―――
is heldSetting on the instrument:See "Setting the EOM output method and output time" (p. 183).Setting with a communications command:See LCR Application Disc - Communications Command (:IO:EOM:PULSe).
(Start-of-measurement signal)
(Analog end of measurement signal)When HOLD
(Analog end of measurement signal)When PULSE
(End of measurement signal)When HOLD
(End of measurement signal)When PULSE
T: pulse width
ON
In the above figure, “ON” indicates signal input and output, while “OFF” indicates the absence of signal input or output.(ON: HI, OFF:LO)
BCD signal timingBCD single DM-n transition time based on the C1 and C2 signals
0.2ms max 0.2ms max
No. 1 ParameterHigh-order digit D1-0toD-4-3
BCDm-n
Low-order digit (ONHigh-order digit )(OFF)
Low-order digit (ON)C1
C2
High-order digit (OFF)
No. 1 Parameter (OFF) No. 3 Parameter (OFF)
0.2ms max 0.2ms max
No. 1 ParameterHigh-order digit D1-0toD-4-3
No. 2 ParameterHigh-order digit D1-0toD-4-3
No. 1 ParameterLow-order digit D1-0toD-4-3
No. 2 ParameterLow-order digit D1-0toD-4-3
9
External C
ontrol

174
Example Measurement Timing (Timing Charts)
Acquisition of measured values (BCD) using an external triggerWith BCD output, it is necessary to acquire the No. 1 parameter and the No. 3 parameter as well as the high-order digit and the low-order digit separately. The No. 1 parameter and the No. 3 parameter and the high-order digit and the low-order digit can be acquired in any order. In the following example, the high-order digit of the No. 1 parameter is acquired first. A wait of at least 0.2 ms is required after controlling the C1 and C2 signals.
Instrument External device
Measurementstart
Measurementstart
C1=OFF,C2=OFFTRIG
Measurementcomplete
Measurement in progress
Measurementcomplete
received
EOM
D1-0toD4-0
EOM wait
No. 1 parameterBCD low-order digitSetup start
C1=ON,C2=OFF
Setup time0.2ms max
Wait
D1-0toD4-0
No. 3 parameterBCD high-order digitSpecificationC1=OFF,C2=ON
Setup time0.2ms max
No. 3 parameterBCD high-order digitAcquisition
D1-0 toD4-0
Wait
C1=ON,C2=ON
Setup time0.2ms max
D1-0toD4-0
Wait
No. 1 parameter
Specification
No. 1 parameterBCD low-order digitSetup complete
No. 1 parameterBCD high-order digitAcquisition
BCD low-order digit
BCD low-order digit
Acquisition
No. 3 parameterBCD high-order digitSetup start
No. 3 parameterBCD high-order digitSetup complete
No. 3 parameter
SpecificationBCD low-order digit
No. 3 parameterBCD low-order digitAcquisition
No. 3 parameterBCD low-order digitSetup start
No. 3 parameterBCD low-order digitSetup complete

175
Example Measurement Timing (Timing Charts)
Continuous measurement mode (CONTINUOUS)
When the trigger signal is input from EXT I/O or TRIG key is touched on the screen in continuous measurement mode, measurement will be performed for all panel numbers that have been enabled on the screen. Once those measurements are complete, the respective judgment results measured first and second for the No. 1 and No. 3 parameters will be output from the EXT I/O comparator result output signal lines. (Judgment results for the third and subsequent items are not output.)The following shows examples of the measurement timing.(In the timing examples, the valid edge of the TRIG signal is set to falling (DOWN).)Example: Continuous measurement using panel numbers 1, 3, and 4
The first judgment result will not be output since comparator is not set.
Since No. 2 is OFF, measurement will be performed using the No. 3 conditions, and the second judg-ment result will be output.
The judgment result will not be output from EXT I/O since this will be the third measurement.
(Start-of-measurement signal)
(Analog end of mea-surement signal)
(End of measurement signal)
*1 Comparator result output
(Error output)
Last judgment result Judgment result
In the above figure, “ON” indicates signal input and output, while “OFF” indicates the absence of signal input or output. (ON: HI, OFF: LO)
*1 No.x_PARAy-HI――― ―――――――
, No.x_PARAy-IN――― ―――――――
, No.x_PARAy-LO――― ―――――――
, AND―――
*2 Reset when signal changes to EOM―――
(HI) (measurement in progress): ONDo not reset when signal changes to EOM
―――
(HI) (measurement in progress): Last judgment result remains
Signal line Description
INDEX―――――
, EOM―――
For both INDEX―――――
and EOM―――
, a transition to Hi (off) is performed when the first panel mea-surement starts after the trigger signal is input, and a transition to LO (on) is performed after measurement of the last panel is finished and the judgment result has been output. (The HI level is maintained during continuous measurement.)
AND―――
When the judgment results of all panels are IN, LO is output.
• In the continuous measurement screen, comparator result output signals (however, other than AND―――
, the fist panel, or the second panel) and panel load signals (LD-VALID
―――――――
, LD0―――
to LD6―――
) cannot be used. (See "Us-ing Continuous Measurement Mode" (p. 93).)
• You can select whether to reset the comparator and BIN measurement judgment results when EOM―――
changes to HI (measurement in progress) or update the results when EOM
―――
changes to LO (measurement complete) on the instrument or with a communications command.Setting on the instrument:See "Setting the delay time (from judgment result output to EOM output) and judgment result reset operation" (p. 181).Setting with a communications command:See LCR Application Disc - Communications Command (:IO:RESult:RESet).
• For other timing chart times, refer to "LCR mode (LCR)" (p. 171).
9
External C
ontrol
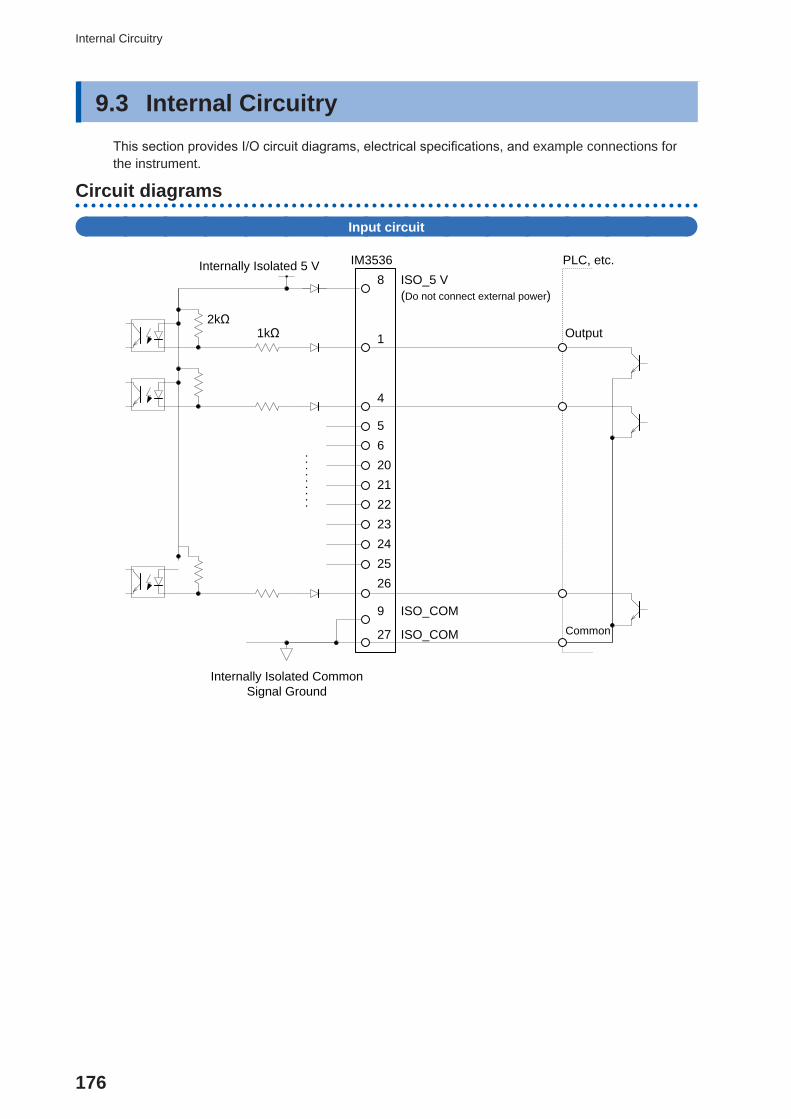
176
Internal Circuitry
9.3 Internal CircuitryThis section provides I/O circuit diagrams, electrical specifications, and example connections for the instrument.
Circuit diagrams
Input circuit
Internally Isolated 5 V8 ISO_5 V
Internally Isolated Common Signal Ground
2kΩ1kΩ
PLC, etc.
Output
Common
22
27 ISO_COM
9 ISO_COM
.........
IM3536
1
4
56
21
2324
26
(Do not connect external power)
25
20

177
Internal Circuitry
Output circuit
10Ω(Do not connect external power)
PLC, etc.
Input
Common
Zener Voltage30 V
.........
Internally Isolated 5 V8 ISO_5 V
27 ISO_COM
9 ISO_COM
Internally Isolated Common Signal Ground
IM3536
37
16
131415
17
33
10
11
12
192829303132
343536
9
External C
ontrol

178
Internal Circuitry
Electrical specifications
Input signals Input type Optocoupler-isolated, non-voltage contact inputs (current sink, active-low)
Input asserted (on) voltage 0.9 V or less
Input de-asserted (off) voltage Open or 5 V to 24 V
Input asserted (on) current 3 mA/ch
Maximum applied voltage 30 V
Output signals Output type Isolated by photo-couplers, Nch open drain output (current sink, active-low)
Maximum load voltage 30 V
Maximum output current 50 mA/ch
Residual voltage 1 V or less (50 mA)
Internally isolated power supply
Output voltage 4.5 V to 5.0 V
Maximum output current 100 mA
External power input none
Connection examples
Input circuit connection examples
IM3536IM3536
IM3536IM3536
Input
Switch connections
Input
Relay connections
Input
PLC output (sink output) connections
Output
Common
Common
Input
Output
PLC output (source output) connections
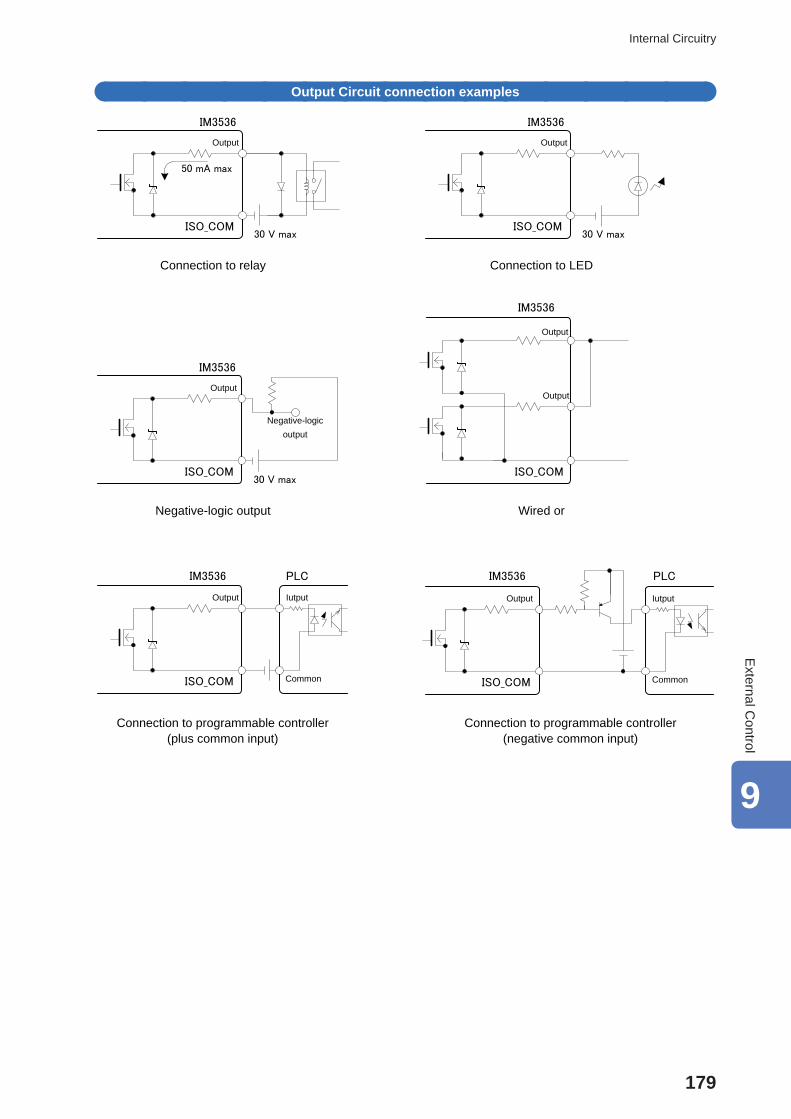
179
Internal Circuitry
Output Circuit connection examples
ISO_COM
Output
Negative-logicoutput
Iutput
Common
Connection to relay Connection to LED
Negative-logic output
ISO_COM
Output
Output
Wired or
30 V max
50 mA max
IM3536
IM3536
Iutput
Common
PLC PLC
Connection to programmable controller(plus common input)
Connection to programmable controller(negative common input)
ISO_COM
Output
30 V max
IM3536
ISO_COM
Output
30 V max
IM3536
ISO_COM ISO_COM
Output Output
IM3536IM3536
9
External C
ontrol
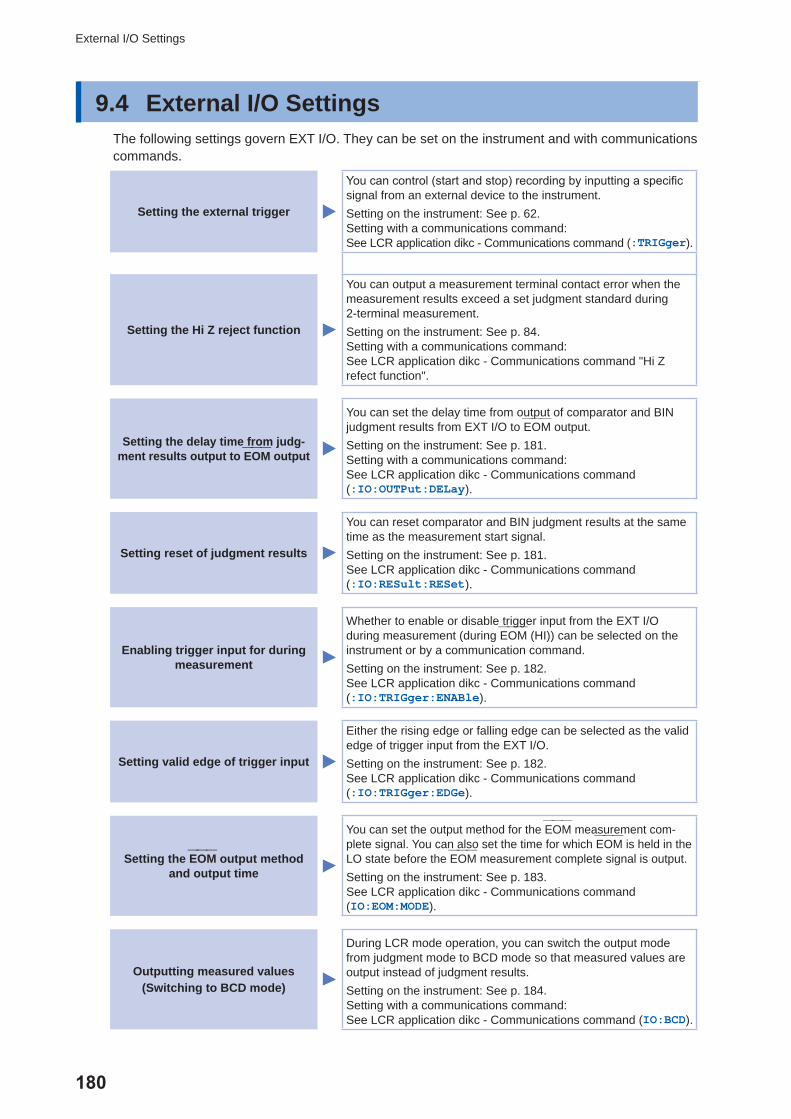
180
External I/O Settings
9.4 External I/O SettingsThe following settings govern EXT I/O. They can be set on the instrument and with communications commands.
Setting the external trigger
You can control (start and stop) recording by inputting a specific signal from an external device to the instrument.Setting on the instrument: See p. 62.Setting with a communications command:See LCR application dikc - Communications command (:TRIGger).
Setting the Hi Z reject function
You can output a measurement terminal contact error when the measurement results exceed a set judgment standard during 2-terminal measurement.Setting on the instrument: See p. 84.Setting with a communications command:See LCR application dikc - Communications command "Hi Z refect function".
Setting the delay time from judg-ment results output to EOM
―――
output
You can set the delay time from output of comparator and BIN judgment results from EXT I/O to EOM
―――
output.Setting on the instrument: See p. 181.Setting with a communications command:See LCR application dikc - Communications command (:IO:OUTPut:DELay).
Setting reset of judgment results
You can reset comparator and BIN judgment results at the same time as the measurement start signal.Setting on the instrument: See p. 181.See LCR application dikc - Communications command (:IO:RESult:RESet).
Enabling trigger input for during measurement
Whether to enable or disable trigger input from the EXT I/O during measurement (during EOM
―――
(HI)) can be selected on the instrument or by a communication command.Setting on the instrument: See p. 182.See LCR application dikc - Communications command (:IO:TRIGger:ENABle).
Setting valid edge of trigger input
Either the rising edge or falling edge can be selected as the valid edge of trigger input from the EXT I/O.Setting on the instrument: See p. 182.See LCR application dikc - Communications command (:IO:TRIGger:EDGe).
Setting the EOM―――
output method and output time
You can set the output method for the EOM―――
measurement com-plete signal. You can also set the time for which EOM
―――
is held in the LO state before the EOM
―――
measurement complete signal is output.Setting on the instrument: See p. 183.See LCR application dikc - Communications command (IO:EOM:MODE).
Outputting measured values(Switching to BCD mode)
During LCR mode operation, you can switch the output mode from judgment mode to BCD mode so that measured values are output instead of judgment results.Setting on the instrument: See p. 184.Setting with a communications command:See LCR application dikc - Communications command (IO:BCD).

181
External I/O Settings
Setting the delay time (from judgment result output to EOM―――
output) and judgment result reset operation
The delay time for the period from the output of the comparator and BIN judgment results until the output of EOM
―――
from the EXT I/O can be set.You can also select whether to reset comparator and BIN judgment results when EOM
―――
output changes to HI (indicating that measurement is in progress).(See "9.2 Example Measurement Timing (Timing Charts)" (p. 171).)
Screen display method (For more information, see p. 24.):(Measurement screen) SET key>(SET screen) ADVANCED tab>IO JUDGE key
1 Set the delay time with the key.
Settable range: 0.0000 s to 0.9999 sIf you make a mistake, touch the C key to reenter the value.
2 Select the judgment result hold/reset setting.
OFF Stores the last judgment results until the next judgment results are output.
ON Resets the judgment results when the EOM
―――
signal change to HI.
3 Touch the EXIT key twice.Displays the measurement screen.
9
External C
ontrol
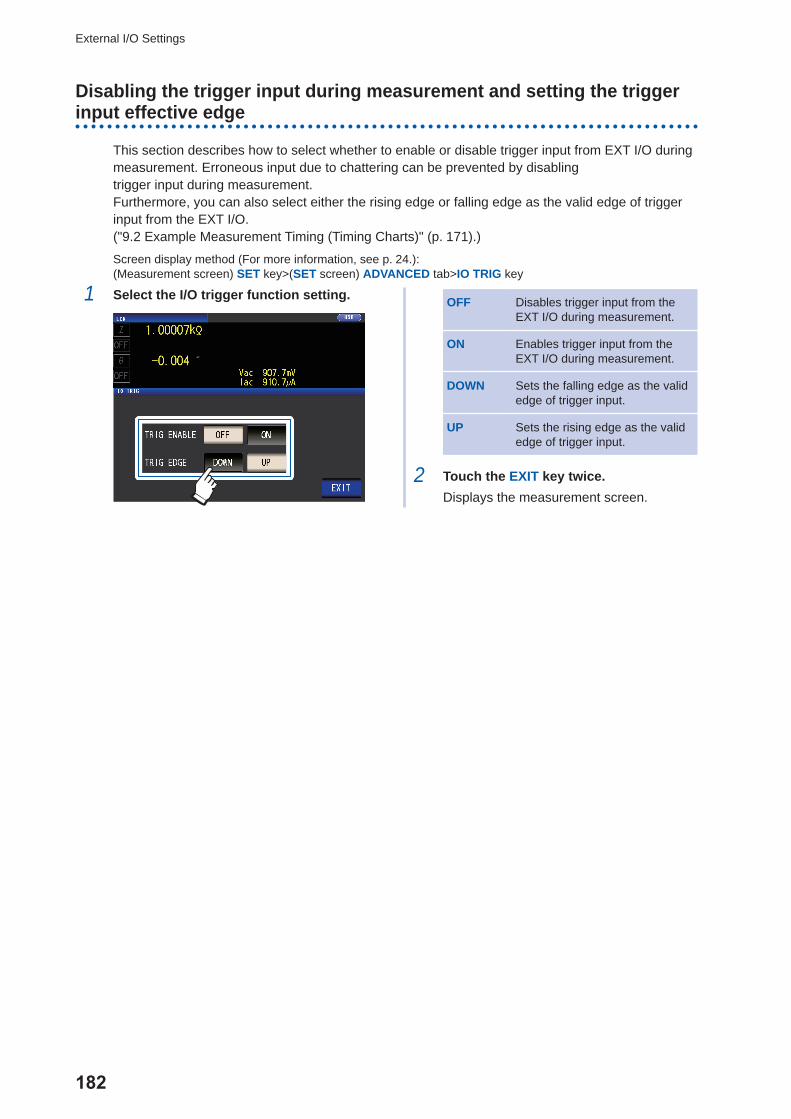
182
External I/O Settings
Disabling the trigger input during measurement and setting the trigger input effective edge
This section describes how to select whether to enable or disable trigger input from EXT I/O during measurement. Erroneous input due to chattering can be prevented by disablingtrigger input during measurement.Furthermore, you can also select either the rising edge or falling edge as the valid edge of trigger input from the EXT I/O.("9.2 Example Measurement Timing (Timing Charts)" (p. 171).)
Screen display method (For more information, see p. 24.):(Measurement screen) SET key>(SET screen) ADVANCED tab>IO TRIG key
1 Select the I/O trigger function setting. OFF Disables trigger input from the EXT I/O during measurement.
ON Enables trigger input from the EXT I/O during measurement.
DOWN Sets the falling edge as the valid edge of trigger input.
UP Sets the rising edge as the valid edge of trigger input.
2 Touch the EXIT key twice.Displays the measurement screen.

183
External I/O Settings
Setting the E________
OM output method and output time
The higher the measurement frequency, the shorter the time that INDEX―――――
and EOM―――
are HI (during measurement).If the HI time when receiving the INDEX
―――――
and EOM―――
signals is too short for reasons related to the input circuit, you can configure the instrument so that the LO signal is held (i.e., so that EOM
―――
output is continued) after EOM
―――
changes to LO when measurement completes before reverting to HI.The INDEX
―――――
output method can be changed in the same manner.
Screen display method (For more information, see p. 24.):(Measurement screen) SET key>(SET screen) ADVANCED tab>IO EOM key
1 Select the EOM―――
output method.
HOLD EOM―――
will be in the HI state for (analog measurement time + calculation time + delay time t1) (see "9.2 Example Measurement Timing (Timing Charts)" (p. 171)).
PULSE EOM―――
will be in the HI state except during the set pulse width time.
1
2
2 Set the EOM―――
output time during PULSE operation with the keys.Settable range: 0.0001 s to 0.9999 sIf you make a mistake, touch the C key to reenter the value.
• For a timing chart illustrating operation when using the HOLD and PULSE settings, see p. 173.
• The output time can only be set when using the PULSE output method. (The output time when using the HOLD output method is the time until output turns off after the receipt of the next trigger, a minimum of 400 ms.)
3 Touch the EXIT key twice.Displays the measurement screen.
9
External C
ontrol

184
External I/O Settings
Outputting measured values (switching to BCD mode) *LCR mode only
This section describes how to switch the output mode (between judgment mode and BCD mode) during LCR mode operation. The default setting is judgment mode, in which case judgment results are output. Changing the mode to BCD mode causes measured values to be output.
Screen display method (For more information, see p. 24.):(Measurement screen) SET key>(SET screen) ADVANCED tab>IO BCD key
1 Touch the ON key.
OFF Sets the output mode to judgment mode. (Judgment results will be output.)
ON Sets the output mode to BCD mode. (Measured values will be output.)
2 Set the decimal point position with the keys.
PARA1 Sets the decimal point position for the No. 1 parameter.
PARA3 Sets the decimal point position for the No. 3 parameter.
(Select: 9.99999G/999.999M/ 99.9999M/ 9.99999M/999.999k/ 99.9999k/ 9.99999k/999.999/ 99.9999/ 9.99999/999.999m/ 99.9999m/ 9.99999m/999.999µ/ 99.9999µ/ 9.99999µ/999.999n/ 99.9999n/ 9.99999n/999.999p/ 99.9999p)
Example:To display the No. 1 parameter measured value as 12.3456 µF and the No. 3 param-eter measured value as -80.567°, use the following settings:PARA1: 99.9999µPARA3: 99.9999
3 Touch the EXIT key twice.Displays the measurement screen.

185
External control Q&A
9.5 External control Q&AThis section presents a list of frequently asked questions about external control for your reference.
Common Questions Answers
How do I connect external trigger input? Connect the TRIG――――
input pin to an ISO_COM pin using a switch or open-collector output.
Which pins are common ground for input and output signals?
The ISO_COM pins.
Are the common (signal ground) pins shared by both inputs and outputs?
Both common ground pins can be shared by inputs and out-puts.
How do I confirm output signals? Confirm voltage waveforms with an memory recorder and oscilloscope.To do this, the output pins such as EOM
―――
and comparator deci-sion outputs need to be pulled up (through several kΩ).
How do I troubleshoot input (control) signal issues?
For example, if triggering does not operate properly, bypass the PLC and short the TRIG pin directly to an ISO_COM pin. Be careful to avoid power shorts.
Are the comparator decision signals (HI, IN, LO) retained during measurement (or can they be off)?
They are initially set to be confirmed at the end of measure-ment and turned OFF when measurement starts. However, it is possible to change the settings so that the judgment results from last time are also stored during measurement.(See "Setting the delay time (from judgment result output to EOM output) and judgment result reset operation" (p. 181).)
When are measurement error signalsdisplayed?
The ERR signal will be output in the following circumstances: • When sampling error • When contact error • When High-Z reject error • When constant voltage/constant current error • When voltage/current limit value exceeded error
See "Output signals when errors occur" (p. 170).
Is a connector or flat cable for connectionprovided?
A connector and cable are not supplied, so you need to pro-vide them yourself.
Is direct connection to a PLC possible? Direct connection is supported for relay or open-collector outputs and positive-ground optocoupler inputs. (Before con-necting, confirm that voltage and current ratings will not be exceeded.)
Can external I/O be used at the sametime as RS-232C or other communica-tions?
After setting up communications, it is possible to control mea-surement with the TRIG signal while acquiring measurement data via a communications interface.
How should external power be connected? All of the instrument’s EXT I/O connector’s input and output signals are driven by the instrument’s internal isolated power supply. If the power supply needed to acquire output signals satisfies the internal isolated power supply’s specifications requirements (4.5 to 5 V, 100 mA), use the internal isolated power supply (No. 8 pin). If not, supply power from an exter-nal source such that the maximum load voltage (30 V) is not exceeded. Do not connect the power supply to the internal isolated power supply (No. 8 pin).
I can’t acquire the EXT I/O output signal.(I don’t know what type the output circuit is.)
EXT I/O output is open-drain output. Please connect wiring properly for open-drain output. (see p. 176.)
9
External C
ontrol

186
Measurement Using a Computer
9.6 Measurement Using a ComputerYou can control the instrument with communication commands from a computer via the USB, GP-IB, RS-232C, LAN interfaces. To enable communication, the communication conditions need to be set on the instrument.For details on the communication condition settings, refer to "Setting the Interface (Controlling the Instrument from a Computer)" (p. 132).For more detailed information about control methods, see the Communications Instruction Manual on the bundled LCR Application Disc.

187
General Specifications
10 SpecificationsThese specifications apply to the IM3536 LCR Meter.
10.1 General SpecificationsMeasurement mode
LCR mode Measurement under a single set of conditions
Continuous measurement mode Continuous measurement using saved conditions; measure using up to 60 sets of conditions
Measurement itemsParameters: Select up to 4 out of 17 measurement parameters.
Parameters Description Parameters Description
Z Impedance Ls Equivalent series inductance
Y Admittance Lp Equivalent parallel inductance
θ Phase angle Cs Equivalent series capacitance
Rs Equivalent series resistance (ESR) Cp Equivalent parallel capacitance
Rp Equivalent parallel resistance Q Q factor
X Reactance D Loss coefficient tanδ
G Conductance Rdc DC resistance
B Susceptance σ Conductivity
ε Permittivity
Display range
Parameters Display range (6 digits)
Z 0.00 m to 9.99999 GΩ
Y 0.000 n to 9.99999 GS
θ ±(0.000° to 999.999°)
Rs, Rp, X, Rdc ±(0.00 m to 9.99999 GΩ)
G, B ±(0.000 n to 9.99999 GS)
Cs, Cp ±(0.0000 p to 9.99999 GF)
Ls, Lp ±(0.00000 µ to 9.99999 GH)
D ±(0.00000 to 9.99999)
Q ±(0.00 to 9999.99)
∆% ±(0.000% to 999.999%)
σ, ε ±(0.00000 to 999.999 G)
The screen will indicate DISP OUT if the upper limit is exceeded.
Default settings
No. 1 Parameter Z No. 2 and No. 4 Parameter OFF
No. 3 Parameter θ
10 Specifications
10
Specifications
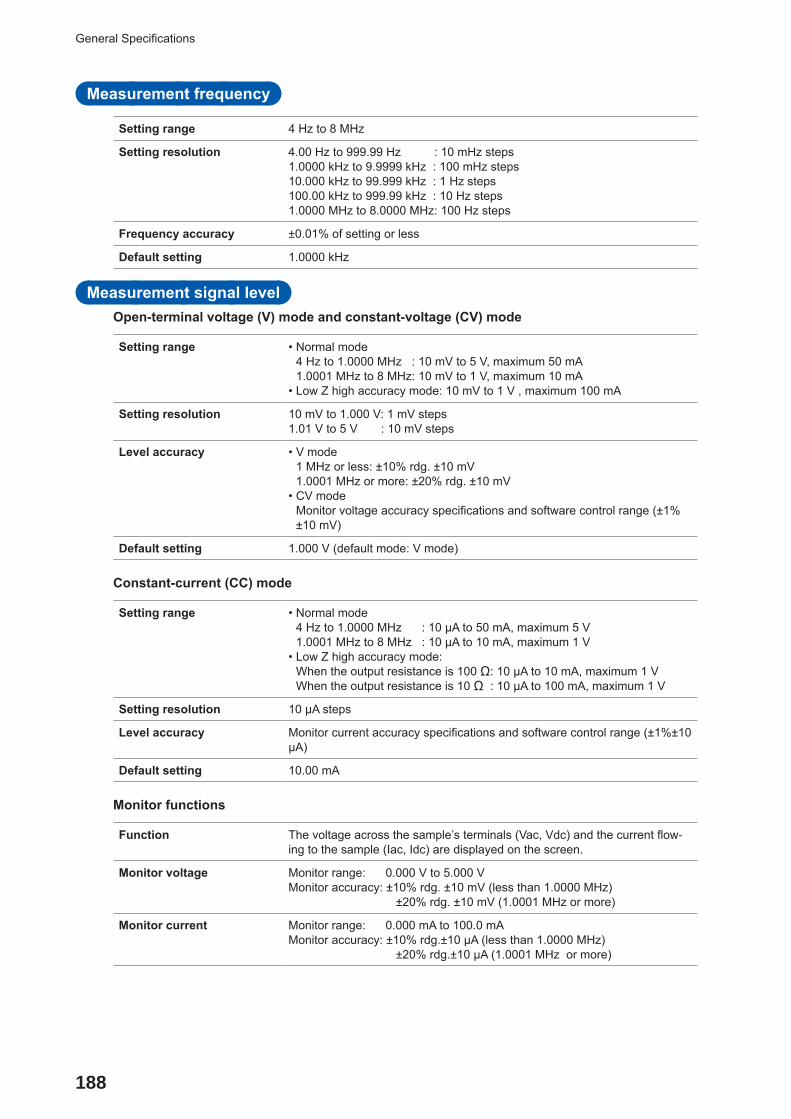
188
General Specifications
Measurement frequency
Setting range 4 Hz to 8 MHz
Setting resolution 4.00 Hz to 999.99 Hz : 10 mHz steps1.0000 kHz to 9.9999 kHz : 100 mHz steps10.000 kHz to 99.999 kHz : 1 Hz steps100.00 kHz to 999.99 kHz : 10 Hz steps1.0000 MHz to 8.0000 MHz: 100 Hz steps
Frequency accuracy ±0.01% of setting or less
Default setting 1.0000 kHz
Measurement signal levelOpen-terminal voltage (V) mode and constant-voltage (CV) mode
Setting range • Normal mode4 Hz to 1.0000 MHz : 10 mV to 5 V, maximum 50 mA1.0001 MHz to 8 MHz: 10 mV to 1 V, maximum 10 mA
• Low Z high accuracy mode: 10 mV to 1 V , maximum 100 mA
Setting resolution 10 mV to 1.000 V: 1 mV steps1.01 V to 5 V : 10 mV steps
Level accuracy • V mode1 MHz or less: ±10% rdg. ±10 mV1.0001 MHz or more: ±20% rdg. ±10 mV
• CV modeMonitor voltage accuracy specifications and software control range (±1% ±10 mV)
Default setting 1.000 V (default mode: V mode)
Constant-current (CC) mode
Setting range • Normal mode4 Hz to 1.0000 MHz : 10 µA to 50 mA, maximum 5 V1.0001 MHz to 8 MHz : 10 µA to 10 mA, maximum 1 V
• Low Z high accuracy mode: When the output resistance is 100 Ω: 10 µA to 10 mA, maximum 1 VWhen the output resistance is 10 Ω : 10 µA to 100 mA, maximum 1 V
Setting resolution 10 µA steps
Level accuracy Monitor current accuracy specifications and software control range (±1%±10 µA)
Default setting 10.00 mA
Monitor functions
Function The voltage across the sample’s terminals (Vac, Vdc) and the current flow-ing to the sample (Iac, Idc) are displayed on the screen.
Monitor voltage Monitor range: 0.000 V to 5.000 VMonitor accuracy: ±10% rdg. ±10 mV (less than 1.0000 MHz)
±20% rdg. ±10 mV (1.0001 MHz or more)
Monitor current Monitor range: 0.000 mA to 100.0 mAMonitor accuracy: ±10% rdg.±10 µA (less than 1.0000 MHz)
±20% rdg.±10 µA (1.0001 MHz or more)

189
General Specifications
Limit function
Function Sets limits (limit values) on the voltage that can be applied to the sample or the current that can flow to the sample.
Operating mode OFF/ON
Current limit During open-terminal voltage mode or constant-voltage mode operationLimit range: 0.01 mA to 100.00 mALimit accuracy: Monitor current accuracy specifications and software control range (±1%±10 µA)
Voltage limit During constant-current mode operationLimit range: 0.01 V to 5.000 VLimit accuracy: Monitor current accuracy specifications and software control range (±1%±10 mV)
Default setting OFF
Output impedance (HCUR terminal, measurement frequency 1 kHz)
Normal mode 100 Ω±10 Ω*
Low impedance high accu-racy mode
10 Ω±2 Ω
*: The output resistance and termination resistance will be set to 50 Ω (The output resistance is the resistance connected to the HCUR terminal, and the termination resistance is the resistance connected to the LCUR termi-nal) when measuring under the following conditions with the cable length set to 1 m, 2 m, or 4 m:All measurement frequencies for the 10 kΩ range to the 100 MΩ rangeMeasurement frequencies from 1.0001 MHz to 8 MHz for the 100 mΩ range to the 1 kΩ range
10
Specifications

190
General Specifications
Measurement range
Measurement range 10 ranges (100 mΩ, 1 Ω, 10 Ω, 100 Ω, 1 kΩ, 10 kΩ, 100 kΩ, 1 MΩ, 10 MΩ, 100 MΩ) • Defined for impedance Z. • Other measurement parameters are calculated from Z and θ values.See "Appx. 1 Measurement Parameters and Calculation Formula" (p. Appx.1).
• See the table below for the accuracy guaranteed range and the selection of auto ranges for each range.
Range selection method Selected with the HOLD setting, AUTO setting, or judgment synchronization setting.
HOLD setting The range is set manually.The measurement range is fixed.
AUTO setting The optimal range is set automatically.
Judgment synchronization setting
The optimal range for the judgment standards being used for comparator or BIN measurement is set automatically.
Default setting AUTO, judgment synchronization OFF
Range Guaranteed accuracy range AUTO ranging range
100 MΩ 8 MΩ to 200 MΩ 8 MΩ or more
10 MΩ 800 kΩ to 100 MΩ 800 kΩ to 10 MΩ
1 MΩ 80 kΩ to 10 MΩ 80 kΩ to 1 MΩ
100 kΩ 8 kΩ to 1 MΩ 8 kΩ to 100 kΩ
10 kΩ 800 Ω to 100 kΩ 800 Ω to 10 kΩ
1 kΩ 80 Ω to 10 kΩ 80 Ω to 1 kΩ
100 Ω 8 Ω to 100 Ω 8 Ω to 100 Ω
10 Ω 800 mΩ to 10 Ω 800 mΩ to 10 Ω
1 Ω 80 mΩ to 1 Ω 80 mΩ to 1 Ω
100 mΩ 1 mΩ to 100 mΩ 0 Ω to 100 mΩ
• The guaranteed accuracy range differs depending on the measurement conditions (See p. 213.) • Outside the selection of ranges, measured values whose accuracy is not guaranteed are displayed on the screen.
• Outside the A/D input range, OVERFLOW or UNDERFLOW is displayed on the screen.
Low Z high accuracy mode
Function Increases the measurement current using 10 Ω output resistance (to a maximum of 100 mA and a maximum applied voltage of 1 V). As a result, the measurement precision increases.
Operation mode OFF/ON
Target ranges 100 mΩ, 1 Ω, 10 Ω range
Frequency range 4 Hz to 1.0000 MHz
Default setting OFF
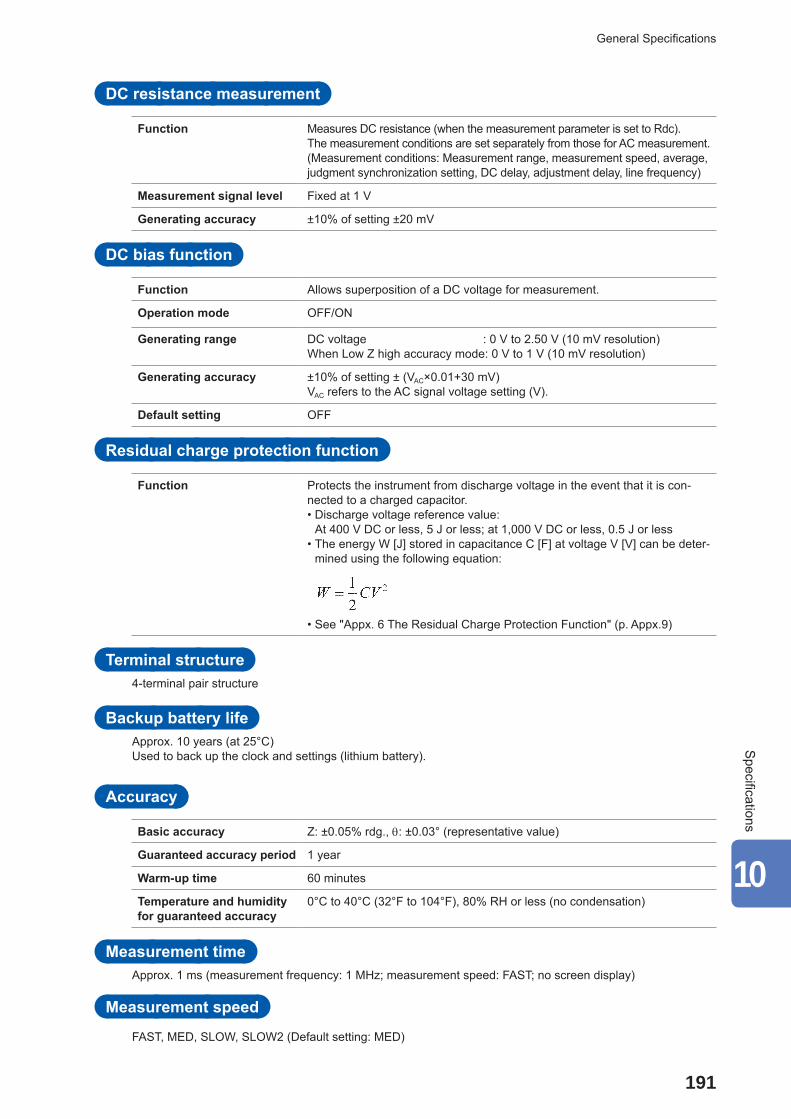
191
General Specifications
DC resistance measurement
Function Measures DC resistance (when the measurement parameter is set to Rdc). The measurement conditions are set separately from those for AC measurement.(Measurement conditions: Measurement range, measurement speed, average, judgment synchronization setting, DC delay, adjustment delay, line frequency)
Measurement signal level Fixed at 1 V
Generating accuracy ±10% of setting ±20 mV
DC bias function
Function Allows superposition of a DC voltage for measurement.
Operation mode OFF/ON
Generating range DC voltage : 0 V to 2.50 V (10 mV resolution)When Low Z high accuracy mode: 0 V to 1 V (10 mV resolution)
Generating accuracy ±10% of setting ± (VAC×0.01+30 mV)VAC refers to the AC signal voltage setting (V).
Default setting OFF
Residual charge protection function
Function Protects the instrument from discharge voltage in the event that it is con-nected to a charged capacitor. • Discharge voltage reference value:At 400 V DC or less, 5 J or less; at 1,000 V DC or less, 0.5 J or less
• The energy W [J] stored in capacitance C [F] at voltage V [V] can be deter-mined using the following equation:
• See "Appx. 6 The Residual Charge Protection Function" (p. Appx.9)
Terminal structure4-terminal pair structure
Backup battery lifeApprox. 10 years (at 25°C)Used to back up the clock and settings (lithium battery).
Accuracy
Basic accuracy Z: ±0.05% rdg., θ: ±0.03° (representative value)
Guaranteed accuracy period 1 year
Warm-up time 60 minutes
Temperature and humidity for guaranteed accuracy
0°C to 40°C (32°F to 104°F), 80% RH or less (no condensation)
Measurement timeApprox. 1 ms (measurement frequency: 1 MHz; measurement speed: FAST; no screen display)
Measurement speed
FAST, MED, SLOW, SLOW2 (Default setting: MED)
10
Specifications

192
Environmental and Safety Specifications
10.2 Environmental and Safety Specifications
Operating temperature and humidity
0°C to 40°C (32°F to 104°F), 80% RH or less (no condensation)
Storage temperature and humidity
-10°C to 50°C (14°F to 122°F), 80% RH or less (no condensation)
Operating environment Indoors, Pollution Degree 2, altitude up to 2000 m (6562 ft.)
Rated supply voltage 100 V AC to 240 V AC (Voltage fluctuations of ±10% from the rated supply voltage are taken into account.)
Rated power supply fre-quency
50 Hz/ 60 Hz
Maximum rated power 50 VA
Dimensions Approx. 330W×119H×230D mm (12.99" W ×4.69" H ×9.06" D)(excluding protrusions)
Mass Approx. 4.2 kg (148.1 oz.)
Standards EMC EN61326 Class ASafety EN61010
Effect of radiated radio-frequency electromagnetic field
Z: ±5% rdg., θ: ±5° at 10 V/m
Effect of conducted radio-frequency electromagnetic field
Z: ±5% rdg., θ: ±5° at 3 V
Dielectric strength Between the power wire and ground wire: 1.62 kV AC for 1 minutes, cutoff current 10 mA
Product warranty period 1 year

193
Accessories and Options
10.3 Accessories and OptionsAccessories: Refer to "Accessories" (p. 1).Options: Refer to "Options (reference: open and short correction states)" (p. 2).
10.4 Function specificationsDC measurement (DC resistance measurement)
DC adjustment
Function Functionality for measuring and canceling the circuit offsetON/OFF selectableWhen ON : Acquires the offset value at each measurement.When OFF: Uses the offset value acquired initially in subsequent measurements.
Offset value acquisition methods(When set to “off”)
• Change the Rdc range (the offset is acquired automatically when the range is changed).
• Change the Rdc low Z high accuracy mode setting (ON/OFF) while using a range from 100 mΩ to 10 Ω (value acquisition will be performed automati-cally when the setting is changed).
• Change the adjust delay time (value acquisition will be performed auto-matically when the delay time is changed).
• Touch the GET DCR OFFSET key on the screen. • Input a signal from an external device to the instrument’s EXT I/O connector. • Send a communications command from an external device to the instru-ment’s interface.
Default setting ON
DC delay
Function Sets the time until DC resistance measurement starts.
Setting range 0.0000 s to 9.9999 s (0.0001 s resolution)
Default setting 0.0000 s
Adjustment delay
Function Sets the time to wait before starting offset measurement so that a stable measured value can be obtained.
Setting range 0.0030 s to 9.9999 s (0.0001 s resolution)
Default setting 0.0030 s
Power supply frequency setting
Function Sets the frequency of the power supply being used.
Setting value 50 Hz/ 60 Hz
Default setting 60 Hz
Average
Function Performs processing to average measured values.
Setting range 1 to 256 (1 step)
Averaging method Arithmetic average
Default setting 1 (Average OFF)
10
Specifications
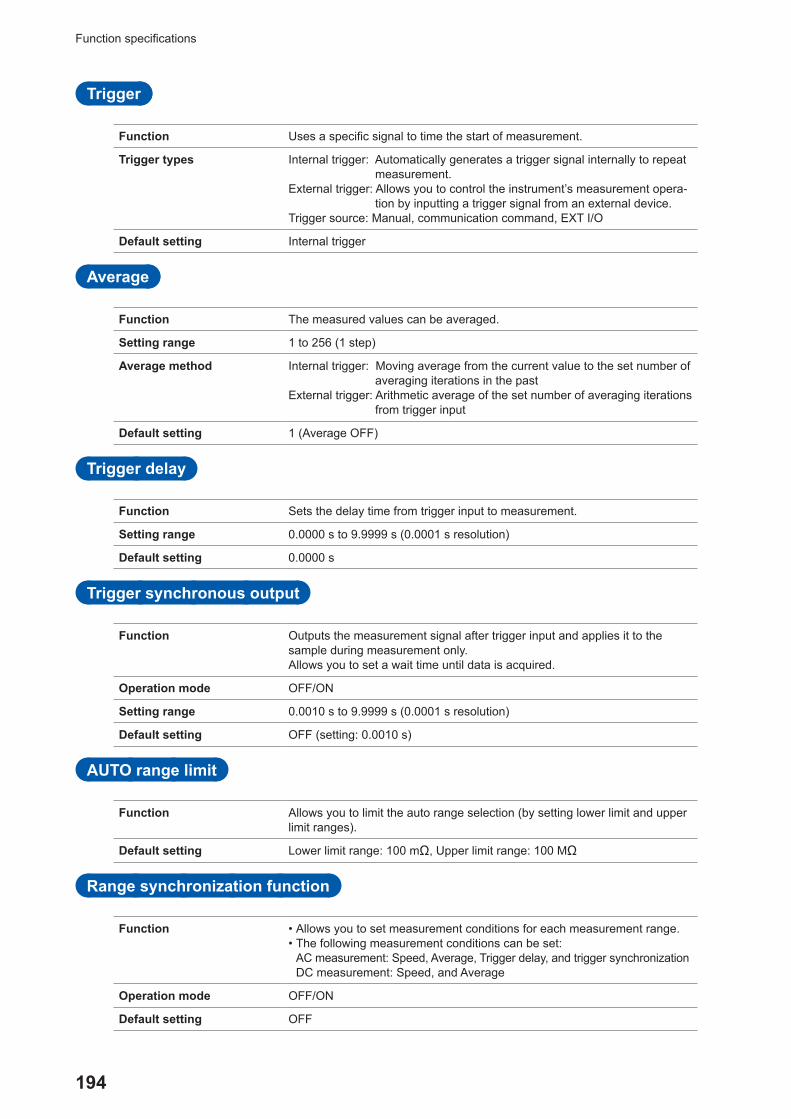
194
Function specifications
Trigger
Function Uses a specific signal to time the start of measurement.
Trigger types Internal trigger: Automatically generates a trigger signal internally to repeat measurement.
External trigger: Allows you to control the instrument’s measurement opera-tion by inputting a trigger signal from an external device.
Trigger source: Manual, communication command, EXT I/O
Default setting Internal trigger
Average
Function The measured values can be averaged.
Setting range 1 to 256 (1 step)
Average method Internal trigger: Moving average from the current value to the set number of averaging iterations in the past
External trigger: Arithmetic average of the set number of averaging iterations from trigger input
Default setting 1 (Average OFF)
Trigger delay
Function Sets the delay time from trigger input to measurement.
Setting range 0.0000 s to 9.9999 s (0.0001 s resolution)
Default setting 0.0000 s
Trigger synchronous output
Function Outputs the measurement signal after trigger input and applies it to the sample during measurement only. Allows you to set a wait time until data is acquired.
Operation mode OFF/ON
Setting range 0.0010 s to 9.9999 s (0.0001 s resolution)
Default setting OFF (setting: 0.0010 s)
AUTO range limit
Function Allows you to limit the auto range selection (by setting lower limit and upper limit ranges).
Default setting Lower limit range: 100 mΩ, Upper limit range: 100 MΩ
Range synchronization function
Function • Allows you to set measurement conditions for each measurement range. • The following measurement conditions can be set:AC measurement: Speed, Average, Trigger delay, and trigger synchronizationDC measurement: Speed, and Average
Operation mode OFF/ON
Default setting OFF

195
Function specifications
BIN measurement
Function • Displays up to 10 judgment results for two parameters (the No. 1 param-eter and No. 3 parameter) (BIN1 to BIN10, OUT OF BINS).
• Allows you to output judgment results to an external device from EXT I/O.
Judgment method • Set as absolute values:Set the upper and lower limits for the measurement parameters as abso-lute values.
• Set as percentage:Enter the reference value and set the upper and lower limits as percentag-es of the reference value. (Measured values for the measurement param-eters will be displayed as they are.)
• Set as deviation percentage:Enter the reference value and set the upper and lower limits as percent-ages of the reference value. (Measured values will be displayed in terms of their deviation from the reference value.)
Valid setting range • Set as absolute values : -9.99999 G to 9.99999 G • Set as percentage : -999.999% to 999.999% • Set as deviation percentage : -999.999% to 999.999%
Default setting OFF
Comparator
Function • Displays measurement results for two parameters (the No. 1 parameter and the No. 3 parameter) as a HI/IN/LO result.
• Allows you to output judgment results to an external device from EXT I/O.
Judgment method • Set as absolute values:Set the upper and lower limits for the measurement parameters as abso-lute values.
• Set as percentage:Enter the reference value and set the upper and lower limits as percentag-es of the reference value. (Measured values for the measurement param-eters will be displayed as they are.)
• Set as deviation percentage:Enter the reference value and set the upper and lower limits as percent-ages of the reference value. (Measured values will be displayed in terms of their deviation from the reference value.)
Valid setting range • Set as absolute values : -9.99999 G to 9.99999 G • Set as percentage : -999.999% to 999.999% • Set as deviation percentage : -999.999% to 999.999%
Default setting OFF
Conductivity and permittivity calculations
Function Measures conductivity and permittivity after the user sets conditions used in calculating conductivity and permittivity.
Settings • L: Sample length (mm) • A: Sample cross-sectional area (mm2) • C: Selection of whether to use Cs (equivalent series capacitance) or Cp
(equivalent parallel capacitance) in calculations (default setting: Cs)
Valid setting range • L: 0.000001 mm to 1000000 mm (default setting: 20.00000 mm) • A: 0.000001 mm2 to 1000000 mm2 (default setting: 12.00000 mm2)
Equation Conductivity σ= LZ×A
(Z: Impedance value), permittivity ε=LA
×C
10
Specifications

196
Function specifications
Contact check4-terminal contact check
Function Performs a contact (disconnection) check between HCUR and HPOT and be-tween LCUR and LPOT.
Check timing Variable • BEFORE: Checks contact before measurement. • AFTER : Checks contact after measurement. • BOTH : Checks contact before and after measurement.
Threshold setting VariableSettings: 1 to 5, with larger values indicating greater sensitivity (low contact resistance values)Default setting: 4 (50 Ω)
Setting value 1 2 3 4 5
Threshold values of the contact resistance (Ω) 1000 500 100 50 20
Delay time setting A user-specified delay time may be set since the contact check may not function properly if the sample is a charged capacitor.Settable time: 0.0000 s to 1.0000 s (0.0001 s resolution)Default setting: 0.0000 s
Default setting OFF
High-Z reject function (detection of OPEN state during 2-terminal measurement)
Function When the measurement value is higher than the judgment reference, a con-tact error is output.
Judgment reference Can be set to 0% to 30000% (1% resolution) of range full-scale.
Error output • Displays errors on the measurement screen. • Outputs errors to an external device from the EXT I/O connector.
Default setting OFF
Memory
Function • Measurement result items (maximum 32000 items) can be saved to the instrument.
• Memory can be read using communications commands or a USB flash drive.
Number of measurement results setting range
• 1 to 32000
Operation mode OFF/ IN/ ON • OFF: Memory function disabled • IN : Saves measured values in memory only when all measurement
parameters that are being judged using the comparator or BIN func-tion yield a “PASS” result.
• ON : Saves all measured values.
Default setting OFF
Number of display digits setting
Function Allows you to set the number of display digits for measured values for each measurement parameter.
Valid setting range 3 to 6 digits
Default setting 6 digits
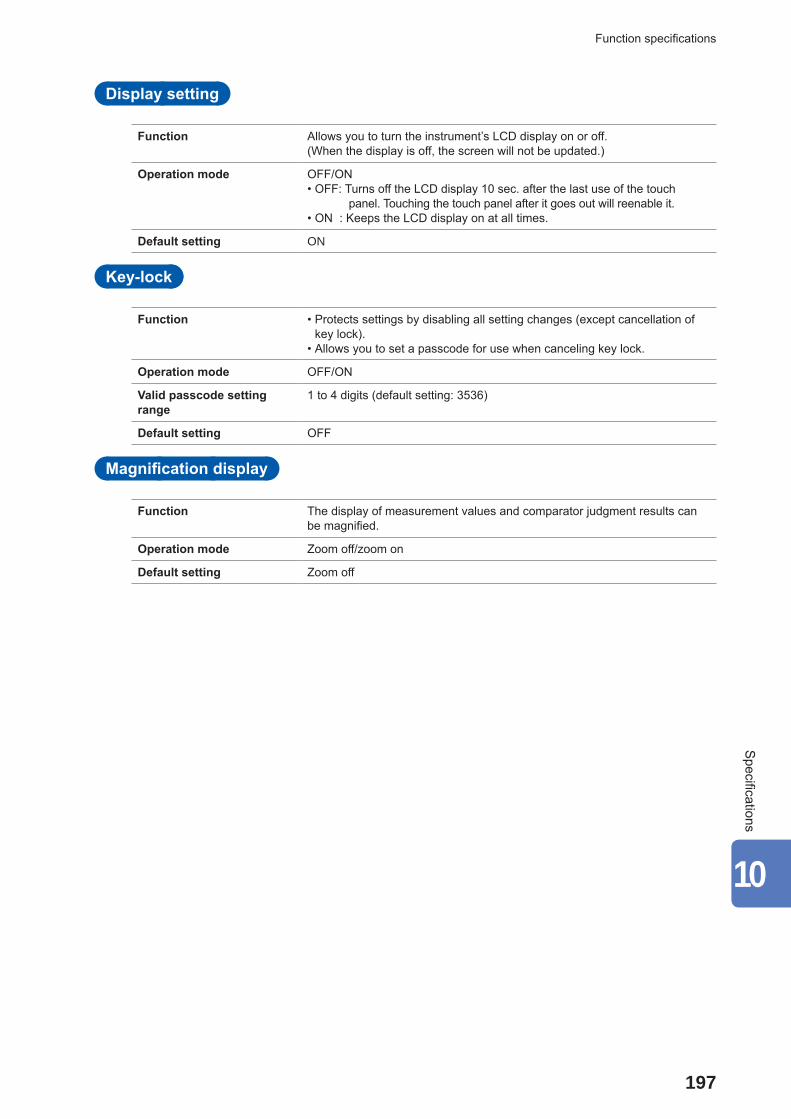
197
Function specifications
Display setting
Function Allows you to turn the instrument’s LCD display on or off.(When the display is off, the screen will not be updated.)
Operation mode OFF/ON • OFF: Turns off the LCD display 10 sec. after the last use of the touch
panel. Touching the touch panel after it goes out will reenable it. • ON : Keeps the LCD display on at all times.
Default setting ON
Key-lock
Function • Protects settings by disabling all setting changes (except cancellation of key lock).
• Allows you to set a passcode for use when canceling key lock.
Operation mode OFF/ON
Valid passcode setting range
1 to 4 digits (default setting: 3536)
Default setting OFF
Magnification display
Function The display of measurement values and comparator judgment results can be magnified.
Operation mode Zoom off/zoom on
Default setting Zoom off
10
Specifications

198
Function specifications
Waveform averaging
Function • Allows you to set the number of measurement waveforms for each mea-surement frequency band as desired.
• Measurement precision increases as the number of waveforms increases, while measurement speed increases as the number of waveforms decreases.
Operation mode OFF/ON
Valid setting range See table below.
Default setting OFF
Measurement frequencyWaveform averaging
function ON Waveform averaging function OFF
Valid setting range FAST MED SLOW SLOW2
DC (Power supply frequency 50 Hz) 1 to 2000 5 100 500 2000
DC (Power supply frequency 60 Hz) 1 to 2400 6 100 600 2400
4.00 Hz to 10.00 Hz 1 to 4 1 2 3 4
10.01 Hz to 39.99 Hz 1 to 10 1 2 5 10
40.00 Hz to 99.99 Hz 1 to 40 1 2 5 40
100.00 Hz to 300.00 Hz 1 to 50 1 2 5 50
300.01 Hz to 500.00 Hz 1 to 200 1 2 10 200
500.01 Hz to 1.0000 kHz 1 to 300 1 5 20 300
1.0001 kHz to 2.0000 kHz 1 to 600 1 8 40 600
2.0001 kHz to 3.0000 kHz 1 to 1200 2 12 60 1200
3.0001 kHz to 5.0000 kHz 1 to 2000 3 20 100 2000
5.0001 kHz to 10.000 kHz 1 to 3000 5 40 200 3000
10.001 kHz to 20.000 kHz 1 to 1200 2 16 80 1200
20.001 kHz to 30.000 kHz 1 to 480 1 6 24 480
30.001 kHz to 50.000 kHz 1 to 800 1 10 40 800
50.001 kHz to 100.00 kHz 1 to 1200 2 16 80 1200
100.01 kHz to 140.00 kHz 1 to 2400 4 32 160 2400
140.01 kHz to 200.00 kHz 1 to 2400 4 32 160 2400
200.01 kHz to 300.00 kHz 1 to 960 2 12 48 960
300.01 kHz to 400.00 kHz 1 to 1600 2 20 80 1600
400.01 kHz to 500.00 kHz 1 to 1600 2 20 80 1600
500.01 kHz to 700.00 kHz 1 to 2400 4 32 160 2400
700.01 kHz to 1.0000 MHz 1 to 2400 4 32 160 2400
1.0001 MHz to 1.4000 MHz 1 to 960 2 14 64 960
1.4001 MHz to 2.0000 MHz 1 to 960 2 14 64 960
2.0001 MHz to 3.0000 MHz 1 to 1440 3 24 96 1440
3.0001 MHz to 4.0000 MHz 1 to 2400 4 40 160 2400
4.0001 MHz to 5.0000 MHz 1 to 2400 4 40 160 2400
5.0001 MHz to 6.0000 MHz 1 to 4000 8 64 250 4000
6.0001 MHz to 8.0000 MHz 1 to 4000 8 64 250 4000

199
Function specifications
Continuous measurement
Function Performs continuous measurement using measurement conditions that have been saved using the panel save function. Measurement is started by an external trigger (any of the three types de-scribed below). • Touch the TRIG key on the screen. • Input a signal from an external device to the instrument’s EXT I/O connector. • Send a communications command from an external device to the USB connector, LAN connector, RS-232C connector, or GP-IB connector on the rear of the instrument.
Maximum number of measurements
60
Display timing setting REAL/AFTER (Default setting: REAL) • REAL: Displays results one at a time after measurement under each set
of conditions. • AFTER: Displays all results together after continuous measurement is
complete.
Display setting The LCD can be turned on or off (default: ON). • OFF: Turns off the LCD display 10 sec. after the last use of the touch
panel. Touching the touch panel after it goes out will reenable it. • ON: Keeps the LCD display on at all times.
Judgment results output Allows you to output up to two sets of judgment results simultaneously from the instrument’s EXT I/O.
CorrectionOpen correction: Increases measurement precision by eliminating the effects of the mea-
surement cable’s stray admittance. • All correction
Function • Acquires correction values for all measurement frequencies. • Allows you to limit the correction range (by setting the minimum and maxi-mum correction frequencies).
• Spot correction
Function Acquires correction values for the set measurement frequencies.
Maximum number of settings
5 points
Valid frequency setting range
DC, 4 Hz to 8 MHz
• OFF (Default setting)
Function Disables open correction data.
Short correction: Increases measurement precision by eliminating the effects of the mea-surement cable’s residual impedance.
• All correction
Function • Acquires correction values for all measurement frequencies. • Allows you to limit the correction range (by setting the minimum and maxi-mum correction frequencies).
10
Specifications
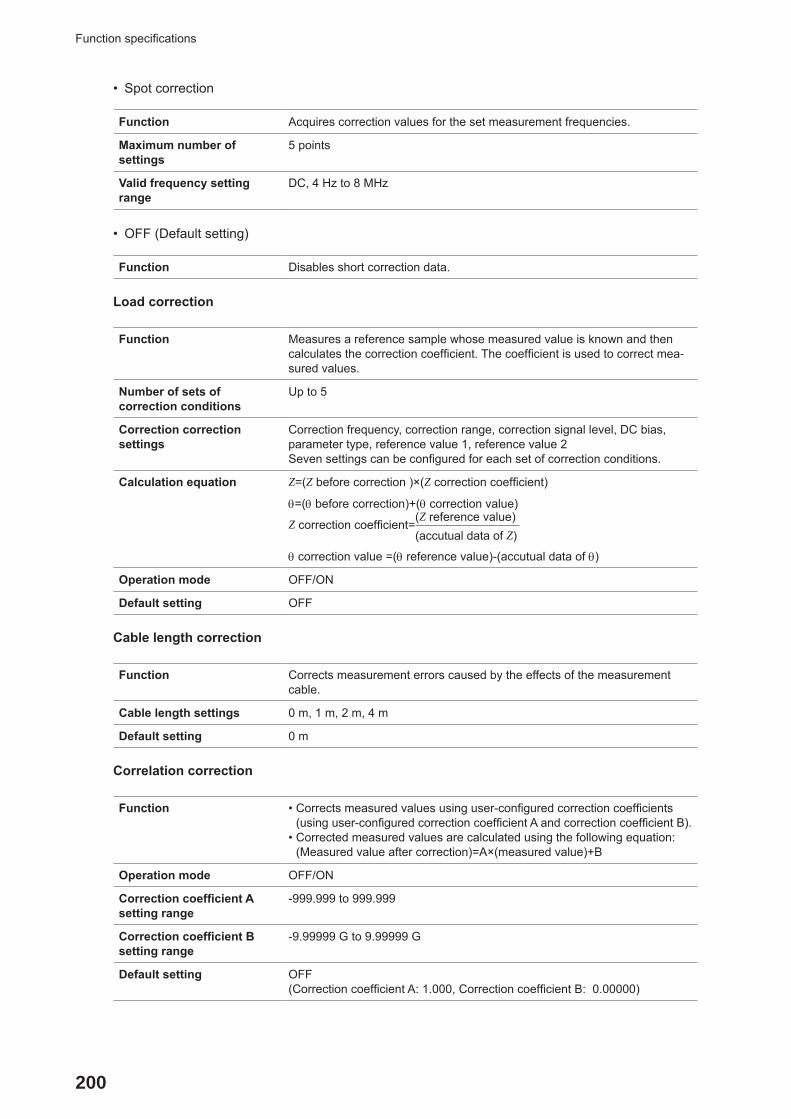
200
Function specifications
• Spot correction
Function Acquires correction values for the set measurement frequencies.
Maximum number of settings
5 points
Valid frequency setting range
DC, 4 Hz to 8 MHz
• OFF (Default setting)
Function Disables short correction data.
Load correction
Function Measures a reference sample whose measured value is known and then calculates the correction coefficient. The coefficient is used to correct mea-sured values.
Number of sets of correction conditions
Up to 5
Correction correction settings
Correction frequency, correction range, correction signal level, DC bias, parameter type, reference value 1, reference value 2Seven settings can be configured for each set of correction conditions.
Calculation equation Z=(Z before correction )×(Z correction coefficient)
θ=(θ before correction)+(θ correction value)
Z correction coefficient=(Z reference value)(accutual data of Z)
θ correction value =(θ reference value)-(accutual data of θ)
Operation mode OFF/ON
Default setting OFF
Cable length correction
Function Corrects measurement errors caused by the effects of the measurement cable.
Cable length settings 0 m, 1 m, 2 m, 4 m
Default setting 0 m
Correlation correction
Function • Corrects measured values using user-configured correction coefficients (using user-configured correction coefficient A and correction coefficient B).
• Corrected measured values are calculated using the following equation:(Measured value after correction)=A×(measured value)+B
Operation mode OFF/ON
Correction coefficient A setting range
-999.999 to 999.999
Correction coefficient B setting range
-9.99999 G to 9.99999 G
Default setting OFF(Correction coefficient A: 1.000, Correction coefficient B: 0.00000)

201
Function specifications
Panel save and load
Function Saves measurement conditions and correction values in the instrument’s in-ternal memory and loads saved data. The desired measurement conditions may be loaded using the following methods: • Using the keys on the instrument • Sending communications commands from an external device to the USB connector, LAN connector, RS-232C connector, or GP-IB connector on the rear of the instrument
• Inputting a signal from an external device to the instrument’s EXT I/O connector
Save types ALL/HARD/ADJ • ALL : Saves all HARD and ADJ content. • HARD: Saves measurement conditions and cable length correction setting. • ADJ : Saves settings for open correction, short correction, load
correction, and correlation correction and correction values only.
Number of data points that can be saved
Measurement conditions: Up to 60Correction values : Up to 128
Default setting ALL
Beep tone setting
Function Allows you to set the key tone and judgment result beep tone.
Comparator judgment setting OFF/ IN/ NG (Default setting: NG) • OFF: Does not sound a beep for comparator judgments. • IN : Sounds a beep when the result is an IN judgment. • NG : Sounds a beep when the result is LO or HI.
Key input setting OFF/ON (Default setting: ON) • OFF: Does not sound a beep when a key is touched. • ON : Sounds a beep when a key is touched.
Tone setting Allows you to select any of four beep tones (A, B, C, or D).(Default setting: A)
Internal temperature monitoring
Function • Monitors the temperature inside the instrument. • Monitors whether the fan is operating. • Displays a warning on the screen in the event of a malfunction.
Error display temperature threshold
Ambient temperature 50°C
Fan stoppage monitoring threshold
30% of the rated speed of rotation (4,100 r/min.) or less
USB flash drive operationSaving measurement data
Function • LCR mode:The SAVE key saves measured values shown on the current screen.
• Continuous measurement mode:The SAVE key saves measurement results for the each panel.
Saved data Measuring instrument information, time and date, measurement conditions, measurement parameters, and measurement values
Data format CSV file format
File name Generated automatically based on the time and date and given the extension “CSV.”
10
Specifications

202
Function specifications
Saving screenshots
Function The SAVE key saves the currently displayed screen.
Data format BMP file format (256 colors or 2-color monochrome)
File name Generated automatically based on the time and date and given the exten-sion “BMP.”
Saving instrument settings
Function • Saves settings information as a settings file on the FILE screen. • Allows you to load previously saved settings files and restore their settings on the FILE screen.
File name Generated automatically based on the time and date and given the exten-sion “SET.”
Saving all settings (All save function)
Function • Saves settings information including panel save content as a settings file on the FILE screen.
• Allows you to load settings files including panel save content that were saved using the all save function and restore their settings on the FILE screen.
File name Generated automatically based on the time and date and given the exten-sion “SET” for setting files (panel save extension is “PNL”).
External control (using the EXT I/O connector)Input and output signals
Function • Switches between judgment mode and BCD mode. • In BCD mode, comparator/BIN judgment results are not output. • BCD output is only enabled in LCR mode. • BCD output includes the No. 1 and No. 3 parameters.
Judgment mode
Function Outputs comparator/BIN judgment results.
Input signal TRIG――――
, LD0―――
to――
LD6―――
, LD_VALID―― ―――――
Output signal EOM―――
, INDEX―――――
, ERR―――
, HI――
, IN――
, LO――
, AND―――
, BIN1――――
to BIN10―――――
BCD mode
Function Generates BCD output for the No. 1 and No. 3 parameter measured values.
Input signal TRIG――――
, LD0―――
to――
LD6―――
, LD_VALID, C1―― ――――― ――
, C2――
Output signal EOM―――
, INDEX―――――
, ERR―――
, D4-3―――
to D4-0―――
, D3-3―――
to D3-0―――
, D2-3―――
to D2-0―――
, D1-3―――
to D1-0―――
Trigger enable function
Function Allows you to set whether to enable trigger input from EXT I/O during mea-surement (starting when the trigger is received and while EOM
―――
is being output as HI).
Operation mode OFF/ONOFF: Disabled; ON: Enabled
Default setting ON
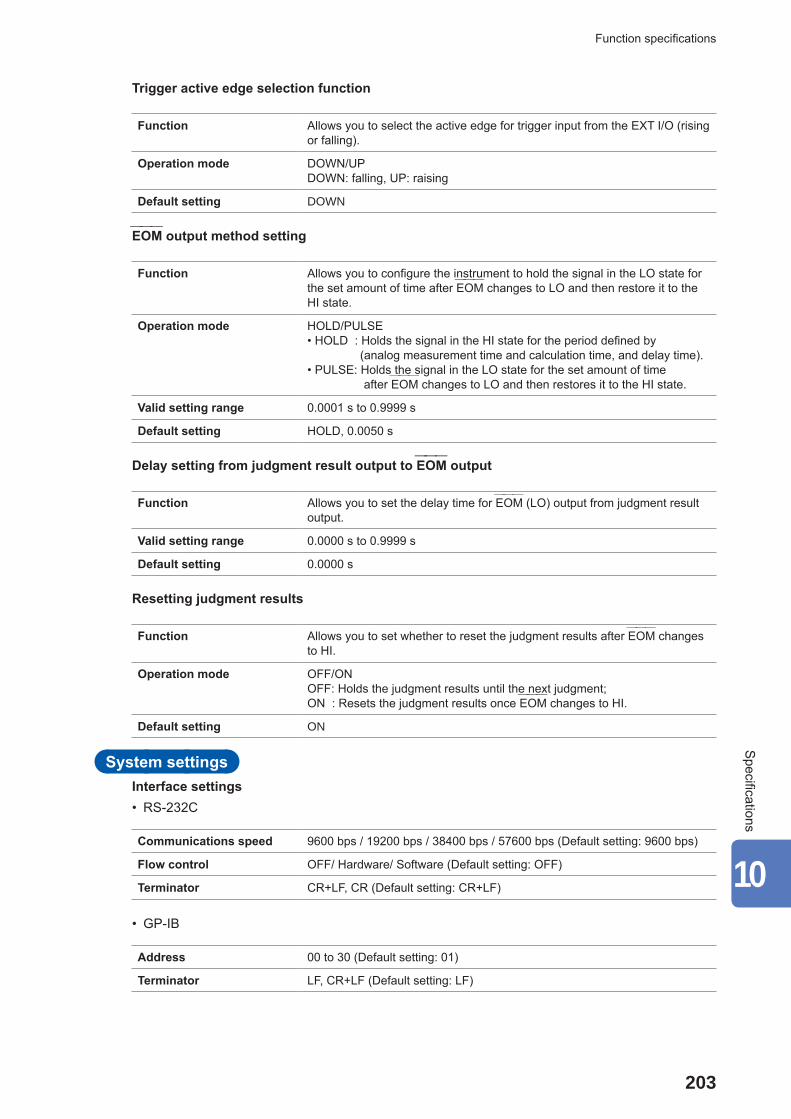
203
Function specifications
Trigger active edge selection function
Function Allows you to select the active edge for trigger input from the EXT I/O (rising or falling).
Operation mode DOWN/UPDOWN: falling, UP: raising
Default setting DOWN
EOM―――
output method setting
Function Allows you to configure the instrument to hold the signal in the LO state for the set amount of time after EOM
―――
changes to LO and then restore it to the HI state.
Operation mode HOLD/PULSE • HOLD : Holds the signal in the HI state for the period defined by
(analog measurement time and calculation time, and delay time). • PULSE: Holds the signal in the LO state for the set amount of time
after EOM―――
changes to LO and then restores it to the HI state.
Valid setting range 0.0001 s to 0.9999 s
Default setting HOLD, 0.0050 s
Delay setting from judgment result output to EOM―――
output
Function Allows you to set the delay time for EOM―――
(LO) output from judgment result output.
Valid setting range 0.0000 s to 0.9999 s
Default setting 0.0000 s
Resetting judgment results
Function Allows you to set whether to reset the judgment results after EOM―――
changes to HI.
Operation mode OFF/ONOFF: Holds the judgment results until the next judgment; ON : Resets the judgment results once EOM
―――
changes to HI.
Default setting ON
System settingsInterface settings • RS-232C
Communications speed 9600 bps / 19200 bps / 38400 bps / 57600 bps (Default setting: 9600 bps)
Flow control OFF/ Hardware/ Software (Default setting: OFF)
Terminator CR+LF, CR (Default setting: CR+LF)
• GP-IB
Address 00 to 30 (Default setting: 01)
Terminator LF, CR+LF (Default setting: LF)
10
Specifications
204
Function specifications
• USB
Terminator CR+LF, CR (Default setting: CR+LF)
• LAN
IP address Four 3-digit values (from 0 to 255 each)(Default setting: 192.168.000.001)
Subnet mask Four 3-digit values (from 0 to 255 each)(Default setting: 255.255.255.000)
Default gateway Four 3-digit values (from 0 to 255 each) (Default setting: OFF)
Port number 1024 to 65535 (Default setting: 3500)
Terminator CR+LF, CR (Default setting: CR+LF)
Instrument information
Serial number information Displays the serial number.
Version information Displays the software version and the FPGA version.
MAC address Displays the MAC address.
USB ID Displays the USB ID.
Self-check function
Panel test Allows you to check for touch panel errors.
Panel calibration Allows you to calibrate the touch panel.
Display status test Allows you to check the screen display status and LED status.
ROM/RAM test Allows you to check the instrument’s internal memory (ROM and RAM) for errors.
EXT I/O test Allows you to verify that output signals are output normally from EXT I/O and that input signals can be read properly.
Time setting
Time and date setting Sets the year, month, day, hour, minute, and second.

205
Interfaces
10.5 InterfacesDisplay
Display 5.7-inch VGA color TFT LCD (640 × 480 dots)
Dot pitch 0.06(W)mm×0.18(H)mm
Touch panel Analog resistive film type
EXT I/O connector
Connector D-sub 37-pin female #4-40 inch thread
Input signal Photocoupler-isolated, no-voltage contact inputInput ON voltage : 0 V to 0.9 VInput OFF voltage : OPEN, or 5 V to 24 VMaximum input voltage: 30 V
Output signal Photocoupler-isolated, Nch open drain outputMaximum load voltage : 30 VMaximum output current: 50 mA/CHResidual voltage : 1 V or less (50 mA)
Built-in isolated power sup-ply
Voltage : 4.5 V to 5 VMaximum output current: 100 mAFloating relative to protective ground potential and measurement circuit
Pin and signal assignments See "Instrument connector signal assignments" (p. 162).
Rear USB connector
Connector USB Type B receptacle
Electrical specifications USB2.0 (High Speed)
Number of receptacles 1
Front USB connector
Connector USB type A
Electrical specification USB2.0 (High Speed)
Bus power Max. 500 mA
Number of ports 1
Supported USB flash drives USB Mass Storage Class compatible
Functions • Saves measured values, measurement conditions, correction values, instrument settings, and screen data.
• Loads previously saved measurement conditions, correction values, mea-sured values, instrument settings, and screen data. 10
Specifications

206
Interfaces
RS-232C connector
Connector D-sub 9-pin connector
Data length 8
Parity None
Stop bit 1
Flow control Hardware/ Software
Terminator CR+LF, CR
Communication speed 9600 bps, 19200 bps, 38400 bps, 57600 bps
GP-IB connector
Connector 24-pin Centronics type connector
Standards IEEE-488.1 1987, IEEE-488.2 1987
LAN connector
Connector RJ-45 connector
Transmission method 10Base-T/100Base-T automatic detection
Protocol TCP/IP

207
Measurement Range and Accuracy
10.6 Measurement Range and AccuracyMeasurement accuracy equation: Measurement accuracy is calculated using the following equation.
Measurement accuracy = Basic accuracy × C × D × E × F × GC: Level coefficient, D: Measurement speed coefficient, E: Cable length coefficient, F: DC bias coefficient, G: Temperature coefficient (operating temperature coefficient)
Basic accuracyAccuracy is calculated based on coefficients A and B from the basic accuracy chart shown below.(See "Example calculation of basic accuracy" (p. 209).)
1 kΩ range or higher Basic accuracy =10 1ZxA B ×
± + × − Range
100 Ω range or lower Basic accuracy = 1A BZx
± + × −
Range
Zx: Impedance of the measurement sampleA and B: Noted in basic accuracy chart. (Upper value: Z accuracy [% rdg.]; lower value: θ accuracy [°])
• From 1.0001 MHz to 5 MHz, multiple basic accuracy by (fm [MHz]+3)/4.*
• From 5.0001 MHz to 8 MHz, multiple basic accuracy by fm [MHz]/2.*
*: "fm" is measurement frequency [MHz].
Basic accuracy chart
Range For DC measurement
For AC measurement (measurement frequency)4 Hz to 99.99 Hz 100.00 Hz to 999.99 Hz 1.0000 kHz to 10.000 kHz
100 MΩ A=1 B=1A=6 B=5 A=3 B=2 A=3 B=2
A=5 B=3 A=2 B=2 A=2 B=2
10 MΩ A=0.5 B=0.3A=0.8 B=1 A=0.5 B=0.3 A=0.5 B=0.3
A=0.8 B=0.5 A=0.4 B=0.2 A=0.4 B=0.2
1 MΩ A=0.2 B=0.1A=0.4 B=0.08 A=0.3 B=0.05 A=0.3 B=0.05
A=0.3 B=0.08 A=0.2 B=0.02 A=0.2 B=0.02
100 kΩ A=0.1 B=0.01A=0.3 B=0.03 A=0.2 B=0.03 A=0.2 B=0.03
A=0.2 B=0.02 A=0.1 B=0.02 A=0.1 B=0.02
10 kΩ A=0.1 B=0.01A=0.3 B=0.03 A=0.2 B=0.02 A=0.05 B=0.02
A=0.2 B=0.02 A=0.1 B=0.02 A=0.03 B=0.02
1 kΩ A=0.1 B=0.01A=0.3 B=0.02 A=0.2 B=0.02 A=0.2 B=0.02
A=0.2 B=0.01 A=0.1 B=0.02 A=0.1 B=0.02
100 Ω A=0.1 B=0.02A=0.3 B=0.02 A=0.2 B=0.02 A=0.2 B=0.02
A=0.2 B=0.01 A=0.15 B=0.01 A=0.1 B=0.01
10 Ω A=0.2 B=0.15A=0.5 B=0.1 A=0.4 B=0.05 A=0.4 B=0.05
A=0.3 B=0.1 A=0.3 B=0.03 A=0.3 B=0.03
1 Ω A=0.3 B=0.3A=1.5 B=1 A=1 B=0.3 A=1 B=0.3
A=0.8 B=0.5 A=0.5 B=0.2 A=0.5 B=0.2
100 mΩ A=1 B=1A=8 B=8 A=5 B=4 A=3 B=2
A=5 B=4 A=3 B=2 A=2 B=1.5
10
Specifications

208
Measurement Range and Accuracy
RangeFor AC measurement (measurement frequency)
10.001 kHz to 100.00 kHz 100.01 kHz to 1 MHz 1.0001 MHz to 8 MHz
100 MΩ- - - - - -
- - - - - -
10 MΩA=2 B=1 - - - -
A=2 B=1 - - - -
1 MΩA=0.5 B=0.1 A=3 B=0.5 - -
A=0.6 B=0.1 A=3 B=0.5 - -
100 kΩA=0.25 B=0.04 A=1 B=0.3 A=2 B=0.5
A=0.2 B=0.02 A=1 B=0.3 A=2 B=0.3
10 kΩA=0.3 B=0.02 A=0.5 B=0.05 A=2 B=0.5
A=0.2 B=0.02 A=0.5 B=0.05 A=1.5 B=0.3
1 kΩA=0.2 B=0.02 A=0.4 B=0.02 A=1.5 B=0.2
A=0.15 B=0.02 A=0.4 B=0.02 A=1.5 B=0.2
100 ΩA=0.2 B=0.02 A=0.5 B=0.03 A=1.5 B=0.2
A=0.15 B=0.02 A=0.5 B=0.03 A=1.5 B=0.2
10 ΩA=0.4 B=0.05 A=0.8 B=0.1 A=2 B=1.5
A=0.3 B=0.03 A=0.5 B=0.05 A=2 B=1
1 ΩA=1 B=0.3 A=1.5 B=1 A=3 B=3
A=0.5 B=0.2 A=0.7 B=0.5 A=3 B=2
100 mΩA=2 B=2 A=4 B=3 - -
A=2 B=1.5 A=3 B=4 - -

209
Measurement Range and Accuracy
Example calculation of basic accuracy
(1) Calculate the basic accuracy for impedance Z=50 Ω.(If the measurement conditions are a measurement frequency of 10 kHz and a measurement speed of SLOW2)Excerpted from the "Basic accuracy" (p. 207).
Range 1.0000 kHz to 10.000 kHz
1 kΩ
100 Ω A= 0.15A= 0.1
B= 0.02B= 0.01
10 Ω
Zθ
1 Find the cell at the intersection of the row for the 100 Ω range (since Z is 50 Ω, the 100 Ω measurement range is used) and the 1.0000 kHz to 10.000 kHz column (since the measurement frequency is 10 kHz) in the "Basic accuracy" (p. 207).
2 Calculate the basic accuracy for Z using the Z coefficients A and B.Based on the accuracy table, coefficient A = 0.15 and coefficient B = 0.02.Plug in the values for the 100 Ω range in the "Basic accuracy" (p. 207) into the follow-ing equation:Z accuracy = 1000.15 0.02 1
50 Ω
± + × − Ω =±0.17% rdg.
3 Similarly, calculate the basic accuracy of θ .The accuracy table yields the values A=0.1 and B=0.01Using the basic accuracy formula of "Basic accuracy" (p. 207) for "100 Ω or less".
θ accuray = 1000.1 0.01 150
Ω ± + × − Ω
=±0.11°
10
Specifications
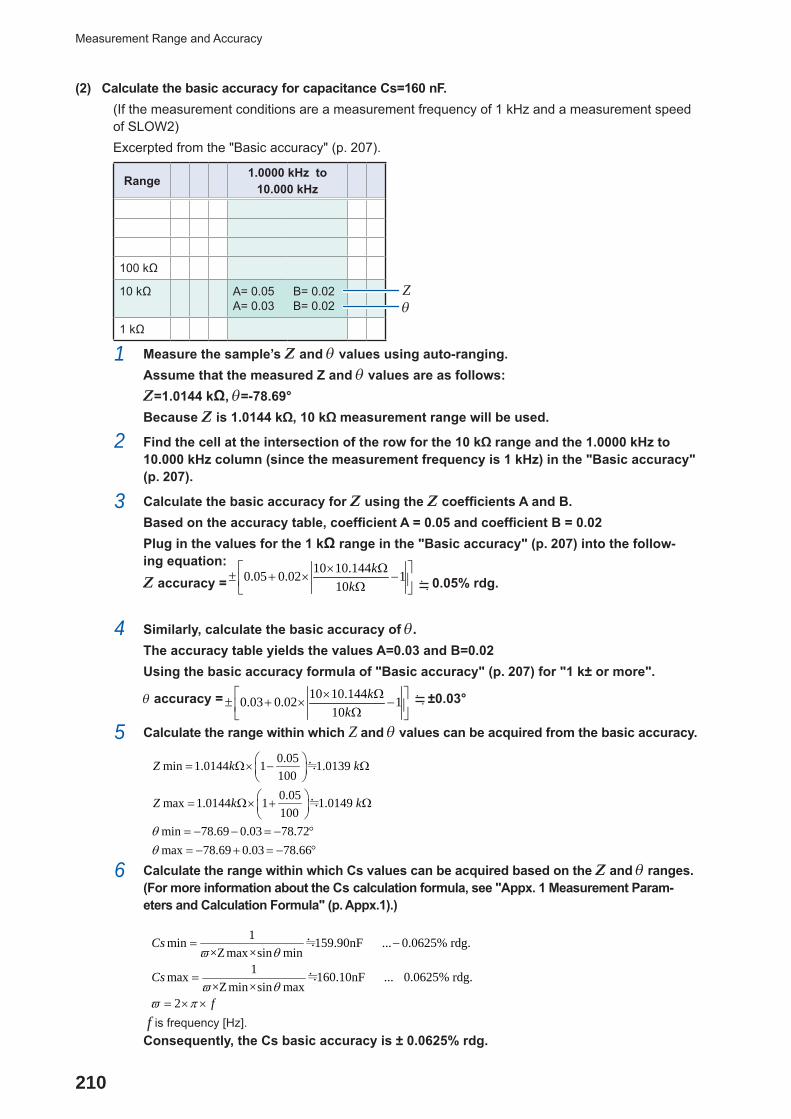
210
Measurement Range and Accuracy
(2) Calculate the basic accuracy for capacitance Cs=160 nF.(If the measurement conditions are a measurement frequency of 1 kHz and a measurement speed of SLOW2)Excerpted from the "Basic accuracy" (p. 207).
Zθ
Range 1.0000 kHz to 10.000 kHz
100 kΩ
10 kΩ A= 0.05A= 0.03
B= 0.02B= 0.02
1 kΩ
1 Measure the sample’s Z and θ values using auto-ranging.Assume that the measured Z and θ values are as follows:Z=1.0144 kΩ, θ=-78.69°Because Z is 1.0144 kΩ, 10 kΩ measurement range will be used.
2 Find the cell at the intersection of the row for the 10 kΩ range and the 1.0000 kHz to 10.000 kHz column (since the measurement frequency is 1 kHz) in the "Basic accuracy" (p. 207).
3 Calculate the basic accuracy for Z using the Z coefficients A and B.Based on the accuracy table, coefficient A = 0.05 and coefficient B = 0.02Plug in the values for the 1 kΩ range in the "Basic accuracy" (p. 207) into the follow-ing equation:Z accuracy =
10 10.1440.05 0.02 110
kk
× Ω ± + × − Ω 0.05% rdg.
4 Similarly, calculate the basic accuracy of θ .The accuracy table yields the values A=0.03 and B=0.02Using the basic accuracy formula of "Basic accuracy" (p. 207) for "1 k± or more".
θ accuracy = 10 10.1440.03 0.02 110
kk
× Ω ± + × − Ω
±0.03°
5 Calculate the range within which Z and θ values can be acquired from the basic accuracy.
0.05min 1.0144 1 1.0139 1000.05max 1.0144 1 1.0149 100
min 78.69 0.03 78.72max 78.69 0.03 78.66
Z k k
Z k k
θθ
= Ω× − Ω = Ω× + Ω
= − − = − °= − + = − °
≒
≒
6 Calculate the range within which Cs values can be acquired based on the Z and θ ranges.(For more information about the Cs calculation formula, see "Appx. 1 Measurement Param-eters and Calculation Formula" (p. Appx.1).)
3
3
3
3
10×1.0144×10Z = 0.05+0.02× -1 0.05%10×10
10×1.0144×10= 0.03+0.02× -1 0.0310×10
0.05min 1.0144 × 1- 1.0139 1000.05max 1.0144 × 1- 1.0149 100
min 78.69 0.
Z k k
Z k k
θ
θ
± ±
± ± °
= Ω Ω = Ω Ω
= − −
基本確度 ≒
基本確度 ≒
≒
≒
03 78.72max 78.69 0.03 78.66
1min 159.90nF ... 0.0625% rdg.×Zmax×sin min
1max 160.10nF ... 0.0625% rdg.×Zmin×sin max
2
Cs
Cs
f
θ
ϖ θ
ϖ θϖ π
= − °= − + = − °
= −
=
= × ×
≒
≒
f is frequency [Hz].Consequently, the Cs basic accuracy is ± 0.0625% rdg.

211
Measurement Range and Accuracy
Whether a given range is available varies with settings (cable length setting and DC bias setting). [Cable length 0 m]
RangeMeasurement frequency
DC 4 Hz to 99.99 Hz
100 Hz to 999.99 Hz
1 kHz to 10 kHz
10.001 kHz to 100 kHz
100.01 kHz to 1 MHz
1.0001 MHz to 5 MHz
5.0001 MHz to 8 MHz
100 MΩ
10 MΩ Not available
1 MΩ
100 kΩ
Available
10 kΩ
1 kΩ
100 Ω
10 Ω
1 Ω
100 mΩ Not available
: Unavailable when DC bias is ON but may be set when DC bias is OFF.
[Cable length 1 m]
RangeMeasurement frquency
DC 4 Hz to 99.99 Hz
100 Hz to 999.99 Hz
1 kHz to 10 kHz
10.001 kHz to 100 kHz
100.01 kHz to 1 MHz
1.0001 MHz to 5 MHz
5.0001 MHz to 8 MHz
100 MΩ
10 MΩ Not available
1 MΩ
100 kΩ
10 kΩ
Available1 kΩ
100 Ω
10 Ω
1 ΩNot available
100 mΩ
: Unavailable when DC bias is ON but may be set when DC bias is OFF.
10
Specifications

212
Measurement Range and Accuracy
[Cable length 2 m]
RangeMeasurement frequency
DC 4 Hz to 99.99 Hz
100 Hz to 999.99 Hz
1 kHz to 10 kHz
10.001 kHz to 100 kHz
100.01 kHz to 1 MHz
1.0001 MHz to 2 MHz
2.0001 MHz to 8 MHz
100 MΩ
10 MΩ
1 MΩ
100 kΩ
Not avail-able
10 kΩAvailable1 kΩ
100 Ω
10 Ω
1 Ω
100 mΩ
: Unavailable when DC bias is ON but may be set when DC bias is OFF.
[Cable length 4 m]
RangeMeasurement frequency
DC 4 Hz to 99.99 Hz
100 Hz to 999.99 Hz
1 kHz to 10 kHz
10.001 kHz to 100 kHz
100.01 kHz to 1 MHz
1.0001 MHz to 5 MHz
5.0001 MHz to 8 MHz
100 MΩ
10 MΩ
1 MΩ
100 kΩ
Available Not available
10 kΩ
1 kΩ
100 Ω
10 Ω
1 Ω
100 mΩ

213
Measurement Range and Accuracy
The range of measurement levels for which accuracy is guaranteed varies with the setting condi-tions.
Guaranteed accuracy measurement level range
RangeSample's imped-ance
Measurement frequency
DC 4 Hz to
99.99 Hz100 Hz to 999.99 Hz
1 kHz to 10 kHz
10.001 kHz to 100 kHz
100.01 kHz to 1 MHz
1.0001 MHz to 5 MHz
5.0001 MHz to 8 MHz
100 MΩ 8 MΩ to 200 MΩ
1 V
(fixe
d)
0.101 V to 5 V
10 MΩ
10 MΩ to 100 MΩ 0.101 V to 5 V
800 kΩ to 10 MΩ 0.101 V to 5 V 0.501 V
to 5 V
1 MΩ
1 MΩ to 10 MΩ 0.101 V to 5 V 0.501 V
to 5 V80 kΩ to
1 MΩ 0.050 V to 5 V 0.101 V to 5 V
0.501 V to 5 V
100 kΩ
100 kΩ to 1 MΩ 0.050 V to 5 V 0.101 V
to 5 V0.501 V
to 5 V8 kΩ to 100 kΩ 0.010 V to 5 V 0.050 V
to 5 V0.101 V
to 1 V
10 kΩ
10 kΩ to 100 kΩ 0.010 V to 5 V 0.050 V
to 5 V0.101 V
to 1 V800 Ω to
10 kΩ 0.010 V to 5 V 0.050 V to 5 V
0.050 V to 1 V
0.101 V to 1 V
1 kΩ
1 kΩ to 10 kΩ 0.010 V to 5 V 0.050 V
to 5 V0.050 V
to 1 V0.101 V
to 1 V80 Ω to
1 kΩ 0.010 V to 5 V 0.050 V to 1 V
0.101 V to 1 V
100 Ω 8 Ω to 100 Ω 0.010 V to 5 V 0.050 V
to 1 V0.101 V
to 1 V
10 Ω 800 mΩ to 10 Ω 0.050 V to 5 V 0.101 V to 1 V
1 Ω 80 mΩ to 1 Ω 0.050 V to 5 V 0.101 V
to 5 V 0.501 V to 1 V
100 mΩ 1 mΩ to 100 mΩ 0.101 V to 5 V 0.501 V
to 5 V
The accuracy guarantee range during DC bias operation is 10 mΩ or greater.The accuracy for DC resistance (Rdc) measurement is guaranteed only when offset values are acquired. The guaranteed accuracy range varies with the sample’s impedance.
10
Specifications

214
Measurement Range and Accuracy
C: Measurement level coefficientThe measurement level coefficient is shown in the table below. • DC measurement (DC resistance measurement)
Measurement level 1 V
Coefficient 1
• AC measurement
Measurement level 0.010 V to 0.999 V 1 V 1.001 V to 5 V
Coefficient 1+0.2/V* 1 1+2/V*
*: V is measurement level setting value (open voltage (V) mode equivalent).
D: Measurement speed coefficientThe measurement speed coefficient is shown in the table below.
Measurement speed FAST MED SLOW SLOW2
Coefficient during DC measurement (DC resistance measurement) 4 3 2 1
Coefficient during AC measurement 8 4 2 1
Coefficient during waveform averaging function operation (See table below.)
No. Frequency bandMeasurement speed coefficient
5 4 3 2 1
1 DC (line frequency 50 Hz) 1 to 4 5 to 99 100 to 499 500 to 1999 2000
1 DC (line frequency 60 Hz) 1 to 5 6 to 99 100 to 599 600 to 2499 2400
No. Frequency bandMeasurement speed coefficient
16 8 4 2 1
2 4.00 Hz to 10.00 Hz - 1 2 3 4
3 10.01 Hz to 39.99 Hz - 1 2 to 4 5 to 9 10
4 40.00 Hz to 99.99 Hz - 1 2 to 4 5 to 39 40
5 100.00 Hz to 300.00 Hz - 1 2 to 4 5 to 49 50
6 300.01 Hz to 500.00 Hz - 1 2 to 9 10 to 199 200
7 500.01 Hz to 1.0000 kHz - 1 to 4 5 to 19 20 to 299 300
8 1.0001 kHz to 2.0000 kHz - 1 to 7 8 to 39 40 to 599 600
9 2.0001 kHz to 3.0000 kHz 1 2 to 11 12 to 59 60 to 1199 1200
10 3.0001 kHz to 5.0000 kHz 1 to 2 3 to 19 20 to 99 100 to 1999 2000
11 5.0001 kHz to 10.000 kHz 1 to 4 5 to 39 40 to 199 200 to 2999 3000
12 10.001 kHz to 20.000 kHz 1 2 to 15 16 to 79 80 to 1199 1200
13 20.001 kHz to 30.000 kHz - 1 to 5 6 to 23 24 to 479 480
14 30.001 kHz to 50.000 kHz - 1 to 9 10 to 39 40 to 799 800
15 50.001 kHz to 100.00 kHz 1 2 to 15 16 to 79 80 to 1199 1200
16 100.01 kHz to 140.00 kHz 1 to 3 4 to 31 32 to 159 160 to 2399 2400
17 140.01 kHz to 200.00 kHz 1 to 3 4 to 31 32 to 159 160 to 2399 2400
18 200.01 kHz to 300.00 kHz 1 2 to 11 12 to 47 48 to 959 960

215
Measurement Range and Accuracy
No. Frequency bandMeasurement speed coefficient
16 8 4 2 1
19 300.01 kHz to 400.00 kHz 1 2 to 19 20 to 79 80 to 1599 1600
20 400.01 kHz to 500.00 kHz 1 2 to 19 20 to 79 80 to 1599 1600
21 500.01 kHz to 700.00 MHz 1 to 3 4 to 31 32 to 159 160 to 2399 2400
22 700.01 kHz to 1.0000 MHz 1 to 3 4 to 31 32 to 159 160 to 2399 2400
23 1.0001 MHz to 1.4000 MHz 1 2 to 13 14 to 63 64 to 959 960
24 1.4001 MHz to 2.0000 MHz 1 2 to 13 14 to 63 64 to 959 960
25 2.0001 MHz to 3.0000 MHz 1 to 2 3 to 23 24 to 95 96 to 1439 1440
26 3.0001 MHz to 4.0000 MHz 1 to 3 4 to 39 40 to 159 160 to 2399 2400
27 4.0001 MHz to 5.0000 MHz 1 to 3 4 to 39 40 to 159 160 to 2399 2400
28 5.0001 MHz to 6.0000 MHz 1 to 7 8 to 63 64 to 249 250 to 3999 4000
29 6.0001 MHz to 8.0000 MHz 1 to 7 8 to 63 64 to 249 250 to 3999 4000
E: Coefficient of the measurement cable's lengthThe coefficient of the measurement cable's length is shown in the table below.
Measurement cable's length 0 m 1 m 2 m 4 m
Coefficient 1 1.5 2 3
The settable range for frequency varies with the measurement cable’s length.
Cable length Settable range for frequency
0 m Up to 8 MHz
1 m Up to 8 MHz
2 m Up to 2 MHz
4 m Up to 1 MHz
F: DC bias coefficientThe DC bias coefficient is shown in the table below.
DC bias coefficient OFF ON
Coefficient 1 2
G: Temperature coefficientThe operating temperature coefficient is shown in the table below.(When the operating temperature (t) is 23°C±5°C, use a coefficient of 1.)
Operating temperature t [°C]
Coefficient 1+0.1×|t-23|
10
Specifications

216
Measurement Range and Accuracy
Measurable range for L and CMeasurable range for L
0
0
0
0
0
0
0
0
0
0
1
10
100
1k
10k
100k
1M
10M
1 10 100 1k 10k 100k 1M 10M
Measurement frequency [Hz]
L [H
]
100m
10m
1m
100u
10u
1u
100n
10n
1n
100p
Measurable range for C
0
0
0
0
0
0
0
0
0
0
0
0
0
0
1
10
100
1 10 100 1k 10k 100k 1M 10M
C [F
]
Measurement frequency [Hz]
100m
10m
1m
100u
10u
1u
100n
10n
1n
100p
10p
1p
100f
1f

217
About Measurement Times and Measurement Speed
10.7 About Measurement Times and Measurement Speed
Measurement times vary with the measurement conditions (see the table below). Values are all provided for reference purposes only (and vary with operating conditions).
Analog measurement signal (INDEX―――――
)Measurement speed
Measurement frequency
FAST MED SLOW SLOW2
DC (line frequency 50 Hz) 1 ms 20 ms 100 ms 400 ms
DC (line frequency 60 Hz) 1 ms 16.67 ms 100 ms 400 ms
4.00 Hz to 10.00 Hz Tf 2×Tf 3×Tf 4×Tf
10.01 Hz to 39.99 Hz Tf 2×Tf 5×Tf 10×Tf
40.00 Hz to 99.99 Hz Tf 2×Tf 5×Tf 40×Tf
100.00 Hz to 300.00 Hz Tf 2×Tf 5×Tf 50×Tf
300.01 Hz to 500.00 Hz Tf 2×Tf 10×Tf 200×Tf
500.01 Hz to 1.0000 kHz Tf 5×Tf 20×Tf 300×Tf
1.0001 kHz to 2.0000 kHz Tf 8×Tf 40×Tf 600×Tf
2.0001 kHz to 3.0000 kHz 2×Tf 12×Tf 60×Tf 1200×Tf
3.0001 kHz to 5.0000 kHz 3×Tf 20×Tf 100×Tf 2000×Tf
5.0001 kHz to 10.000 kHz 5×Tf 40×Tf 200×Tf 3000×Tf
10.001 kHz to 20.000 kHz 10×Tf 80×Tf 400×Tf 6000×Tf
20.001 kHz to 30.000 kHz 25×Tf 150×Tf 600×Tf 12000×Tf
30.001 kHz to 50.000 kHz 25×Tf 250×Tf 1000×Tf 20000×Tf
50.001 kHz to 100.00 kHz 50×Tf 400×Tf 2000×Tf 30000×Tf
100.01 kHz to 140.00 kHz 100×Tf 800×Tf 4000×Tf 60000×Tf
140.01 kHz to 200.00 kHz 100×Tf 800×Tf 4000×Tf 60000×Tf
200.01 kHz to 300.00 kHz 250×Tf 1500×Tf 6000×Tf 120000×Tf
300.01 kHz to 400.00 kHz 250×Tf 2500×Tf 10000×Tf 200000×Tf
400.01 kHz to 500.00 kHz 250×Tf 2500×Tf 10000×Tf 200000×Tf
500.01 kHz to 700.00 kHz 500×Tf 4000×Tf 20000×Tf 300000×Tf
700.01 kHz to 1.0000 MHz 500×Tf 4000×Tf 20000×Tf 300000×Tf
1.0001 MHz to 1.4000 MHz 1250×Tf 8750×Tf 40000×Tf 600000×Tf
1.4001 MHz to 2.0000 MHz 1250×Tf 8750×Tf 40000×Tf 600000×Tf
2.0001 MHz to 3.0000 MHz 1875×Tf 15000×Tf 60000×Tf 900000×Tf
3.0001 MHz to 4.0000 MHz 2500×Tf 25000×Tf 100000×Tf 1500000×Tf
4.0001 MHz to 5.0000 MHz 2500×Tf 25000×Tf 100000×Tf 1500000×Tf
5.0001 MHz to 6.0000 MHz 5000×Tf 40000×Tf 156250×Tf 2500000×Tf
6.0001 MHz to 8.0000 MHz 5000×Tf 40000×Tf 156250×Tf 2500000×Tf
• Tf [sec]: 1/measurement frequency [Hz] • The above DC measurement times apply to operation with DC adjustment off. To calculate times for opera-tion with DC adjustment on, multiple the above times by 2 and add 0.5 ms.
10
Specifications

218
About Measurement Times and Measurement Speed
When the contact check is enabled, the contact check time will be added to the analog measure-ment times listed on the previous page.
Contact check
Contact check timing Contact check time
BEFORE 5.5 ms
AFTER 5.5 ms
BOTH 10 ms
• When using the external trigger setting, 500 µs is added to the "Analog measurement signal (INDEX)" (p. 217) when the conditions outlined in the following table apply:
External trigger
Range Low Z high accuracy mode
Measure-ment level
Measurement frequency
DC bias Added time
100 mΩ, 1 Ω OFF All level DC, all frequency OFF 500 µs
100 mΩ, 1 Ω ON 0.01 to 1 V DC, all frequency OFF 500 µs
10 Ω OFF 0.01 to 1 V DC, 4 Hz to 1 MHz OFF 500 µs
Measurement times (E________
OM)Measurement times= I
____________
NDEX+A+B+C+D+EA: Calculation time (no OPEN/SHORT/LOAD correction, HOLD range, no screen display, nor-
mal measurement*)
Measurement speed Calculation time
FAST
All frequencies 0.5 msMED
SLOW
SLOW2
*: Times are given for measurement while not using the comparator function or BIN function.
B: OPEN/SHORT/LOAD correction time
OPEN/SHORT/LOAD correction Correction time
Disabled 0.0 ms
Enabled MAX 0.4 ms
C: Judgment time
Judgment mode Judgment time
Disabled (normal measurement*) 0.0 ms
Comparator measurement MAX 0.4 ms
BIN measurement MAX 0.8 ms
*: Times are given for measurement while not using the comparator function or BIN function.

219
About Measurement Times and Measurement Speed
D: Screen display time
Screen display Screen display time
No display 0.0 ms
Display MAX 0.3 ms
E: Memory save time
Memory function Memory save time
ON, or IN MAX 0.4 ms
OFF 0.0 ms
Wait time(1) When the measurement frequency is changed
When the measurement frequency is changed, the wait time is 1.5 ms.However, the measurement frequency is divided into the following eight frequency ranges. When changing the frequency such that the old frequency was in one of these ranges and the new frequency is in another, a wait of 2 ms is added.
Frequency range
4 Hz to 99.99 Hz
100.00 Hz to 1.0000 kHz
1.0001 kHz to 5.0000 kHz
5.0001 kHz to 10.000 kHz
10.001 kHz to 100.00 kHz
100.01 kHz to 1.0000 MHz
1.0001 MHz to 2.0000 MHz
2.0001 MHz to 8.0000 MHz
(2) When the measurement range or low Z high accuracy mode is changedWhen changing the measurement range or switching low Z high accuracy mode on or off, a wait of 4 ms is added.
(3) When the measurement signal level is changedWhen changing the AC measurement signal level, a 4 ms wait is added.
(4) When the DC bias is changedA 1.5 ms wait is inserted when switching the DC bias on or off.In addition, when changing the applied DC bias value, a 1 ms wait is added.
(5) When the cable length is changedWhen changing the cable length between 0 m and 1 m (or 2 m or 4 m), a 2.5 ms wait is added.
(6) When switching to DC measurement (DC resistance measurement)A 3.5 ms wait is inserted when switching from AC measurement to DC measurement.
(7) When changing multiple measurement conditions simultaneouslyWhen changing multiple measurement conditions simultaneously, a wait of up to 6.5 ms is added.
10
Specifications

220
About Measurement Times and Measurement Speed

221
Calibration, Inspection, Repair, and Cleaning
11 Maintenance and Service
11.1 Calibration, Inspection, Repair, and CleaningBefore requesting instrument repair or inspection, please read "Before returning for repair" (p. 223) and "11.3 Error Massage and Error Display" (p. 230).
Calibrations
IMPORTANTPeriodic calibration is necessary in order to ensure that the instrument provides correct measure-ment results of the specified accuracy.
The calibration frequency varies depending on the status of the instrument or installation environ-ment. We recommend that the calibration frequency is determined in accordance with the status of the instrument or installation environment and that you request that calibration be performed peri-odically.
Inspection and Repair
WARNINGCustomers are not allowed to modify, disassemble, or repair the instrument. Do-ing so may cause fire, electric shock, or injury.
Replaceable Parts and Operating Lifetimes
The characteristics of some of the parts used in the product may deteriorate with extended use. To ensure the product can be used over the long term, it is recommended to replace these parts on a periodic basis. When replacing parts, please contact your Hioki distributor. The service life of parts varies with the operating environment and frequency of use. Parts are not guaranteed to operate
throughout the recommended replacement cycle.
Part Recommended replacement cycle Remarks/conditions
Electrolytic Capacitors Approx. 5 years A PCB on which a part concerned is mounted must be replaced. The board on which the parts in question are mounted should be replaced.
LCD backlight (Brightness reduced by half)
Approx. 5 years If used for 24 hours per day at 25°C
Fan motor Approx. 10 years When used for 24 hours per day
Backup battery Approx. 10 years When turning on the instrument, if the date or time is not substantially accurate, the battery should be re-placed. Replace if the time and date are significantly off when the product is turned on.
11 Maintenance and Service
Maintenance and S
ervice
11
222
Calibration, Inspection, Repair, and Cleaning
Transporting the instrument
• Be sure to observe the following precautions: • To avoid damage to the instrument, remove the accessories and optional equipment from the instrument. Moreover, use the original packing materials in which it was shipped, and be sure to pack in a double carton. Damage occurring during transportation is not covered by the warranty.
• When sending the instrument for repair, be sure to include details of the problem.
Cleaning
• To clean the instrument, wipe it gently with a soft cloth moistened with water or mild detergent.
IMPORTANTNever use solvents such as benzene, alcohol, acetone, ether, ketones, thinners or gasoline, as they can deform and discolor the case.
• Wipe the LCD display gently with a soft, drycloth.
CAUTIONClean the vents periodically to avoid blockage. If a vents becomes clogged, the instru-ments internal cooling is impeded, and damage may result.

223
Troubleshooting
11.2 Troubleshooting • If no measured value is displayed even when the probes are shorted together, internal damage may have occurred. Contact your authorized Hioki distributor or reseller.
• If damage is suspected, check the”Before returning for repair” section before contacting your dealer or Hioki representative. However, in the following cases, immediately stop using the instrument, unplug the power cord and contact your authorized Hioki distributor or reseller. • When the nature of the damage is clearly evident • When measurement is impossible • After long-term storage in adverse conditions such as high temperature or humidity • After being subject to severe shock during transport After severe exposure to water, oil, or dust (internal insulation can be degraded by oil or water, caus-ing increase hazard of electric shock or fire)
Before returning for repair
Improper operation
Symptom Cause Remedy and Reference
Keys and screens
The display does not appear when you turn the power on.
• When power cord is discon-nected.
• The power cord is not con-nected properly.
Check the power cord connection. "2.3 Connecting the Power Cord" (p. 34)
Keys do not work. The instrument is in the key lock state.
Disable the key lock.See "Key-lock function (Disabling key opera-tion)" (p. 90).
The instrument is being con-trolled by an external device us-ing the communications cable.
Cancel remote mode.
A key other than the pressed one is pressed.
Panel correction has not been performed.
Perform panel calibration."Panel calibration" (p. 134)
Nothing is displayed on the screen.
The instrument has been con-figured so that the LCD display turns off automatically once a certain amount of time elapses.
Touch the screen.See "LCD display auto-off (power-saving mode)" (p. 88).
The instrument is in the sus-pended state.
Cancel the suspended state.See "To cancel the suspended state" (p. 37).
Key response and screen drawing are slow.
The measured value automatic output function has been en-abled.
When the measurement value automatic output function is enabled, key response and screen drawing may become slow in order to give prior-ity to measurement and measurement value output.Refer to the Communications Instruction Manual on the bundled LCR Application Disc.
The LCD display ap-pears blurred.
You are pushing on the LCD display with too much force.
Touch the LCD display lightly. Although some degree of blurring may occur depending on how you touch the display, this is normal and does not pose a problem with the instrument’s func-tionality.
Maintenance and S
ervice
11

224
Troubleshooting
Symptom Cause Remedy and Reference
Operation methods
• The instrument doesn't work. You don't know how to use the instrument.
You have not reviewed the user manual.
Check the appropriate section of this manual.
The instrument is being used in an automated system.
Consult the administrator or manager of the instrument or the automated system containing the instrument.
Measurement
The measurement values are exhibiting excessive variation.
The measurement signal level setting is too small.
Change the signal level setting.See "Measurement signal level (AC)" (p. 49).
An error is being displayed. Check items corresponding to the error display, correct the issue, and then perform measure-ment.See "11.3 Error Massage and Error Display" (p. 230).
If Reference Value massage is being displayed, check measurement conditions such as the measurement frequency and measurement sig-nal level and select conditions for which Refer-ence Value massage will not be displayed.See "Guaranteed accuracy measurement level range" (p. 213), "Measurement frequency(AC)" (p. 44), and "Measurement signal level (AC)" (p. 49).
The instrument is being used in an environment with a large amount of noise.
If you are using the instrument in a high-noise environment, consider taking the following mea-sures: • Use guarding.See "Appx. 2 Measurement of High Impedance Components" (p. Appx.3).
• Implement anti-external noise measures.See"Appx. 4 Countermeasures Against Incor-poration of External Noise" (p. Appx.5).
• Separate the sample, measurement cables, and instrument from the source of the noise (motor, inverter, electromagnetic switch, power line, equipment generating sparks, etc.) or perform the measurement in a separate room.
• Plug the instrument into a grounded outlet. • Use a separate power supply from the device that is generating the noise.
A homemade cable is being used.
• Check the wiring method and correct it if nec-essary.
• Use a Hioki-designated cable and configure the instrument with the length of the cable See"5.1 Setting the Cable Length (Cable Length Correction)" (p. 98).
The connection cable is too long.
Use a Hioki-designated cable and configure the instrument with the length of the cable being used.See "5.1 Setting the Cable Length (Cable Length Correction)" (p. 98).

225
Troubleshooting
Symptom Cause Remedy and Reference
The measurement values are exhibiting excessive variation.
Measurement is being per-formed using a 2-terminal con-nection.
• Two-terminal connections are susceptible to the influence of contact resistance. When possible, use a 4-terminal connection to the sample’s electrodes to perform measurement.
• Add a wait time to allow contact to stabilize before measurement.
Open and short correction has not been performed.
Perform open and short correction properly.See"5.2 Open Correction" (p. 99) and "5.3 Short Correction" (p. 105).
Rdc measurement is being performed before the voltage stabilizes.
Include an adequate DC delay and adjustment delay.See "DC delay (setting the DC measurement delay time) (DC)" (p. 61) and "Adjustment de-lay (setting the offset measurement delay time) (DC)" (p. 62).
Multiple IM3536 instruments are being used in close proximity to each other.
Separate instruments and measurement cables before use.
You are unable to perform measurement properly.
An error is being displayed. Check the item indicated by the error display, address the cause, and then perform measure-ment.See "11.3 Error Massage and Error Display" (p. 230).
An OVERFLOW or UNDER-FLOW message is being dis-played.(Measured value greater than upper limit/less than lower limit error)
See "11.3 Error Massage and Error Display" (p. 230).
• If the range is not appropriate:Change to an appropriate range or perform measurement using auto ranging. It is neces-sary to set both the AC measurement and DC measurement ranges.See "Measurement range (AC/DC)" (p. 45).
• If there is a break or short in the wiring:Check the wiring and perform measurement with the correct wiring connections.
An error such as an NC A L or NC B L message is being displayed. (Contact error)
See "11.3 Error Massage and Error Display" (p. 230).
• The sample has not been properly secured in the fixture. Verify that the sample has been properly secured.Refer to the instruction manual of the fixture.
• Check the measurement cable and fixture for broken wires or poor contact.See "2.4 Connecting the Measurement Cables, Probes, or Fixture" (p. 35).
If you are using the instrument in a high-noise environment, consider taking the following mea-sures: • Use guarding.See "Appx. 2 Measurement of High Impedance Components" (p. Appx.3).
• Implement anti-external noise measures.See"Appx. 4 Countermeasures Against Incor-poration of External Noise" (p. Appx.5).
• Separate the sample, measurement cables, and instrument from the source of the noise (motor, inverter, electromagnetic switch, power line, equipment generating sparks, etc.) or perform the measurement in a separate room.
• Plug the instrument into a grounded outlet. • Use a separate power supply from the device that is generating the noise.
Maintenance and S
ervice
11

226
Troubleshooting
Symptom Cause Remedy and Reference
You are unable to perform measurement properly.
An element with its own voltage, for example a battery, is being measured.
If there is a high DC voltage, you may damage the instrument. Avoid measuring the sample.
An element on a circuit board is being measured.
• You can measure an element on a printed cir-cuit board if the target element is isolated from external connections. However, if the target element is connected to other components or external circuitry, you will not be able to obtain a proper measurement.
• You may be unable to measure components in circuits that are generating a voltage or to which a voltage is being applied, for example because they are energized.
A high-impedance element is being measured in a noisy envi-ronment.
Use guarding.See "Appx. 2 Measurement of High Impedance Components" (p. Appx.3).
The DC bias function is being used for a sample other than a capacitor.
Set the DC bias function OFF.See "DC bias (superimposing a DC voltage on the measurement signal)(AC)" (p. 59).
The measurement val-ues differ when a stan-dard resistor, standard capacitor, or other known test sample is measured.
The known sample measure-ment conditions and the instru-ment’s measurement conditions do not match.
Make sure the measurement conditions match.
The open or short correction method is wrong.
Perform open and short correction properly. To perform short correction for the 9140-10, use a short bar without directly shorting the tip.See "5.2 Open Correction" (p. 99), and "5.3 Short Correction" (p. 105).
Load correction has been en-abled.
Set the load correction off.See "5.6 Load Correction (Correcting Values to Match Reference Values)" (p. 112).
The delay time from connection of the sample to measurement is not long enough.
Ensure there is an appropriate trigger delay and trigger synchronous output wait time.See "Trigger (perform measurements with user-defined timing) (Common)" (p. 62) and "Trig-ger synchronous output (Applying the signal to the sample during measurement only) (Com-mon)" (p. 64).
The DC bias function is being used while measuring an ele-ment other than a capacitor.
Set the DC bias function off.See "DC bias (superimposing a DC voltage on the measurement signal)(AC)" (p. 59).
AUTO ranging is un-able to determine a range.
A high-impedance element is being measured in a noisy envi-ronment.
Use guarding.See "Appx. 2 Measurement of High Impedance Components" (p. Appx.3).
AUTO ranging is un-able to determine a range.
The DC bias function is being used while measuring an ele-ment other than a capacitor.
Set the DC bias function off.Set "DC bias (superimposing a DC voltage on the measurement signal)(AC)" (p. 59).
Errors
A contact error is gen-erated even though the connections are correct.
The DC bias function is being used while measuring an ele-ment other than a capacitor.
Set the DC bias function off.See "DC bias (superimposing a DC voltage on the measurement signal)(AC)" (p. 59).
Open correction or short correction re-sulted in an error.
The wrong connection method is being used for open correc-tion or short correction.
Perform open correction or short correction with the proper wiring.See "5.2 Open Correction" (p. 99) and "5.3 Short Correction" (p. 105).

227
Troubleshooting
Symptom Cause Remedy and Reference
Open correction or short correction re-sulted in an error.
The instrument is being used in an environment characterized by a large amount of noise.
If you are using the instrument in a high-noise environment, consider taking the following mea-sures: • Use guarding.See"Appx. 2 Measurement of High Impedance Components" (p. Appx.3).
• Implement anti-external noise measures.See"Appx. 4 Countermeasures Against Incor-poration of External Noise" (p. Appx.5).
• Separate the sample, measurement cables, and instrument from the source of the noise (motor, inverter, electromagnetic switch, power line, equipment generating sparks, etc.) or perform the measurement in a separate room.
• Plug the instrument into a grounded outlet. • Use a separate power supply from the device that is generating the noise.
An error beep sound is emitted continuously.
The measured value automatic output function has been en-abled.
When the measurement value automatic output function is enabled, perform the receive opera-tion on the computer side. Failure to do so will result in a transmission error on the measuring instrument, and the transmission error tone will continue to sound in the event of an internal trigger, etc.Perform the receive operation on the computer side and then perform measurement on the measuring instrument side, or disable the measurement value automatic output function.Refer to the Communications Instruction Manual on the bundled LCR Application Disc.
Communications
You are unable to send and receive data using RS-232C.
A straight cable is being used. Use a cross cable.
The wrong COM port is being used.
Check whether the computer's settings match the connected COM port. Connect the cable to the proper COM port.
Check the computer's settings. The COM port may be selected at the operating system, driver, or application level. Check all of these settings.
The computer has no COM port. Consider using a commercially available USB/RS-232C conversion cable.
The instrument is unable to communicate with the applica-tion.
Check whether the instrument is turned on.Turn on the instrument and complete any inter-face connections before launching the computer application.
For more information about external control, see "9.5 External control Q&A" (p. 185).
Maintenance and S
ervice
11

228
Troubleshooting
When no apparent cause can be establishedPerform a system reset.Most settings will revert to their default values at the time the instrument was shipped from the factory.(Some settings will not revert to their default values. See "Appx. 11 Initial Settings Table" (p. Appx.15).)
A system reset can also be performed with the *RST and:PRESet communications commands.For more information, see the descriptions of the *RST and :PRESet communications commands on the bundled LCR Application Disc.
Initializing (System Reset)
Screen display method (For more information, see p. 24):(Measurement screen) SET key>(SET screen) ADVANCED tab>RESET key
1 Disconnect the measurement sample. 2 Touch the RESET key.
Touch to cancel the system reset. (The mea-surement screen will be displayed.)
Settings will revert to their factory defaults, and the measurement screen will be dis-played.
If you are unable to display the initialization screen or perform a system reset, perform a full reset. (See p. 229)

229
Troubleshooting
Performing a full reset (If you are unable to perform a system reset)
IMPORTANTIf the instrument still does not operate normally after the full reset, it needs to be repaired.Contact your dealer, or a Hioki representative if you are not sure where the instrument was pur-chased.
When you perform a full reset, almost all settings* will be reverted to their default values at the time of shipment from the factory.
*: The status byte register, event register, enable register, and clock settings will not change. (See "Appx. 11 Initial Settings Table" (p. Appx.15).)
Perform a full reset only in the following circumstances: • When the normal reset screen cannot be displayed because of a problem with the instrument. (After the full reset, perform a self check to confirm that there are no problems)See "7.3 Testing the System (Self diagnosis)" (p. 133).
• When you have forgotten the passcode for the key lock.
1 Disconnect the measurement sample.
2 Connect the power cord.
3 Turn on the main switch on the rear panel.
4 While the opening screen is displayed, press the top right of the screen continu-ously.The full reset is complete when a beeping sound is emitted.
After the full reset, the panel calibration screen will be displayed.See "Panel calibration" (p. 134).
Maintenance and S
ervice
11
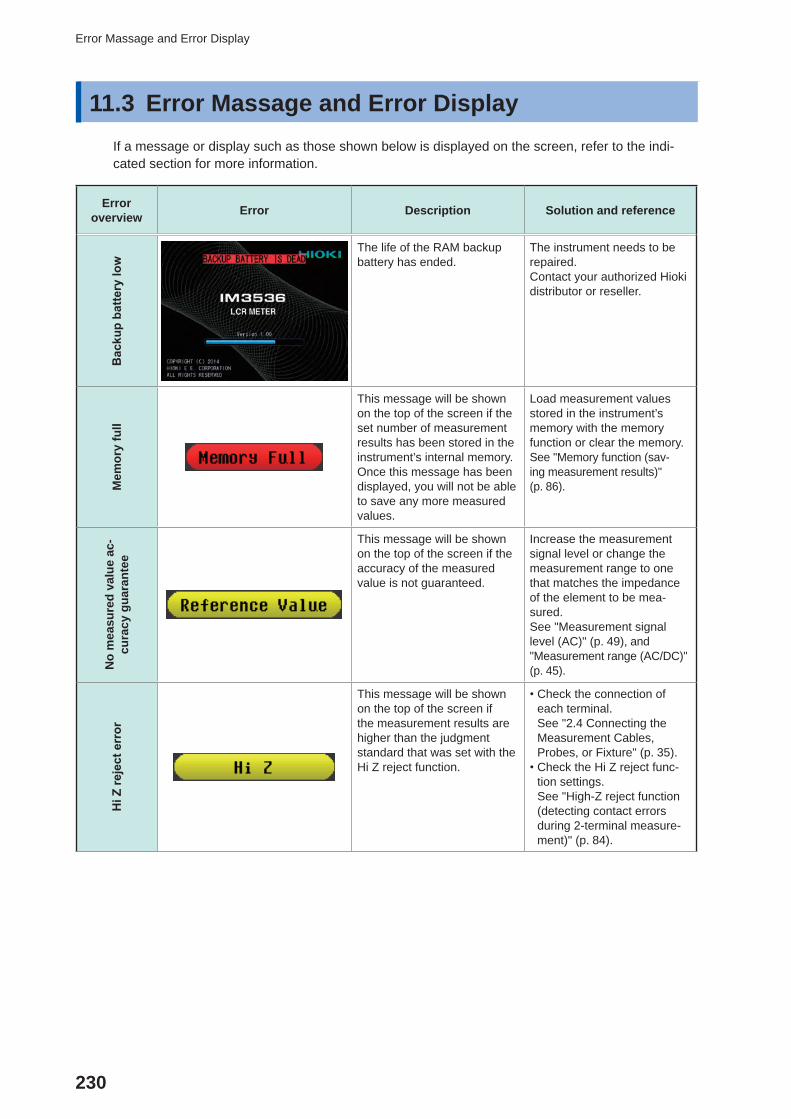
230
Error Massage and Error Display
11.3 Error Massage and Error DisplayIf a message or display such as those shown below is displayed on the screen, refer to the indi-cated section for more information.
Error overview Error Description Solution and reference
Bac
kup
batte
ry lo
w
The life of the RAM backup battery has ended.
The instrument needs to be repaired.Contact your authorized Hioki distributor or reseller.
Mem
ory
full
This message will be shown on the top of the screen if the set number of measurement results has been stored in the instrument’s internal memory. Once this message has been displayed, you will not be able to save any more measured values.
Load measurement values stored in the instrument’s memory with the memory function or clear the memory.See "Memory function (sav-ing measurement results)" (p. 86).
No
mea
sure
d va
lue
ac-
cura
cy g
uara
ntee
This message will be shown on the top of the screen if the accuracy of the measured value is not guaranteed.
Increase the measurement signal level or change the measurement range to one that matches the impedance of the element to be mea-sured.See "Measurement signal level (AC)" (p. 49), and "Measurement range (AC/DC)" (p. 45).
Hi Z
reje
ct e
rror
This message will be shown on the top of the screen if the measurement results are higher than the judgment standard that was set with the Hi Z reject function.
• Check the connection of each terminal.See "2.4 Connecting the Measurement Cables, Probes, or Fixture" (p. 35).
• Check the Hi Z reject func-tion settings.See "High-Z reject function (detecting contact errors during 2-terminal measure-ment)" (p. 84).

231
Error Massage and Error Display
Error overview Error Description Solution and reference
Con
stan
t-vol
tage
mea
sure
men
t or c
onst
ant-
curr
ent m
easu
rem
ent n
ot p
ossi
ble
This message will be dis-played to the right of the monitor value when it is not possible to perform constant-voltage measurement or constant-current measure-ment.
It will also be displayed if the voltage applied to the sample or the current flowing to the sample exceeds the limit value (including, for example, if a current in excess of the limit value flows to the sample when the open voltage has been set to the lowest pos-sible value).
Reduce the voltage level or current level.See "Measurement signal level (AC)" (p. 49).
Less
than
vol
tage
lim
it or
cur
rent
lim
it
This message will be dis-played if the set constant voltage (or constant current) is not reached because a signal that is greater than or equal to the current (or voltage) limit value is not being applied.
Set the limit value again or change the measurement sig-nal level so that the limit value is not exceeded See "Measurement signal level (AC)" (p. 49) and "Limit (limiting the voltage and current applied to the sample) (AC)" (p. 58).
Load
cor
rect
ion
fre-
quen
cy m
ism
atch
This message will be dis-played in the settings infor-mation if the load correction frequency does not match the current measurement fre-quency when load correction is enabled.
Perform load correction at the same frequency as the mea-surement frequency.See "Measurement frequency(AC)" (p. 44), and "5.6 Load Correction (Correct-ing Values to Match Reference Values)" (p. 112).
Load
cor
rect
ion
cond
i-tio
n m
ism
atch
This message will be dis-played in the settings informa-tion if load correction condi-tions other than the frequency do not match the current measurement conditions when load correction is enabled.
Perform load correction using the same conditions as the measurement conditions. See "3.4 Setting Measurement Conditions (basic settings)" (p. 43), and"5.6 Load Correction (Correct-ing Values to Match Reference Values)" (p. 112).
Maintenance and S
ervice
11

232
Error Massage and Error Display
Error overview Error Description Solution and reference
Mea
sure
d va
lue
out o
f dis
play
rang
e
This message will be dis-played in the measured value display area if the measured value falls outside the screen display range.
This error may result from the following causes: • The sample has not been connected properly.
• The display range has been exceeded due to a user-specified correction coeffi-cient (p. 121).
• Open correction, short cor-rection, or load correction is being performed with an erro-neous value (p. 99, p. 105, and p. 112).
If you suspect any of the above causes, reconfigure the settings.
If use of properly configured settings does not eliminate the error, measurement is not possible because the measured value exceeds the instrument’s display range.
Inte
rnal
ci
rcui
t err
or This message will be dis-played in the measured value display area if an internal cir-cuit error prevents measure-ment from completing.
The instrument needs to be repaired.Contact your authorized Hioki distributor or reseller.
Gre
ater
than
the
mea
sure
d va
lue
uppe
r lim
it
This message will be dis-played in the measured value display area if the measured value is greater than to the range upper limit value.
• Change the measurement range to a high-impedance range.See "Measurement range (AC/DC)" (p. 45).
• If applying a DC bias to perform resistance measure-ment, turn off the DC bias.See "DC bias (superimpos-ing a DC voltage on the measurement signal)(AC)" (p. 59)
Less
than
the
mea
sure
d va
lue
low
er li
mit
This message will be dis-played in the measured value display area if the measured value is less than the range lower limit value.
• Change the measurement range to a low-impedance range.See "Measurement range (AC/DC)" (p. 45).
• If applying a DC bias to perform resistance measure-ment, turn off the DC bias.See "DC bias (superimpos-ing a DC voltage on the measurement signal)(AC)" (p. 59)

233
Error Massage and Error Display
Error overview Error Description Solution and reference
Con
tact
che
ck e
rror
The letter A (“after”) will be shown if the contact check error occurred after measurement, while the let-ter B (“before”) will be shown if the contact check error occurred before measurement.
The unconnected terminals will be indicated.HL : HPOT, HCUR, LPOT, LCUR
L : LPOT, LCUR
H : HPOT, HCUR
• This message will be dis-played in the measured value display area if one of the terminals is found to be disconnected, for example due to a broken wire, after measurement.
Check the connection of each terminal.See "2.4 Connecting the Mea-surement Cables, Probes, or Fixture" (p. 35).
• The sample has not been secured properly in the mea-surement cable, probe, or fixture.
Check the manner in which the sample has been secured. Check the wiring for wiring breaks or poor contact.See the probe or fixture’s user manual as well as"Contact check function (detecting poor contact with the sample during 4-terminal measurement)" (p. 85).
• This message will also be displayed when using the instrument in an environment characterized by a large amount of noise.
Consider taking the following measures: • Use guarding.See"Appx. 2 Measurement of High Impedance Compo-nents" (p. Appx.3).
• Implement anti-external noise measures.See"Appx. 4 Countermea-sures Against Incorporation of External Noise" (p. Appx.5).
• Separate the sample, mea-surement cables, and instru-ment from the source of the noise (motor, inverter, electro-magnetic switch, power line, equipment generating sparks, etc.) or perform the measure-ment in a separate room.
• Plug the instrument into a grounded outlet.
• Use a separate power sup-ply from the device that is generating the noise.
Fan
mot
or e
rror
• The fan motor has stopped or is operating at low speed.
• Turn off the instrument and verify that its air vents are unobstructed and free of any foreign material.
• If no issues are found, the instrument needs to be repaired. Contact your au-thorized Hioki distributor or reseller.
Maintenance and S
ervice
11

234
Error Massage and Error Display
Error overview Error Description Solution and reference
Ope
ratin
g te
mpe
ratu
re e
rror • The ambient temperature
has exceeded the instru-ment’s operating tempera-ture range.
• Cycle the instrument’s power and use the instrument within its operating temperature range.See "10.2 Environmental and Safety Specifications" (p. 192).
• If this error is displayed even though the instrument is be-ing used within its operating temperature range, the instru-ment needs to be repaired. Contact your authorized Hioki distributor or reseller.

235
Discarding the Instrument
11.4 Discarding the InstrumentThe instrument uses a lithium-ion battery as a power supply for saving the measurement condi-tions. When disposing of this instrument, remove the lithium battery and dispose of battery and instrument in accordance with local regulations.
WARNING • To avoid electric shock, turn off the power switch and disconnect the power cord and measurement cable, probe, or fixture before removing the lithium bat-tery.
• Battery may explode if mistreated. Do not short-circuit, recharge, disassemble or dispose of in fire.
• Keep batteries away from children to prevent accidental swallowing.
Lithium Battery RemovalRequired tools: One Philips screwdriver (No.1), One tweezers (to remove the lithium battery)
1 Verify that the power is off, and remove the connection cables and power cord.
2 Remove the eight screws from the sides and one screw from the rear.
Lithium bat-tery
Battery holder
3 Remove the cover.
4 Insert the tweezers between the battery and battery holder as shown in the dia-gram below and lift up the battery.
CAUTIONTake care not to short the + and -.Doing so may cause sparks.
CALIFORNIA, USA ONLYThis product contains a CR Coin Lithium Battery which contains Perchlorate Material - special handling may apply.See www.dtsc.ca.gov/hazardouswaste/perchlorate
Maintenance and S
ervice
11

236
Discarding the Instrument

Appx.1
Measurement Parameters and Calculation Formula
AppendixAppx. 1 Measurement Parameters and Calculation
FormulaIn general, impedance Z is used to evaluate the characteristics of, for example, circuit components.Measure voltage and current vectors for circuit components relative to AC measurement frequency signals.The instrument uses these values to obtain the impedance Z and phase difference θ. The following values can be obtained from impedance Z by rotating the impedance Z around the complex plane.
I
V
Z
jXRZ +=
RXtan 1−=θ
22 XRZ +=
Z : Impedance (Ω)θ : Phase angle (deg)R : Resistance (Ω)X : Reactance (Ω)|Z| : Absolute value of impedance (Ω)
Imaginary part jX
RReal part
θ
|Z|
Furthermore, admittance Y that is the reciprocal of impedance Z can also be used depending on the characteristics of circuit components. As in the case of impedance Z, the following values can also be obtained from admittance Y by rotating the admittance Y around the complex plane.
jBGY +=
GBtan 1−=φ
22 BGY +=
Imaginary part
G
|Y|
Real part
ϕ
jB
Y : Admittance (S)ϕ : Phase angle (deg) =-θG : Conductance (S)B : Susceptance (S)|Y| : Absolute value of admittance (S)
Appendix
10
9
8
7
6
5
4
3
2
1
Appx.
索引

Appx.2
Measurement Parameters and Calculation Formula
From the voltage V which is applied between the terminals of the sample under test, the current I which flows through the test sample at this time, the phase angle θ between this voltage V and this current I, and the angular velocity ω which corresponds to the measurement frequency.
The phase angle θ is shown based on the impedance Z. When measuring based on the admittance Y, the sign of the phase angle θ must be reversed.
Item Series equivalent circuit mode Parallel equivalent circuit mode
Z ( )22 XRIVZ +==
( )22 BGZ1Y +==
θcosZESRRS ==
==
G1
cosY1RP φ
θsinZX =
φcosYG =
φsinYB =
ωXLS =
B1LP ω
−=
X1CS ω
−=
ωBCP =
θθ
sincosD =
==
D1
cossin
Qθθ
Y
( )22 XRIVZ +==
( )22 BGZ1Y +==
θcosZESRRS ==
==
G1
cosY1RP φ
θsinZX =
φcosYG =
φsinYB =
ωXLS =
B1LP ω
−=
X1CS ω
−=
ωBCP =
θθ
sincosD =
==
D1
cossin
Qθθ
R
( )22 XRIVZ +==
( )22 BGZ1Y +==
θcosZESRRS ==
==
G1
cosY1RP φ
θsinZX =
φcosYG =
φsinYB =
ωXLS =
B1LP ω
−=
X1CS ω
−=
ωBCP =
θθ
sincosD =
==
D1
cossin
Qθθ
( )22 XRIVZ +==
( )22 BGZ1Y +==
θcosZESRRS ==
==
G1
cosY1RP φ
θsinZX =
φcosYG =
φsinYB =
ωXLS =
B1LP ω
−=
X1CS ω
−=
ωBCP =
θθ
sincosD =
==
D1
cossin
Qθθ
*
X
( )22 XRIVZ +==
( )22 BGZ1Y +==
θcosZESRRS ==
==
G1
cosY1RP φ
θsinZX =
φcosYG =
φsinYB =
ωXLS =
B1LP ω
−=
X1CS ω
−=
ωBCP =
θθ
sincosD =
==
D1
cossin
Qθθ
G
( )22 XRIVZ +==
( )22 BGZ1Y +==
θcosZESRRS ==
==
G1
cosY1RP φ
θsinZX =
φcosYG =
φsinYB =
ωXLS =
B1LP ω
−=
X1CS ω
−=
ωBCP =
θθ
sincosD =
==
D1
cossin
Qθθ
*
B
( )22 XRIVZ +==
( )22 BGZ1Y +==
θcosZESRRS ==
==
G1
cosY1RP φ
θsinZX =
φcosYG =
φsinYB =
ωXLS =
B1LP ω
−=
X1CS ω
−=
ωBCP =
θθ
sincosD =
==
D1
cossin
Qθθ
*
L
( )22 XRIVZ +==
( )22 BGZ1Y +==
θcosZESRRS ==
==
G1
cosY1RP φ
θsinZX =
φcosYG =
φsinYB =
ωXLS =
B1LP ω
−=
X1CS ω
−=
ωBCP =
θθ
sincosD =
==
D1
cossin
Qθθ
( )22 XRIVZ +==
( )22 BGZ1Y +==
θcosZESRRS ==
==
G1
cosY1RP φ
θsinZX =
φcosYG =
φsinYB =
ωXLS =
B1LP ω
−=
X1CS ω
−=
ωBCP =
θθ
sincosD =
==
D1
cossin
Qθθ
C
( )22 XRIVZ +==
( )22 BGZ1Y +==
θcosZESRRS ==
==
G1
cosY1RP φ
θsinZX =
φcosYG =
φsinYB =
ωXLS =
B1LP ω
−=
X1CS ω
−=
ωBCP =
θθ
sincosD =
==
D1
cossin
Qθθ
( )22 XRIVZ +==
( )22 BGZ1Y +==
θcosZESRRS ==
==
G1
cosY1RP φ
θsinZX =
φcosYG =
φsinYB =
ωXLS =
B1LP ω
−=
X1CS ω
−=
ωBCP =
θθ
sincosD =
==
D1
cossin
Qθθ
D
( )22 XRIVZ +==
( )22 BGZ1Y +==
θcosZESRRS ==
==
G1
cosY1RP φ
θsinZX =
φcosYG =
φsinYB =
ωXLS =
B1LP ω
−=
X1CS ω
−=
ωBCP =
θθ
sincosD =
==
D1
cossin
Qθθ
Q
( )22 XRIVZ +==
( )22 BGZ1Y +==
θcosZESRRS ==
==
G1
cosY1RP φ
θsinZX =
φcosYG =
φsinYB =
ωXLS =
B1LP ω
−=
X1CS ω
−=
ωBCP =
θθ
sincosD =
==
D1
cossin
Qθθ
* ϕ: phase angle of admittance Y (ϕ=-θ)
Ls, Cs, Rs: The measured values of L, C, and R in series equivalent circuit mode.Lp, Cp, Rp: The measured values of L, C, and R in parallel equivalent circuit mode.

Appx.3
Measurement of High Impedance Components
Appx. 2 Measurement of High Impedance ComponentsThe measured value obtained when testing a high impedance element (such as, for example, a resistor with resistance higher than 100 kΩ) is sometimes unreliable, because such an element is vulnerable to the effects of external interference and the like. In this case, reliable testing can be performed by the use of guarding, that is, connecting a metallic plate to the GUARD terminal and carrying out the measurement on the metallic plate.
Metal plate
Resin film
When measuring components on a metal plate, use, for example, resin film as insulation to ensure terminals and the like are not short-circuited.
Open circuit compensation is high impedance measurement, so be sure to use the shielding process. If it is not used, the compensation values may become unstable and affect the measurement values.
10
9
8
7
6
5
4
3
2
1
Appx.
索引

Appx.4
Measurement of In-circuit Components
Appx. 3 Measurement of In-circuit ComponentsMeasure an in-circuit component after providing guarding.
432
432 RRR
RRRR
+++
•=
Referring to the following figure, when measuring a resistance value for the resistor R2, even if the tips of the two probes are contacted against the ends of the resistor R2, considering the sum of the current flowing through the resistor R2 and the cur-rent flowing through the resistors R3 and R4 what is obtained is the resistance value for the parallel combination:R1 R2
R3
R4
H L
If as shown in the next figure a guard terminal is used, the cur-rent flowing through the resistors R3 (not flowing through R4) is absorbed by this guard terminal, so that the resistance value for the resistor R2 is accurately measured.
R1 R2
R3
R4
H L
Guard terminal
• The accuracy of measurement will not be improved in cases where for example R2>>R3 and R3 is close to zero.
• As shown in the figure below, it is not possible to use this type of separation process for testing of the im-pedance values of two resistors or other elements of identical types which are connected in parallel, or for testing of the impedance values of a coil and a capacitor which are connected in parallel.
Two resistors in parallel Coil and capacitor in parallel
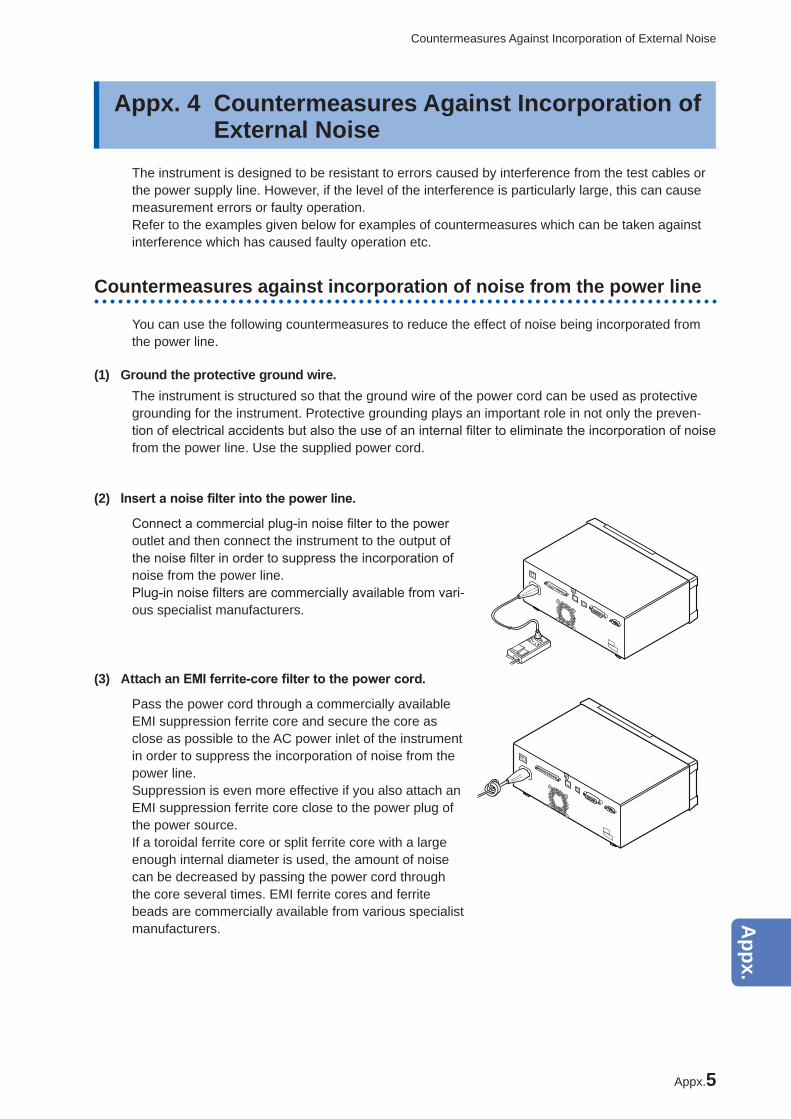
Appx.5
Countermeasures Against Incorporation of External Noise
Appx. 4 Countermeasures Against Incorporation of External Noise
The instrument is designed to be resistant to errors caused by interference from the test cables or the power supply line. However, if the level of the interference is particularly large, this can cause measurement errors or faulty operation.Refer to the examples given below for examples of countermeasures which can be taken against interference which has caused faulty operation etc.
Countermeasures against incorporation of noise from the power line
You can use the following countermeasures to reduce the effect of noise being incorporated from the power line.
(1) Ground the protective ground wire.The instrument is structured so that the ground wire of the power cord can be used as protective grounding for the instrument. Protective grounding plays an important role in not only the preven-tion of electrical accidents but also the use of an internal filter to eliminate the incorporation of noise from the power line. Use the supplied power cord.
(2) Insert a noise filter into the power line.
Connect a commercial plug-in noise filter to the power outlet and then connect the instrument to the output of the noise filter in order to suppress the incorporation of noise from the power line.Plug-in noise filters are commercially available from vari-ous specialist manufacturers.
(3) Attach an EMI ferrite-core filter to the power cord.
Pass the power cord through a commercially available EMI suppression ferrite core and secure the core as close as possible to the AC power inlet of the instrument in order to suppress the incorporation of noise from the power line.Suppression is even more effective if you also attach an EMI suppression ferrite core close to the power plug of the power source.If a toroidal ferrite core or split ferrite core with a large enough internal diameter is used, the amount of noise can be decreased by passing the power cord through the core several times. EMI ferrite cores and ferrite beads are commercially available from various specialist manufacturers.
10
9
8
7
6
5
4
3
2
1
Appx.
索引

Appx.6
Supplying DC Bias
Countermeasures against noise from the measurement cables
If interference is producing noise in the measurement cables, its influence can be moderated by the following countermeasure.
Attach an EMI ferrite-core filter to the commercial cable.Pass the test cables through a commercially available anti-interference ferrite core, and fix it close to the measurement terminals, so as to suppress noise from the measurement cables.Moreover, if the internal diameter of the ferrite core allows, winding the measurement cables sev-eral times around the ferrite core (as with the power cord as described above) may further reduce the amount of noise.
Anti-interference ferrite core
Appx. 5 Supplying DC Bias
CAUTIONA voltage must not be applied to the measurement terminals of the instrument from an external source.If a voltage is applied from an external source, the instrument may be damaged.
Supplying DC bias means that a DC voltage is supplied as a bias to a sample for test whose char-acteristics are voltage dependent, such as an electrolytic capacitor or a ceramic capacitor.Further, a DC current can be supplied as a bias to a sample for test whose characteristics are cur-rent dependent, such as a choke coil.This instrument does not provide a DC bias input terminal. DC bias should be applied using the method described below.
• When applying DC bias during measurement, enable the internal DC bias setting and set the voltage to 0.00 V. (See "DC bias (superimposing a DC voltage on the measurement signal)(AC)" (p. 59))
• Rdc measurement cannot be performed when applying DC bias since a DC-cut capacitor is included in the circuit.
• The DC bias setting cannot be enabled when a parameter has been set to Rdc. Do not set any parameter to Rdc.

Appx.7
Supplying DC Bias
How to supply a DC bias voltage
WARNING • In order to avoid electric shock accident, be absolutely sure not to touch the test terminals while the DC bias voltage is being supplied to them.
• Do not short circuit between the H and L of the measurement cable, probe, or fixture with the DC bias voltage still being supplied. Doing so may damage the measurement cable, probe, or fixture or cause a short circuit accident.
• If you disconnect the sample under test from the test terminals with the DC bias voltage still being supplied, then the test sample is left charged, which is very dangerous. In order to avoid electric shock.
CAUTIONWhen measuring the element whose DC resistance is not high enough, DC current will flow to the main unit and the measurement will not be performed properly.
When you want to apply a DC voltage bias, refer to the following explanation.Example: When applying a DC voltage bias to a capacitor or other test sample
DC Bias Voltage Circuit
IM3536ZMeasurement
sample
+
-DC voltage
source
+
-
HCUR
HPOT
RHC
RHP
CHC
CHP
Capacitor R or L (>>Z)
LPOT
LCUR
GUARD
• Use a resistance (R) or inductance (L) which has a large enough impedance with reference to the sample under test (Z).
• A HCUR side capacitor must have a small enough impedance (i.e. a large enough capacitance) relative to the output resistance (100 Ω) while a HPOT capacitor must have a small enough imped-ance to the RHP.
• Be careful about the polarity when connecting together the measurement cables, probes, or fix-tures the sample to be tested, and the DC voltage source.
• It takes a little time for the DC voltage which is being supplied to the sample under test to reach the set voltage, so you should wait for a certain stabilization time period (which depends upon the sample) before performing.
• After testing is completed, drop the voltage of the DC voltage source to zero, and remove the sample under test from the measurement cables, probes or fixtures after having discharged any electric charge which may have built up.
• If you have removed the sample under test from the measurement cables, probes or fixtures with-out first having discharged the accumulated electric charge, you should be careful to do so imme-diately.
10
9
8
7
6
5
4
3
2
1
Appx.
索引
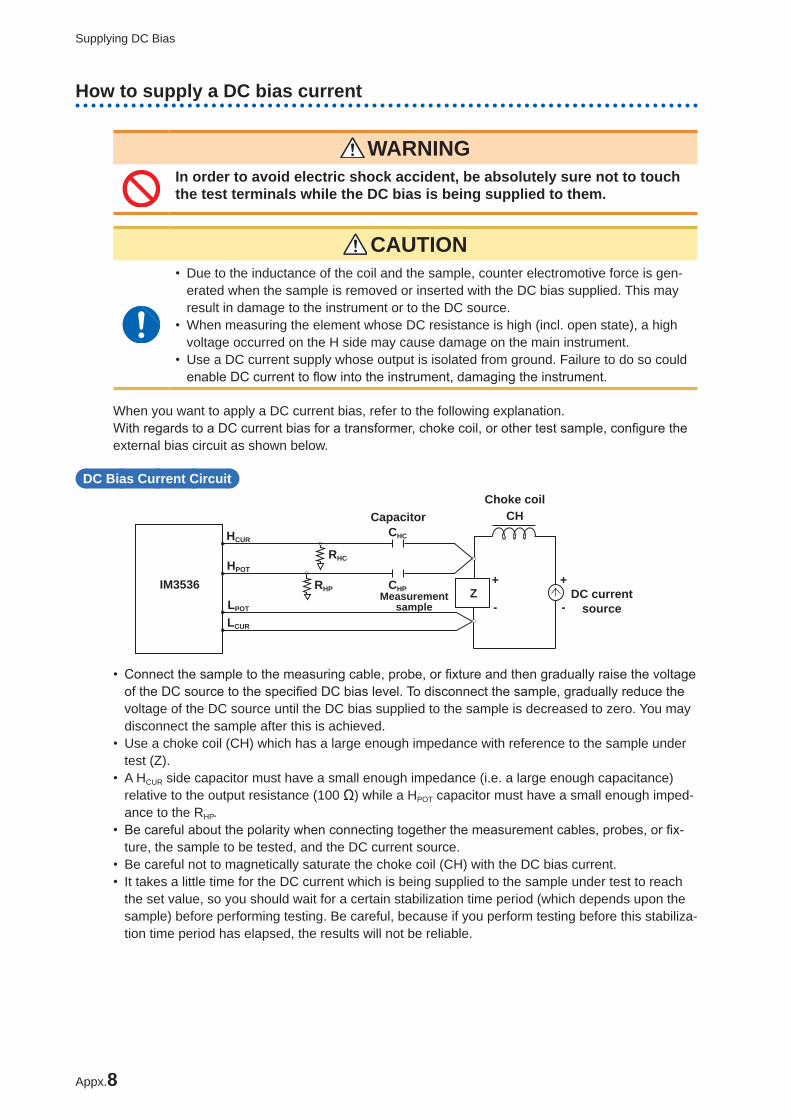
Appx.8
Supplying DC Bias
How to supply a DC bias current
WARNINGIn order to avoid electric shock accident, be absolutely sure not to touch the test terminals while the DC bias is being supplied to them.
CAUTION • Due to the inductance of the coil and the sample, counter electromotive force is gen-erated when the sample is removed or inserted with the DC bias supplied. This may result in damage to the instrument or to the DC source.
• When measuring the element whose DC resistance is high (incl. open state), a high voltage occurred on the H side may cause damage on the main instrument.
• Use a DC current supply whose output is isolated from ground. Failure to do so could enable DC current to flow into the instrument, damaging the instrument.
When you want to apply a DC current bias, refer to the following explanation.With regards to a DC current bias for a transformer, choke coil, or other test sample, configure the external bias circuit as shown below.
DC Bias Current Circuit
IM3536ZMeasurement
sample
+
-DC current
source
+
-
HCUR
HPOT
RHC
RHP
CHC
CHP
CapacitorChoke coil
CH
LPOT
LCUR
• Connect the sample to the measuring cable, probe, or fixture and then gradually raise the voltage of the DC source to the specified DC bias level. To disconnect the sample, gradually reduce the voltage of the DC source until the DC bias supplied to the sample is decreased to zero. You may disconnect the sample after this is achieved.
• Use a choke coil (CH) which has a large enough impedance with reference to the sample under test (Z).
• A HCUR side capacitor must have a small enough impedance (i.e. a large enough capacitance) relative to the output resistance (100 Ω) while a HPOT capacitor must have a small enough imped-ance to the RHP.
• Be careful about the polarity when connecting together the measurement cables, probes, or fix-ture, the sample to be tested, and the DC current source.
• Be careful not to magnetically saturate the choke coil (CH) with the DC bias current. • It takes a little time for the DC current which is being supplied to the sample under test to reach the set value, so you should wait for a certain stabilization time period (which depends upon the sample) before performing testing. Be careful, because if you perform testing before this stabiliza-tion time period has elapsed, the results will not be reliable.

Appx.9
The Residual Charge Protection Function
Appx. 6 The Residual Charge Protection Function
CAUTION • The quoted maximum voltage from which the instrument can be protected by this function is for reference purposes only, and is not a guaranteed value. The instrument may be damaged depending on operating conditions, for example the frequency at which charged capacitors are connected and whether a series of charged capacitors has been connected. In general, you should not rely upon this protection function; be sure to discharge charged capacitors properly before connecting them to the test terminals.
• The residual charge protection function is for protection of the instrument against the discharge of voltage present in charged capacitors, and is not capable of protecting the instrument against DC voltage which is constantly applied such as a superim-posed DC voltage. If this is done, there is a danger of damage to the instrument.See "Appx. 5 Supplying DC Bias" (p. Appx.6).
The residual load protection function, which protects the instrument’s internal circuitry from the capacitor’s discharge voltage in the event a charged capacitor is inadvertently connected to a mea-surement terminal, has been enhanced.The maximum voltage from which the instrument can be protected by this function is determined from the capacitance value of the sample under test by the following equation:
V=1000 V (C < 1 µF)V=√1/C V (1 µF ≤ C < 6.25 µF) V=400 V (6.25 µF ≤ C < 62.5 µF) V=√10/C V (62.5 µF ≤ C)
C: Capacitance of the measurement sample[F]
Relationship of capacitance and residual voltage from which the LCR meter can be protected
0
200
400
600
800
1000
1200
0.1 1 10 100 1000
残留
電圧
(V
)
静電容量(μF)
Res
idua
l vol
tage
(V)
Capacitance [µF]10
9
8
7
6
5
4
3
2
1
Appx.
索引

Appx.10
Series Equivalent Circuit Mode and Parallel Equivalent Circuit Mode
Appx. 7 Series Equivalent Circuit Mode and Parallel Equivalent Circuit Mode
The instrument measures the current flowing to the test sample and the voltage at both ends of the test sample, and determines Z and θ. Other measurement items such as L, C, and R are calculated from Z and θ.At this time, the mode for calculation becomes series equivalent circuit mode if the resistance com-ponents for C (or L) are assumed to be in series, and the mode becomes parallel equivalent circuit mode if the resistance components for C (or L) are assumed to be in parallel. It is, therefore, nec-essary to select the parameter of the correct equivalent circuit mode to reduce errors because the calculation formula differs for series equivalent circuit mode and parallel equivalent circuit mode.
Generally, for measurement of a low impedance device (approx. less than 100 Ω) like a large ca-pacitance capacitor or a low inductance, a seriese quivalent circuit mode will be selected. While, for a high impedance device (approx. more than 10 kΩ) like a small capacitance capacitor or a high inductance, a parallel-equivalent circuit mode will be selected. When you are not sure about selec-tion of circuit mode, please ask the parts maker. (ex. a impedance approx. between 100 Ω and 10 kΩ)
Series equivalent circuit Parallel equivalent circuit
C(orL)
C(orL)
Although both values can be displayed since measured values in equivalent circuit modes are calculated, the appropriate equivalent circuit will vary with the sample.
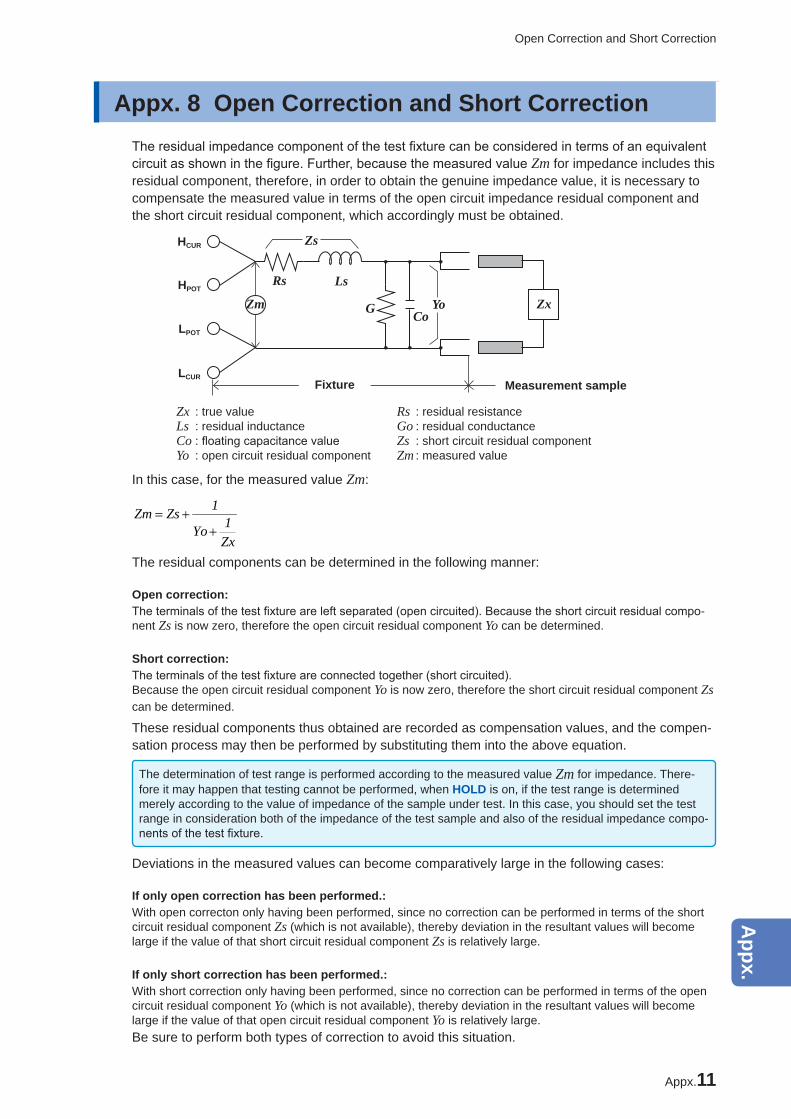
Appx.11
Open Correction and Short Correction
Appx. 8 Open Correction and Short CorrectionThe residual impedance component of the test fixture can be considered in terms of an equivalent circuit as shown in the figure. Further, because the measured value Zm for impedance includes this residual component, therefore, in order to obtain the genuine impedance value, it is necessary to compensate the measured value in terms of the open circuit impedance residual component and the short circuit residual component, which accordingly must be obtained.
HCUR
HPOTRs
LPOT
LCUR
Ls
Zs
G CoYoZm Zx
Fixture Measurement sample
Zx : true valueLs : residual inductanceCo : floating capacitance valueYo : open circuit residual component
Rs : residual resistanceGo : residual conductanceZs : short circuit residual componentZm : measured value
In this case, for the measured value Zm:
Zx1Yo
1ZsZm+
+=
The residual components can be determined in the following manner:
Open correction: The terminals of the test fixture are left separated (open circuited). Because the short circuit residual compo-nent Zs is now zero, therefore the open circuit residual component Yo can be determined.
Short correction: The terminals of the test fixture are connected together (short circuited).Because the open circuit residual component Yo is now zero, therefore the short circuit residual component Zs can be determined.
These residual components thus obtained are recorded as compensation values, and the compen-sation process may then be performed by substituting them into the above equation.
The determination of test range is performed according to the measured value Zm for impedance. There-fore it may happen that testing cannot be performed, when HOLD is on, if the test range is determined merely according to the value of impedance of the sample under test. In this case, you should set the test range in consideration both of the impedance of the test sample and also of the residual impedance compo-nents of the test fixture.
Deviations in the measured values can become comparatively large in the following cases:
If only open correction has been performed.:With open correcton only having been performed, since no correction can be performed in terms of the short circuit residual component Zs (which is not available), thereby deviation in the resultant values will become large if the value of that short circuit residual component Zs is relatively large.
If only short correction has been performed.:With short correction only having been performed, since no correction can be performed in terms of the open circuit residual component Yo (which is not available), thereby deviation in the resultant values will become large if the value of that open circuit residual component Yo is relatively large.Be sure to perform both types of correction to avoid this situation.
10
9
8
7
6
5
4
3
2
1
Appx.
索引

Appx.12
Attaching Rack-mounting Hardware to the Instrument
Appx. 9 Attaching Rack-mounting Hardware to the Instrument
WARNINGObserve the following precautions regarding the mounting screws to avoid instrument damage and electric shock accidents. • When installing the Rack Mounting Plate, the screws must not intrude more than 6 mm into either side of the instrument.
• When removing the Rack Mounting Plate to return the instrument to stand-alone use, replace the same screws that were installed originally. (Feet: M3 × 6 mm, Sides: M4 × 6 mm)
Parts removed from this instrument should be stored in a safe place to enable future reuse.See "Installation instructions" (p. 12) also. Rack mounting brackets can be attached to the instrument.
Spacer (Two Required) Unit: mm
Rack Mounting Plate (JIS) Unit: mm
Unit: mmRack Mounting Plate (EIA)
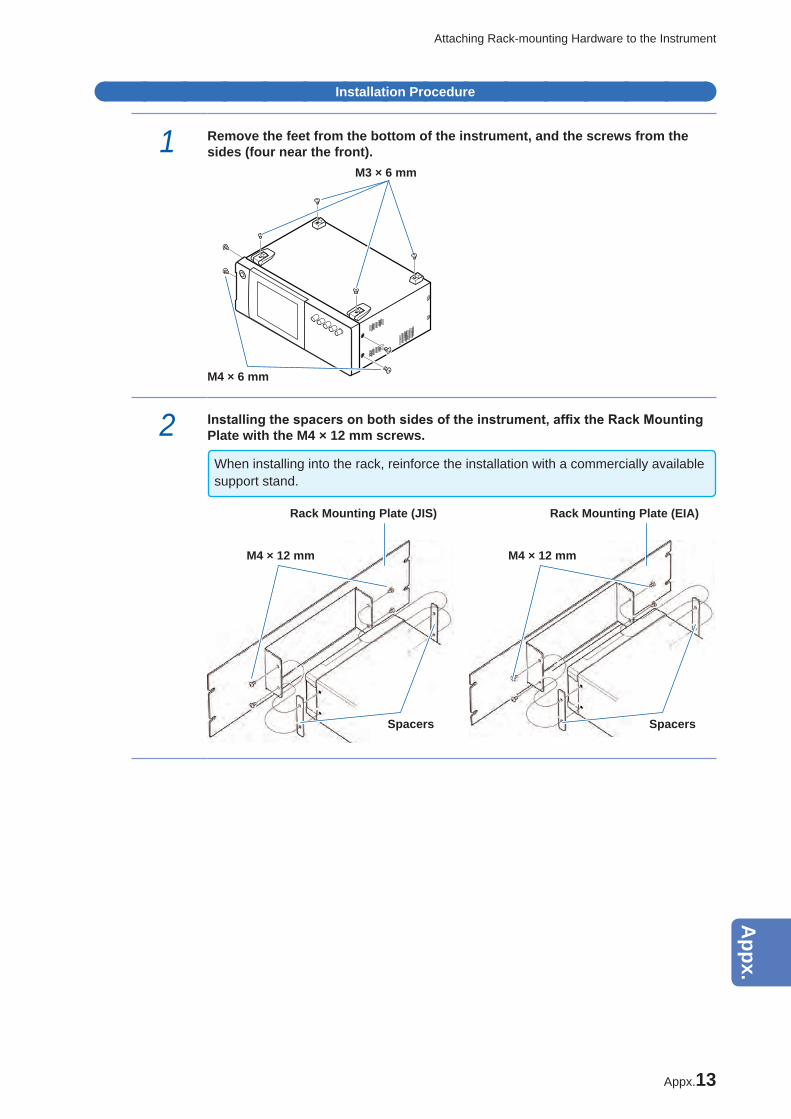
Appx.13
Attaching Rack-mounting Hardware to the Instrument
Installation Procedure
1 Remove the feet from the bottom of the instrument, and the screws from the sides (four near the front).
M3 × 6 mm
M4 × 6 mm
2 Installing the spacers on both sides of the instrument, affix the Rack Mounting Plate with the M4 × 12 mm screws.
When installing into the rack, reinforce the installation with a commercially available support stand.
M4 × 12 mm
Rack Mounting Plate (JIS)
Spacers
M4 × 12 mm
Rack Mounting Plate (EIA)
Spacers
10
9
8
7
6
5
4
3
2
1
Appx.
索引

Appx.14
Dimensional Diagram
Appx. 10 Dimensional Diagram
230
114
15
48
33
33
2535
119±
1
330±1
(Unit: mm)

Appx.15
Initial Settings Table
Appx. 11 Initial Settings TableThe following table shows the initial settings of the instrument.This following information is also included: • Setting status after initialization • Whether the setting reverts to its default value when the instrument is turned on • Whether the setting is included in panel save/load operation • Whether the setting is included in file save/load operation
For more information about initialization, see the following sections: • System reset initiated on the instrument
: See "Initializing (System Reset)" (p. 228).
• Full reset initiated on the instrument
: See "Performing a full reset (If you are unable to perform a system reset)" (p. 229).
• Initialization initiated with a command (*RST, :PRESet)
: See the descriptions of the *RST and :PRESet commands in the Communications Command User Manual on the bundled LCR Application Disc.
Yes: Available, No: Unavailable, ←: The same as the initial setting
Setting Items Default settingIn
itial
ized
initi
ated
on
inst
rum
ent
Initialization initiated with
command
Rev
erts
to d
efau
lt va
lue
at p
ower
-on
Pane
l sav
e/ L
oad
File
sav
e/ L
oad
*RST
:PRESet
Measurement mode LCR ← ← ← No Yes Yes
Measurement parameter Z/OFF/θ/OFF ← ← ← No Yes Yes
Magnification display OFF ← ← ← No No Yes
Basic settings
Measurement frequency 1 kHz ← ← ← No Yes Yes
Measurement signal level
Mode V ← ← ← No Yes Yes
V 1.000 V ← ← ← No Yes Yes
CV 1.000 V ← ← ← No Yes Yes
CC 10.00 mA ← ← ← No Yes Yes
Limit
ON/OFF OFF ← ← ← No Yes Yes
Current limit value 100.00 mA ← ← ← No Yes Yes
Voltage limit value 5.00 V ← ← ← No Yes Yes
DC biasON/OFF OFF ← ← ← No Yes Yes
Bias value 0.00 V ← ← ← No Yes Yes
Trigger mode INT(Internal Trigger) ← ← ← No Yes Yes
Measurement range
Mode AUTO ← ← ← No Yes Yes
AUTO range control function 100 mΩ/100 MΩ ← ← ← No Yes Yes
Range 100Ω ← ← ← No Yes Yes
Judgment synchroni-zation setting OFF ← ← ← No Yes Yes
LOW Z OFF ← ← ← No Yes Yes
Measurement speed MED ← ← ← No Yes Yes
10
9
8
7
6
5
4
3
2
1
Appx.
索引
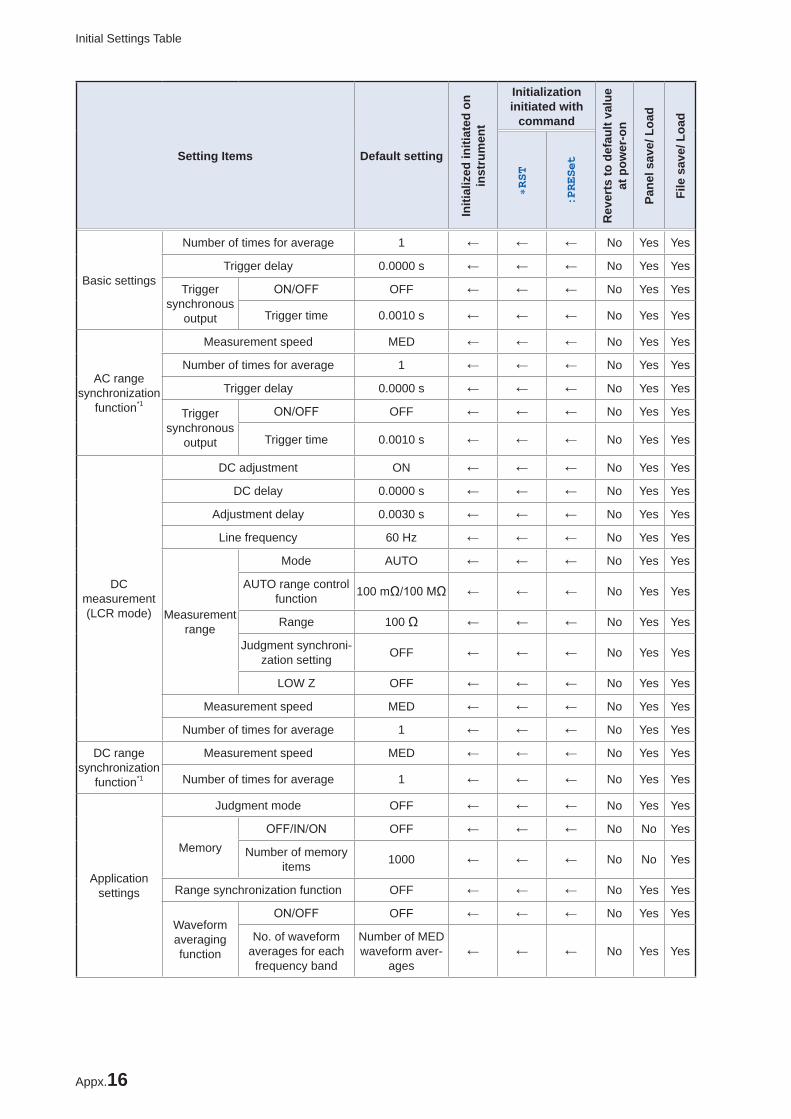
Appx.16
Initial Settings Table
Setting Items Default setting
Initi
aliz
ed in
itiat
ed o
n in
stru
men
t
Initialization initiated with
command
Rev
erts
to d
efau
lt va
lue
at p
ower
-on
Pane
l sav
e/ L
oad
File
sav
e/ L
oad
*RST
:PRESet
Basic settings
Number of times for average 1 ← ← ← No Yes Yes
Trigger delay 0.0000 s ← ← ← No Yes Yes
Trigger synchronous
output
ON/OFF OFF ← ← ← No Yes Yes
Trigger time 0.0010 s ← ← ← No Yes Yes
AC range synchronization
function*1
Measurement speed MED ← ← ← No Yes Yes
Number of times for average 1 ← ← ← No Yes Yes
Trigger delay 0.0000 s ← ← ← No Yes Yes
Trigger synchronous
output
ON/OFF OFF ← ← ← No Yes Yes
Trigger time 0.0010 s ← ← ← No Yes Yes
DC measurement(LCR mode)
DC adjustment ON ← ← ← No Yes Yes
DC delay 0.0000 s ← ← ← No Yes Yes
Adjustment delay 0.0030 s ← ← ← No Yes Yes
Line frequency 60 Hz ← ← ← No Yes Yes
Measurement range
Mode AUTO ← ← ← No Yes Yes
AUTO range control function 100 mΩ/100 MΩ ← ← ← No Yes Yes
Range 100 Ω ← ← ← No Yes Yes
Judgment synchroni-zation setting OFF ← ← ← No Yes Yes
LOW Z OFF ← ← ← No Yes Yes
Measurement speed MED ← ← ← No Yes Yes
Number of times for average 1 ← ← ← No Yes Yes
DC range synchronization
function*1
Measurement speed MED ← ← ← No Yes Yes
Number of times for average 1 ← ← ← No Yes Yes
Application settings
Judgment mode OFF ← ← ← No Yes Yes
MemoryOFF/IN/ON OFF ← ← ← No No Yes
Number of memory items 1000 ← ← ← No No Yes
Range synchronization function OFF ← ← ← No Yes Yes
Waveform averaging function
ON/OFF OFF ← ← ← No Yes Yes
No. of waveform averages for each frequency band
Number of MEDwaveform aver-
ages← ← ← No Yes Yes

Appx.17
Initial Settings Table
Setting Items Default setting
Initi
aliz
ed in
itiat
ed o
n in
stru
men
t
Initialization initiated with
command
Rev
erts
to d
efau
lt va
lue
at p
ower
-on
Pane
l sav
e/ L
oad
File
sav
e/ L
oad
*RST
:PRESet
Application settings
Conductivity/dielectricconstant
Capacitance Cs ← ← ← No Yes Yes
Sample length 20.00000 mm ← ← ← No Yes Yes
Sample cross-sectional
area12.00000 mm2 ← ← ← No Yes Yes
Judgment result
Delay between judgment results and
EOM――― 0.0000 s ← ← ← No No Yes
Reset ON ← ← ← No No Yes
IO triggerENABLE ON ← ← ← No No Yes
Edge DOWN ← ← ← No No Yes
IO EOMMode HOLD ← ← ← No No Yes
EOM―――
output time 0.0050 s ← ← ← No No Yes
IO BCDON/OFF OFF ← ← ← No No Yes
Position of the decimal point
9.99999G/ 9.99999G ← ← ← No No Yes
High-Z rejectON/OFF OFF ← ← ← No Yes Yes
Judgment reference value 1000% ← ← ← No Yes Yes
Contact check
Timing OFF ← ← ← No Yes Yes
Threshold 4 ← ← ← No Yes Yes
Delay time 0.0000 ← ← ← No Yes Yes
Display digits 6/6/6/6 ← ← ← No Yes Yes
LCD Display ON/OFF ON ← ← ← No No Yes
Beep sound
Judgment result NG ← ← ← No Yes Yes
Key ON ← ← ← No No Yes
Beep tone A ← ← ← No No Yes
Key-lockON/OFF OFF ← ← ← No No Yes
Passcode 3536 ← ← ← No No Yes
Comparator(LCR mode)
Mode ABS/ABS ← ← ← No Yes Yes
Absolute value mode
Upper limit value OFF/OFF ← ← ← No Yes Yes
Lower limit value OFF/OFF ← ← ← No Yes Yes
Percent mode
Deviation percentage
mode
Reference value 1.0000 k /10.0000 ← ← ← No Yes Yes
Upper limit value OFF/OFF ← ← ← No Yes Yes
Lower limit value OFF/OFF ← ← ← No Yes Yes
10
9
8
7
6
5
4
3
2
1
Appx.
索引
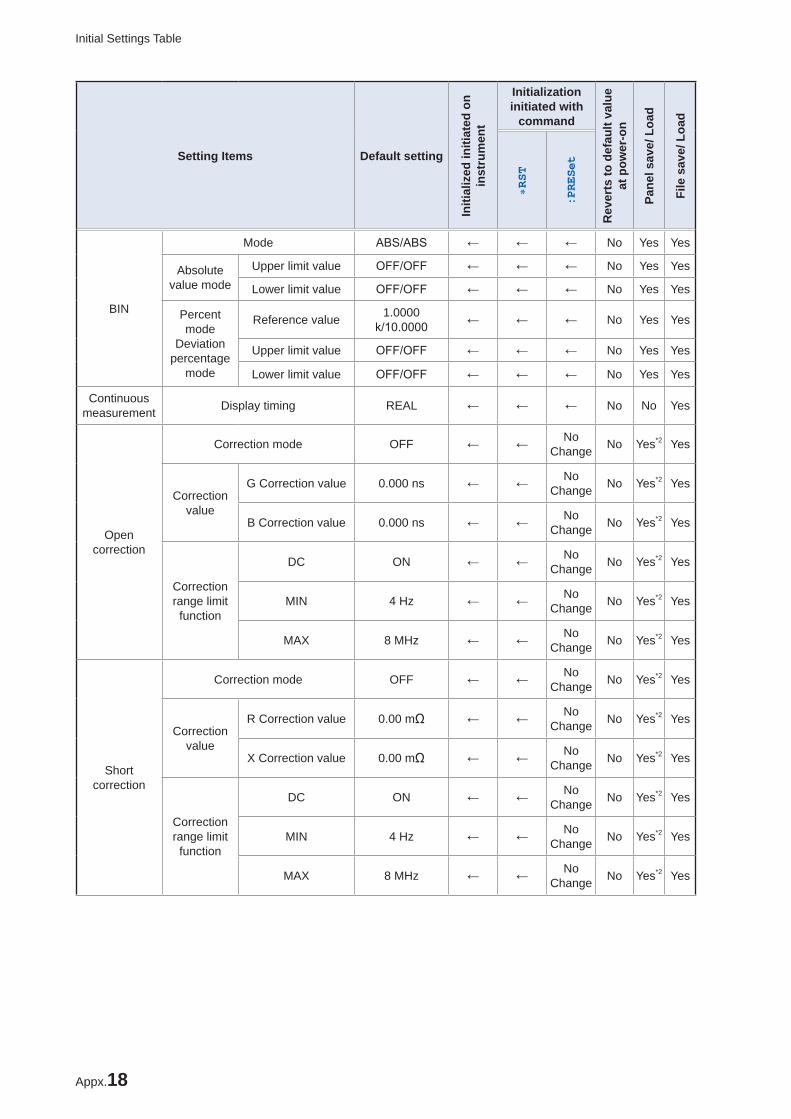
Appx.18
Initial Settings Table
Setting Items Default setting
Initi
aliz
ed in
itiat
ed o
n in
stru
men
t
Initialization initiated with
command
Rev
erts
to d
efau
lt va
lue
at p
ower
-on
Pane
l sav
e/ L
oad
File
sav
e/ L
oad
*RST
:PRESet
BIN
Mode ABS/ABS ← ← ← No Yes Yes
Absolute value mode
Upper limit value OFF/OFF ← ← ← No Yes Yes
Lower limit value OFF/OFF ← ← ← No Yes Yes
Percent mode
Deviation percentage
mode
Reference value 1.0000 k/10.0000 ← ← ← No Yes Yes
Upper limit value OFF/OFF ← ← ← No Yes Yes
Lower limit value OFF/OFF ← ← ← No Yes Yes
Continuous measurement Display timing REAL ← ← ← No No Yes
Open correction
Correction mode OFF ← ← No Change No Yes*2 Yes
Correction value
G Correction value 0.000 ns ← ← No Change No Yes*2 Yes
B Correction value 0.000 ns ← ← No Change No Yes*2 Yes
Correction range limit function
DC ON ← ← No Change No Yes*2 Yes
MIN 4 Hz ← ← No Change No Yes*2 Yes
MAX 8 MHz ← ← No Change No Yes*2 Yes
Short correction
Correction mode OFF ← ← No Change No Yes*2 Yes
Correction value
R Correction value 0.00 mΩ ← ← No Change No Yes*2 Yes
X Correction value 0.00 mΩ ← ← No Change No Yes*2 Yes
Correction range limit function
DC ON ← ← No Change No Yes*2 Yes
MIN 4 Hz ← ← No Change No Yes*2 Yes
MAX 8 MHz ← ← No Change No Yes*2 Yes

Appx.19
Initial Settings Table
Setting Items Default setting
Initi
aliz
ed in
itiat
ed o
n in
stru
men
t
Initialization initiated with
command
Rev
erts
to d
efau
lt va
lue
at p
ower
-on
Pane
l sav
e/ L
oad
File
sav
e/ L
oad
*RST
:PRESet
Load correction
ON/OFF OFF ← ← No Change No Yes*2 Yes
Correction mode Z-θ ← ← No Change No Yes*2 Yes
Reference value
Z Reference value OFF ← ← No Change No Yes*2 Yes
θ Reference value OFF ← ← No Change No Yes*2 Yes
Correction frequency OFF ← ← No Change No Yes*2 Yes
Correction signal level
Mode V ← ← No Change No Yes*2 Yes
V OFF ← ← No Change No Yes*2 Yes
CV OFF ← ← No Change No Yes*2 Yes
CC OFF ← ← No Change No Yes*2 Yes
Load correction
Correction range
Range OFF ← ← No Change No Yes*2 Yes
LOW Z OFF ← ← No Change No Yes*2 Yes
Correction DC bias
ON/OFF OFF ← ← No Change No Yes*2 Yes
Bias value 0.00 V ← ← No Change No Yes*2 Yes
Correction value
Z coefficient OFF ← ← No Change No Yes*2 Yes
θ coefficient OFF ← ← No Change No Yes*2 Yes
Cable length correction 0 m ← ← No Change No Yes Yes
Scaling correction
(Correlation Correction)
ON/OFF OFF ← ← No Change No Yes*2 Yes
Correction value
A 1.000 ← ← No Change No Yes*2 Yes
B 0.00000 ← ← No Change No Yes*2 Yes
10
9
8
7
6
5
4
3
2
1
Appx.
索引

Appx.20
Initial Settings Table
Setting Items Default setting
Initi
aliz
ed in
itiat
ed o
n in
stru
men
t
Initialization initiated with
command
Rev
erts
to d
efau
lt va
lue
at p
ower
-on
Pane
l sav
e/ L
oad
File
sav
e/ L
oad
*RST
:PRESet
Panel
Save type ALL ← ← ← No No Yes
Panel registration None
Cle
ar a
ll da
ta
Cle
ar a
ll da
ta
No Change No No
Onl
y w
hen
ALL
SAV
E
Interfaces
USB Terminator CR+LF ← No Change
No Change No No Yes
GP-IBAddress 01 ← No
ChangeNo
Change No No Yes
Terminator LF ← No Change
No Change No No Yes
RS-232C
Baud rate 9600 ← No Change
No Change No No Yes
Handshake OFF ← No Change
No Change No No Yes
Terminator CR+LF ← No Change
No Change No No Yes
LAN
IP address 192.168.000.001 ← No Change
No Change No No Yes
Subnet mask 255.255.255.000 ← No Change
No Change No No Yes
Gateway OFF ← No Change
No Change No No Yes
Port 3500 ← No Change
No Change No No Yes
Terminator CR+LF ← No Change
No Change No No Yes
Header OFF ← ← No Change Yes No No
Status Byte register*3 0No
Change*4
No Change
No Change Yes No No
Event register*3 0No
Change*4
No Change
No Change Yes No No
Enable register*3 0No
Change*4
No Change
No Change Yes No No
Measurement parameter*3
(:MEASure:ITEM) 0,0,0 ← ← ← No No Yes

Appx.21
Initial Settings Table
Setting Items Default setting
Initi
aliz
ed in
itiat
ed o
n in
stru
men
t
Initialization initiated with
command
Rev
erts
to d
efau
lt va
lue
at p
ower
-on
Pane
l sav
e/ L
oad
File
sav
e/ L
oad
*RST
:PRESet
Interface
Response data to measured value acquisition query*3
(:MEASure:VALid)10 ← ← ← No No Yes
Measured value automatic output*3
(:MEASure:OUTPut:AUTO) OFF ← ← ← No No Yes
Transfer format*3
(:FORMat:DATA) ASCII ← ← ← No No Yes
Long format*3
(:FORMat:LONG) OFF ← ← ← No No Yes
File
Save Format OFF ← ← ← No No Yes
Save folder AUTO ← ← ← No No Yes
Header
Date and time ON ← ← ← No No Yes
Measurement conditions ON ← ← ← No No Yes
Measurement parameters ON ← ← ← No No Yes
Delimiter ,(Comma) ← ← ← No No Yes
Quote "(Double quote) ← ← ← No No Yes
Touch panel calibration No calibrationNo
Change*5
No Change
No Change No No No
Clock No settingNo
Change*4
No Change
No Change No No No
*1: All 10 ranges will be initialized as described.*2: The panel’s save type (SAVE TYPE) is not saved in HARD mode.*3: Setting can only be changed using commands.*4: Setting will not change, even during a full reset.*5: Setting reverts to its factory default during a full reset.
10
9
8
7
6
5
4
3
2
1
Appx.
索引

Appx.22
Device Compliance Statement
Appx. 12 Device Compliance Statement"Information on compliance to standards" based on the IEEE 488.2 standard
Item Description
1 IEEE 488.1 interface functions See “GP-IB specifications” in the Communications Instruction Manual on the bundled LCR Application Disc.
2 Operation with a device address other than 0 through 30
Such a setting is not possible.
3 Timing of changed device address recog-nition
A change of address is recognized immediately after changing.
4 Device settings at power on The explanatory status information for hardware settings will be cleared when the instrument is turned on. Otherwise, data is backed up.However, the header on/off setting, and response message sepa-rator and terminator are all reinitialized.
5 List of message exchange options • Input buffer capacity and operation(See the bundled LCR Application Disc.)
Queries to which multiple response message instruments are returned:BIN:FLIMit:ABSolute? ......................................................2:BIN:FLIMit:DEViation? ....................................................2:BIN:FLIMit:PERcent? ........................................................2:BIN:SLIMit:ABSolute? ......................................................2:BIN:SLIMit:DEViation? ....................................................2:BIN:SLIMit:PERcent? ........................................................2:COMParator:FLIMit:ABSolute? .......................................2:COMParator:FLIMit:DEViation? .....................................3:COMParator:FLIMit:PERcent? .........................................3:COMParator:SLIMit:ABSolute? .......................................2:COMParator:SLIMit:DEViation? .....................................3:COMParator:SLIMit:PERcent? .........................................3:CORRection:LIMit:POINt ..................................................2:CORRection:OPEN:DATA:ALL .............................................. *:CORRection:OPEN:DATA:SPOT ........................................... *:CORRection:SHORt:DATA:ALL ........................................... *:CORRection:SHORt:DATA:SPOT ......................................... *:CORRection:LOAD:CONDition? .........................................7:CORRection:LOAD:DCResistance:CONDition? ...................2:CORRection:LOAD:REFerence? .........................................3:CORRection:SCALe:DATA? ..................................................2:DCResistance:RANGe:AUTO:LIMit ...................................2:FILE:INFOrmation? .............................................................5:MEASure? ............................................................................... *:MEASure:ITEM? ....................................................................3:MONItor? ...............................................................................4:RANGe:AUTO:LIMit ..............................................................2:SAVE:MODE? ...........................................................................2:SIGMa? ...................................................................................2:SYSTem:DATE? ......................................................................3:SYSTem:TIME? ......................................................................3* The number of response messages varies depending on the
settings. • Queries producing responses as syntax checking is performed:All queries produce responses when syntax checking is per-formed.
• Whether any queries produce responses when read:There are no queries which produce response messages at the instant they are read in by the controller.
• Whether any commands are coupled:There are no relevant commands.

Appx.23
Device Compliance Statement
Item Description
6 Summary of functional elements for use when constructing device specific com-mands, and whether compound com-mands or program headers can be used:
The followings can be used • Program message • Program message terminator • Program message unit • Program message unit separator • Command message unit • Query message unit • Command program header • Query program header • Program data • Character program data • Decimal program data • Compound commands and program headers
7 Buffer capacity limitations for block data Block data is not used.
8 Summary of program data elements used in expressions, and deepest nesting level allowable in sub-expressions, including syntax restrictions imposed by the device.
Sub-expressions are not used. Character data and decimal data are the only program data elements used.
9 Response syntax for queries See the bundled LCR Application Disc.
10 Transmission congestion relating to device-to device messages which do not conform to the general principles for basic response messages
There are no device to device messages.
11 Response capacity for block data Block data does not appear in responses.
12 Summary of standard commands and que-ries used
See the bundled LCR Application Disc.
13 Device state after a calibration query has been completed without any problem
The "*CAL?" query is not used.
14 Existence/nonexistence of "*DDT" com-mand
The "*DDT" query is not used.
15 Existence/nonexistence of macro com-mand
Macros are not used.
16 For queries related to identification, expla-nationof the response to the "*IDN?" query
See "*IDN?" in the Communications Instruction Manual on the bundled LCR Application Disc.
17 Capacity of the user data storage area reserved for when the "*PUD" command and the "*PUD?" query are being executed
The "*PUD" command and the "*PUD?" query are not used. Fur-ther, there is no user data storage area.
18 Resources when the "*RDT" command and the "*RDT?" query are being used
The "*RDT" command and the "*RDT?" query are not used. Fur-ther, there is no user data storage area.
19 Conditions which are influenced when "*RST", "*LRN?", "*RCL?", and "*SAV" are used
"*LRN?", "*RCL?", and "*SAV" are not used. The"*RST" com-mand returns the instrument to its initial state.See "*RST" in the Communications Instruction Manual on the bundled LCR Application Disc.
20 Scope of the self-testing executed as a result of the "*TST?" query
See "*TST?" in the Communications Instruction Manual on the bundled LCR Application Disc.
21 Additional organization of the status data used in a device status report
See the Communications Instruction Manual on the bundled LCR Application Disc
22 Whether commands are overlap or se-quential type
All commands except:MEASure?, :MEMo-ry?, :CORRection:OPEN, :CORRection:SHORt, and:CORRection:LOAD are sequence commands.
23 Criterion relating to the functions required at the instant that the termination message is produced, as a response to each command
Termination occurs when the command has been parsed.
10
9
8
7
6
5
4
3
2
1
Appx.
索引

Appx.24
Device Compliance Statement
Ind.1
Symbol
σε key ....................................................................... 67
Numbers
2-terminal measurementDetecting contact errors ........................................ 84
4-terminal measurementDetecting poor contact .......................................... 85
A
Absolute value setting ........................................ 71, 76Accessories ................................................................ 1Accuracy ......................................................... 191, 207
Calculation example .................................... 209–210AC measurement................................................ 40, 43ADJ DELAY key ........................................................ 62ADJ screen ............................................................... 27Adjustment delay .......................................... 62, 65–66Admittance................................................................ 40All correction (Open correction) .............................. 100All correction (Short correction) .............................. 106ALL LOAD key ........................................................ 156Application settings................................................... 79Applying the signal to the measurement sample during measurement only ......................................... 64AREA key ............................................................... 101AUTO range ............................................................. 45
Limiting the range.................................................. 46Unable to determine ............................................ 226
Averaging ................................................................. 56AVG key .................................................................... 56
B
Backup battery life .................................................. 191Basic settings ........................................................... 43BCD mode .............................................. 168–169, 184BEEP key ................................................................. 89Beep sound .............................................................. 89Beep sound is emitted continuously. ...................... 227BIN function .............................................................. 74
Settings ........................................................... 74–78BIN measurement..................................................... 68
C
CABLE key ............................................................... 98Cable length correction............................................. 98CALIBRATION key ................................................. 134Capacitance.............................................................. 40Capacitor measurement ........................................... 59CC ............................................................................ 49CD ........................................................................ 1, 15
Changing a panel name ......................................... 129Circuit ................................................................ Appx.4Circuit diagrams...................................................... 176Cleaning ................................................................. 222Clean the instrument .............................................. 222C, L→|Z| conversion table ...................................... 216Communication commands .................................... 186Comparator function
Settings ........................................................... 69–73Comparator measurement........................................ 68Conditions/correction values
Load .................................................................... 128Conductance ............................................................ 40Conductivity ........................................................ 40, 67Connection examples ..................................... 178–179Connector ........................................................... 18–19Constant current ....................................................... 49Constant voltage....................................................... 49Contact check function ............................................. 85CONTACT key .......................................................... 85Continuous measurement ........................................ 93Correction ........................................................... 27, 97
Disabling (Load correction) ................................. 120Disabling (Open/Short correction) ........................ 111Fails (Load correction) ......................................... 119Fails (Open or Short Correction) ......................... 109User specified correction coefficient ........... 121–122
Correction value data ............................................. 123Save .................................................................... 123
Current limit .............................................................. 58CV............................................................................. 49
D
DC ADJ key .............................................................. 60DC adjustment function ...................................... 60–61DC bias .............................................................. Appx.6DC bias current.................................................. Appx.8DC bias function ............................................... 59, 191DC BIAS key............................................................. 59DC bias voltage ................................................. Appx.7DC delay ....................................................... 61, 65–66DC DELAY key ......................................................... 61DC measurement ............................................... 40, 43DC resistance measurement ...................... 40, 43, 191DELAY key ............................................................... 63Delay time
Between the trigger and measurement ................. 63DC measurement .................................................. 61from judgment result output to EOM signal output ............................................................................ 181Offset measurement .............................................. 62
DELETE key ........................................................... 158Deleting a panel...................................................... 130Detecting poor contact.............................................. 85Deviation percentage setting .............................. 72, 77dgt.............................................................................. 11Dielectric strength ................................................... 192
Index
Index
10
9
8
7
6
5
4
3
2
1
付録
Ind.
Ind.2
Index
Full reset ................................................................. 229Functions .................................................................. 18Function specifications ................................... 193–204
G
GP-IB connector ............................................... 19, 206Guaranteed accuracy range ................................... 213Guarding ............................................................ Appx.4
H
High impedance components ............................ Appx.3High-precision measurement.................................... 55High-Z reject function ............................................... 84Hi Z key .................................................................... 84HOLD........................................................................ 45
I
Iac ............................................................................. 41Idc ............................................................................. 41I/F tab ..................................................................... 132Impedance ................................................................ 40Increasing measurement precision........................... 82Increasing measurement speed ............................... 82Inductance ................................................................ 40INFORMATION ......................................................... 26INFO tab ................................................................. 132Initialization ...................................................... Appx.15Initializing ................................................................ 228Initial settings ................................................... Appx.15Input (IN) signal ...................................................... 167Input/output signals test.......................................... 135Inspection ......................................................... 33, 221Instrument installation............................................... 12Interface............................................................ 28, 132
Specifications .............................................. 205–206Internal circuitry ...................................................... 176Internal memory errors ........................................... 135Internal trigger ...................................................................... 62IO BCD key............................................................. 184IO EOM key ............................................................ 183I/O HANDLER TEST key ........................................ 135IO JUDGE key ........................................................ 181IO TRIG key ............................................................ 182
J
JUDGE key ............................................................... 69Judgement ................................................................ 68Judgement results
Output ................................................................. 184JUDGE SYNC .......................................................... 45Judgment mode ........................................................ 69
DIGIT key ................................................................. 87Dimensional diagram ....................................... Appx.14Dimensions ............................................................. 192Discarding............................................................... 235DISP key ............................................................. 88, 96Display ...................................................................... 18
Auto-off ............................................................ 88, 96does not appear .................................................. 223Shorten the screen update interval ....................... 95
DISPLAY & LED TEST key ..................................... 134Display parameters................................................... 39Display timing ........................................................... 95DRAW key ................................................................ 95
E
Effective resistance .................................................. 40EMI ferrite-core .................................................. Appx.5Enlarging display ...................................................... 42Environment ........................................................... 192EOM signal output method and output time ........... 183Equivalent parallel capacitance ................................ 40Equivalent parallel resistance ................................... 40Equivalent series capacitance .................................. 40Equivalent series resistance ..................................... 40Error
Output signals ..................................................... 170Error display ....................................................... 9, 230Error massage .............................................. 9, 41, 230Exhibiting excessive variation of the measurement value ............................................................... 224–225External control....................................................... 161
Q&A ..................................................................... 185External noise .................................................... Appx.5External trigger ......................................................... 62EXT I/O ................................................................... 135
Connector........................................ 15, 19, 162, 205Example connections .......................................... 176
F
Features ................................................................... 17File ............................................................................ 29
Delete .................................................................. 158FILE screen .............................................................. 29Fixture....................................................................... 35Folder
Create ................................................................. 159Delete .................................................................. 158Specify the data save destination ....................... 152
FOLDER key .......................................................... 159Format
USB flash drive ................................................... 140FORMAT key .......................................................... 140FREQ key ................................................................. 44Frequency................................................................. 44f.s. .............................................................................. 11

Ind.3
Index
Calculation example .................................... 209–210Measurement cables ................................................ 35Measurement categories ........................................... 11Measurement conditions ............................ 26, 43, 123
For individual measurement ranges ................ 79–81Measurement conditions/Correction values
Save ............................................................ 124–127Measurement error ................................................... 60Measurement frequency ................................... 44, 188Measurement items ................................................ 187Measurement mode.................................................. 24Measurement range ........................... 45–48, 190, 207Measurement results
Continuous measurement ..................................... 94Judgment .............................................................. 68Save ...................................................................... 86
Measurement screen .......................................... 22–23Measurement signal level ........................... 49–51, 188Measurement speed ......................................... 54, 217Measurement time .................................................. 191Measurement times ................................................ 217Measurement timing ....................................... 171–175Memory function ................................................. 86–87MEMORY key ........................................................... 86MODE screen ........................................................... 24Monitor value ............................................................ 41
N
Names of parts ......................................................... 18Noise ................................................................. Appx.5Number of effective digits ......................................... 87
O
Open circuit voltage .................................................. 49Open correction .................................. 2–4, 99, Appx.11Opening screen ................................................ 33, 229OPEN key ................................................ 100, 103, 111Operating temperature and humidity ...................... 192Options ....................................................................... 2Output
Judgement result/Measured values .................... 184Output impedance .................................................. 189Output signals
When errors occur............................................... 170Outputting measured values................................... 184
P
Panel ...................................................................... 123Panel calibration ..................................................... 134PANEL key.............................. 124, 126, 128, 129, 130Panel load............................................................... 128Panel save .............................................................. 124Panel test................................................................ 133Parallel equivalent circuit ................................. Appx.10
Judgment resultReset ................................................................... 181
Judgment tones ........................................................ 89
K
Key-lock .................................................................... 90Disable .................................................................. 91
KEYLOCK key .......................................................... 90Keys do not work. ................................................... 223Key tones.................................................................. 89
L
LAN connector .................................................. 19, 206LCD display
Auto-off ............................................................ 88, 96LCR application disc ................................................. 15LCR Application disc................................................... 1LCR mode ................................................................ 39LED........................................................................... 18
Status test ........................................................... 134Level ................................................................. 49, 188LEVEL key ................................................................ 49Lifetimes ................................................................. 221Limit .......................................................................... 58Limit function .......................................................... 189Limiting display value instability................................ 56Limiting the voltage and current applied to the sample ...................................................................... 58LIMIT key .................................................................. 58LINE FREQ key ........................................................ 53Line frequency .......................................................... 53LIST key ............................................................. 80–81LIST tab .................................................................. 139Lithium battery ........................................................ 235Load correction ........................................................ 112
Correction frequency ............................................ 115Correction range .................................................. 115Correction signal level .......................................... 116DC bias ................................................................ 117Parameter ............................................................ 117Reference values ................................................. 118Reset the correction condition.............................. 119
Loading settings ............................................. 155–156LOAD key ........................................ 113, 119, 120, 155Loss factor ................................................................ 40Low Z high accuracy mode..................................... 190Low Z High accuracy mode ...................................... 55
M
Manufacturer’s serial number ................................... 19Mass ....................................................................... 192Measured values ...................................................... 41
Output ................................................................. 184Measurement accuracy .......................................... 207
10
9
8
7
6
5
4
3
2
1
付録
Ind.

Ind.4
Index
Short correction ................................ 2–4, 105, Appx.11Shorten the correction time .................................... 101SHORT key ............................................. 106, 107, 111Signal assignments ................................................ 162Signal level ............................................................... 49Specifications ......................................................... 187Speed ............................................................... 54, 217SPEED key ............................................................... 54Spot correction (Open correction) .......................... 103Spot correction (Short correction)........................... 107Standards ............................................................... 192Storage temperature and humidity ......................... 192Superimpose a DC voltage....................................... 59Susceptance ............................................................. 40Suspended state....................................................... 37Symbols ..................................................................... 11SYS screen............................................................... 28System...................................................................... 28
Test...................................................................... 133System reset................................................... 228, 229System settings ................................................ 28, 131
T
Terminals .................................................................. 18The instrument doesn’t work. ................................. 224Timing ....................................................................... 65Timing charts .................................................. 171–175
EXT I/O ............................................................... 171Touch screen ............................................................ 20TOUCH SCREEN TEST key .................................. 133Transport ............................................................ 1, 222Trigger ................................................................ 62–63Trigger delay ................................................. 63, 65–66Trigger input
Disabled .............................................................. 182Effective edge ..................................................... 182
Trigger synchronous delay ........................... 64, 65–66Trigger synchronous output .......................... 64, 65–66TRIG key ...................................................... 62–63, 94Turning power on ................................................ 13, 36TYPE key........................................................ 143, 151
U
Unable to communicate with RS-232C................... 227Unable to perform measurement properly (Unusual measurement value) ....................................... 225–226UNLOCK key ............................................................ 91USB connector ................................................. 19, 205USB flash drive ........................................... 14–15, 137
Checking the contents of a file ............................ 157Checking the contents of files ............................. 139Creating folders ................................................... 159Deleting files and folders ..................................... 158Format ................................................................. 140Information .......................................................... 160
Parameters ............................................................... 40Passcode ............................................................ 90–91PASSCODE key ....................................................... 90Percentage setting.............................................. 72, 77Permittivity .......................................................... 40, 67Phase angle.............................................................. 40Power cord ............................................................... 34Power line .......................................................... Appx.5Power-saving ............................................................ 88Power supply ...................................................... 18–19Pre-operation inspection........................................... 33Preparations ............................................................. 31Probes ...................................................................... 35
Q
Q&A ........................................................................ 223External control ................................................... 185
Q factor ..................................................................... 40
R
Rack-mounting ................................................ Appx.12Range ............................................................... 45, 190RANGE key ............................................ 46, 47, 48, 55Range synchronization function ............................... 79rdg. ............................................................................ 11Reactance ................................................................ 40Repair ............................................................. 221, 223Repair and Inspection............................................. 221Replaceable parts................................................... 221Replaceable Parts and Operating Lifetimes ........... 221Residual charge protection ........................ 191, Appx.9RNG SYNC key ........................................................ 79ROM/RAM test ....................................................... 135ROM/RAM TEST key ............................................. 135RS-232C connector .......................................... 19, 206
S
SAVE key ................................................................ 153SAVE TO... key ....................................................... 152Saving settings data ....................................... 153–154SCALE key ............................................................. 121Scaling ............................................................ 121–122Screen ...................................................................... 20Screen copy.................................................... 150–151Screen display status test....................................... 134SELECT key ........................................................... 155Self diagnosis ......................................................... 133Series equivalent circuit................................... Appx.10SET screen ............................................................... 25Settings..................................................................... 24
External I/O settings ............................................ 180Optional ................................................................. 43Required................................................................ 43
Shipping precautions ................................................ 13

Ind.5
Index
Insert ................................................................... 138Loading Instrument Settings ....................... 155–156Saving measurement data
Screen copy .............................................. 150–151Text saving ................................................ 141–149To specify the save folder ................................. 152
Saving settings data .................................... 153–154Using a computer ................................................... 186
V
V ............................................................................... 49Vac ............................................................................ 41Vdc ........................................................................... 41Version.................................................................... 132VIEW key ................................................................ 157Voltage limit .............................................................. 58
W
Wait time ................................................................. 219Waveform averaging ................................................ 82WAVE NUM key ........................................................ 82
10
9
8
7
6
5
4
3
2
1
付録
Ind.

Ind.6
Index

16-01 EN