iluka pro rata entitlement offer appendix mineral sands industry overview
TRANSCRIPT

107APPENDIX
Mineral Sands Industry Overview

108 This Section provides an overview of the mineral sands industry and market as well as Iluka’s competitive position within the global market. This Section includes forward-looking statements that may be affected by a range of variables and changes in underlying assumptions which could cause actual results to differ materially. These include, but are not limited to, the risks discussed in Section 6 of this Prospectus.
A1 OverviewMineral sands represent a relatively small, niche part of the global resources sector. The mineral sands industry consists of two core product streams:
■ Titanium dioxide minerals – in the form of rutile, ilmenite and leucoxene. Ilmenite is also used to manufacture titanium slag and synthetic rutile products; and
■ Zircon.
Titanium dioxide products are more prevalent than zircon, with an average titanium dioxide to zircon ratio of 5:1 in typical mineral sands deposits. Mineral sand products (titanium dioxide and zircon) are used in a wide and increasing range of consumer and industrial applications. The predominant use of titanium dioxide is as a pigment feedstock for paint manufacture, as well as in specialist applications including welding electrodes and titanium metal. Zircon is currently used predominantly in the manufacture of tiles, ceramics and sanitary ware, although it has a range of other applications including zirconium chemicals and zirconium metal.
The industry has typically displayed growth rates which have correlated closely with global economic growth rates. Increasingly, there is evidence of strengthening in demand for mineral sands products from developing regions and economies, such as China and to a lesser extent India, where the products are associated with both industrialisation and increasing urbanisation. Since 2000 demand growth from these markets has exceeded that for the more established markets such as Europe and North America.
The global titanium dioxide feedstock market was estimated at 6.0 million tonnes of titanium dioxide units in 2007, and generated approximately US$2.0 billion in revenue. Zircon has been generally regarded as a co-product of titanium dioxide feedstock production. The global zircon market in 2007 was estimated at around 1.25 million tonnes and generated approximately US$0.9 billion in revenue. The industry is relatively consolidated on the producer side, with
fi ve participants accounting for approximately 57% of global titanium dioxide production and fi ve participants accounting for approximately 75% of zircon production in 2007. In terms of customers, the titanium dioxide market is relatively consolidated with, for example, Iluka’s top 10 customers accounting for 85% of its titanium minerals sales revenue. The zircon market is less consolidated with, for example, Iluka’s top 10 customers making up approximately 50% of its zircon sales revenue.
The mineral sands industry is typically characterised by contractual arrangements, involving bulk shipments contracted on a volume and price basis for a set period, typically of at least 12 months. Only a relatively small spot market exists for mineral sands products and there is no “screen traded” equivalent in mineral sands.
In Iluka’s case, volume commitments are often entered into with major customers over multiple years, usually with annual price negotiations for most products.
Iluka is the largest global producer of zircon with an estimated 37% market share in 2007 and is the second largest producer of titanium dioxide products with an estimated 20% market share in 2007.1
A1.1 Mineral Sands – Technical BackgroundMineral sands is the term used to describe Heavy Minerals (HM) with a specifi c gravity greater than 2.85. These minerals were produced by weathering and erosion of the earth’s surface and were carried by sedimentary action to coastlines where a combination of wave action (strand deposits) and, to a lesser extent wind action (dunal deposits), resulted in concentrations in bodies of silica sand along ancient beach lines and associated environments.
The major known locations of mineral sands ore bodies are in Australia, India, southern Africa and southern USA. The majority of mineral sands occur in sand style deposits, although the titanium-bearing mineral, ilmenite, is also mined from hard rock deposits in Canada, China and Norway. Australia’s mineral sands deposits occur along the coast of eastern Australia from central New South Wales to northern Queensland, and in Western Australia. In addition, ancient beach deposits are found in Victoria, New South Wales and South Australia.
Mineral sands deposits are characterised by their grade (the percentage of HM found in a deposit) and their assemblage (the relative proportion of valuable HM components of ilmenite, rutile and zircon). The typical composition of a mineral sands deposit
Note:
1. Iluka, 2007 estimates. Includes 100% of CRL output, which Iluka markets on CRL’s behalf.
Appendix – Mineral Sands Industry Overview

109
Figure A.1: Titanium Feedstock Processing Routes
Source: TZMI
Sand Deposits(Dredge or Dry Mining)Hard RockMining
Processing
Key Products Ex Mine
Key UpgradedTitanium Products
Major PigmentProduction Processes
Final Products
End Uses
Wet Concentration
Dry Concentration
LeucoxeneIlmenite
Synthetic RutileTitanium Slag
Chloride TiO2 Process
Titanium TetrachlorideTiCI
4
High Purity Pig Iron
Sulphate TiO2 Process
White Pigment
Foundries Paints Plastics Paper Other– Inks– Ceramics– Fibres
– Aerospace– Chemical Plants– Golf Clubs
– Welding Electrode Flux
– Opacifiers/ Glazes– Refractories– Zirconium Chemicals– Abrasives
Titanium Metal
Titanium Sponge
Rutile Zircon
has a HM grade ranging from 0.5% to above 20%, with titanium dioxide products normally being in the greatest preponderance, relative to zircon.
A unique feature of titanium dioxide minerals is that commercial products have a wide range of titanium dioxide and impurity contents. This can range from as low as 40% titanium dioxide for some ilmenites to as high as 96% titanium dioxide for some natural rutile. Pricing for these products ranges from as low as US$50/t to over US$600/t depending on grade and end-use application. In addition, the price of
co-products such as zircon and pig-iron (a co-product of titanium slag – see Figure A.1) has risen substantially in recent years. The value of a mineral sands deposit is infl uenced by grade (a cost of mining issue), assemblages (value of the relative product streams), upgrading technology (slag or synthetic rutile), depth (quantity of overburden to access Ore Reserve) and location (distance from infrastructure and markets).
The following diagram illustrates the main stages of the titanium feedstock production process from mining through to fi nal product production.

110
Rio Tinto1 21%
Iluka2 20%
Exxaro3 7%
BHP Billiton 7%
Bemax 3%
Tinfos 2%
Tiwest JV 2%
DuPont 1%
Other 37%
Iluka2 37%
Exxaro3 13%
Rio Tinto1 8%
BHP Billiton 8%
Bemax 5%
DuPont 4%
Tiwest JV 3%
Other 22%
A1.2 Mineral Sands MarketsIndustry StructureAs noted above, the mineral sands industry is relatively consolidated. This relatively consolidated structure arises from the capital intensive nature of the industry, the specialised technologies, and the importance of quality and continuity of supply to customers. Figures A.2 indicates the consolidated nature of the industry, and also highlights Iluka’s presence in both markets.
The global titanium dioxide feedstock market can be divided into chloride and sulphate feedstocks, which refl ect the technologies used to upgrade the feedstocks to titanium dioxide pigment.
Iluka is the largest producer of chloride feedstocks, with a market share of around 27%. Chloride feedstocks constitute: rutile, synthetic rutile, chloride slag, upgraded chloride slag (UGS), chloride ilmenite and leucoxene. Sulphate feedstocks constitute: sulphate slag, sulphate ilmenite. Refer to Appendix A2.2 for further information on the titanium dioxide pigment sector.
Iluka (including CRL) is the world’s largest supplier of rutile, synthetic rutile and chloride ilmenite, and the second largest supplier of sulphate ilmenite. Iluka’s sales tonnages and estimated market shares are shown in the following table:
Figure A.2: Major Titanium Dioxide Feedstock and Zircon Producers, 2007 estimates
Titanium dioxide feedstock Zircon
Source: Iluka and TZMI estimates
Notes:
1. The titanium slag products of Rio Tinto and BHP Billiton are currently marketed by Rio Tinto.2. Includes 100% of CRL output, which Iluka markets on CRL’s behalf.3. Exxaro has a 50% interest in the Tiwest JV.
Table 1: Iluka’s Estimated Market Share by Titanium Dioxide Feedstock in 2007 Iluka Global Estimate Market ShareProduct kt kt % (estimate)
Rutile 215 620 35Synthetic rutile 527 800 66Chloride ilmenite 399 960 42Sulphate ilmenite 518 3,860 13
Source: Iluka
Note: The above fi gures include 100% of CRL’s titanium dioxide product sales which are marketed by Iluka.
Mineral sands deposits have differing grades of HM and assemblage characteristics which can infl uence the relative cost and value stream of product produced from any specifi c deposit. As such, the co-product revenue stream is very important to feedstock industry performance. Co-products include zircon and, in the case of some slag producers, high purity pig-iron produced as a by-product from slag operations.
Iluka’s operations are based predominantly within Australia, whereas many of the other leading producers have large operations within southern Africa. A number of new mineral sands projects have recently started in Africa. These include the restart of rutile mining in Sierra Leone, the recent commissioning of a large ilmenite project in Mozambique and a small zircon/rutile mine in Gambia. In addition, Rio Tinto’s titanium slag expansion plans are centred around a large new mining operation in Madagascar.
Appendix – Mineral Sands Industry Overview

111
Pigment 93%
Metal 4%
Welding 3%
Paint & Coatings 53%
Plastics 22%
Paper 8%
Other 10%
A2 Titanium OverviewA2.1 Product Uses and Main ApplicationsTitanium dioxide minerals are used mainly as feedstock for the world’s titanium dioxide pigment industry with approximately 93% of product used in the production of pigment (Figure A.3). As a pure white, highly refractive and ultraviolet light absorbing product, titanium dioxide pigment is commonly used in architectural and automotive paints, plastics, paper, textiles and inks. Titanium dioxide feedstock is also used in the manufacture of welding electrodes. Because titanium minerals are non-toxic, non-fi brogenic and biologically inert, they can also be used safely in foodstuffs, pharmaceuticals and cosmetics.
Rutile, synthetic rutile and slag can be used to make titanium metal. Due to the combination of strength and lightness of titanium metal, it is used for advanced engineering applications, including architectural coatings, the aerospace industry as well as a range of other applications, including sporting equipment and jewellery. Titanium metal is also used in desalination plants and corrosive chemical industries, because of its inertness and resistance to corrosion. Its non-reactive properties make titanium metal one of the few materials that can be used in the human body for hip replacements and heart pacemakers.
Rutile, leucoxene and small amounts of ilmenite are also used as a fl ux material in welding electrodes for shipbuilding and civil engineering.
A2.2 Titanium Dioxide Pigment IndustryAccounting for 93% of consumption, the titanium dioxide pigment industry is by far the most important market sector for titanium dioxide minerals. The pigment industry is primarily reliant on demand from the traditional paints and coatings sector (56%) and the faster-growing plastics sector (24%). According to TZMI, the overall consumption growth has consistently been around 3.0% p.a. for the past 40 years and global titanium dioxide pigment consumption is estimated at having been around 4.9 million tonnes in 2007.
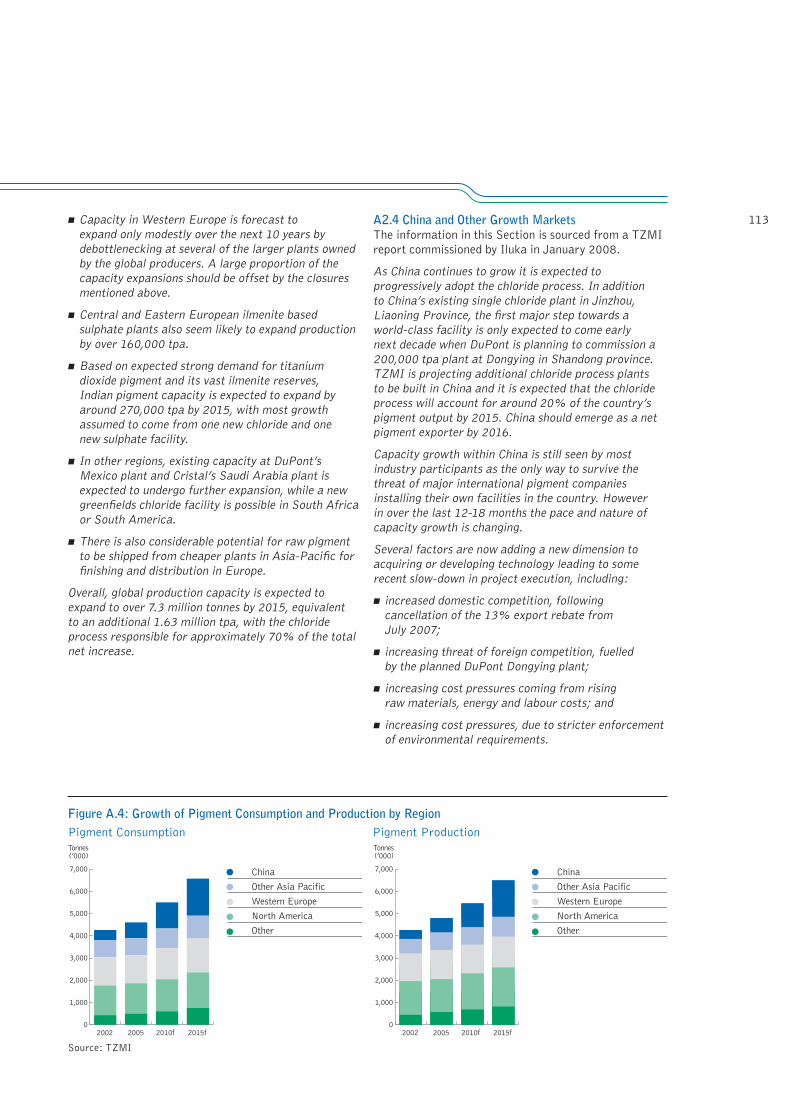
Geographically, the major markets for pigment are the developed regions of North American and Western Europe (accounting for about 28% of global consumption each in 2006). The next largest regions are China (17%) and the rest of Asia Pacifi c (16%). However, China is the region which has showed the greatest growth over the past decade, with TZMI estimates indicating that China consumed less than 10% of global pigment in 2000.
According to TZMI, there is still very little risk of any signifi cant substitution for titanium dioxide pigment in its major end markets. As has been the case for the past 40 years, particularly in the paint and coatings industry, there will continue to be the potential for substitution in selected markets but volumes are not expected to be large. Titanium dioxide pigment still has very substantial advantages over currently known alternative products and more uses are continuing to be identifi ed in niche markets, such as nano-particles, through persistent research and development efforts.
Figure A.3: Breakdown of Titanium Dioxide Feedstock Markets by End-Use Sector, 2006
Source: TZMI and Iluka

112 Pigment production is highly consolidated with the top fi ve producers accounting for almost 67% of global production capacity in 2007. The market leader is DuPont, with a market share of about 20%, while the other major producers include Cristal (16%) Tronox, Kronos and Huntsman (each with about an 11% share of capacity). Most of these producers have production facilities centred on North America and Western Europe, which have historically been the largest markets for pigment. In 2007, global pigment production from over 110 plants was estimated by TZMI to be around 5.1 million tonnes, an increase of 1.5% over 2006, valued at close to US$10.5 billion, with 87% capacity utilisation.
Pigment production is divided into two types of manufacturing technology: the chloride and sulphate processes. The chloride process, which utilises a chlorinating process, accounts for about 55% of all pigment production and typically consumes feedstocks of high grade and high value (such as rutile, synthetic rutile and chloride slag).
The sulphate pigment process which utilises a sulphuric acid digestion process, accounts for the remaining 45% of all pigment production and typically consumes feedstocks of low grade and low value (such as ilmenite and sulphate slag).
Chloride technology is generally newer, more effi cient and generates less waste than sulphate technology. It is forecast that the capacity of this process will grow faster than that of the sulphate process. However, despite sulphate capacity reductions in the western world, China continues to expand its sulphate capacity very rapidly (growing approximately 17% pa over the fi ve years to 2006 in terms of installed pigment capacity). Sulphate capacity is, however, expected to decrease after 2011 in China as local producers move towards the production of higher quality pigment by using the chloride process. This change is expected to be infl uenced by the need for pigment producers to reduce waste and maintain higher environmental standards, ensure a higher quality and more consistent product, as well as increase pigment product output effi ciency relative to feedstock input.
A2.3 Trends in the Titanium Dioxide Industry The information in this Section is sourced from a TZMI report commissioned by Iluka in January 2008.
TZMI believes that for the period to 2015 the pigment industry is likely to exceed the long term average 3.0% pa growth rate trend achieved since 1970, as there is currently not expected to be any marked slow down in demand for titanium dioxide pigment in China. The growing demand base for China begins to lift the global demand growth rate as the size of the Chinese demand achieves signifi cant global proportions.
The regional contribution to this growth will certainly be uneven. In the mature developed economies of North America and Western Europe the underlying consumption growth rate is likely to be 1% to 2% per annum, consistent with recent performance. This lower rate should be counterbalanced by the continuing rapidly growing demand in the Asia-Pacifi c region which has averaged 6.7% pa over the last 10 years and is forecast to average 6.1% pa to 2015. In China alone, TZMI’s titanium dioxide pigment demand forecast for 8.4% pa would result in consumption of 1.7 million tonnes by 2015, a level that would take China’s consumption beyond that for Western Europe and North America.
Global pigment production capacity has to expand to accommodate the projected increase in consumption, so capacity additions are expected to be a major feature in the period to 2015, led by China. Further expansions, beyond those already announced, as well as the closure of selected plants, will occur in the period to 2015. The major assumptions are highlighted below:
■ China titanium dioxide pigment capacity (including non-pigmentary material) is expected to surpass 1.4 million tpa by 2009, with the top fi ve Chinese producers likely to have individual capacities of around 100,000 tpa. Total Chinese titanium dioxide pigment production is expected to reach 1 million tonnes in 2010. A contributing factor to this will be greater penetration of export markets as product quality progressively improves over the next few years.
■ By 2015, total installed Chinese titanium dioxide capacity is forecast to be around 1.75 million tpa, and is expected to include some 425,000 tpa of new chloride capacity, including DuPont’s planned Dongying chloride plant, forecast to commence operation in 2011.
■ The emergence of a highly competitive and expanding Chinese pigment sector will place pressure on several higher cost European and Japanese plants, leading to the closure by 2015 of over 300,000 tpa capacity associated with the less effi cient sulphate process plants. Plant closures will probably be a combination of outright closure with some plants closing only the front end and purchasing raw pigment from other low cost plants.
■ In North America, no new greenfi elds capacity is assumed during the period to 2015, but capacity growth is expected to be achieved through expansion and debottlenecking at many of the major plants. Capacity increases totalling 208,000 tpa are forecast, taking installed capacity in the region to just under 2.0 million tpa.
Appendix – Mineral Sands Industry Overview
113■ Capacity in Western Europe is forecast to expand only modestly over the next 10 years by debottlenecking at several of the larger plants owned by the global producers. A large proportion of the capacity expansions should be offset by the closures mentioned above.
■ Central and Eastern European ilmenite based sulphate plants also seem likely to expand production by over 160,000 tpa.
■ Based on expected strong demand for titanium dioxide pigment and its vast ilmenite reserves, Indian pigment capacity is expected to expand by around 270,000 tpa by 2015, with most growth assumed to come from one new chloride and one new sulphate facility.
■ In other regions, existing capacity at DuPont’s Mexico plant and Cristal’s Saudi Arabia plant is expected to undergo further expansion, while a new greenfi elds chloride facility is possible in South Africa or South America.
■ There is also considerable potential for raw pigment to be shipped from cheaper plants in Asia-Pacifi c for fi nishing and distribution in Europe.
Overall, global production capacity is expected to expand to over 7.3 million tonnes by 2015, equivalent to an additional 1.63 million tpa, with the chloride process responsible for approximately 70% of the total net increase.
A2.4 China and Other Growth MarketsThe information in this Section is sourced from a TZMI report commissioned by Iluka in January 2008.
As China continues to grow it is expected to progressively adopt the chloride process. In addition to China’s existing single chloride plant in Jinzhou, Liaoning Province, the fi rst major step towards a world-class facility is only expected to come early next decade when DuPont is planning to commission a 200,000 tpa plant at Dongying in Shandong province. TZMI is projecting additional chloride process plants to be built in China and it is expected that the chloride process will account for around 20% of the country’s pigment output by 2015. China should emerge as a net pigment exporter by 2016.
Capacity growth within China is still seen by most industry participants as the only way to survive the threat of major international pigment companies installing their own facilities in the country. However in over the last 12-18 months the pace and nature of capacity growth is changing.
Several factors are now adding a new dimension to acquiring or developing technology leading to some recent slow-down in project execution, including:
■ increased domestic competition, following cancellation of the 13% export rebate from July 2007;
■ increasing threat of foreign competition, fuelled by the planned DuPont Dongying plant;
■ increasing cost pressures coming from rising raw materials, energy and labour costs; and
■ increasing cost pressures, due to stricter enforcement of environmental requirements.
0
1,000
2,000
3,000
4,000
5,000
6,000
7,000
Tonnes(’000)
China
Other Asia Pacific
Western Europe
North America
Other
2002 2005 2010f 2015f0
1,000
2,000
3,000
4,000
5,000
6,000
7,000
Tonnes(’000)
China
Other Asia Pacific
Western Europe
North America
Other
2002 2005 2010f 2015f
Figure A.4: Growth of Pigment Consumption and Production by RegionPigment Consumption Pigment Production
Source: TZMI

114 Since the Chinese industry is now somewhat fragmented, acquiring skills and know-how is no longer centralised and each manufacturer has to do this on its own. Environmental impact requirements are enforced more strictly and the process of obtaining building permission is now more comprehensive and time consuming, leading to an inevitable slow-down in growth of new capacity – at least in the short term. The drive for increased size, now coupled with improved effi ciency as to manufacturing cost and product quality, plus improved environmental performance, will continue to stimulate investment in new capacity. This will in part be off-set by the closure of dated capacity and the demise of smaller and ineffi cient producers
Demand for pigment in Asia-Pacifi c is expected to grow from 1.58 million tonnes in 2006 to 2.8 million tonnes by 2016, a compound annual growth rate of 5.7%.
China, South Korea and Japan are all key regional markets. In the period to 2015 nearly 500,000 tonnes of additional imports will be required by these three countries. South Korea in particular looks to be a prime candidate for a new greenfi elds plant within the next 5–10 years, as it is currently served by two small sulphate plants and a fi nishing plant.
In terms of demand potential, India has the greatest claim. With just over one billion people and a current apparent consumption of only about 130,000 tpa (partly met by domestic production from four small plants), India’s potential is enormous. Comparisons with China’s eight-fold increase in demand during this decade are regularly made, but it should be recognised that the rapid growth in China over the last 5–7 years has been in most cases supported by all levels of government. In India this is often not the case where the potential economic growth is stifl ed by legislative or bureaucratic procedures. For that reason the growth rate for pigment seems likely to be around 8% pa.
A2.5 Historical Titanium Dioxide Feedstock PricesHistorical rutile prices (in nominal US$/t FOB terms) from 1970 to 2007 are shown in Figure A.5. The main events infl uencing pricing over this period of time are:
■ period of strong pigment demand together with high titanium dioxide feedstock capacity constraints between 1985 and 1990;
■ additional synthetic rutile and chloride slag coming onto the market from 1990 until 1993/94;
■ closure of Sierra Rutile Limited (capacity of just over 150,000 tpa) in early 1995 pushed up the spot price of rutile rapidly until 1996;
■ additional slag coming onto the market from Ticor SA (now Exxaro) in 2002 dropped prices in 2003; and
■ since 2003 rutile prices have progressively re-aligned with slag and synthetic rutile in relative economic value terms.
Historical TZMI synthetic rutile prices start from 1980, as this is when synthetic rutile production began on a commercial scale. As with rutile, prices have been sourced from TZMI and converted into nominal US$/t FOB terms. Given that varying qualities of synthetic rutile are produced by Iluka and others, the prices used are those representing synthetic rutile with a grade of 92.5% titanium dioxide. It should also be noted that a signifi cant proportion of synthetic rutile was sold in Australian dollars until 2000–2003. The synthetic rutile prices are shown Figure A.5. The main events infl uencing pricing over this period of time were:
■ period of high titanium dioxide feedstock oversupply from new synthetic rutile and chloride slag capacity from 1990 to 1993;
■ impact of closure of Sierra Rutile Limited in early 1995;
2004 200720011992 1995 199819891986198319801977197419710
100
200
300
400
500
600
US$/tonne
— Rutile — Synthetic Rutile
Figure A.5: Historical Rutile and Synthetic Rutile – Nominal FOB Prices
Source: TZMI
Appendix – Mineral Sands Industry Overview

115■ period of declining A$:US$ (most synthetic rutile still priced in A$) and additional slag coming onto the market; and
■ since 2003 synthetic rutile progressively priced in US$ and prices re-aligned with slag and rutile in relative economic value terms.
The historical TZMI ilmenite prices from 1980 indicate that both sulphate and chloride ilmenite prices remained low (less than US$30/t) until the mid 1980s and then steadily increased until the early 1990s. During this time sulphate ilmenite increased at a higher rate than chloride ilmenite and a price differential of about US$10–15/t developed in the late 1980s. This price differential remained until the early 2000s, when chloride ilmenite prices continued to increase, but the price of sulphate ilmenite dipped. The latter was caused by additional ilmenite coming onto the market from countries such as India and Vietnam. The pricing variations between sulphate and chloride ilmenite refl ect the different time horizons under which they are traded; sulphate ilmenite is still priced on an annual basis (and sometimes a spot basis) whereas chloride ilmenite is often sold under multi-year contracts with some form of price escalation year on year.
A2.6 Iluka’s Interpretation of Pricing Trends in Titanium Dioxide FeedstockIluka has recently completed an analysis of the long term historical pricing trends of rutile, synthetic rutile, chloride slag and chloride and sulphate ilmenite, based on the TZMI sourced information contained in Figure A.6.
Utilising a line of “best fi t” indicates a compound annual growth rate (CAGR) of 4.3% for rutile prices over the period displayed above (converted into nominal US$/t FOB terms). Basing the line of best fi t from 1975 (as 1970 is considered a low period in rutile pricing) results in a CAGR of 2.5%.
Synthetic rutile pricing history since the commencement of production in 1980 was analysed in a similar manner. Given that varying qualities of synthetic rutile are produced by Iluka and others, Iluka’s analysis used prices for synthetic rutile representing a grade of 92.5% titanium dioxide content. A signifi cant proportion of synthetic rutile sold during 2000–2003 was done in Australian dollars and these prices have been converted using average annual exchange rates (refer to Section 6.2.3 for a description of certain risks associated with currency exchange rate fl uctuations). A CAGR of 2.7% was calculated for synthetic rutile from 1970 to the end of 2007. A similar CAGR was calculated for overall average high grade titanium dioxide chloride feedstock prices.
Iluka does not publicly provide future pricing outcomes for its products. However, since 2003, Iluka has achieved average US$/t price increases for both rutile and synthetic rutile in excess of the CAGR percentages quoted above. Going forward prices will depend on the global supply/demand balances for individual products. As outlined in Section A4, the supply/demand balances for titanium dioxide feedstocks are diffi cult to forecast, as they rely heavily on the timing and success of new projects coming on-stream. Refer to Section 6.2.6 for a description of certain risks associated with the global supply of mineral sands products.
20072001 20041992 1995 19981986 1989198319800
20
40
60
80
100
US$/tonne
—TZMI Sulphate ilmenite — TZMI Chloride ilmenite
Figure A.6: Historical Ilmenite – Nominal FOB Prices
Source: TZMI

116 A3 Zircon OverviewA3.1 Product Uses and Main ApplicationsZircon is a hard, glassy mineral used for the manufacture of ceramics and refractories and also in a range of industrial and chemical applications. Consumption is dominated by the use of milled zircon powder as an opacifi er in ceramics applications for use in tiles, sanitary ware and tableware. Zircon is also used in refractories, television glass and foundry applications, such as in the casting of jet turbine blades. Zircon is the source material for zirconia and a wide range of zirconium based chemicals. These products are used in a multitude of high-technology applications, including auto catalysts, fuel cells, electronics and abrasives. Zirconium metal is used in nuclear fuel rods and in specialist metal alloys due to its high melting point and chemical resistance.
Associated with the established ceramics industries in Italy and Spain, Europe remains the largest regional market for zircon sand consumption. However, with the rapid growth of the Chinese ceramic and zirconium chemicals sectors, China has emerged as the single most important country for zircon consumption in recent years, accounting for almost 30% of global demand.
Global zircon consumption in 2007 was estimated at 1.3 million tonnes. Figures A.7 and A.8 show the major end-uses and zircon consumption by region.
The zircon consumption industry is more fragmented than the titanium dioxide pigment industry, although the top 10 consumers accounted for about 55% of total global zircon consumption in 2007. There are many smaller users of zircon, with annual consumption rates ranging from a few thousand tonnes to as little as a few hundred tonnes per year.
A3.2 Trends in the Zircon Industry The information in this Section is sourced from TZMI from a report commissioned by Iluka in January 2008.
The underlying future demand for zircon is forecast to be strong. Growth is expected to be 3.8% pa between 2006 and 2010, and 4.5% pa between 2011 and 2015, provided zircon is not supply-constrained. This growth rate can be compared to the historical growth rate of about 2.8% pa.
This expected growth is driven by two key macro-economic factors:
■ Construction and urbanisation in China, India and other industrialising countries, which should ensure continuing demand for building ceramics, steel, glass and foundry products.
■ The drive towards automation, pollution control and energy effi ciency, which should ensure a high demand for zirconia and zirconium chemicals.
The expected demand growth for zircon is also driven by the anticipated trend towards higher quality in ceramics, refractories and castings generally. Much of the recent Chinese and Indian industrial growth has been undertaken on a very low cost basis, and this has led, for example, to the use of lower cost and relatively low quality refractories. Manufacturers in these countries are progressively expected to turn towards higher quality inputs, a shift which should favour the use of zircon.
Overall, the most rapidly growing end uses for zircon to 2015 will remain ceramics and products which incorporate zirconia and zirconium chemicals. The demand in ceramics is expected to grow at 4-5% per annum between 2007 and 2010, and then by about
Ceramics 55%
Zr02 & Zr Chemicals 15%
Refractory 13%
Foundry 13%
TV glass 3%
Other 1%
Europe 30%
China 30%
Other Asia-Pacific 16%
North America 12%
Japan 5%
Other countries 7%
Figure A.7: Zircon End-use by Sector, 2007(e) Figure A.8: Zircon Demand by Region, 2007(e)
Source: TZMI estimate
Appendix – Mineral Sands Industry Overview

1176% pa between 2011 and 2015. For specialty materials and chemicals, the demand is forecast to grow by about 8% per annum to 2010, and then decline slightly to an annual increase of 7.5% in the 2011-15 period.
The faster rate of consumption growth in ceramics post 2011 is forecast as a result of an expected shift towards higher quality, more zircon intensive glazed ceramics being produced in the industrialising countries of Asia and the Middle East.
The slower rate of growth post 2010 in the specialty materials and chemicals sector is partly because it is occurring from a higher base and partly because the demand for zirconium-based reactive chemicals is meeting strong competition from a range of alternative organic chemicals.
In addition to these two main growth sectors, in the 2011-15 period, for the fi rst time in at least fi fteen years, it is expected that there could be a modest increase in the global demand for zircon in refractories and foundry sand.
By 2015, potential underlying zircon demand is estimated to reach 1.78 million tonnes, subject to supply being available. This demand estimate includes provision for some substitution for zircon in existing markets, such as the foundry industry, where competitive products are known to exist. More importantly, provision has also been made for further thrifting of use in some sections of the dominant ceramics market, where zircon’s proven opacifying capability is not absolutely necessary and the mineral is vulnerable to substitution.
Figure A.9 shows the historical and forecast end-use trends for zircon consumption between 1990 and 2015.
A3.3 The Importance of ChinaThe information in this Section is sourced from TZMI from a report commissioned by Iluka in January 2008.
Over the period since 1990, demand growth has been by far the strongest in China at around 15% pa. Chinese zircon demand experienced considerable growth during the early 1990s as the country established an extensive ceramic tile production capability. Zircon consumption grew from only 28,000 tonnes in 1990 to an estimated 127,000 tonnes by 1994, before plateauing for the next few years. Then the 1997/1998 Asian economic crisis had a negative infl uence on zircon offtake in China.
Continued strong Chinese economic growth and a buoyant construction sector since 1999 led to increased demand for zircon in ceramic tiles and some other markets. Zircon demand more than doubled from 140,000 tonnes to 311,000 tonnes over the six year period, 1999–2005.
In 2007, China’s estimated consumption was about 380,000 tonnes, or 30% of the global demand, and in 2008 the country is poised to surpass the long dominant Western European market to become the largest consuming region in the world. Its consumption growth is expected to continue such that, provided continued supply is available, by 2015 China’s total zircon consumption is forecast to reach about 620,000 tonnes, or nearly 35% of global demand.
China’s strongly growing importance in the global market is shown in Figure A.10, which shows regional consumption for the period 1990 to 2015.
Figure A.9: End-use Trends for Zircon Consumption Between 1990 and 2015
Source: TZMI
Ceramics
Zr02 & Zr Chemicals
Refractory
Foundry
TV glass
Other
2015201020052000199519900
500
1,000
1,500
2,000
Tonnes(’000)

118 The drivers of Chinese demand have been production of ceramics and zirconium chemicals, for direct use as chemicals or in the manufacture of chemical zirconia, and this is expected to continue into the future. As Figure A.10 shows, the demand from ceramics applications is expected to drive Chinese consumption growth between 2007 and 2015.
In the period to 2015, China is expected to surpass Western Europe in terms of zircon used in ceramics manufacture. As for zircon used in zirconia and zirconium chemicals production, China’s current global market share is over 50% although this share is expected to decline slightly over the period to 2015.
The reasons for the Chinese dominance are a combination of very strong domestic demand and low manufacturing cost. The rate of Chinese construction is expected to continue over the next ten years, with perhaps some slowing. With regard to manufacturing cost, the Chinese advantage is expected to be reduced over the next fi ve years, particularly as a result of two trends:
■ Chinese authorities will insist on higher standards of environmental and labour force protection,
■ There will be less export incentives available from the government, a factor which has given Chinese exports a major boost for nearly a decade since the inception of the incentives in the wake of the Asian crisis.
Most of China’s zircon requirements are supplied by imports. China’s internal zircon supply sources are quite limited, and are restricted to beach sand deposits on Hainan Island. The increasing popularity of the Hainan beaches as a tourist destination is limiting production from this area. So China will continue to be reliant on imports, primarily from Australia and South Africa.
In response to the zircon price rises of recent years, China has sought out supplies of zircon-rich concentrates from less developed countries. Since 2006 the major source of these concentrates has been the Indonesian province of Central Kalimantan. Concentrates from Kalimantan and elsewhere are processed at separation facilities predominantly located in the southern provinces of Hainan Island, Fujian, Guangdong and Guangxi.
A3.4 Other Developing Markets The information in this Section is sourced from TZMI from a report commissioned by Iluka in January 2008.
Apart from China, zircon demand is forecast to grow strongly in many industrialising countries, foremost among them being India, Indonesia, Turkey, Mexico and the countries of the Middle East. The Other Asia-Pacifi c region – which includes all the countries of Asia excluding China and the substantially smaller, and now static, Japanese market – is forecast to increase from 15% in 2007 to 19% of global demand in 2015. It shows that the Other Asia-Pacifi c region will be consuming about 340,000 tonnes per annum of zircon in 2015, still about 50,000 tonnes less than Chinese consumption in 2007.
The main growth engine of demand in these economies will be ceramics manufacturing, which in turn is driven by the construction sector. Some of the fastest growing ceramic production centres outside of China include Gujarat in India; Tangerang, a district of Jakarta; and Dubai, the rapidly growing commercial centre of the Arabian peninsular.
By 2015, the global centre of demand will have clearly shifted to China and, more broadly, the Asia-Pacifi c region.
Figure A.10: Regional Zircon Consumption Between 1990 and 2015
Source: TZMI
China
Other Asia-Pacific
Japan
North America
Europe
Other
201520102005200019950
500
1,000
1,500
2,000
1990
Tonnes(’000)
Appendix – Mineral Sands Industry Overview

119A3.5 Substitution of ZirconSimilar to any industrial mineral, in all of its end uses there are substitutes for zircon. In some cases, these are relatively poor substitutes, while in other cases the continuing use of zircon is price-sensitive.
In ceramic applications zircon is used for whiteness, opacity and strength. The main substitutes are alumina, high-purity clays and feldspars. The degree of substitution which can occur in ceramic applications is a function of the price of zircon opacifi er (or fl our) versus the competitive products and the required quality of the tile. Recently there has only been some thrifting of use of zircon in ceramics when zircon sand prices were in a range of US$800–850/t free on board.
In foundry applications, substitutes may be chromite, alumina-silicates and silica sand. However, these are genuine substitutes for the casting of poorer quality components and foundry applications are considered a relatively secure market for zircon. Likewise, zircon based refractories are now used only in specialist components of glass and steel refractories and these applications are considered a relatively secure market for zircon. In zirconium chemicals, there is competition from other organic and inorganic chemical substitutes. This application would be considered a price sensitive market for zircon.
The market sector that has seen the greatest decline of zircon use in recent years has been CRT glass (TV glass). This trend has been a function of changing technology as consumers move rapidly to LCD and PDP screens, which require much less zircon per square metre, than the traditional CRT screens.
A3.6 Historical Zircon PricesTZMI historical zircon prices (in nominal US$/t FOB terms) from 1970 to 2007 are shown in Figure A.11. The volatility of zircon prices, coupled with periods of price spikes, is evident. The main events infl uencing pricing over this period of time were:
■ strong demand from Japan, followed by substitution in foundries and additional supply (Eneabba, Mid West, Western Australia and Richard’s Bay Minerals, South Africa);
■ strong demand coupled with production capacity constraints, followed by substitution in refractories;
■ higher growth from ceramics and Asia regions, followed by softening demand after the Asia crisis of 1997; and
■ a period of strong demand (particularly China) coupled with supply capacity constraints and longer term pricing.
A3.7 Iluka’s Interpretation of Pricing Trends in ZirconAs with the titanium dioxide products, Iluka has analysed the long term pricing trends for zircon based on information sourced from TZMI. As with titanium dioxide products, the price CAGR varies, although often more so for zircon, depending on the time horizon selected. From the commencement of TZMI data in 1970 to 2007, the annual average price increase for zircon has been 8.3%. This time horizon is infl uenced by the high in the zircon cycle currently being experienced and by what appears to be a low in zircon pricing in the early 1970s. Based on Iluka’s assessment that the period 2004–2005 was the last “balanced” supply/demand position in the zircon market, Iluka has calculated the CAGR to provide a trend line roughly midway through the price peaks of the 1970s, 1980s, 1990s and 2007. This exercise produces a nominal CAGR of 4.5% for historical zircon prices.
Figure A.11: Historical Zircon Sand – Nominal FOB Prices
Source: TZMI
0
100
200
300
400
500
600
700
800
US$/tonne
— Nominal
2004 200720011992 1995 19981989198619831980197719741971

120 Iluka does not publicly provide future pricing outcomes for its products. In 2007, zircon prices were at high levels compared to pricing over the previous fi ve years. The increases in the price of zircon have principally been the result of constricted supply and increased demand from China, where the rapid growth of the Chinese ceramic and zirconium chemicals sectors has seen China emerge as the single most important country for zircon consumption in recent years. The supply/demand outlook for zircon indicates the potential for oversupply in the medium term (2008 to 2010) and this could place pressure on the price of zircon. Refer to Section 6.2.6 for a description of certain risks associated with the global supply of mineral sands projects.
A4 General Comments in Relation to SupplyThe existing global capacity of mineral sands production is not expected to be able to meet the forecast growth in demand for both titanium dioxide feedstocks and zircon. Furthermore, it is known that the production output of some existing operations, including Iluka’s existing operations, will decline or cease over the course of the next fi ve years. As a result, existing operations will need to expand and new projects will need to come on-stream if global supply is to meet the expected growth in demand.
While there are a large number of mineral sands projects under active investigation around the world, it is uncertain as to how many of these projects will come on-stream or if they do, when they will commence production. The history of project development within the mineral sands industry demonstrates that projects generally take longer to bring on-stream and that after commissioning, projects take longer to ramp-up to capacity than anticipated. There have also been a number of project failures in the recent past, notably BHP Billiton’s Beenup project in Western Australia, Murray Basin Titanium’s Wemen Project in Victoria, and Western Garnet’s ilmenite project in India.
Supply forecasts have tended to be optimistic compared to actual production output in recent years and the expected oversupply scenarios have not materialised. This is most relevant for titanium dioxide feedstock production, which has consistently been overestimated for the last four years on the expectation of new production capacity coming on-stream as planned.
In contrast, the unexpected increase of zircon output from numerous artesian mines in Kalimantan during 2006 and 2007 was a surprise to many in the industry and has had a signifi cant impact on the supply/demand balance of zircon over this period. Output from this region reached a peak of around 15,000 tonnes per month of semi-processed zircon concentrate in mid 2007, but has subsequently dropped back to an average of 7,500 tonnes per month of concentrate in the last quarter of 2007. It is uncertain the level at which this output will stabilise going forward.
In summary, the supply/demand balances for titanium dioxide feedstocks and zircon are diffi cult to forecast, as they rely heavily on the timing and success of new projects coming on-stream. They are also dependent on the mineral assemblages of those projects that are successful, and these range widely between different projects.
Refer to Section 6.2.6 for a description of certain risks associated with the global supply of mineral sands products.
A5 Mineral Sands Technical InformationA5.1 MiningTypically the mineral sands industry uses two main mining methods, and while there are other methods, these are the most common ones utilised:
■ Suction dredging – a fl oating dredge removes the ore from the bottom of an artifi cial pond through a large suction pipe. The bulk sand material is fed as slurry through a primary, or “wet”, concentrator that is typically towed behind the dredge unit. The dredge slowly advances across the pond and deposits clean sand tailings behind the pond for subsequent revegetation and rehabilitation. Because of the capital cost involved in manufacture and location this method is most suitable for large long life deposits, often of a lower grade.
■ Open pit mining or dry mining – this method tends to be used on higher-grade mineral deposits containing moderately hard material or layers. Typical equipment used are scrapers, bulldozers, excavators or trucks. When utilising scrapers they mine the ore from the top of the face to the bottom as well as progressively mining across the whole face to provide a more consistent grade of material to the concentrator. Stockpiles are also used to achieve a constant blend.
Ore mined is screened at the mine and oversize material and rock are rejected. Ore is then transported to a wet concentrator for further screening to remove remaining oversize material. Screening methods used include a combination of fi xed or vibrating, grizzly, vibrating screens, drum scrubbers and trommels.
A5.2 Wet ConcentrationScreened ore is slurried with water and pumped to a wet concentrator where any of the fi ne clay particles are removed, using hydrocylones. Any clay removed is mixed with fl occulent, thickened, remixed with sand residue and pumped back to the open pit mine.
The underfl ow from the hydrocylones containing the valuable Heavy Minerals is fed, via a constant density tank, to a spiral circuit where separation of HM from the sand occurs through gravity separation. Light materials consist of silicates and feldspars. Heavier economic minerals consist of rutile, ilmenite, leucoxene, zircon, garnet, and iron rich minerals.
Appendix – Mineral Sands Industry Overview
121HM concentration is increased by further spiral stages with the middlings usually re-concentrated and tailings scavenged to recover any residual Heavy Minerals. Residue from the concentration process is pumped back to the open pits for rehabilitation.
Following the wet concentrator phase, the Heavy Mineral Concentrate (HMC) may undergo an attritioning phase which cleans the mineral surfaces. This process typically aids the additional stages of HM separation that occur during the dry separation phase. At this stage, further classifi cation is conducted which can upgrade the HM content of the concentrate to above approximately 90%.
HMC is then stockpiled on site before being transported to the secondary concentrator or dry separation plant.
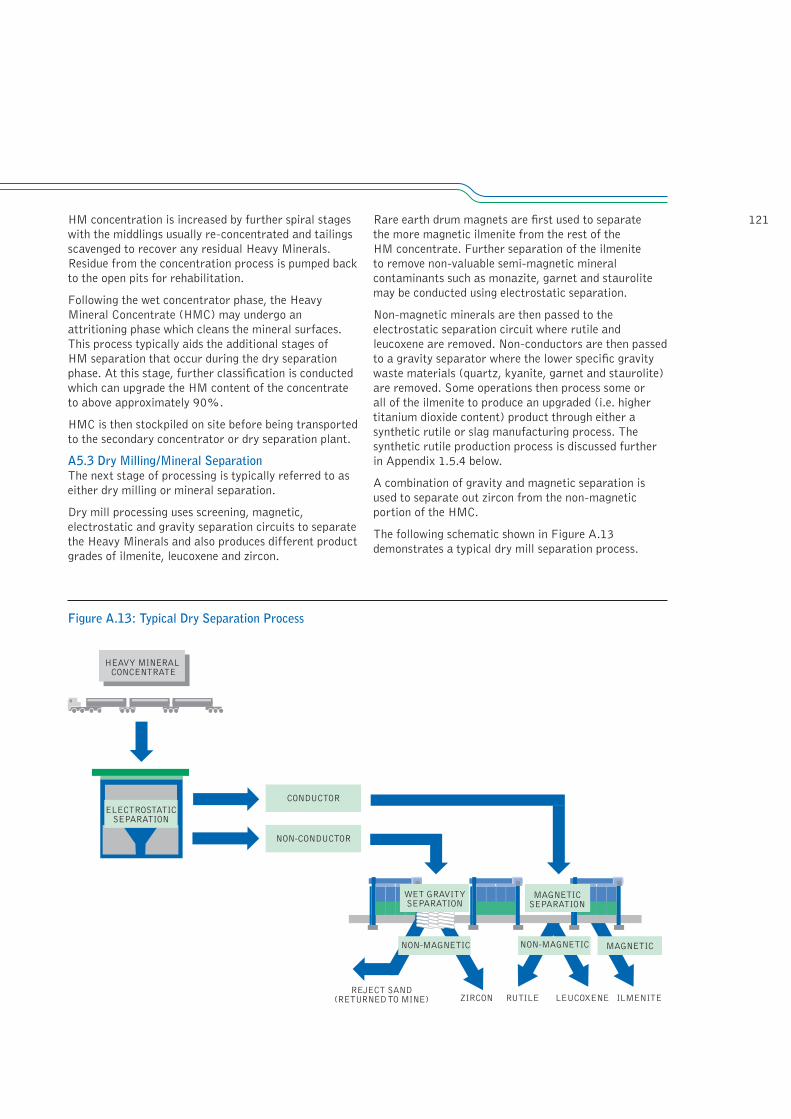
A5.3 Dry Milling/Mineral SeparationThe next stage of processing is typically referred to as either dry milling or mineral separation.
Dry mill processing uses screening, magnetic, electrostatic and gravity separation circuits to separate the Heavy Minerals and also produces different product grades of ilmenite, leucoxene and zircon.
Rare earth drum magnets are fi rst used to separate the more magnetic ilmenite from the rest of the HM concentrate. Further separation of the ilmenite to remove non-valuable semi-magnetic mineral contaminants such as monazite, garnet and staurolite may be conducted using electrostatic separation.
Non-magnetic minerals are then passed to the electrostatic separation circuit where rutile and leucoxene are removed. Non-conductors are then passed to a gravity separator where the lower specifi c gravity waste materials (quartz, kyanite, garnet and staurolite) are removed. Some operations then process some or all of the ilmenite to produce an upgraded (i.e. higher titanium dioxide content) product through either a synthetic rutile or slag manufacturing process. The synthetic rutile production process is discussed further in Appendix 1.5.4 below.
A combination of gravity and magnetic separation is used to separate out zircon from the non-magnetic portion of the HMC.
The following schematic shown in Figure A.13 demonstrates a typical dry mill separation process.
Figure A.13: Typical Dry Separation Process
ELECTROSTATICSEPARATION
NON-CONDUCTOR
CONDUCTOR
MAGNETICSEPARATION
NON-MAGNETIC
REJECT SAND(RETURNED TO MINE) ZIRCON RUTILE LEUCOXENE ILMENITE
NON-MAGNETIC MAGNETIC
WET GRAVITYSEPARATION
HEAVY MINERAL CONCENTRATE

122 A5.4 Synthetic Rutile ProductionSynthetic rutile is manufactured using ilmenite feed to create an upgraded titanium dioxide product. Iluka is the world’s largest producer of synthetic rutile, accounting for approximately 66% of global production in 2007.1
Synthetic rutile or upgraded ilmenite, is a chemically modifi ed ilmenite that has had most of the ferrous, non-titanium components removed and is suitable for use in the chloride pigment process. Its composition is between 88% and 95% titanium dioxide.
Ilmenite is converted to synthetic rutile in a two stage pyrometallurgical and chemical process (known as the Becher Process):
■ The fi rst pyrometallurgical stage involves heating ilmenite for 8–12 hours at 1,150 degrees Celsius in a large rotary kiln. The kilns are typically 60 to 90 metres in length and 4.6 to 5.1 metres in diameter. Coal is used as a heat source and when burned in a limited air environment it produces carbon monoxide, which promotes a reducing environment that converts the iron oxide contained in the ilmenite to metallic iron. The intermediate product, called reduced ilmenite, is a highly magnetic sand grain, due to the presence of the metallic iron.
■ The second stage involves the conversion of reduced ilmenite to synthetic rutile by removing the metallic iron from the reduced ilmenite grain. This is achieved through aeration (oxidation), accelerated through the use of ammonium chloride as a catalyst, and acid leaching of the iron to dissolve it out of the reduced ilmenite.
A typical production process for synthetic rutile has been represented in Figure A.14.
Figure A.14: Typical Synthetic Rutile Production Process
DILUTE AMMONIUMCHLORIDE SOLUTION
CHAR
ILMENITE
COAL
CHAR &REDUCED ILMENITE
SEPARATION
REDUCED ILMENITE
DRYER
WASTEMANAGEMENTPLANT
NEUTRALISEDAND PUGGED
WASTE
RETURNED TO MINE
AIRAERATION
HYDROCYCLONINGAND ACIDLEACH
SYNTHETIC RUTILETRANSPORTED TO PIGMENT PLANT
EXPORT
KILN
Note:
1. Iluka, 2007 estimates. Includes 100% of CRL output, which Iluka markets on CRL’s behalf.
Appendix – Mineral Sands Industry Overview