illustrative flow visualization: state of the art, trends ... · illustrative flow visualization:...
TRANSCRIPT

EUROGRAPHICS 2012/ M.-P. Cani, F. Ganovelli STAR – State of The Art Report
Illustrative Flow Visualization: State of the Art, Trends andChallenges
Andrea Brambilla1, Robert Carnecky2, Ronald Peikert2, Ivan Viola1, Helwig Hauser1
1 University of Bergen, Norwaywww.ii.uib.no/vis
2 ETH Zurich, Switzerlandwww.scivis.ethz.ch
AbstractFlow visualization is a well established branch of scientific visualization and it currently represents an invaluableresource to many fields, like automotive design, meteorology and medical imaging. Thanks to the capabilities ofmodern hardware, flow datasets are increasing in size and complexity, and traditional flow visualization techniquesneed to be updated and improved in order to deal with the upcoming challenges. A fairly recent trend to enhancethe expressiveness of scientific visualization is to produce depictions of physical phenomena taking inspirationfrom traditional handcrafted illustrations: this approach is known as illustrative visualization, and it is getting afoothold in flow visualization as well.In this state of the art report we give an overview of the existing illustrative techniques for flow visualization,we highlight which problems have been solved and which issues still need further investigation, and, finally, weprovide remarks and insights on the current trends in illustrative flow visualization.
Categories and Subject Descriptors (according to ACM CCS): I.3.6 [Computer Graphics]: Methodology andTechniques—I.3.8 [Computer Graphics]: Applications—
1. Introduction
Van Dyke’s book [VD82] from 1982 begins with the follow-ing statement: “We who work in fluid mechanics are fortu-nate [. . . ] that our subject is easily visualized”. This is indeedreflected by the many years of successful research in flowvisualization: with the help of visualization techniques, flowphenomena have been deeply studied and many unclear as-pects of their behaviour have been explained. Over the years,this continuous investigation process have produced a con-siderable amount of knowledge and, in the meantime, thecomputational power of the hardware has been growing ex-ponentially. Nowadays we are able to produce, through mea-surements or simulations, extremely faithful and high qual-ity flow datasets, which are usually very dense, multidimen-sional and multivariate. It is, therefore, almost impossible toget any insight out of them without the help of automatic orsemi-automatic tools.
The analysis/postprocessing phase can be more or lesscomplex and, based on several years of expertise and re-search in visualization, we propose to describe it through the
data abstraction pyramid metaphor, in Figure 1. At the low-est level, an acquisition step produces the so called raw data,which is an initial representation of the phenomenon of in-terest. At this point different processing steps can be taken:gradients and local properties can be computed in order toenrich the data, a domain-specific model can help identifyingrelevant feature, and so on. After every step a more abstractrepresentation of the underlying phenomenon is obtained.The purpose of visualization techniques is to take data ata certain abstraction level and show it in a way that allowusers to gain insights out of it.
Traditional flow visualization techniques have been quiteeffective in making flow data understandable, but theystruggle to deal with the increased complexity of themost recent datasets. A novel category of visualizationapproaches, that has already been successful in medical[SES05, VKG05, TSS∗06] and other visualization subfields[WBE∗06, HBP∗07, PGT∗08], is illustrative visualization.This discipline aims at visualizing the data in a clear andunderstandable way through the use of techniques from tra-
c© The Eurographics Association 2012.
DOI: 10.2312/conf/EG2012/stars/075-094

A. Brambilla et al. / Illustrative Flow Visualization
abstraction methods
abst
ract
ion
leve
ls
acquisition raw data
data amount
data enhancement data markups
model mapping domain objects
intent specification importance mapping
interpretation findings
wisdom
Figure 1: The data abstraction pyramid.
ditional handcrafted illustrations. Illustrative visualizationtechniques explicitly address issues like cluttering, occlusionand depth perception, which are typical for flow visualiza-tion as well. Exploiting illustrative approaches in this fieldallows for quick exploration and in-depth analysis of denseflow datasets, consequently producing a significant amountof knowledge which would be otherwise unattainable.
The rest of the paper is organized as follows: briefoverviews of the basics and most common approaches inboth flow and illustrative visualization are given in Section2 and Section 3, respectively. Section 4 is dedicated to theclassification and description of currently existing illus-trative flow visualization approaches, and, finally, Section5 summarizes the present state of the art and suggestsdirections for possible future developments.
Contributions
Illustrative flow visualization is a newborn discipline and, assuch, it still lacks of a formal structural organization and welldefined boundaries. In light of this consideration, the maincontributions and novelties of this STAR can be summarizedas follows:
• For the first time illustrative flow visualization is thor-oughly analysed and formally organised.
• We propose a user-centric classification of the techniquesin this field, in order to help application experts (our users)to choose the ones that best suit their needs.
• In the context of this classification, we review the existingapproaches and the most recent developments in the field.
• We give an overview of illustrative visualization focusedon showing the advantages of this category of techniquesover traditional visualization.
2. Traditional flow visualization
The term flow denotes an abstract concept adopted in manyapplication fields. Fluid dynamics, for instance, is concerned
with the study of fluid flows, i.e. the motion of fluids: typicalexamples include the motion of water in a pump or a turbine,the stream of air around a car or an airplane, blood in a ves-sel, oil or gas in a pipe, and so on. However, the concept offlow is much broader and different definitions arise in everyarea of application, such as physics or mathematics. Flowvisualization usually deals with data generated via measure-ments, simulations or modeling, and the results are com-monly expressed as vector fields. In the following, the formalmathematical background is discussed, then an overview offlow visualization is presented, focusing on what are the ex-isting techniques, how they can be classified, and which arethe pressing challenges.
2.1. Flow and vector fields
Firstly it is worth pointing out that the mathematical theoriesbehind flows and vector fields are extensive and beyond thescope of this paper, here only a brief overview is given; fora more detailed introduction on the subject, the reader canrefer to Asimov’s tutorial from 1993 [Asi93].
Given a dense set of massless particles i = 0,1,2, . . . mov-ing in the spatial domain Ω ⊆ Rn, an n-dimensional steadyflow v is typically described with a differential equation ofthe particles locations xi ∈Ω with respect to the time t ∈ R:
dxi(t)dt
= v(xi(t)) (1)
In other words, a steady flow is associated with a vector fieldthat describes the instantaneous velocities of the particlesmoving in the Euclidean space Rn:
v : Ω→ Rn (2)
The term steady means that the velocity vectors are con-stant over time; in contrast an unsteady vector field is time-dependent and is defined as:
v : Ω×R→ Rn (3)
The related differential equation describing the motion of theparticles is
dxi(t)dt
= v(xi(t), t) (4)
The differential equations 1 and 4 are solved via integra-tion. In particular, a streamline is obtained by integration ona steady vector field and it represents the path of a particlein the steady flow; a pathline is the equivalent for unsteadyflows. There are two other types of commonly used curvesobtained through integration: a streakline is the imaginaryline created by particles continuously seeded at a certain po-sition, and it is closely related to the physical experimentof releasing dye into a fluid. A timeline instead is obtainedby integrating a set of particles simultaneously released inthe flow along a certain line or curve. Stream-, path-, streak-and timelines are commonly known as integral lines (or inte-gral curves), and they can be extended to higher dimension
c© The Eurographics Association 2012.
76

A. Brambilla et al. / Illustrative Flow Visualization
(-surfaces, -volumes). In the following, integral lines, inte-gral surfaces and integral volumes are referred to as integralstructures.
Vector fields and integral structures are both well definedconcepts but their expressiveness is limited; essentially, theresulting visualizations may be not able to fully representcertain relevant aspects of the flow behaviour. The most re-current strategy to address this issue is to look for objectsof particular interest in the vector field, the so called flowfeatures. In accordance with the state of the art report onfeature-based flow visualization by Post et al. [PVH∗03], themost common types of flow features include:
Vortices: areas associated with swirling motion, they are al-most ubiquitous in flows and are of vital importance inmany applications. The main problem is that a formal,well accepted definition of vortex has yet to be found.
Vector field topology (VFT): obtained by integrating se-lected streamlines close to critical points (i.e. points p ∈Rn where v(p) = 0), usually referred to as separatrices.They partition the vector field in areas that asymptoti-cally show coherent behavior. VFT is very effective for2D steady flows, but its extension to 3D is problematicbecause of cluttering and occlusion issues. More detailson this subject can be found in the works of Helman andHesselink [HH89, HH91] or in the survey from Larameeet al. [LHZP07].
Lagrangian Coherent Structures (LCS): from a concep-tual point of view, they are an attempt to extend VFTto unsteady flows. A formal definition has not yet beengiven and the research on this subtopic is very active.Useful information can be found in related literature[Hal01, SLM05, PPF∗11].
Shock waves: typical of flows around aircraft, they arecharacterized by sharp discontinuities in physical flow at-tributes. A straightforward way to detect them is to lookfor edges in scalar quantities such as pressure, density orvelocity magnitude.
Separation and attachment lines: only present in con-junction with solid bodies or boundaries, these are thecurves where the flow abruptly moves away (separation)or towards (attachment) the surface of the solid object.
2.2. Vector field discretization
Focusing now on a more practical topic, flow visualizationapproaches have to take into account a specific issue: dataobtained from simulations or measurements is almost nevergiven in analytic form, but sampled at specific locations inthe spatial and temporal domain. The set of sampling pointsis usually topologically organized according to a more orless structured grid (also called mesh), ranging from Carte-sian to curvilinear, or even to completely unstructured grids.
Even assuming that the Nyquist frequency condition isfulfilled, a series of problems arises: for example, point lo-
cation, i.e. determining the grid cell which contains a cer-tain point, is not trivial, especially for unstructured grids.Special data structures are often employed in order to speedup the search. Moreover, since the vector field is sampledonly at specific points, there is also the need for a recon-struction strategy to determine flow attributes at generic lo-cations of the domain. Reconstruction algorithms heavilydepend on the cell shape and are usually based on linearor higher order interpolation techniques. The reconstruc-tion problem can also cause collateral effects on the com-putation of derivatives and integral structures, therefore spe-cial attention is often needed when designing these algo-rithms. A more detailed overview of sampling grids andrelated issues can be found in previous state of the art re-ports [PVH∗02, LHD∗04].
For the sake of completeness, it is worth mentioning that,even though sampling grids are widely used, other types ofrepresentations exist, like particle-based or functional repre-sentations, and each one has its own set of related challenges.
2.3. Flow visualization techniques
One of the first attempts to formally classify and summa-rize decades of work in flow visualization has been proposedby Hesselink, Post and van Wijk in 1994 [HPvW94]: theysuggest to differentiate existing approaches according to thetype of data (scalar, vector, tensor), the dimensionality of thedomain (point, line, surface, volume) and the “informationlevel”, i.e. if the displayed data is either raw (elementary),derived from a small neighbourhood (local), or dependenton the entire dataset (global). The first two criteria are stillwidespread nowadays, with the second one now taking intoaccount the temporal dimension as well, and they are oftencombined with other classification directives.
In 2002, Post et al. [PVH∗02] proposed one of the mostwidely accepted categorizations of flow visualization tech-niques:
Direct Visualization: the data is directly mapped to a vi-sual representation, without complex conversions or ex-traction steps. Arrow glyphs, color coding and volumerendering are the core of this category.
Texture-based Visualization: a dense representation of theflow is obtained using local flow attributes to create and/orwarp a noise texture; more details on this topic can befound in [SMM00] and [LHD∗04].
Geometric Visualization: in order to better convey flowdynamics, integral structures are used as a basis for thegraphical representation; a recent survey by McLoughlinet al. [MLP∗10] thoroughly describes this category of ap-proaches.
Feature-based Visualization: a sparse visualization is ob-tained focusing only on the most significant areas of thevector field; a comprehensive survey on features extrac-tion and related visualization techniques has been pre-sented in 2003 by Post et al. [PVH∗03].
c© The Eurographics Association 2012.
77

A. Brambilla et al. / Illustrative Flow Visualization
More recently, Salzbrunn et al. [SJWS08] propose to add anew category, i.e. Partition-based Visualization, which in-cludes all those approaches aimed at effectively partitioningthe spatial and temporal domain according to flow proper-ties.
For reasons that will become clear in Section 4 we do notfully adopt this classification, but we adjust it in order to bet-ter reflect the data abstraction scheme previously introducedthrough the pyramid metaphor.
2.4. Challenges in flow visualization
Flow visualization has been an active research field for manyyears now and satisfactory solutions have been found formany problems, like the direct or texture-based visualizationof 2D steady flows. However, a lot of questions still have tobe answered. This topic is extensively discussed in the sur-vey by McLoughlin et al. [MLP∗10], here we provide a justshort list of selected challenges.
Already at the raw data level interesting research oppor-tunities can be found: first of all, the generation of a dataset,through simulations or measurements, can take days andgenerate terabytes of data; in contrast, the visualization pro-cess has to be possibly interactive and, since disk access isa time-consuming operation, it can only rely on a few giga-bytes of main memory.
Furthermore, data is usually defined according to a cer-tain grid, as mentioned before, and the type of the grid has asignificant impact on the visualization as well: for instance,raycasting through a Cartesian grid is straightforward, butit becomes progressively more complex with less structuredgrids. In general, approaches designed for a certain type ofgrid structure are not guaranteed to work well with morecomplex ones, at least not at the same frame rate.
From a visualization-related point of view, one of the mostdifficult challenges is associated with three-dimensionaldatasets: vector fields are usually very densely sampled,therefore cluttering and occlusion are almost ubiquitous. In3D, integral structures and certain flow features, like LCS,often present twists, folds and self intersections, which makedepth and shape perception very difficult.
Adding the temporal dimension makes the situation evenmore complicated: animation is the traditional tool to depicttime-dependent information, but it can only depict one in-stant at a time, the temporal context is limited; on the otherhand, pathlines and streaklines can be used to show the tra-jectory of one or more particles, but the global flow behaviorcannot be effectively conveyed. In the next section we dis-cuss how illustrative visual abstractions can be used to solvesome of these open issues.
3. The illustrative paradigm
Illustrative visualization is an emerging branch of the visual-ization research field that focuses on interactive and expres-sive visualizations typically inspired by works from artistsand illustrators [RBGV08]. Its main goal is maximizing theamount of information effectively conveyed utilizing visualabstraction techniques.
In traditional craft, the illustrator employs drawing stylessuch as pencil, brush, or watercolor styles; in illustrative vi-sualization, algorithms that are concerned with visual stylesare referred to as low-level visual abstractions [VGH∗05].Line drawings techniques, contours or silhouettes [IFH∗03],and handcrafted shading, such as stippling, hatching, or toonshading [GGSC98], provide enhanced shape, depth and di-rectional cues in order to improve the perceptual effective-ness of the results. Low-level visual abstractions, such asthose mentioned above, define how to depict a certain struc-ture and have been the primary focus of non-photorealisticrendering (NPR).
When dealing with large and dense amounts of data, il-lustrators work with expressive techniques that change thelayout or deform features to increase the communicative in-tent of the illustration; these approaches are commonly re-ferred to as high-level visual abstractions. Selective visual-ization, cutaways, close-ups, or exploded views are exam-ples of illustrative concepts that can be simulated with com-puterized techniques with different purposes in mind. In par-ticular, visibility management (also known as smart visibil-ity) techniques [VG05, ET08] are aimed at improving theoverall visibility of the data through an optimal use of thevisual space. In contrast, focus emphasis (or focus+context)approaches [Hau03, VKG05] acknowledge that portions ofthe data are deemed more important than others. The focus,i.e. the relevant part of the dataset, has to be visually empha-sized, while less important information should be used toprovide the context. The mapping between domain knowl-edge and visual appearance is expressed by an importancemeasure.
Closely related to high-level visual abstractions, areguided visualization [KBKG07,VFSG06] and interactive vi-sual storytelling techniques [WH07, MLF∗12]. The formerguides the viewer’s attention to the relevant structures bycomputing informative viewpoints and camera paths for re-focusing from one object of interest to another. Interactivestorytelling enables the user to set up a story related to a phe-nomenon of interest by setting up story-nodes and transitionsbetween them. All the aspects of the story, from the render-ing style to the camera parameters, can be interactively mod-ified, so every user can adapt the narrative process to his orher own needs on the fly. Both these categories of approachesshare the common goal of providing an effective visual de-scription of the phenomenon of interest, therefore we referto them as visual explanation techniques.
Notice that different amounts of domain knowledge are
c© The Eurographics Association 2012.
78

A. Brambilla et al. / Illustrative Flow Visualization
(a) (b)
Figure 2: (a) Hand-drawn illustration of water flow behindan obstacle by Leonardo da Vinci [dV09]. (b) Depiction ofa dynamical system with stream arrows (image courtesy ofAbraham and Shaw [AS82] c©1982 Addison-Wesley) .
needed in every category in order to achieve expressive vi-sualizations: this property is nicely aligned with the idea ofknowledge and information-assisted visualization expressedby Chen et al. [CEH∗09]. Table 1 summarizes the illustrativevisualization categories just introduced, emphasizing whatare their strong points with respect to traditional visualiza-tion, and what kind of knowledge about the data they takeinto account. For more details about illustrative visualiza-tion and a review of the best known techniques, the readercan refer to [VGH∗05, SEV∗08].
Before proceeding to the next section, we would like tospend a few words about interactivity: besides solving oc-clusion problems, interactive navigation through the spatialdomain is one of the most effective ways to perceive the lo-cation and the shape of an object. Its central role has beenalready identified 30 years ago [HS89], and it is still oneof the most sought after features of a visualization system.Even though expressiveness is frequently much more dis-cussed, illustrative visualization heavily relies on interactiv-ity as well.
4. Illustrative Flow Visualization
The idea of using illustrations to depict and investigate flowbehavior is not new, on the contrary, it has been around formore or less 500 years: Figure 2a is an illustration fromLeonardo da Vinci (1452-1519) showing the motion of wa-ter behind a solid obstacle. More recently (1982), Abrahamand Shaw extensively used hand-drawn pictures to visualizeflow structures in their book [AS82] (see Figure 2b). Neitherda Vinci nor Abraham and Shaw had access to fancy graph-ics hardware, but they were still able to effectively conveyrelevant flow information; so, how did they do it?
Analyzing their pictures, some of the concepts introducedin the previous section can be easily recognised: hatchingand stippling are used to improve depth perception, onlyportions of the data are shown so that cluttering is avoided,
cut-aways and clip planes effectively improve visibility andreduce occlusions. Nowadays the quality and the amount ofavailable computational resources are respectively better andlarger than 30 (or 500) years ago, but those concepts andguidelines are still the key to produce intuitive, effective andaesthetically pleasing visualizations.
4.1. A user-centric classification
Being at the crossroad of two disciplines, it seems naturalto classify illustrative flow visualization techniques accord-ing to two different characteristics, one from the flow andone from the illustrative domain. While designing this cate-gorization we have taken into account the following guide-lines:
1. the two classification criteria should be as independent aspossible;
2. the advantages of using illustrative visualization, as com-pared to more traditional visualization, should be clearlyemphasized;
3. the classification should help a potential user (with pos-sibly limited knowledge of visualization) to find whichtechniques suit his/her needs best.
Regarding the flow perspective, we realized that the tradi-tional subdivision into direct, texture-based, geometric andfeature-based visualization is not optimal since, even thoughperfectly clear to a visualization expert, it does not well re-flect the point of view of a user. Doctors, engineers and mete-orologists need a clear depiction of some specific aspects ofthe data, the visual tools employed are only partially relevantto them. On the other hand, they are usually well aware ofwhat kind of data they are dealing with and which process-ing steps are meaningful for their applications, therefore wepropose a slightly different classification based on what arethe domain objects the user wants to see in a visualization:
Raw data refers to the original data produced by simula-tions or measurements (such as velocity or pressure), to-gether with the information directly derivable from it (likecurl or gradients); this kind of data is usually defined at thevertices or cells of the sampling grid and it can be easilyvisualized, for instance, via volume rendering or glyphs.
Integral structures are well known concepts in the flowcommunity and are extensively used to investigate flowbehavior; they are usually displayed as linear structures(lines, tubes, ribbons) or surfaces.
Flow features are subsets of the data perceived as partic-ularly relevant by the user; according to the specific ap-plication domain different definitions arise and differentvisualization techniques are used.
These categories on the flow axis go along very well withthe illustrative visual abstraction levels presented in Section3: there is no mutual dependency between the two classifi-cations, and the user, in order to satisfy his or her visualiza-tion needs, has just to answer the questions “what flow rep-resentation do I want to refer to?” and “what visualization
c© The Eurographics Association 2012.
79

A. Brambilla et al. / Illustrative Flow Visualization
Visual Abstraction Advantages over traditional visualization Knowledge about the data
Perceptual Enhancement Depth and/or shape perception is enhanced, localproperties of the data are effectively conveyed
No domain knowledge about the data isusually taken into account
Visibility Management Occlusion and cluttering are reduced, the expres-siveness of the visual space is maximized
The data reflects the inherent complex-ity of the phenomenon of interest
Focus Emphasis The data aspects in focus are always clearly visi-ble, well depicted and not occluded by the context
A portion of the data (the focus) isdeemed more important than the rest
Visual Explanation A description of the phenomenon is presented tothe user according to his or her needs
A domain-specific semantic is associ-ated with the data
Table 1: The illustrative visual abstraction categories, with their advantages over traditional visualization and the kind of knowl-edge about the data they take into account.
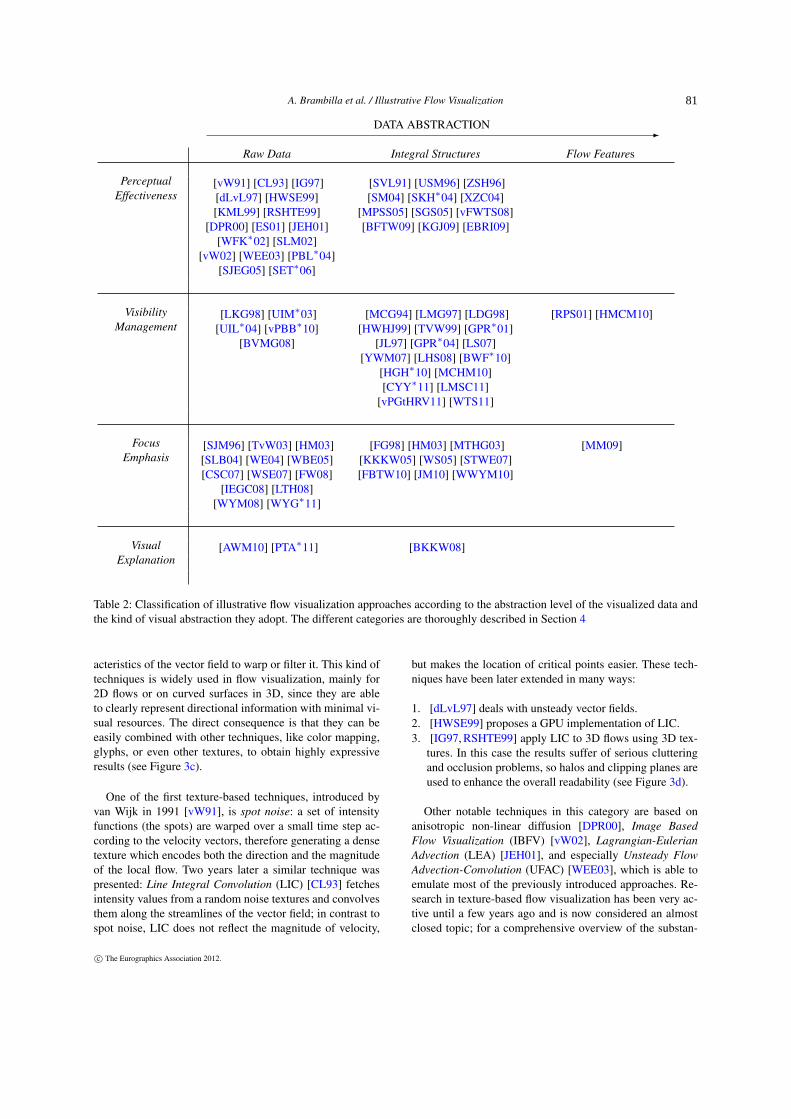
enhancement do I need?”. Table 2 summarizes this classifi-cation and presents a possible categorization of existing il-lustrative flow visualization techniques according to the twocriteria just introduced.
We would like to point out that there is also an alternativeinterpretation to our classification: the flow axis can be seenas the amount of processing that the data has been undergo-ing, while the illustrative categories relate to the amount ofknowledge about the data taken into account during the vi-sualization process. These are the same concepts mentionedbefore regarding, respectively, the abstraction pyramid (seeSection 1) and the knowledge and information-assisted visu-alization (see Section 3).
4.2. Perceptual Effectiveness
This subsection gives an overview of the approaches focusedon improving the perception of the flow data through the useof depth, shape and directional cues. This necessity has beenidentified in flow visualization a long time ago, here we re-view those approaches that clearly show some illustrative as-pect, even though they have been proposed before illustrativevisualization was formally introduced.
4.2.1. Improving perception of raw data
The techniques in this category are mostly based onwell known visualization concepts, like directional glyphs(hedgehog), transfer functions or texture advection. Themapping between the data and its visual counterpart is usu-ally very tight, and it typically leads to very dense represen-tations of the dataset. For example, the approach proposedin [KML99] is built on a direct correspondence betweenflow properties and visual resources: Figure 3a has been ob-tained by mapping velocity direction and magnitude to di-rection and size of arrows, while colors represent the vor-ticity and ellipses represent strain, divergence and shear. A
similar idea has been adopted in the work of Ebert and Shawin 2001 [ES01], where arrows and superquadric shapes areused to convey flow properties in a three-dimensional im-mersive environment. Notice that these techniques essen-tially differ from the traditional (non-illustrative) arrow plot-ting techniques since particular attention is posed on the ex-pressiveness (shape, appearance, position and so on) of theglyphs.
The natural extension of color coding to 3D is volumerendering. This technique is known to generate clutteringand occlusion if used unwisely, therefore particular attentionshould be paid in the setup phase. Stompel et al. [SLM02]propose different NPR techniques for volumetric data, withthe goal of improving the readability of the results. In con-trast, Park et al. [PBL∗04] use raw and derived data as in-put of a customizable n-dimensional transfer function, al-lowing for expressive and uncluttered visualization. An in-between approach has been proposed in 2005 by Svakhine etal. [SJEG05]: only 2 variables are used to control color andtransparency, therefore the long and cumbersome fine-tuningof the transfer function needed in [PBL∗04] is avoided. Ascan be seen in Figure 3b, simple illustrative techniques, likesilhouette enhancing, are applied in order to improve the ap-pearance of the results.
This last work has also been extended to tetrahedral gridsin 2006 [SET∗06] but, since then, volume rendering of flowshasn’t attracted too much attention, probably because it isnot well suited for conveying directional information. On theother hand, volume rendering is an active research field onits own, and techniques developed for volumetric data areoften used in flow visualization to show scalar variables likepressure or temperature.
Another category of approaches aimed at effectively con-veying flow properties is texture-based visualization: the ba-sic idea is to generate a noise texture and then use local char-
c© The Eurographics Association 2012.
80
A. Brambilla et al. / Illustrative Flow Visualization
DATA ABSTRACTION-
Raw Data Integral Structures Flow Features
PerceptualEffectiveness
[vW91] [CL93] [IG97][dLvL97] [HWSE99][KML99] [RSHTE99]
[DPR00] [ES01] [JEH01][WFK∗02] [SLM02]
[vW02] [WEE03] [PBL∗04][SJEG05] [SET∗06]
[SVL91] [USM96] [ZSH96][SM04] [SKH∗04] [XZC04]
[MPSS05] [SGS05] [vFWTS08][BFTW09] [KGJ09] [EBRI09]
VisibilityManagement
[LKG98] [UIM∗03][UIL∗04] [vPBB∗10]
[BVMG08]
[MCG94] [LMG97] [LDG98][HWHJ99] [TVW99] [GPR∗01]
[JL97] [GPR∗04] [LS07][YWM07] [LHS08] [BWF∗10]
[HGH∗10] [MCHM10][CYY∗11] [LMSC11]
[vPGtHRV11] [WTS11]
[RPS01] [HMCM10]
FocusEmphasis
[SJM96] [TvW03] [HM03][SLB04] [WE04] [WBE05][CSC07] [WSE07] [FW08]
[IEGC08] [LTH08][WYM08] [WYG∗11]
[FG98] [HM03] [MTHG03][KKKW05] [WS05] [STWE07][FBTW10] [JM10] [WWYM10]
[MM09]
VisualExplanation
[AWM10] [PTA∗11] [BKKW08]
Table 2: Classification of illustrative flow visualization approaches according to the abstraction level of the visualized data andthe kind of visual abstraction they adopt. The different categories are thoroughly described in Section 4
acteristics of the vector field to warp or filter it. This kind oftechniques is widely used in flow visualization, mainly for2D flows or on curved surfaces in 3D, since they are ableto clearly represent directional information with minimal vi-sual resources. The direct consequence is that they can beeasily combined with other techniques, like color mapping,glyphs, or even other textures, to obtain highly expressiveresults (see Figure 3c).
One of the first texture-based techniques, introduced byvan Wijk in 1991 [vW91], is spot noise: a set of intensityfunctions (the spots) are warped over a small time step ac-cording to the velocity vectors, therefore generating a densetexture which encodes both the direction and the magnitudeof the local flow. Two years later a similar technique waspresented: Line Integral Convolution (LIC) [CL93] fetchesintensity values from a random noise textures and convolvesthem along the streamlines of the vector field; in contrast tospot noise, LIC does not reflect the magnitude of velocity,
but makes the location of critical points easier. These tech-niques have been later extended in many ways:
1. [dLvL97] deals with unsteady vector fields.2. [HWSE99] proposes a GPU implementation of LIC.3. [IG97, RSHTE99] apply LIC to 3D flows using 3D tex-
tures. In this case the results suffer of serious clutteringand occlusion problems, so halos and clipping planes areused to enhance the overall readability (see Figure 3d).
Other notable techniques in this category are based onanisotropic non-linear diffusion [DPR00], Image BasedFlow Visualization (IBFV) [vW02], Lagrangian-EulerianAdvection (LEA) [JEH01], and especially Unsteady FlowAdvection-Convolution (UFAC) [WEE03], which is able toemulate most of the previously introduced approaches. Re-search in texture-based flow visualization has been very ac-tive until a few years ago and is now considered an almostclosed topic; for a comprehensive overview of the substan-
c© The Eurographics Association 2012.
81

A. Brambilla et al. / Illustrative Flow Visualization
(a) (b) (c) (d)
Figure 3: (a) Visualization of multiple flow attributes: arrows represent velocity, colors represent vorticity and ellipses representstrain, divergence and shear (image courtesy of Kirby et al. [KML99] c©1999 IEEE). (b) Illustrative volume rendering of flowdata (image courtesy of Svakhine et al. [SJEG05] c©2005 IEEE). (c) Texture-based visualization with color-coding of localflow properties (image courtesy of Urness et al. [UIM∗03] c©2003 IEEE). (d) 3D-LIC of flow around a wheel, visualized withthe aid of a clipping plane (image courtesy of Rezk-Salama et al. [RSHTE99] c©1999 IEEE).
tial amount of work on this topic the reader can refer to thestate of the art report by Laramee at al. [LHD∗04].
To conclude this section, we would like to emphasize thatthe different techniques introduced up to now can also beused as “building blocks” of more comprehensive visualiza-tions: [WFK∗02], for instance, employs textures, hue andintensity to visualize 3 different flow aspects, and mix themusing partial transparency and 3D height fields.
4.2.2. Effective integral structures
Integral structures are widely used in flow visualization be-cause of their inherent ability of clearly depicting the trajec-tories of particles in the flow, a task that cannot be achievedwith raw data alone. The first attempt to improve the ex-pressive power of integral lines was the Stream Polygon[SVL91], proposed in 1991 by Schroeder et al.: an n-sidedpolygon is swept along a streamline and it is deformed ac-cording to local flow properties, like the normal or shearstrain; moreover, once the deformed polygons have beencomputed at every point of the streamline, they can be con-nected, generating a streamtube. This idea became very pop-ular and different improvements and variants have been pro-posed: notably [USM96] presents an extension to unstruc-tured grids, while [SKH∗04] describes a method similar tobillboarding aimed at speeding up the rendering. More re-cently Stoll et al. [SGS05] introduced a novel rendering al-gorithm that allows to control different properties of tube-like structures and supports effects like halos, shadows andtexturing to improve the visual appearance of the results (seeFigure 4).
Instead of dealing with geometrical structures, anotherwell known category of approaches focuses on shading tech-niques for (infinitesimally thin) lines. For example Zöckleret al. in 1996 propose a method for computing Phong il-lumination on streamlines, obtaining the so called Illumi-nated Streamlines [ZSH96]. Similar results are presented
in [MPSS05], which reviews Zöckler’s work in order to en-hance depth perception, and in [SM04], which samples thelines into an anisotropic voxel representation; the voxels arethen displayed via volume rendering, allowing for the visu-alization of whole datasets at nearly interactive rates.
A slightly different and very interesting approach hasbeen proposed by Everts et al. [EBRI09]: they display densebundles of lines with a simple pen-and-ink style (black andwhite), while depth information is effectively conveyed by asmart use of halos. In general, the main difference betweengeometric and shading approaches is that, while the formerare able to convey local properties of the flow, the latter canguarantee a denser coverage of the spatial domain.
Focusing now on 2D integral structures, it immediatelystands out that the illustrative visualization of flow surfaceshas followed a completely different path as compared to in-tegral lines. This is actually not so surprising: even a min-imal swirling motion can make an integral surface roll up,occluding itself. Moreover, in the case of pathsurfaces, selfintersections occur quite frequently. The direct consequenceis that “visibility” issues, discussed in the next section, have
Figure 4: Different visual enhancements applied to integrallines (image courtesy of Stoll et al. [SGS05] c©2005 IEEE).
c© The Eurographics Association 2012.
82
A. Brambilla et al. / Illustrative Flow Visualization
been much more investigated than “perceptual” ones. Herewe present three techniques focused on the interactive illus-trative visualization of time- and streaksurfaces.
As already stated at the end of Section 3, interaction isextremely effective in improving depth and shape percep-tion, but, due to their high computational cost, visualiz-ing time- and streaksurfaces at interactive rates has beena difficult challenge. The approach by von Funck et al.[vFWTS08] consists of a rendering technique that gives sur-faces a smoke-like appearance. Besides the visually pleas-ant look, the main advantage is that the algorithm for sur-face construction can be largely simplified, since the re-sulting artifacts are not shown by the smoke-like render-ing. In contrast, the other two approaches [BFTW09,KGJ09]explicitly review the surface construction procedure, com-puting it on the GPU and employing different optimiza-tions and workarounds. They also apply different illustrativetechniques, like transparency, silhouette enhancement andribbon-like textures, while still achieving interactive framerates.
Integral volumes were introduced in 1993 by Max et al[MBC93], but they have never received too much attention,probably because their inherent complexity is not matchedby a significant improvement of expressiveness. However, itis worth mentioning the approach by Xue et al. [XZC04],which computes streamvolumes and visually enhances themwith texture advection techniques.
4.2.3. Appearance of flow features
To our knowledge, there is no technique which explicitlyaddresses the perceptual effectiveness of flow feature visu-alizations. A possible reason could be that many kinds offeatures, like vortices or shock waves, can be mapped tosparse and easy to understand visual representations, there-fore they rarely present perceptual problems. This situationmay soon change as a consequence of the recent increasinginterest in Lagrangian Coherent Structures: LCS are typi-cally represented by very complex surfaces, which can beself-intersecting, self-occluding, or even non-manifold. Asthis kind of features will grow in popularity, we expect thatdifferent approaches will be developed in order to visualizethem in an effective way.
4.3. Visibility Management
Visibility management includes all those approaches that ex-plicitly address visibility, occlusion and cluttering issues. Itis important to point out that, at this abstraction level, onlythe visual appearance of the result is taken into account. Thefact that some portions of the data can be more relevant thanothers is discussed later, in the “Focus Emphasis” section.Notice that in this category, a particular class of illustrativetechniques can be identified, i.e. temporal implosion. Sincethis idea has been applied to all the three kinds of flow enti-ties, we discuss it in a separate subsection.
4.3.1. Raw data visibility
Raw data is usually dense and this entails different con-sequences depending on the dimensionality of the dataset.In 2D the whole data can be easily displayed on a plane,therefore visibility issues are minimal. It is however worthmentioning the Color Weaving technique by Urness et al.[UIM∗03]. In their work a texture-based visualization con-veys directional information, while multiple color mapsare used to represent different local properties of the flow.Thanks to a smart interleaving algorithm, color mixing isavoided and many attributes can be visualized at once: inFigure 3c red and blue denote areas of respectively posi-tive and negative vorticity, green represents the shear stress,while orange and magenta highlight swirling regions. Theexpressiveness of this technique has been further improvedone year later [UIL∗04], adding shading effects based oncontrast, luminance and embossing.
In 3D the situation is much more complex: the degree ofocclusion is extremely elevated and visualizing the data asa whole is, at least, highly challenging. A quite typical ap-proach is clipping portions of the dataset or showing onlysections of it. Löffelmann et al. [LKG98] apply this con-cept for the visualization of Poincaré maps, i.e. functionsdescribing the behavior of an orbit through a lower dimen-sional space, a plane in this case. They visualize a section ofthe flow with glyphs or spot noise, while the orbit-plane in-tersections are highlighted with colored dots. Another exam-ple is given in the recent work by van Pelt et al. [vPBB∗10],who use cross-sections to emphasize the direction and inten-sity of blood flow in a vessel.
In the case of raw data, visibility management hasn’t at-tracted too much attention. Taking into account some kind ofimportance measure can greatly increase the effectiveness ofthe results, therefore focus emphasis approaches are muchmore widespread for this kind of flow representation.
4.3.2. Visibility enhancement for integral structures
In this category a large number of approaches is concernedwith the optimal placement of integral lines. There are twomain issues that have to be considered:
1. too many lines would lead to cluttered results with highdegree of occlusion;
2. uniformly placing seeding points in the space does notguarantee that the lines will be uniformly distributed aswell.
The need for a seeding strategy was already identified inthe early 90ies: for example Max et al. [MCG94] suggest tovisualize particles and streamlines only close to previouslycomputed surfaces. Similarly Löffelmann et al. [LDG98]suggest to seed streamlines in the proximity of selected crit-ical points, which are usually relevant areas of the flow.
Another group of techniques try instead to partition theflow according to a specific clustering criteria, and then dis-
c© The Eurographics Association 2012.
83

A. Brambilla et al. / Illustrative Flow Visualization
Figure 5: Streamtape visualization of the solar plume datasetcompared to traditional streamlines (image courtesy of Chenet al. [CYY∗11] c©2011 Eurographics).
play one streamline (or a piece of it) for every cluster. Twoapproaches have been proposed in 1999, based on two dif-ferent ideas: Heckel et al. [HWHJ99] use a top-down clus-tering, which iteratively subdivides the domain according toan error measure. In contrast, Telea and van Wijk [TVW99]employ a bottom-up strategy, merging the two most similarclusters at every step. The former has the advantage of show-ing more information in turbulent areas, but a large numbercluster is needed to effectively represent the flow. The latter,in contrast, achieves good results with just a few clusters, butthe similarity function requires many parameters to be set.
A more advanced technique has been proposed two yearslater by Garcke et al. [GPR∗01]: they use a continuous clus-tering based on the Cahn-Hilliard model, which describesphase separation in binary alloys. The main idea is to mini-mize a specific energy function, that can be customized in or-der to control the clustering process; the resulting partitionsare nicely aligned with the flow and they can be visualizedusing either deformed particles or oriented streamline seg-ments. Griebel et al. [GPR∗04] instead define an anisotropicdiffusion tensor based on the flow direction, which, in turn,induce a strong (parallel to flow) and weak (orthogonal toflow) coupling between neighbour points. Once again theclusters are displayed using oriented curved arrows alignedwith the streamlines. More recently Yu et al. [YWM07] pro-pose a parallel approach for clustering unsteady vector fieldsin 4D, allowing for a cluster-based visualization of pathlines.
All these clustering approaches have the appreciated prop-erty of being hierarchical, therefore the density of the gen-erated integral lines can be easily controlled. However, theyhave a major downside: even though the lines are usuallynicely distributed over the domain, clustering takes into ac-count only local properties of the vector field, so there are no
guarantees that the resulting placement reflects any particu-lar flow aspect or that the visibility is effectively optimized.
Approaches exist to explicitly address the distributionand the appearance of the streamlines in the final image: anotable example for 2D flows is due to Jobard and Lefer[JL97], who describe an approach to evenly place stream-lines over the image with density specified by the user. In2008 Li et al. [LHS08] suggest to compute a distance-basedsimilarity measure, derived from information theory, to de-termine if a streamline is redundant or if it actually con-veys new relevant information. For 3D vector fields, Li andShen [LS07] propose a seeding strategy that takes into ac-count image space information in order to avoid visual clut-tering.
Three interesting approaches have been recently proposedthat also take into account the communicative power of theintegral curves they visualize; all of them are based on the in-formation theory concept of entropy, which quantify the ex-pected value of information contained in a message. Besidesthe different metrics adopted, these works share the ideaof seeding streamlines from areas with high entropy mea-sures. Usually the resulting visualization can still be clut-tered, so an additional pruning process is needed. In par-ticular, [MCHM10] use a view-dependent approach simi-lar to [LS07], while [LMSC11] evaluates also the imagespace entropy obtained via Maximum Entropy Projection.Figure 5 instead is obtained with the approach of Chen etal. [CYY∗11], which partitions the high entropy streamlinesusing a clustering technique and then visualizes only a fewcurves per cluster using the so called Streamtapes.
Figure 6: Streamsurface of the ellipsoid dataset renderedwith normal-variation transparency, grid-like texture and sil-houette enhancement (image courtesy of Hummel et al.[HGH∗10] c©2010 IEEE).
c© The Eurographics Association 2012.
84
A. Brambilla et al. / Illustrative Flow Visualization
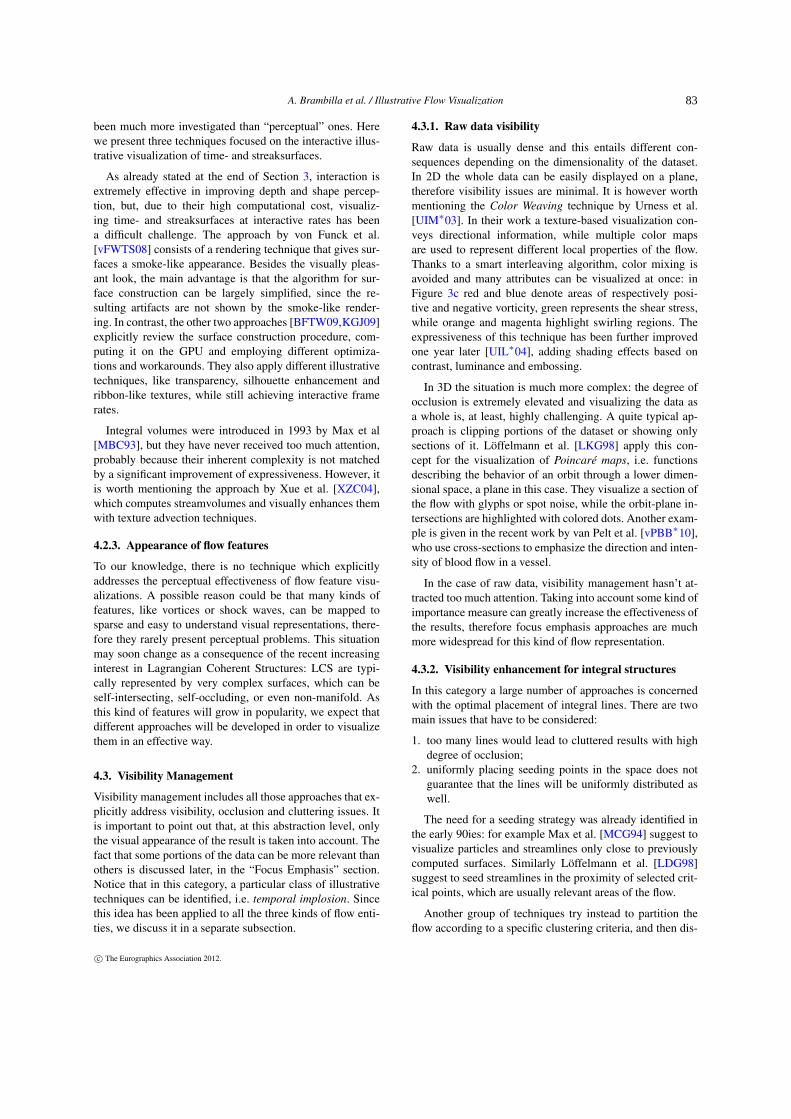
Figure 7: Side-by-side view of a smoke ring extracted from the argon bubble dataset, rendered using different styles (saturationand silhouettes) for each timestep (image courtesy of Hsu et al. [HMCM10] c©2010 Springer Berlin Heidelberg).
Line placement is currently a very active research direc-tion, but optimal visibility can be achieved in other ways aswell. For instance, Weinkauf et al. [WTS11] propose to re-move cusps and intersections created when path- and streak-lines are projected onto the viewing plane, therefore obtain-ing a clean and expressive visualization. Regarding integralsurfaces, already in 1997, Löffelmann et al. proposed thestream arrow metaphor [LMG97] in order to emulate Abra-ham and Shaw illustrations (like the streamsurface in Fig-ure 2b). More recently, two notable approaches explicitlyaddress visibility problems for streamsurfaces using differ-ent illustrative rendering techniques: Born et al. [BWF∗10]suggest to use contour lines and halftoning to enhance theoverall shape perception. Flow direction on the surface isdepicted with oriented streamlines, while movable cuts andslabs allows for an interactive exploration of the flow. Incontrast, the work of Hummel et al. [HGH∗10] proposestwo novel transparency techniques (angle-based and normal-variation) explicitly designed to expose hidden parts of thesurface. They also employ additional illustrative techniques,i.e. adaptive stripe textures and silhouette enhancement: Fig-ure 6 shows a streamsurface of a flow behind an ellipsoidobtained using a grid-like texture, normal-variation trans-parency and emphasized contours.
4.3.3. A special case: temporal implosion
Temporal implosion is an illustrative technique aimed at de-picting the temporal evolution of a certain system in a single,static image. It is extensively used, for example, in comicsand photos (via post processing) to convey the motion of anobject, and, in the last few years, it has been successfullyemployed to visualize the behaviour of dynamical systems.
In flow visualization, temporal implosion is well suited toshow the trajectory of features, like vortices or saddles: a firstapproach was proposed in 2001 by Reinders et al. [RPS01],who employ a prediction and verification method to track thefeatures over time, and visualize their past, current and pre-dicted positions using 3D elliptical icons. They also detectevents like feature splitting or merging, and summarize theevolution of the currently tracked features in a graph.
Even though temporal implosion essentially relies on thetracking of a specific object, the basic idea can be appliedalso to raw data: Balabanian et al. [BVMG08] developed a
4D raycasting algorithm which is able to render multiple vol-umes (corresponding to multiple timesteps) simultaneously.They also employ an adapted version of the style transferfunctions [BG07] in order to vary the rendering style alongthe temporal dimension. Figure 7 has been generated usingthe approach by Hsu et al. [HMCM10]: in this case everytimestep is treated separately, so its visual appearance canbe finely tuned and even the final layout can be modified inorder to create either overlapped or side-by-side views.
Recently van Pelt et al. [vPGtHRV11], following theguidelines in [JR05], propose to convey the motion of bloodusing illustration techniques typical of comics and cartoons:blood particles, represented by spheres, are deformed alongflow direction according to the velocity magnitude, while theillustrative rendering of reversed pathline effectively depictsparticles trajectories.
4.4. Focus Emphasis
The techniques included in this category are all based on animportance measure that clearly distinguishes the relevantportions of the data from the less interesting ones. This con-cept is actually well-known in data analysis approaches, likeInteractive Visual Analysis (IVA) or Visual Analytics (VA),to identify significant subsets of the data in usually multiplelinked views. In illustrative visualization the importance val-ues are instead used to explicitly control one or more visual
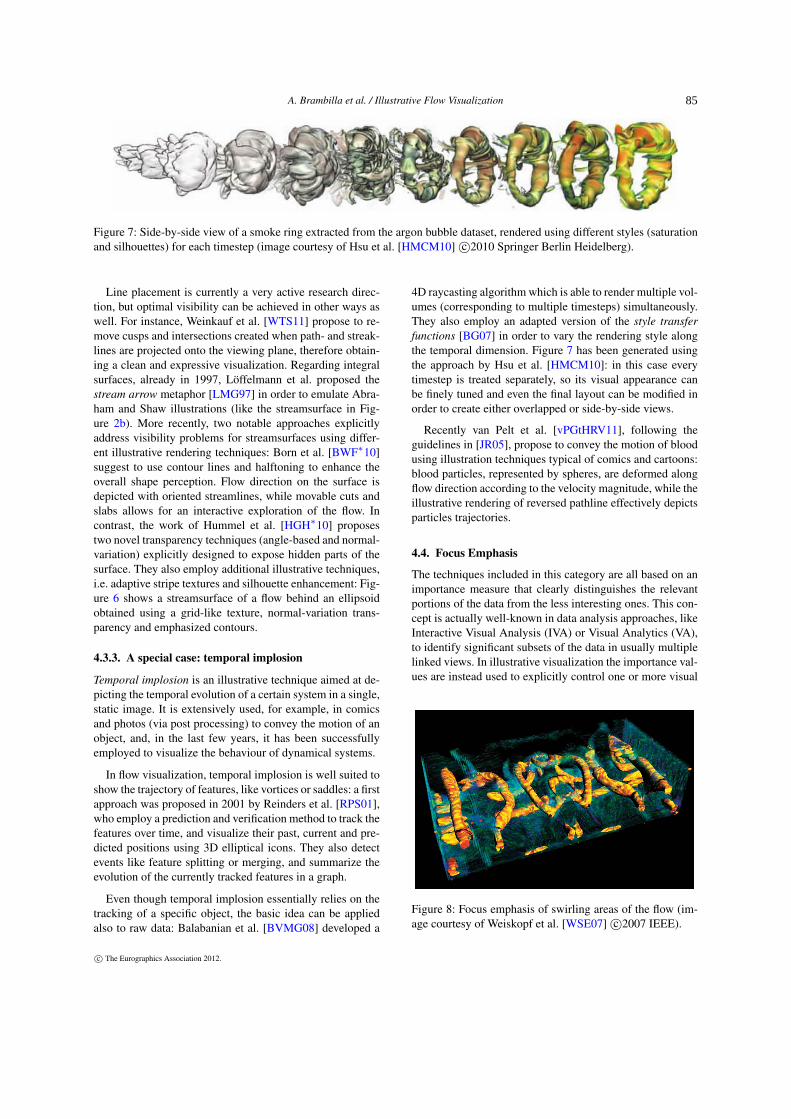
Figure 8: Focus emphasis of swirling areas of the flow (im-age courtesy of Weiskopf et al. [WSE07] c©2007 IEEE).
c© The Eurographics Association 2012.
85

A. Brambilla et al. / Illustrative Flow Visualization
properties: it is even possible to render parts of the datasetwith completely different techniques according to their im-portance values.
4.4.1. Raw data with importance values
It is a quite common practice to let the user define whathe deems relevant and what he does not. In the most sim-ple case, the important area is limited to a small number ofisolated locations manually specified in spatio-temporal do-main, while everything else is considered uninteresting. Thisidea has been exploited, for example, by many texture-basedalgorithms in order to simulate the classical experiment ofdye injection in a flow. Already in 1996, Shen et al. [SJM96]proposed to use a grayscale 3D LIC to show the contextwhile the dye (the focus) is rendered with colors smearedaccording to the velocity vectors. A similar approach wasadopted by Telea and van Wijk [TvW03] in 2003, but theirtechnique is based on 3D IBFV instead of LIC. One yearlater, Weiskopf and Ertl [WE04] proposed another dye ad-vection technique based on 3D IBFV, which is able to visual-ize even unsteady flow at interactive rates. Two more recentapproach are specifically aimed at making the appearence ofthe dye more realistic: Weiskopf et al. [WBE05] suggest tovary the intensity of the colors in order to explicitly repre-sent the variation of the dye density caused by the conver-gence and divergence of the flow. Li et al. [LTH08], instead,introduce a novel 2D dye advection algorithm which, apply-ing concepts typically used in computational fluid dynamics,is able to generate highly realistic results.
Dye injection is justified by historical reasons and it hasindeed proven its usefulness over the years; however, ina computerized environment, more advanced explorationtechniques can be developed. This is the case, for instance,of the Chamaleon rendering framework [SLB04]: the fo-cus is represented by the so called trace volume, which en-codes particles trajectories and is visualized via volume ren-
Figure 9: Illustrative deformation of flow in order to avoidthe occlusion of the focus region (image courtesy of Correaet al. [CSC07] c©2007 IEEE).
Figure 10: High transfer entropy regions are depicted withfull saturated colors, while context is completely desaturated(image courtesy of Wang et al. [WYG∗11] c©2011 IEEE).
dering; a specific texture is used to control the appearanceof the reuslts. The spatial locations included in the tracevolume can be interactively specified and, choosing the ap-propriate texture, many illustrative effects can be obtained,like directional glyphs or tone shading. A curious explo-ration framework has been recently proposed by Isenberget al. [IEGC08], whose goal is maximizing user interactionsusing a multitouch display: the 2D flow under investigationcan be displayed using a background texture and the user caninteractively place customizable animated glyphs in the areaof interests.
When analysing complex, multivariate phenomena likeflows, relevant portions of the data cannot be easily iden-tified by their spatial locations alone, usually precise crite-ria based on one or more variables are needed. A signifi-cant work in this direction has been proposed by Hauser andMlejnek in 2003 [HM03]: they describe an IVA frameworkwhere the user can select interesting areas in histograms orscatterplots of the flow variables. Each point of the datasetis therefore associated with a fuzzy importance value, thedegree of interest (DOI), which is used in the visualizationphase to modulate transparency or to define isosurfaces. Afuzzy importance measure is adopted also in [WSE07] and[FW08] to control different visualization parameters. Theproposed visualizations are based on 3D texture advectionand different shading and illumination schemes, and the im-portance values are directly mapped to appearance and trans-parency through a transfer function. In Figure 8, for exam-ple, swirling areas are emphasized using high opacity and a
c© The Eurographics Association 2012.
86

A. Brambilla et al. / Illustrative Flow Visualization
Figure 11: A streaksurface, in red, is seeded from the FTLEridge on the plane, while green arrows convey directionalinformation on timesurfaces (image courtesy of Ferstl et al.[FBTW10] c©2010 IEEE).
warm colors, while the context is more transparent and lesscolorful.
Figure 9 has been obtained with the approach of Correaet al. [CSC07]: they employ a fuzzy importance function,named Level of Desired Attention, and guarantee that the fo-cus is never occluded deforming the context according toone of the many templates provided. With the due excep-tions [AH11], deformations are in general not well suitedfor flows, since they alter the directional information, but inthis case only the context is modified, the relevant part of thedata is untouched and effectively emphasized.
All the focus emphasis techniques discussed up to now arebased on a user specified importance measure, but some at-tempts have been made to automatically identify significantregions of the dataset. According to the concept of entropyalready introduced in section 4.3.1, Wang et al. [WYM08]suggest to subdivide the dataset into blocks and evaluate theamount of information contained in each block over time.A clustering algorithm groups together blocks with similarentropy evolutions and the resulting clusters can be then vi-sualized in different ways. This approach has been recentlyextended in [WYG∗11], adopting an importance functionbased on transfer entropy, i.e. a measure of causal depen-dencies between variables; the normalized importance valueis then used to modulate saturation and opacity, producingexpressive visualizations like the one in Figure 10.
4.4.2. Focus+context approaches for integral structures
The concept of focus emphasis has been successfully appliedto integral structures as well. In particular, three main direc-tions have been investigated, each one with different goalsand expected results. The first one is based on the simple as-sumption that the user can freely specify the focus directlyon the spatial domain, and integral structures in that areahave to be visually emphasized. For example, in the workof Fuhrmann and Gröller [FG98] from 1998, the focus isspecified as a portion of the volume defined by either a 2D(magic lens) or a 3D (magic box) selection. Streamlines are
then visualized according to three different criteria: (1) con-text in front of the focus is suppressed to avoid occlusions;(2) in the remaining context areas, only a few streamlinesare visualized; (3) the focus areas are rendered with densebundles of streamlines.
A second category is instead represented by those ap-proaches that use the focus as the seeding area for the in-tegral structures. Based on this idea, [HM03], already men-tioned before, seeds streamlines in regions where the DOIis maximal, while in [MTHG03] the focus can be eitherused to increase streamlines density or to seed new stream-lines. [KKKW05] follows a similar strategy, but particles areseeded instead of streamlines, and, in a second phase, differ-ent types of particle-based visualizations can be generated,like oriented glyphs, stream balls or stream ribbons.
Two notable approaches deal instead with the construc-tion of integral surfaces: Schafhitzel et al. [STWE07] con-struct either stream- or pathsurfaces starting from a curveselected by the user in the spatial domain; their algorithm isbased on a GPU implementation and runs at interactive rates.On the other hand, Wiebel and Scheuermann [WS05] sug-gest to focus on a set of user selected seeding points, the socalled eyelets, and streaklines, pathline and pathsurfaces aresimultaneously computed. They also provide the user withdifferent guidelines for the selection of the eyelets, in orderto maximize the expressiveness of the resulting structures.
Recently, a more advanced exploration technique has beenproposed by Ferstl et al. [FBTW10] (see Figure 11): the userfirst places a 2D plane (the focus) in the 3D spatial domain,then FTLE values, i.e. a measure of particles’ divergenceover time, are computed on it. Ridges of the FTLE scalar
Figure 12: Flow features tracked over time and visualized to-gether with context information (image courtesy of Muelderand Ma [MM09] c©2009 IEEE).
c© The Eurographics Association 2012.
87

A. Brambilla et al. / Illustrative Flow Visualization
Figure 13: Visual explanation using the Aniviz framework: visualization templates are arranged along the timeline to producean effective presentation of the dataset (image courtesy of Akiba et al. [AWM10] c©2010 IEEE).
field are then detected, and the resulting curves are used toseed streaksurfaces. Moreover, timesurfaces, rendered usinggreen arrows, are periodically released from the plane. Formore details on FTLE, the reader can refer to [Hal01].
The third and final category includes approaches that usewhole integral curves as the focus of the visualization. In2010, two notable approaches based on this concept havebeen presented: Jones and Ma [JM10] present a flow explo-ration framework that, among other functionality, allows theuser to select groups of streamlines which will be visual-ized in a focus+context fashion. In particular, occluding ge-ometries are removed, and additional information, like thedistance from the focus curves, are depicted in the context.Wei et al. instead [WWYM10] developed a sketch-basedinterface for streamlines selection: the user first sketch theshape of the streamlines he deems interesting, then, accord-ing to a similarity measure, the corresponding curves arehighlighted. This direction has not been heavily investigatedyet, but the current results seem very promising and we ex-pect substantial developments in the near future.
4.4.3. Flow features
At this point it should be clear enough that the number of il-lustrative approaches that deal with flow features is meagre,but at least one work can be identified that complies withthe focus emphasis principle. This technique has been pro-posed in 2009 by Muelder and Ma [MM09], and its mainfocus is the interactive extraction and tracking of flow fea-tures. The details of their algorithm exceed the scope of thismanuscript, what really matters here is that, at the end of theprocedure, flow features are clearly segmented. As can beseen in Figure 12, this segmentation can be used during thevolume rendering process to emphasize the features of in-terest while still providing the less relevant context informa-tion. Notice that many illustrative visualization techniquescan be easily integrated into volume rendering algorithms,therefore it is our opinion that this approach would be just
the first in a long series of works on the illustrative depictionof flow features.
4.5. Visual Explanation
Visual explanation approaches are a superset of Guided Vi-sualization and Interactive Storytelling, and their goal is togive an explicative visual description of the underlying phe-nomena. The challenge here is twofold: besides the usual vi-sualization issues, it is also necessary to identify an appropri-ate set of objects, properties and relations that can lead to aneffective and concise explanation of the phenomenon of in-terest. A natural and straightforward way to define this pieceof semantic information is to apply one or more selectioncriteria to the data according to spatial, temporal or attributevalues. This is the approach adopted by Aniviz [AWM10],an animation framework designed to highlight different as-pects of volume data. The user is presented with multipleanimation templates which can be freely arranged along atimeline in order to build a visual presentation of the dataset.The templates and the transitions between them can be con-trolled by a set of parameters, which can be used to finelytune what aspects of the data has to be emphasized (see Fig-ure 13). This framework currently deals with raw data only,but extending it to integral structures or flow features shouldbe fairly easy.
A recent work by Pobitzer et al. [PTA∗11] suggests todescribe the flow using a scale-space approach: they decom-pose the vector field according to the level of transport en-ergy present in the flow, so the user can choose to focus ei-ther on the main transport structures or on the smaller scaleturbulence. Only raw data is taken into account in the com-putations, but the derived vector fields can be further pro-cessed: this can be useful, for instance, to identify whichflow features have a greater transport energy.
Regarding particle integration and integral structures, aninteresting approach has been proposed by Bürger et al.
c© The Eurographics Association 2012.
88

A. Brambilla et al. / Illustrative Flow Visualization
Figure 14: Flow depicted at different levels of detail (imagecourtesy of Bürger et al. [BKKW08] c©2008 IEEE).
[BKKW08] in 2008. Their work is based on two additionalfunctions defined on the flow domain: a customizable fuzzyimportance degree and a measure of the local coherence ofthe vector field; different visualization techniques are thenemployed according to these two parameters. The descrip-tive part is given mostly by the coherence measure, which infact affects the level of detail of the visualization: as can beseen in Figure 14, where the local coherence is low, stream-lines are used to convey the (turbulent) flow behavior. In con-trast, in areas where the flow is more stable, oriented glyphsare placed, and both their size and density are varied as thecoherence value increases. The importance function can beused either to explore specific locations of the domain or toemphasize particular aspects of the flow. Notice that the con-cept of “adaptive visualization”, which is nicely exploited inthis approach, is very effective in conveying different aspectsof the flow simultaneously, and we expect to see future workbased on it.
5. Final remarks and future expectations
We have reviewed and classified many illustrative flow vi-sualization approaches, emphasizing their respective mer-its and discussing their downsides. The classification intro-duced at the beginning of Section 4 clearly highlights thatthere is no approach that is universally better then the oth-ers, many aspects have to be taken into account in everysituation. In our opinion, the answers to “what flow repre-sentation do I want to refer to?” and “what visualization en-hancement do I need?” are two excellent guidelines to makea first choice, but further refinements are possible: for ex-ample, the personal preferences and habits of the final usershold a certain relevance. Moreover, since the various algo-rithms have very different computational complexity, someconsiderations have to be made regarding the available hard-ware and the size and structure of the datasets. It should notcome as a surprise that the best approach varies from case tocase and from user to user.
Over the last decade, illustrative flow visualization tech-niques have been proposed and applied in many differentcontexts, and, looking back, interesting considerations canbe made:
• Perceptual effectiveness has been the first illustrative con-cept being applied to visualization in general. It has beenthoroughly investigated and many effective and useful al-gorithms have been proposed. Nowadays there is the feel-ing that these techniques alone are not effective enough,so they are usually coupled with some higher visual ab-straction approaches.
• Smart placement of integral curves were, and still are, oneof the most prominent research directions in the field, butvisibility enhancement for integral surfaces has been re-cently attracting a lot of attention as well.
• Temporal implosion has not been investigated too much,probably because of its inherent technical complexity, butmany see a lot of potential in it, especially for the visual-ization of unsteady flows.
• Focus emphasis techniques are highly appreciated espe-cially for flow exploration and analysis, and we expectthat in the near future any visualization framework willimplement similar functionality.
Visual explanation techniques and illustrative visualiza-tion of flow features are still somewhat unexplored, prob-ably because of the same underlying problem: both thesecategories rely on a semantic knowledge base of the phe-nomenon of interest, but our understanding of flows is stilllimited. It is our opinion that, as new aspects of flow dynam-ics are discovered, research in both these areas will growaccordingly.
In the near future we expect to see a constantly increasingdegree of interaction between the flow and the illustrative vi-sualization branches: existing approaches typically considerjust the raw information encoded in the dataset, but usuallyno knowledge about the physical properties of the underly-ing flow is considered. In an ideal setup, flow investigationwould become an iterative process with continuous interac-tion between the illustrative flow visualization expert and theuser: the former should initially provide a set of suitable vi-sualization tools, the latter should use them for a preliminaryanalysis of the dataset, producing feedback about the toolsand a set of initial findings. Both the feedback and the newfindings will be taken into account to improve the visualiza-tion tools, and the whole process will start anew.
Of course illustrative flow visualization cannot answer allthe open questions or solve all the current issues in flow anal-ysis, but hopefully it will help to shed some light on this stillnot well understood phenomenon.
Acknowledgements
The authors would like to thank the anonymous reviewersfor their valuable feedback.This report has been worked out within the scope of theSemSeg project and we acknowledge the financial supportof the Future and Emerging Technologies (FET) programmewithin the Seventh Framework Programme for Research of
c© The Eurographics Association 2012.
89

A. Brambilla et al. / Illustrative Flow Visualization
the European Commission, under FET-Open grant number226042.
References
[AH11] ANGELELLI P., HAUSER H.: Straightening tubularflow for side-by-side visualization. Visualization and ComputerGraphics, IEEE Transactions on 17, 12 (dec. 2011), 2063 –2070.13
[AS82] ABRAHAM R., SHAW C. D.: Dynamics–the geometry ofbehavior. Aerial Press, 1982. 5
[Asi93] ASIMOV D.: Notes on the topology of vector fields andflows. Tech. rep., NASA Ames Research Center, 1993. 2
[AWM10] AKIBA H., WANG C., MA K.-L.: Aniviz: A template-based animation tool for volume visualization. IEEE ComputerGraphics and Applications 30, 5 (sept.-oct. 2010), 61–71. 7, 14
[BFTW09] BÜRGER K., FERSTL F., THEISEL H., WESTER-MANN R.: Interactive streak surface visualization on the gpu.IEEE Transactions on Visualization and Computer Graphics 15,6 (nov.-dec. 2009), 1259–1266. 7, 9
[BG07] BRUCKNER S., GRÖLLER M. E.: Style transfer func-tions for illustrative volume rendering. Computer Graphics Fo-rum 26, 3 (2007), 715–724. 11
[BKKW08] BÜRGER K., KONDRATIEVA P., KRÜGER J., WEST-ERMANN R.: Importance-driven particle techniques for flow vi-sualization. In Proc. of the IEEE Pacific Visualization Sympo-sium. PacificVis ’08 (mar. 2008), pp. 71–78. 7, 15
[BVMG08] BALABANIAN J.-P., VIOLA I., MÖLLER T.,GRÖLLER M. E.: Temporal styles for time-varying volume data.In Proc. of 3DPVT 2008. (2008). 7, 11
[BWF∗10] BORN S., WIEBEL A., FRIEDRICH J., SCHEUER-MANN G., BARTZ D.: Illustrative stream surfaces. IEEETransactions on Visualization and Computer Graphics 16 (2010),1329–1338. 7, 11
[CEH∗09] CHEN M., EBERT D. S., HAGEN H., LARAMEER. S., VAN LIERE R., MA K.-L., RIBARSKY W., SCHEUER-MANN G., SILVER D.: Data, information, and knowledge in vi-sualization. IEEE Computer Graphics and Applications 29, 1(jan.-feb. 2009), 12–19. 5
[CL93] CABRAL B., LEEDOM L. C.: Imaging vector fields usingline integral convolution. In Proc. of the 20th Int’l Conf. on Com-puter Graphics and Interactive Techniques (SIGGRAPH ’93)(New York, NY, USA, 1993), SIGGRAPH ’93, ACM, pp. 263–270. 7
[CSC07] CORREA C. D., SILVER D., CHEN M.: Illustrative de-formation for data exploration. IEEE Transactions on Visualiza-tion and Computer Graphics 13, 6 (nov.-dec. 2007), 1320–1327.7, 12, 13
[CYY∗11] CHEN C.-K., YAN S., YU H., MAX N., MA K.-L.:An illustrative visualization framework for 3d vector fields. Com-puter Graphics Forum (sept. 2011). 7, 10
[dLvL97] DE LEEUW W., VAN LIERE R.: Spotting structure incomplex time dependent flow. In Scientific Visualization Confer-ence, 1997 (june 1997), p. 47. 7
[DPR00] DIEWALD U., PREUSSER T., RUMPF M.: Anisotropicdiffusion in vector field visualization on euclidean domains andsurfaces. IEEE Transactions on Visualization and ComputerGraphics 6 (apr. 2000), 139–149. 7
[dV09] DA VINCI L.: Studies of water passing obstacles andfalling, c. 1508-1509. 5
[EBRI09] EVERTS M. H., BEKKER H., ROERDINK J. B. T. M.,ISENBERG T.: Depth-dependent halos: Illustrative rendering ofdense line data. IEEE Transactions on Visualization and Com-puter Graphics 15, 6 (nov.-dec. 2009), 1299–1306. 7, 8
[ES01] EBERT D. S., SHAW C. D.: Minimally immersive flowvisualization. IEEE Transactions on Visualization and ComputerGraphics 7, 4 (oct.-dec. 2001), 343–350. 6, 7
[ET08] ELMQVIST N., TSIGAS P.: A taxonomy of 3d occlu-sion management for visualization. Visualization and ComputerGraphics, IEEE Transactions on 14, 5 (sept.-oct. 2008), 1095–1109. 4
[FBTW10] FERSTL F., BURGER K., THEISEL H., WESTER-MANN R.: Interactive separating streak surfaces. IEEE Trans-actions on Visualization and Computer Graphics 16, 6 (nov.-dec.2010), 1569–1577. 7, 13
[FG98] FUHRMANN A., GRÖLLER M. E.: Real-time techniquesfor 3d flow visualization. In Proc. of IEEE Visualization ’98 (LosAlamitos, CA, USA, 1998), VIS ’98, IEEE Computer SocietyPress, pp. 305–312. 7, 13
[FW08] FALK M., WEISKOPF D.: Output-sensitive 3d line in-tegral convolution. Visualization and Computer Graphics, IEEETransactions on 14, 4 (july-aug. 2008), 820–834. 7, 12
[GGSC98] GOOCH A., GOOCH B., SHIRLEY P., COHEN E.: Anon-photorealistic lighting model for automatic technical illus-tration. In Proc. of the 25th Int’l Conf. on Computer Graphicsand Interactive Techniques (SIGGRAPH ’98) (New York, NY,USA, 1998), SIGGRAPH ’98, ACM, pp. 447–452. 4
[GPR∗01] GARCKE H., PREUSSER T., RUMPF M., TELEAA. C., WEIKARD U., VAN WIJK J. J.: A phase field modelfor continuous clustering on vector fields. IEEE Transactionson Visualization and Computer Graphics 7, 3 (july-sept. 2001),230–241. 7, 10
[GPR∗04] GRIEBEL M., PREUSSER T., RUMPF M.,SCHWEITZER M. A., TELEA A.: Flow field clusteringvia algebraic multigrid. In Proc. of IEEE Visualization 2004(oct. 2004), pp. 35–42. 7, 10
[Hal01] HALLER G.: Distinguished material surfaces and coher-ent structures in three-dimensional fluid flows. Physica D: Non-linear Phenomena 149, 4 (2001), 248–277. 3, 14
[Hau03] HAUSER H.: Generalizing focus+context visualiza-tion. In Scientific Visualization: The Visual Extraction of Knowl-edge from Data (2003), Bonneau G.-P., Ertl T., Nielson G.,Farin G., Hege H.-C., Hoffman D., Johnson C. R., Polthier K.,(Eds.), Mathematics and Visualization, Springer Berlin Heidel-berg, pp. 305–327. 4
[HBP∗07] HUANG J., BUE B., PATTATH A., EBERT D. S.,THOMAS K. M.: Interactive illustrative rendering on mobile de-vices. IEEE Computer Graphics and Applications 27, 3 (may-june 2007), 48–56. 1
[HGH∗10] HUMMEL M., GARTH C., HAMANN B., HAGEN H.,JOY K. I.: Iris: Illustrative rendering for integral surfaces. IEEETransactions on Visualization and Computer Graphics 16 (2010),1319–1328. 7, 10, 11
[HH89] HELMAN J., HESSELINK L.: Representation and displayof vector field topology in fluid flow data sets. Computer 22, 8(aug. 1989), 27–36. 3
[HH91] HELMAN J. L., HESSELINK L.: Visualizing vector fieldtopology in fluid flows. IEEE Computer Graphics and Applica-tions 11, 3 (may 1991), 3—46. 3
[HM03] HAUSER H., MLEJNEK M.: Interactive volume visual-ization of complex flow semantics. In Proc. of the 8th Fall Work-shop on Vision, Modeling and Visualization (VMV 2003) (2003),pp. 191–198. 7, 12, 13
c© The Eurographics Association 2012.
90

A. Brambilla et al. / Illustrative Flow Visualization
[HMCM10] HSU W.-H., MEI J., CORREA C. D., MA K.-L.:Depicting time evolving flow with illustrative visualization tech-niques. In Arts and Technology, vol. 30 of Lecture Notesof the Institute for Computer Sciences, Social Informatics andTelecommunications Engineering. Springer Berlin Heidelberg,2010, pp. 136–147. 7, 11
[HPvW94] HESSELINK L., POST F. H., VAN WIJK J. J.: Re-search issues in vector and tensor field visualization. IEEE Com-puter Graphics and Applications 14, 2 (mar 1994), 76–79. 3
[HS89] HIBBARD W., SANTEK D.: Interactivity is the key. InProc. of the 1989 Chapel Hill workshop on Volume visualization(New York, NY, USA, 1989), VVS ’89, ACM, pp. 39–43. 5
[HWHJ99] HECKEL B., WEBER G., HAMANN B., JOY K. I.:Construction of vector field hierarchies. In Proc. of IEEE Visu-alization ’99 (Los Alamitos, CA, USA, 1999), VIS ’99, IEEEComputer Society Press, pp. 19–25. 7, 10
[HWSE99] HEIDRICH W., WESTERMANN R., SEIDEL H.-P.,ERTL T.: Applications of pixel textures in visualization and real-istic image synthesis. In Proc. of the 1999 symposium on Inter-active 3D graphics (New York, NY, USA, 1999), I3D ’99, ACM,pp. 127–134. 7
[IEGC08] ISENBERG T., EVERTS M. H., GRUBERT J.,CARPENDALE S.: Interactive exploratory visualization of 2dvector fields. Computer Graphics Forum 27, 3 (2008), 983–990.7, 12
[IFH∗03] ISENBERG T., FREUDENBERG B., HALPER N.,SCHLECHTWEG S., STROTHOTTE T.: A developer’s guide tosilhouette algorithms for polygonal models. IEEE ComputerGraphics and Applications 23, 4 (july-aug. 2003), 28–37. 4
[IG97] INTERRANTE V., GROSCH C.: Strategies for effectivelyvisualizing 3d flow with volume lic. In Proc. of IEEE Visualiza-tion ’97 (Los Alamitos, CA, USA, 1997), VIS ’97, IEEE Com-puter Society Press, pp. 421–ff. 7
[JEH01] JOBARD B., ERLEBACHER G., HUSSAINI M. Y.:Lagrangian-eulerian advection for unsteady flow visualization. InProc. of IEEE Visualization 2001 (Washington, DC, USA, 2001),VIS ’01, IEEE Computer Society, pp. 53–60. 7
[JL97] JOBARD B., LEFER W.: Creating evenly-spaced stream-lines of arbitrary density. Visualization in Scientific Computing97 (1997), 43–56. 7, 10
[JM10] JONES C., MA K.-L.: Visualizing flow trajectories usinglocality-based rendering and warped curve plots. IEEE Transac-tions on Visualization and Computer Graphics 16, 6 (nov.-dec.2010), 1587–1594. 7, 14
[JR05] JOSHI A., RHEINGANS P.: Illustration-inspired tech-niques for visualizing time-varying data. In Proc. of IEEE Vi-sualization 2005 (oct. 2005), pp. 679–686. 11
[KBKG07] KOHLMANN P., BRUCKNER S., KANITSAR A.,GRÖLLER M. E.: Livesync: Deformed viewing spheres forknowledge-based navigation. IEEE Transactions on Visualiza-tion and Computer Graphics 13, 6 (nov.-dec. 2007), 1544–1551.4
[KGJ09] KRISHNAN H., GARTH C., JOY K.: Time and streaksurfaces for flow visualization in large time-varying data sets.IEEE Transactions on Visualization and Computer Graphics 15,6 (nov.-dec. 2009), 1267–1274. 7, 9
[KKKW05] KRÜGER J., KIPFER P., KONDRATIEVA P., WEST-ERMANN R.: A particle system for interactive visualization of 3dflows. IEEE Transactions on Visualization and Computer Graph-ics 11, 6 (nov.-dec. 2005), 744–756. 7, 13
[KML99] KIRBY R. M., MARMANIS H., LAIDLAW D. H.: Vi-sualizing multivalued data from 2d incompressible flows using
concepts from painting. In Proc. of IEEE Visualization ’99 (LosAlamitos, CA, USA, 1999), VIS ’99, IEEE Computer SocietyPress, pp. 333–340. 6, 7, 8
[LDG98] LÖFFELMANN H., DOLEISCH H., GRÖLLER M. E.:Visualizing dynamical systems near critical points. In 14thSpring Conference on Computer Graphics (1998), pp. 175–184.7, 9
[LHD∗04] LARAMEE R. S., HAUSER H., DOLEISCH H.,VROLIJK B., POST F. H., WEISKOPF D.: The state of the artin flow visualization: Dense and texture-based techniques. Com-puter Graphics Forum 23, 2 (2004), 203–221. 3, 8
[LHS08] LI L., HSIEH H.-H., SHEN H.-W.: Illustrative stream-line placement and visualization. In Proc. of the IEEE PacificVisualization Symposium. PacificVis ’08 (mar. 2008), pp. 79–86.7, 10
[LHZP07] LARAMEE R., HAUSER H., ZHAO L., POST F. H.:Topology-based flow visualization, the state of the art. InTopology-Based Methods in Visualization: Proc. of the 1stTopoInVis Workshop (TopoInVis 2005), Hauser H., Hagen H.,Theisel H., (Eds.), Mathematics and Visualization. Springer,2007, pp. 1–20. 3
[LKG98] LÖFFELMANN H., KUCERA T., GRÖLLER M. E.: Vi-sualizing Poincaré maps together with the underlying flow. InMathematical Visualization, Hege H.-C., Polthier K., (Eds.).Springer, 1998, pp. 315–328. 7, 9
[LMG97] LÖFFELMANN H., MROZ L., GRÖLLER M. E.: Hi-erarchical streamarrows for the visualization of dynamical sys-tems. In Visualization in Scientific Computing ’97, Proc. ofthe Eurographics Workshop in Boulogne-sur-Mer, France (1997),pp. 155–163. 7, 11
[LMSC11] LEE T.-Y., MISHCHENKO O., SHEN H.-W., CRAW-FIS R.: View point evaluation and streamline filtering for flowvisualization. In Proc. of the IEEE Pacific Visualization Sympo-sium (PacificVis), 2011 (mar. 2011), pp. 83–90. 7, 10
[LS07] LI L., SHEN H.-W.: Image-based streamline generationand rendering. IEEE Transactions on Visualization and Com-puter Graphics 13, 3 (may-june 2007), 630–640. 7, 10
[LTH08] LI G.-S., TRICOCHE X., HANSEN C.: Physically-based dye advection for flow visualization. Computer GraphicsForum 27, 3 (2008), 727–734. 7, 12
[MBC93] MAX N., BECKER B., CRAWFIS R.: Flow volumes forinteractive vector field visualization. In Proc. of IEEE Visualiza-tion ’93 (oct. 1993), pp. 19 –24. 9
[MCG94] MAX N., CRAWFIS R., GRANT C.: Visualizing 3dvelocity fields near contour surfaces. In Proc. of IEEE Visualiza-tion ’94 (Los Alamitos, CA, USA, 1994), VIS ’94, IEEE Com-puter Society Press, pp. 248–255. 7, 9
[MCHM10] MARCHESIN S., CHEN C.-K., HO C., MA K.-L.:View-dependent streamlines for 3d vector fields. IEEE Transac-tions on Visualization and Computer Graphics 16, 6 (nov.-dec.2010), 1578–1586. 7, 10
[MLF∗12] MA K.-L., LIAO I., FRAZIER J., HAUSER H.,KOSTIS H.-N.: Scientific storytelling using visualization. IEEEComputer Graphics and Applications (jan.-feb. 2012). 4
[MLP∗10] MCLOUGHLIN T., LARAMEE R. S., PEIKERT R.,POST F. H., CHEN M.: Over two decades of integration-based,geometric flow visualization. Computer Graphics Forum 29, 6(2010), 1807–1829. 3, 4
[MM09] MUELDER C., MA K.-L.: Interactive feature extrac-tion and tracking by utilizing region coherency. In Proc. of theIEEE Pacific Visualization Symposium. PacificVis ’09 (apr. 2009),pp. 17–24. 7, 13, 14
c© The Eurographics Association 2012.
91

A. Brambilla et al. / Illustrative Flow Visualization
[MPSS05] MALLO O., PEIKERT R., SIGG C., SADLO F.: Illu-minated lines revisited. In Proc. of IEEE Visualization 2005 (oct.2005), pp. 19–26. 7, 8
[MTHG03] MATTAUSCH O., THEUSSL T., HAUSER H.,GRÖLLER M. E.: Strategies for interactive exploration of 3dflow using evenly-spaced illuminated streamlines. In Proc. of the19th Spring Conference on Computer Graphics (SCCG) (2003),pp. 213–222. 7, 13
[PBL∗04] PARK S. W., BUDGE B., LINSEN L., HAMANN B.,JOY K. I.: Multi-dimensional transfer functions for interactive3d flow visualization. In Proc. of the 12th Pacific Conference onComputer Graphics and Applications (oct. 2004), pp. 177–185.6, 7
[PGT∗08] PATEL D., GIERTSEN C., THURMOND J., GJELBERGJ., GRÖLLER M. E.: The seismic analyzer: Interpreting and il-lustrating 2d seismic data. IEEE Transactions on Visualizationand Computer Graphics 14, 6 (nov.-dec. 2008), 1571–1578. 1
[PPF∗11] POBITZER A., PEIKERT R., FUCHS R., SCHINDLERB., KUHN A., THEISEL H., MATKOVIC K., HAUSER H.: Thestate of the art in topology-based visualization of unsteady flow.Computer Graphics Forum (2011), no–no. 3
[PTA∗11] POBITZER A., TUTKUN M., ANDREASSEN Ø.,FUCHS R., PEIKERT R., HAUSER H.: Energy-scale aware fea-ture extraction for flow visualization. Computer Graphics Forum30, 3 (2011), 771–780. 7, 14
[PVH∗02] POST F. H., VROLIJK B., HAUSER H., LARAMEER., DOLEISCH H.: Feature extraction and visualization of flowfields. In Eurographics 2002 State-of-the-Art Reports (Saar-brücken Germany, 2002), pp. 69–100. 3
[PVH∗03] POST F. H., VROLIJK B., HAUSER H., LARAMEER. S., DOLEISCH H.: The state of the art in flow visualisation:Feature extraction and tracking. Computer Graphics Forum 22,4 (2003), 775–792. 3
[RBGV08] RAUTEK P., BRUCKNER S., GRÖLLER M. E., VI-OLA I.: Illustrative visualization: new technology or uselesstautology? ACM SIGGRAPH Computer Graphics Quarterly 42(aug. 2008), 4:1–4:8. 4
[RPS01] REINDERS F., POST F. H., SPOELDER H.: Vi-sualization of time-dependent data with feature tracking andevent detection. The Visual Computer 17 (2001), 55–71.10.1007/PL00013399. 7, 11
[RSHTE99] REZK-SALAMA C., HASTREITER P., TEITZEL C.,ERTL T.: Interactive exploration of volume line integral convo-lution based on 3d-texture mapping. In Proc. of IEEE Visualiza-tion ’99 (oct. 1999), pp. 233–528. 7, 8
[SES05] SVAKHINE N., EBERT D. S., STREDNEY D.: Illustra-tion motifs for effective medical volume illustration. IEEE Com-puter Graphics and Applications 25, 3 (may-june 2005), 31–39.1
[SET∗06] SVAKHINE N. A., EBERT D. S., TEJADA E., ERTLT., GAITHER K.: Pre-integrated flow illustration for tetrahedralmeshes. In Volume Graphics (2006), pp. 63–66. 6, 7
[SEV∗08] SOUSA M. C., EBERT D. S., VIOLA I., ANDREWSB., BRUCKNER S., CORREA C. D., CHEN W.: Interactive toolsfor scientific and medical illustration composition. In half-daytutorial, Eurographics (2008). 5
[SGS05] STOLL C., GUMHOLD S., SEIDEL H.-P.: Visualizationwith stylized line primitives. In Proc. of IEEE Visualization 2005(oct. 2005), pp. 695–702. 7, 8
[SJEG05] SVAKHINE N. A., JANG Y., EBERT D. S., GAITHERK.: Illustration and photography inspired visualization of flows
and volumes. In Proc. of IEEE Visualization 2005 (oct. 2005),pp. 687–694. 6, 7, 8
[SJM96] SHEN H.-W., JOHNSON C. R., MA K.-L.: Visualiz-ing vector fields using line integral convolution and dye advec-tion. Volume Visualization and Graphics, IEEE Symposium on 0(1996), 63. 7, 12
[SJWS08] SALZBRUNN T., JÄNICKE H., WISCHGOLL T.,SCHEUERMANN G.: The state of the art in flow visualiza-tion: Partition-based techniques. In Proc. of Conf. Simulation& Visualization (SimVis 2008) (2008), Hauser H., Straßburger S.,Theisel H., (Eds.), SCS Publishing House e.V., pp. 75–92. 4
[SKH∗04] SCHIRSKI M., KUHLEN T., HOPP M., ADOMEIT P.,PISCHINGER S., BISCHOF C.: Efficient visualization of largeamounts of particle trajectories in virtual environments using vir-tual tubelets. In Proceedings of the 2004 ACM SIGGRAPH in-ternational conference on Virtual Reality continuum and its ap-plications in industry (New York, NY, USA, 2004), VRCAI ’04,ACM, pp. 141–147. 7, 8
[SLB04] SHEN H.-W., LI G.-S., BORDOLOI U. D.: Interactivevisualization of three-dimensional vector fields with flexible ap-pearance control. IEEE Transactions on Visualization and Com-puter Graphics 10, 4 (july-aug. 2004), 434–445. 7, 12
[SLM02] STOMPEL A., LUM E. B., MA K.-L.: Visualizationof multidimensional, multivariate volume data using hardware-accelerated non-photorealistic rendering techniques. In Proc. ofthe 10th Pacific Conference on Computer Graphics and Applica-tions (2002), pp. 394–402. 6, 7
[SLM05] SHADDEN S., LEKIEN F., MARSDEN J.: Definitionand properties of Lagrangian coherent structures from finite-timeLyapunov exponents in two-dimensional aperiodic flows. Phys-ica D: Nonlinear Phenomena 212, 3-4 (2005), 271–304. 3
[SM04] SCHUSSMAN G., MA K.-L.: Anisotropic volume ren-dering for extremely dense, thin line data. In Proc. of IEEE Visu-alization 2004 (oct. 2004), pp. 107–114. 7, 8
[SMM00] SANNA A., MONTRUCCHIO B., MONTUSCHI P.: Asurvey on visualization of vector fields by texture-based methods.Recent Research Developments in Pattern Recognition 1 (2000),2000. 3
[STWE07] SCHAFHITZEL T., TEJADA E., WEISKOPF D., ERTLT.: Point-based stream surfaces and path surfaces. In Proceed-ings of Graphics Interface 2007 (New York, NY, USA, 2007), GI’07, ACM, pp. 289–296. 7, 13
[SVL91] SCHROEDER W. J., VOLPE C. R., LORENSEN W. E.:The stream polygon: a technique for 3d vector field visualiza-tion. In Proc. of IEEE Visualization ’91 (Los Alamitos, CA,USA, 1991), VIS ’91, IEEE Computer Society Press, pp. 126–132. 7, 8
[TSS∗06] TAERUM T., SOUSA M. C., SAMAVATI F., CHAN S.,MITCHELL J. R.: Real-time super resolution contextual close-up of clinical volumetric data. In Proc. of the 8th Joint EURO-GRAPHICS – IEEE VGTC Symp. on Visualization (EuroVis 2006)(2006), pp. 347–354. 1
[TVW99] TELEA A., VAN WIJK J. J.: Simplified representationof vector fields. In Proc. of IEEE Visualization ’99 (oct. 1999),pp. 35–507. 7, 10
[TvW03] TELEA A., VAN WIJK J. J.: 3D IBFV: hardware-accelerated 3d flow visualization. In Proc. of IEEE Visualization2003 (oct. 2003), pp. 233–240. 7, 12
[UIL∗04] URNESSY T., INTERRANTE V., LONGMIRE E.,MARUSIC I., GANAPATHISUBRAMANI B.: Techniques for vi-sualizing multi-valued flow data. Deussen O., Hansen C., KeimD. A., Saupe D., (Eds.), Eurographics Association, pp. 165–172.7, 9
c© The Eurographics Association 2012.
92
A. Brambilla et al. / Illustrative Flow Visualization
[UIM∗03] URNESS T., INTERRANTE V., MARUSIC I., LONG-MIRE E., GANAPATHISUBRAMANI B.: Effectively visualizingmulti-valued flow data using color and texture. In Proc. of IEEEVisualization 2003 (oct. 2003), pp. 115–121. 7, 8, 9
[USM96] UENG S.-K., SIKORSKI C., MA K.-L.: Efficientstreamline, streamribbon, and streamtube constructions on un-structured grids. IEEE Transactions on Visualization and Com-puter Graphics 2, 2 (june 1996), 100–110. 7, 8
[VD82] VAN DYKE M.: An album of fluid motion. Stanford, CA,1982. 1
[VFSG06] VIOLA I., FEIXAS M., SBERT M., GRÖLLER M. E.:Importance-driven focus of attention. IEEE Transactions on Vi-sualization and Computer Graphics 12, 5 (sept.-oct. 2006), 933–940. 4
[vFWTS08] VON FUNCK W., WEINKAUF T., THEISEL H., SEI-DEL H.-P.: Smoke surfaces: An interactive flow visualizationtechnique inspired by real-world flow experiments. Visualizationand Computer Graphics, IEEE Transactions on 14, 6 (nov.-dec.2008), 1396–1403. 7, 9
[VG05] VIOLA I., GRÖLLER M. E.: Smart visibility in visual-ization. In Proceedings of EG Workshop on Computational Aes-thetics Computational Aesthetics in Graphics, Visualization andImaging (may 2005), Neumann L., Sbert M., Gooch B., Purgath-ofer W., (Eds.), pp. 209–216. 4
[VGH∗05] VIOLA I., GRÖLLER M. E., HADWIGER M., BÜLERK., PREIM B., COSTA SOUSA M., EBERT D. S., STREDNEYD.: Illustrative visualization. In Proc. of IEEE Visualization 2005(2005), p. 124. 4, 5
[VKG05] VIOLA I., KANITSAR A., GRÖLLER M. E.:Importance-driven feature enhancement in volume visual-ization. IEEE Transactions on Visualization and ComputerGraphics 11, 4 (july-aug. 2005), 408–418. 1, 4
[vPBB∗10] VAN PELT R., BESCÓS J. O., BREEUWER M.,CLOUGH R. E., GRÖLLER M. E., TER HAAR ROMENY B., VI-LANOVA A.: Exploration of 4d mri blood flow using stylisticvisualization. IEEE Transactions on Visualization and ComputerGraphics 16, 6 (nov.-dec. 2010), 1339–1347. 7, 9
[vPGtHRV11] VAN PELT R., GRÖLLER M. E., TERHAAR ROMENIJ B., VILANOVA A.: Illustrative particlevisualization of 4d mri blood-flow data. Symposium: A Quar-terly Journal In Modern Foreign Literatures 0 (2011), 13–14. 7,11
[vW91] VAN WIJK J. J.: Spot noise texture synthesis for data vi-sualization. In Proc. of the 18th Int’l Conf. on Computer Graph-ics and Interactive Techniques (SIGGRAPH ’91) (New York, NY,USA, 1991), ACM, pp. 309–318. 7
[vW02] VAN WIJK J. J.: Image based flow visualization. InProc. of the 29th Int’l Conf. on Computer Graphics and Interac-tive Techniques (SIGGRAPH 2002) (New York, NY, USA, 2002),SIGGRAPH ’02, ACM, pp. 745–754. 7
[WBE05] WEISKOPF D., BOTCHEN R. P., ERTL T.: Interactivevisualization of divergence in unsteady flow by level-set dye ad-vection. In Proc. of Conf. Simulation & Visualization (SimVis2005) (2005), pp. 221–232. 7, 12
[WBE∗06] WEISKOPF D., BORCHERS M., ERTL T., FALK M.,FECHTIG O., FRANK R., GRAVE F., KING A., KRAUS U.,MULLER T., NOLLERT H.-P., MENDEZ I. R., RUDER H.,SCHAFHITZEL T., SCHAR S., ZAHN C., ZATLOUKAL M.: Ex-planatory and illustrative visualization of special and general rel-ativity. Visualization and Computer Graphics, IEEE Transac-tions on 12, 4 (july-aug. 2006), 522–534. 1
[WE04] WEISKOPF D., ERTL T.: Gpu-based 3d texture advec-tion for the visualization of unsteady flow fields. In In WSCG2004 Conference Proceedings, Short Papers (2004), pp. 259–266. 7, 12
[WEE03] WEISKOPF D., ERLEBACHER G., ERTL T.: A texture-based framework for spacetime-coherent visualization of time-dependent vector fields. In Proc. of IEEE Visualization 2003 (oct.2003), pp. 107–114. 7
[WFK∗02] WONG P. C., FOOTE H., KAO D. L., LEUNG R.,THOMAS J.: Multivariate visualization with data fusion. Infor-mation Visualization 1 (dec 2002), 182–193. 7, 8
[WH07] WOHLFART M., HAUSER H.: Story telling for presen-tation in volume visualization. In Proc. of the 9th Joint EURO-GRAPHICS – IEEE VGTC Symp. on Visualization (EuroVis 2007)(2007), pp. 91–98. 4
[WS05] WIEBEL A., SCHEUERMANN G.: Eyelet particle tracing- steady visualization of unsteady flow. In Proc. of IEEE Visual-ization 2005 (oct. 2005), pp. 607–614. 7, 13
[WSE07] WEISKOPF D., SCHAFHITZEL T., ERTL T.: Texture-based visualization of unsteady 3d flow by real-time advectionand volumetric illumination. IEEE Transactions on Visualizationand Computer Graphics 13, 3 (may-june 2007), 569–582. 7, 11,12
[WTS11] WEINKAUF T., THEISEL H., SORKINE O.: Cusps ofcharacteristic curves and intersection-aware visualization of pathand streak lines. In Topology-Based Methods in Visualization:Proc. of the 4th TopoInVis Workshop (TopoInVis 2011) (Zürich,Switzerland, apr. 2011). 7, 11
[WWYM10] WEI J., WANG C., YU H., MA K.-L.: A sketch-based interface for classifying and visualizing vector fields. InProc. of the IEEE Pacific Visualization Symposium (PacificVis),2010 (mar. 2010), pp. 129–136. 7, 14
[WYG∗11] WANG C., YU H., GROUT R. W., MA K.-L., CHENJ. H.: Analyzing information transfer in time-varying multivari-ate data. In Proc. of the IEEE Pacific Visualization Symposium(PacificVis), 2011 (mar. 2011), pp. 99–106. 7, 12, 13
[WYM08] WANG C., YU H., MA K.-L.: Importance-driventime-varying data visualization. IEEE Transactions on Visualiza-tion and Computer Graphics 14, 6 (nov.-dec. 2008), 1547–1554.7, 13
[XZC04] XUE D., ZHANG C., CRAWFIS R.: Rendering implicitflow volumes. In Proc. of IEEE Visualization 2004 (oct. 2004),pp. 99–106. 7, 9
[YWM07] YU H., WANG C., MA K.-L.: Parallel hierarchicalvisualization of large time-varying 3d vector fields. In Supercom-puting, 2007. SC ’07. Proc. of the 2007 ACM/IEEE Conferenceon (nov. 2007), pp. 1–12. 7, 10
[ZSH96] ZÖCKLER M., STALLING D., HEGE H.-C.: Interactivevisualization of 3d-vector fields using illuminated stream lines.In Proc. of IEEE Visualization ’96 (nov. 1996), pp. 107–113. 7,8
Biographies
Andrea Brambilla is a Ph.D. candidate at the Departmentof Informatics, University of Bergen, Norway. He receiveda M.Sc. (Laurea Specialistica) in Computer Science in 2009from the University of Milano - Bicocca, Italy. After obtain-ing his degree, he spent one year as an external collaboratorat the same university, working on computer graphics and
c© The Eurographics Association 2012.
93

A. Brambilla et al. / Illustrative Flow Visualization
computer animations. His current research interests includeflow visualization and illustrative rendering techniques.
Robert Carnecky is a graduate student at the ETH Zürich,Switzerland. He received his masters in Computational Sci-ence and Engineering at the ETH in 2007. His research fo-cuses on scientific and illustrative visualization.
Ronald Peikert received his diploma in mathematics in1979 and his PhD in mathematics in 1985, both from ETHZurich. He is currently a titular professor in the computerscience department of ETH Zurich. His research interests in-clude flow visualization, feature extraction techniques, andindustrial applications of visualization.
Ivan Viola is associate professor at University of Bergen,and Scientific Adviser at Christian Michelsen Research(CMR), Bergen, Norway. He received M.Sc. in 2002 andPh.D. in 2005 from Vienna University of Technology, Aus-tria. His research is focused on application of illustrative vi-sualization for communication of complex scientific data inmedicine and geo-sciences. Viola co-authored several sci-entific works published in international journals and confer-ences such as IEEE TVCG, IEEE Visualization, and Euro-Vis and acted as a reviewer and IPC member for conferencesin the field of computer graphics and visualization. He ismember of Eurographics, NorSIGD, IEEE Computer Soci-ety, VGTC, ACM SIGGRAPH.
Helwig Hauser is a professor in visualization at the Uni-versity of Bergen, Norway (www.ii.UiB.no/vis). He gradu-ated in 1998 with a PhD degree from Vienna University ofTechnology, where he also worked as an assistant professoruntil 2000 (www.cg.tuwien.ac.at). Afterwards, he lead a re-search group on visualization at the VRVis Research Centerin Vienna, Austria, before he became the scientific directorof VRVis in 2003 (www.VRVis.at). His interests are visu-alization in general and interactive visual analysis, illustra-tive visualization, flow visualization, medical visualization,and the combination of scientific and information visualiza-tion, in particular. He has rich experience with state of theart reports as also documented by recent publications in therespective Eurographics proceedings.
c© The Eurographics Association 2012.
94