illuminating microbial dark matter in meromictic …aem.asm.org/content/80/21/6807.full.pdf ·...
TRANSCRIPT

Illuminating Microbial Dark Matter in Meromictic Sakinaw Lake
Esther A. Gies,a Kishori M. Konwar,a J. Thomas Beatty,a Steven J. Hallama,b,c
Department of Microbiology and Immunology, University of British Columbia, Vancouver, British Columbia, Canadaa; Genome Science and Technology Program,University of British Columbia, Vancouver, British Columbia, Canadab; Graduate Program in Bioinformatics, University of British Columbia, Vancouver, British Columbia,Canadac
Despite recent advances in metagenomic and single-cell genomic sequencing to investigate uncultivated microbial diversity andmetabolic potential, fundamental questions related to population structure, interactions, and biogeochemical roles of candidatedivisions remain. Numerous molecular surveys suggest that stratified ecosystems manifesting anoxic, sulfidic, and/or methane-rich conditions are enriched in these enigmatic microbes. Here we describe diversity, abundance, and cooccurrence patterns ofuncultivated microbial communities inhabiting the permanently stratified waters of meromictic Sakinaw Lake, British Colum-bia, Canada, using 454 sequencing of the small-subunit rRNA gene with three-domain resolution. Operational taxonomic units(OTUs) were affiliated with 64 phyla, including more than 25 candidate divisions. Pronounced trends in community structurewere observed for all three domains with eukaryotic sequences vanishing almost completely below the mixolimnion, followed bya rapid and sustained increase in methanogen-affiliated (�10%) and unassigned (�60%) archaeal sequences as well as bacterialOTUs affiliated with Chloroflexi (�22%) and candidate divisions (�28%). Network analysis revealed highly correlated, depth-dependent cooccurrence patterns between Chloroflexi, candidate divisions WWE1, OP9/JS1, OP8, and OD1, methanogens, andunassigned archaeal OTUs indicating niche partitioning and putative syntrophic growth modes. Indeed, pathway reconstructionusing recently published Sakinaw Lake single-cell genomes affiliated with OP9/JS1 and OP8 revealed complete coverage of theWood-Ljungdahl pathway with potential to drive syntrophic acetate oxidation to hydrogen and carbon dioxide under methano-genic conditions. Taken together, these observations point to previously unrecognized syntrophic networks in meromictic lakeecosystems with the potential to inform design and operation of anaerobic methanogenic bioreactors.
Over the past 2 decades, cultivation-independent approacheshave identified at least 60 major branch points (phyla or di-
visions) in the bacterial and archaeal domains of life (1). Approx-imately half of these branch points represent candidate divisionswith no known cultivated representatives, so-called microbialdark matter (MDM) (2). Emerging lines of evidence suggest thatbacteria affiliated with BD1-5, OP11, OP9/JS1, OP1, and WWE1candidate divisions harbor genes encoding components of fer-mentation, hydrogen or sulfur metabolic pathways supportingcometabolic or syntrophic growth modes under anaerobic condi-tions (3–6). Consistent with this, a recent single-cell genomicstudy of OP9 bacteria from hot spring sediments suggested a de-pendence on exogenous vitamins sourced from surrounding mi-crobial community members (3). Such public good dynamicscould represent a common organizing principle in structuringmicrobial community interaction networks (7, 8) and help ex-plain the resistance of most environmental microorganisms, in-cluding candidate divisions to clonal isolation (7, 9).
While advances in metagenomic and single-cell genomic se-quencing have begun to open a window on the metabolic potentialof many candidate divisions, fundamental questions relating totheir population structure, interactions, and biogeochemical rolesremain. Recent molecular surveys indicate that natural and engi-neered ecosystems with anoxic, sulfidic, and/or methane-richconditions tend to harbor a diversity of candidate divisions (6,10–12). Among ecosystems manifesting these biogeochemicalconditions, permanently stratified meromictic lakes provide trac-table models in which to study MDM population structure, func-tion, and dynamics. In these aquatic ecosystems, the water columnpartitions into oxic fresh surface waters referred to as the mix-olimnion, a redox transition zone, and anoxic, often hydrogen
sulfide (H2S)- and methane (CH4)-rich bottom waters, referred toas the monimolimnion (13, 14).
Previous studies have identified MDM in geographically iso-lated meromictic lakes with different degrees of spatial and taxo-nomic resolution. For example, small-subunit (SSU) rRNA geneclone library sequencing in Lake Pavin in France identified at leastfive bacterial candidate divisions, including OP1, OP3, OP10,OP11, and WS5 that partitioned between the redox transitionzone and monimolimnion (15). A more recent study using a com-bination of SSU rRNA gene clone library sequencing and Phy-loChip hybridization in Mahoney Lake in Canada identified atleast eight bacterial candidate divisions, including OP1, OP8,OP9/JS1, OP11, TM6, WS1, WS3, and ZB2 (16). A higher-throughput study in Arctic Lake A identified SSU rRNA genepyrotag sequences affiliated with at least four candidate divisions,including OP3, OP8, OP9, and OP11 that increased in abundancewithin the monimolimnion (17).
Here we describe the microbial community inhabiting Saki-naw Lake, a meromictic lake, on the Sunshine Coast of British
Received 29 May 2014 Accepted 22 August 2014
Published ahead of print 29 August 2014
Editor: F. E. Löffler
Address correspondence to Steven J. Hallam, [email protected].
Supplemental material for this article may be found at http://dx.doi.org/10.1128/AEM.01774-14.
Copyright © 2014, American Society for Microbiology. All Rights Reserved.
doi:10.1128/AEM.01774-14
The authors have paid a fee to allow immediate free access to this article.
November 2014 Volume 80 Number 21 Applied and Environmental Microbiology p. 6807– 6818 aem.asm.org 6807
on May 7, 2018 by guest
http://aem.asm
.org/D
ownloaded from

Columbia, Canada, using a pyrosequencing approach targetingthe SSU rRNA gene, with specific emphasis on describing the pop-ulation structure of MDM across defined redox transition zones.We apply hierarchical clustering and indicator species analyses toidentify operational taxonomic units (OTUs) differentially asso-ciated with the mixolimnion, upper and lower part of the transi-tion zone, and monimolimnion in relation to environmental pa-rameter data. Network analysis is then used to chart potentialinteractions between prevalent OTUs, including many candidatedivisions. Metabolic reconstruction based on recently publishednear-complete Sakinaw Lake single-cell amplified genome se-quences reinforces network connectivity patterns, revealing puta-tive syntrophic relationships among candidate divisions andbetween candidate divisions and other microbial communitymembers (2).
MATERIALS AND METHODSSampling. Water samples from Sakinaw Lake, British Columbia, Canada,were taken at deep basin station S1 (49°40.968=N 124°00.119=W) using acombination of 12-liter Niskin and 8-liter GO-FLO bottles on 6 June2007, 23 October 2007, 21 May 2008, 5 August 2009, 5 January 2010, 27January 2011, and 24 May 2011 (see Table S1 in the supplemental mate-rial). A total of 66 samples were collected from different depths coveringthe mixolimnion (5 m to 30 m), transition zone (33 m to 55 m), andmonimolimnion (60 m to 120 m). Conductivity temperature and depthwere measured with a Sea-Bird SBE19 CTD device measuring conductiv-ity, temperature, and depth (Sea-Bird Electronics Inc., Bellevue, WA,USA). Samples were kept at 4°C in the dark and subsequently processedfor environmental DNA extraction. Additionally, transition metal, sulfide(H2S), and sulfate (SO4
2�) concentrations were determined for samplescollected on 24 May 2011.
Environmental DNA. Approximately 6 h after sample collection, 2liters of water was filtered through a 0.22-�m Sterivex GV filter (Milli-pore) without a prefilter using a Masterflex L/S 7553–70 peristaltic pump(Cole-Parmer) for DNA extraction. DNA was extracted from Sterivexfilters by the method of Zaikova and colleagues (18) and DeLong andcolleagues (19). The DNA extraction protocol can be viewed as a visual-ized experiment at http://www.jove.com/video/1352/ (20).
Enumeration of cells by flow cytometry. Enumeration of total cellswas performed by the method of Zaikova and colleagues (18). Briefly,water samples were fixed in 4% (wt/vol) formaldehyde and stored at 4°Cin the dark for approximately 18 h prior to processing for flow cytometry.Nucleic acids were stained with SYBR green (Invitrogen), and cells werecounted with a fluorescence-activated cell sorting (FACS) LSRII flow cy-tometer equipped with an air-cooled argon laser (Becton Dickinson). Cellcounts were estimated using a known concentration of 6-�m fluorescentbeads (Invitrogen).
Chemical profiling. All salinities are on the TEOS-10 reference com-position salinity scale, with the salinity anomaly assumed to be zero (21).Dissolved oxygen concentrations were determined by Winkler titrations(22). Hydrogen sulfide concentration was measured from water samplesfixed with 2% final concentration of zinc acetate and analyzed in the labusing the methylene blue method of Cline et al. (23). The concentrationsof transition metals, including iron (Fe), manganese (Mn), and arsenic(As), and SO4
2� were determined at Maxxam Analytics (Burnaby, BritishColumbia, Canada) using Standard Methods for the Examination of Waterand Wastewater published by the American Public Health Association(24). Sulfate was determined with automated colorimetry according tothe standard protocol SM 4500 SO4
2� within 24 h after sample collection(24). Samples for dissolved fractions of Fe, Mn, and As were preservedwith nitric acid (HNO3) and filtered through a 0.45-�m membrane filterprior to analysis with inductively coupled plasma mass spectrometrybased on standard protocol EPA 200.8 (25) within 14 days of sampling.Dissolved methane (CH4) was measured from 13 samples (water depths
of 5 m, 10 m, 25 m, 30 m, 33 m, 36 m, 40 m, 45 m, 50 m, 55 m, 60 m, 80 m,and 120 m) collected in June 2007 by gas chromatography coupled tomass spectrometry (GC-MS) using the static headspace equilibrium tech-nique of Zaikova et al. (18). As CH4 concentrations in the monimolim-nion of Sakinaw Lake exceed detection limits of the applied method, ourdata are estimates and indicate that CH4 concentrations in the deep Saki-naw Lake waters exceed atmospheric saturation values.
PCR amplification of SSU rRNA gene for pyrotag sequencing. Envi-ronmental DNA extracts described above were amplified using previouslypublished three-domain primers targeting the V6-V8 region of the SSUrRNA gene (26): 926F (5=-cct atc ccc tgt gtg cct tgg cag tct cag AAA CTYAAA KGA ATT GRC GG-3=) and 1392R (5=-cca tct cat ccc tgc gtg tct ccgact cag-XXXXX-ACG GGC GGT GTG TRC-3=). Primer sequences weremodified by the addition of 454 A or B adapter sequences (shown inlowercase type). In addition, the reverse primer included a 5-bp bar codedesignated XXXXX for multiplexing of samples during sequencing.
Twenty-five microliter PCRs were performed in triplicate and pooledto minimize PCR bias. Each reaction mixture contained between 1 and 10ng of target DNA, 0.5 �l Taq DNA polymerase (Bioshop Inc., Canada), 2.5�l Bioshop 10� buffer provided in the Bioshop Taq-polymerase kit, 1.5�l of 25 mM Bioshop MgCl2, 2.5 �l of 10 mM deoxynucleoside triphos-phates (dNTPs) (Agilent Technologies), and 0.5 �l of 10 mM (each)primer. The thermal cycler protocol started with an initial denaturation at95°C for 3 min and then 25 cycles, with 1 cycle consisting of 30 s at 95°C,45 s at 55°C, 90 s at 72°C, and 45 s at 55°C. The final step, an extension step,was 10 min at 72°C. PCR products were purified using the QIAquick PCRpurification kit (Qiagen), eluted in 20 mM Tris (pH 8), quantified usingthe Quant-it Picogreen dsDNA reagent. SSU rRNA amplicons werepooled at 30 ng DNA for each sample. Emulsion PCR and sequencing ofthe PCR amplicons were performed at the McGill University and GénomeQuébec Innovation Center on a Roche 454 GS FLX titanium platformaccording to the manufacturer’s instructions.
Pyrotag sequence analysis. Pyrotag sequences were analyzed usingthe Quantitative Insights Into Microbial Ecology (QIIME) software pack-age (27). To minimize the removal of false-positive singleton OTUs,901,664 pyrotag sequences generated from 66 samples collected in Saki-naw Lake between 2007 and 2011 were clustered together (see Table S1 inthe supplemental material). Reads with length shorter than 200 bases,ambiguous bases, and homopolymer sequences were removed prior tochimera detection. Chimeras were detected and removed using the chi-mera slayer provided in the QIIME software package. Sequences werethen clustered at 97% identity using uclust with furthest linkage algo-rithm. Prior to taxonomic assignment, singleton OTUs (OTUs repre-sented by one read) were omitted, leaving 23,231 OTUs (Table S2). Togenerate an OTU table specific for the May 2011 data set, the filter_otus_by_sample.py script was used, leaving 181,464 sequences and 12,908OTUs for downstream analysis. The average number of reads per samplein the Sakinaw Lake May 2011 data set was 16,323, with the exception ofthe 33-m-deep sample, which had �50% fewer reads. Representative se-quences from each nonsingleton OTU were queried against the SILVAdatabase release 111 (28) and the Greengenes database (29) using BLAST(30).
Overall, the comparison between SILVA and Greengenes databasesrevealed similar taxonomic assignments for bacterial OTUs. However,significant differences for archaeal OTU assignments were observed be-tween the two databases. Approximately twice as many reads were as-signed to Methanomicrobia using the Greengenes database than when theSILVA database was used. This difference could be mapped back to asingle abundant OTU, approaching 10% of total sequences at a depth of45 m that was assigned to Methanomicrobiales using the Greengenes da-tabase and to Halobacteriales using the SILVA database. BLAST-basedcomparisons indicated that sequences comprising this OTU shared�90% identity with Halobacteriales reference sequences in SILVA and90% identity with Methanomicrobiales reference sequences in Green-genes. Moreover, a number of putative archaeal OTUs associated with the
Gies et al.
6808 aem.asm.org Applied and Environmental Microbiology
on May 7, 2018 by guest
http://aem.asm
.org/D
ownloaded from

redox transition zone and monimolimnion (depths of 33 m to 120 m)were identified with “no blast hits” using Greengenes but assigned toHalobacteriales using SILVA. Because both databases are not well anno-tated for Halobacteria (31), the Sakinaw Lake data set was mapped ontothe full-length Halobacteria SSU rRNA gene database generated byYoussef and colleagues (31) using the program CD-HIT (cd-hit-est-2d)(32). The data set could not be clustered with the Halobacteria referencesequences at 99%, 97%, or 95% identity. Even for 90% sequence identity,only 981 reads (0.5%) clustered with the Halobacteria reference se-quences. Given these uncertainties in putative archaeal OTU affiliation,we designated them “unassigned Archaea” until full-length sequences orreference genomes become available to support more-in-depth phyloge-netic analysis.
Statistical analyses. Microbial community richness was determinedusing scripts implemented in the QIIME package. OTU tables were rar-efied starting with 10 sequences to a maximum of 6,000 sequences. Teniterations per sample were calculated with 100 sequences between eachstep. Hierarchical cluster analysis of microbial community compositionalprofiles and environmental parameters was conducted in the R statisticalenvironment (Development Core Team, 2011; http://www.R-project.org/)using Manhattan distance measures for clustering microbial communitycompositional profiles (33) and Euclidean distance for environmental pa-rameters (34). Prior to analysis, pyrotag data sets were normalized to the totalnumber of reads per sample, and environmental parameter data were trans-formed to the same order of magnitude so that each variable had equal weight.
Multilevel indicator species analysis (ISA) was performed to identifyOTUs specifically associated with different water column compartments(mixolimnion [5 m, 20 m, and 30 m], upper part of the transition zone [33m, 36 m, 40 m, and 45 m], lower part of the transition zone [50 m and 55m], and monimolimnion [60 m, 80 m, and 120 m]). Dufrene and Leg-endre established a method to determine an indicator species by its relat-edness to a user-defined environment, e.g., group of samples, where eachspecies is treated individually, and its indicator value is determined ac-cording to its abundance value (35). De Caceres and colleagues recentlyextended the algorithm for ISA to include a multilevel pattern analysis(36). Arguing that species with higher adaptability for different environ-mental factors are indicative for specific environment combinations, thisanalysis additionally determines indicator species for combinations ofenvironments. The ISA/multilevel pattern analysis calculates P valueswith Monte Carlo simulations and returns indicator values (IVs) andvalues with � � 0.05. The IVs fall between zero and one, where one isconsidered a true indicator.
Cooccurrence network. To generate a robust network emphasizingcooccurrences between prevalent OTUs in water column compart-ments rather than individual depth intervals, Spearman’s rank corre-lation was used. Spearman’s rank correlation coefficients were calculatedusing a custom perl script, “correlation_network.pl” (https://github.com/hallamlab/utilities/tree/master/correlation_network). The initial data setconsisted of 12,900 OTUs. To simplify the network, we retained OTUswith at least 10 reads appearing in at least three samples leaving 1,528OTUs with Spearman’s rank correlations equal to or greater than 0.99.The resulting cooccurrence network contained 130,101 edges, each with apositive correlation. The network was visualized with a force-directedlayout, using Cytoscape 2.8.3 (37). Network properties were calculatedwith the “Network Analysis” plug-in. Nodes in the cooccurrence networkcorresponded to individual OTUs, and edges were defined by computedcorrelations between corresponding OTU pairs. The layout revealed fourdistinct modules, which persisted after lowering the correlation coeffi-cient cutoff for edge creation to 0.90, reinforcing the robustness of thenetwork.
Pathway reconstruction. To evaluate the metabolic potential for syn-trophic acetate oxidation (SAO) among highly connected candidate divi-sions, publicly available single-cell genomes from Sakinaw Lake affiliatedwith OP9/JS1, OP8, and WWE1 were searched for coverage of the Wood-
Ljungdahl pathway using the Joint Genome Institute integrated microbialgenomes expert review portal (IMG-ER) (http://img.jgi.doe.gov/).
Nucleotide sequence accession number. The sequences reported inthis study have been deposited in the NCBI BioProject database (www.ncbi.nlm.nih.gov/bioproject) under BioProject accession no. PRJNA257655 (identification no. [ID] 257655).
RESULTSSite location and physicochemical properties. Sakinaw Lake is apermanently stratified lake located on the Sunshine Coast of Brit-ish Columbia, Canada (49°40.8=N, 124°00.39=W) at an elevationof �5 m above sea level. Originally a fjord opening to the Strait ofGeorgia, Sakinaw Lake was almost completely isolated from theocean due to coastal uplift �11,000 years ago following the last iceage (38). For thousands of years, a small stream named SakinawCreek was the only conduit between Sakinaw Lake and the Strait ofGeorgia. In 1952, Sakinaw Creek was dammed to better managewater levels for development projects in the surrounding water-shed preventing seawater ingress. The lake consists of two basins:a relatively shallow freshwater basin 49 m deep and a more exten-sive salt stratified basin 140 m deep (39). A gradual salinity in-crease in the transition zone is followed by a series of three �0.5-g/kg salinity steps punctuating the monimolimnion.
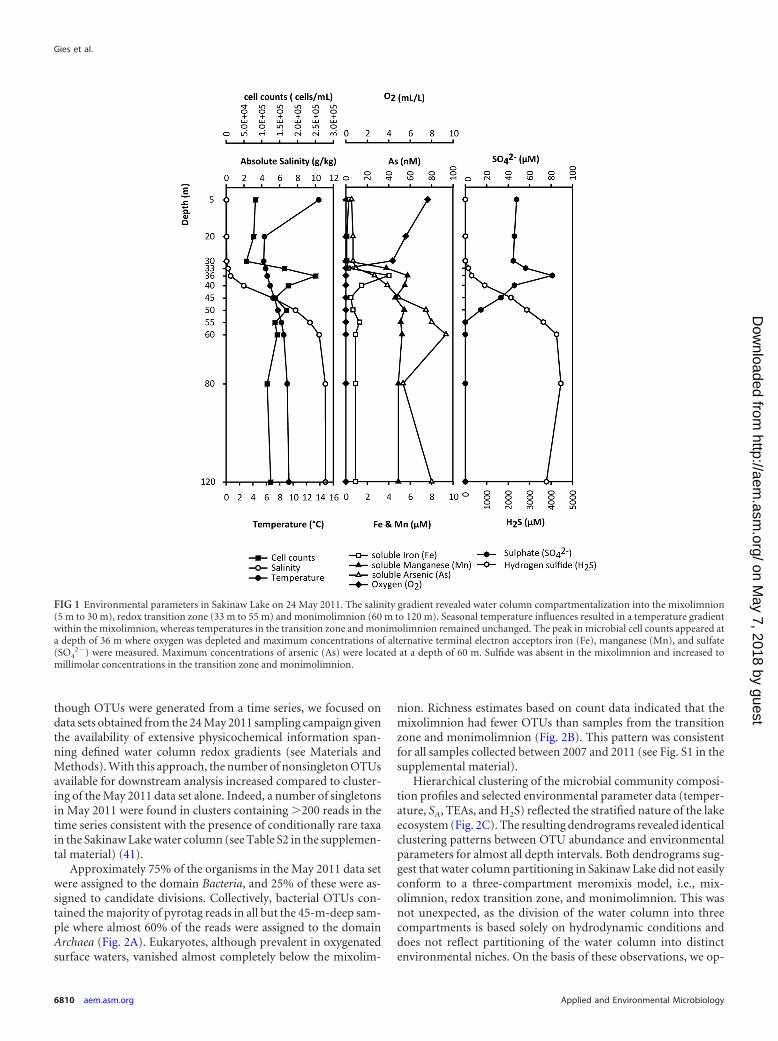
Measurements of absolute salinity (SA), temperature, and ox-ygen between 2007 and 2011 revealed a remarkable stability in thesalinity gradient throughout the water column as well as consis-tent temperatures below a depth of 36 m (see Table S3 in thesupplemental material). Temperature and oxygen (O2) profiles inthe mixolimnion changed between different sampling timepoints, which was expected due to seasonal influences. To deter-mine the availability of terminal electron acceptors (TEAs) formicrobial energy metabolism in different water column compart-ments, O2, iron (Fe), manganese (Mn), arsenic (As), and SO4
2�
measurements were plotted as a function of depth and comparedto measurements of SA, sulfide (H2S), and total bacterial cellcounts (Fig. 1). The resulting profiles were then compared to geo-graphically distinct meromictic lakes to determine common base-line conditions (Table S4). The mixolimnion in Sakinaw Lake (5m to 30 m) was constituted of entirely fresh, oxygen-rich water. Inthe transition zone (30 m to 55 m), salinity and the concentrationof alternative TEAs, including Fe, Mn, and SO4
2� gradually in-creased, whereas O2 concentrations decreased. The oxic-anoxicinterface was located at a depth of 33 m. Methane concentrations,which were determined for samples collected in June 2007 in-creased below 33 m and reached saturation at 45 m (data notshown), forming a sulfate methane transition zone (SMTZ). Peakconcentrations of Fe, Mn, and SO4
2� were observed in the micro-molar range (8.1 �M, 4.2 �M, and 57.5 �M, respectively) at adepth of 36 m and corresponded with increased microbial cellabundance (�2.8 � 105 cells/ml). Sulfide concentrations in thelower part of the redox transition zone and the monimolimnion(50 m to 120 m) were high (4.5 mM) and resulted in the removalof soluble Fe from the water column by precipitation into ironsulfide (FeS) and pyrite (FeS2) (40). The peak concentration of Aswas in the nanomolar range (93.4 nM) at a depth of 60 m.
Relationship between community structure and physico-chemical characteristics. To better understand how the physico-chemical properties of the Sakinaw Lake water column influencemicrobial community diversity, we performed 454 pyrosequenc-ing of the SSU rRNA gene with three-domain resolution. Al-
Candidate Divisions Form Syntrophic Networks
November 2014 Volume 80 Number 21 aem.asm.org 6809
on May 7, 2018 by guest
http://aem.asm
.org/D
ownloaded from
though OTUs were generated from a time series, we focused ondata sets obtained from the 24 May 2011 sampling campaign giventhe availability of extensive physicochemical information span-ning defined water column redox gradients (see Materials andMethods). With this approach, the number of nonsingleton OTUsavailable for downstream analysis increased compared to cluster-ing of the May 2011 data set alone. Indeed, a number of singletonsin May 2011 were found in clusters containing �200 reads in thetime series consistent with the presence of conditionally rare taxain the Sakinaw Lake water column (see Table S2 in the supplemen-tal material) (41).
Approximately 75% of the organisms in the May 2011 data setwere assigned to the domain Bacteria, and 25% of these were as-signed to candidate divisions. Collectively, bacterial OTUs con-tained the majority of pyrotag reads in all but the 45-m-deep sam-ple where almost 60% of the reads were assigned to the domainArchaea (Fig. 2A). Eukaryotes, although prevalent in oxygenatedsurface waters, vanished almost completely below the mixolim-
nion. Richness estimates based on count data indicated that themixolimnion had fewer OTUs than samples from the transitionzone and monimolimnion (Fig. 2B). This pattern was consistentfor all samples collected between 2007 and 2011 (see Fig. S1 in thesupplemental material).
Hierarchical clustering of the microbial community composi-tion profiles and selected environmental parameter data (temper-ature, SA, TEAs, and H2S) reflected the stratified nature of the lakeecosystem (Fig. 2C). The resulting dendrograms revealed identicalclustering patterns between OTU abundance and environmentalparameters for almost all depth intervals. Both dendrograms sug-gest that water column partitioning in Sakinaw Lake did not easilyconform to a three-compartment meromixis model, i.e., mix-olimnion, redox transition zone, and monimolimnion. This wasnot unexpected, as the division of the water column into threecompartments is based solely on hydrodynamic conditions anddoes not reflect partitioning of the water column into distinctenvironmental niches. On the basis of these observations, we op-
FIG 1 Environmental parameters in Sakinaw Lake on 24 May 2011. The salinity gradient revealed water column compartmentalization into the mixolimnion(5 m to 30 m), redox transition zone (33 m to 55 m) and monimolimnion (60 m to 120 m). Seasonal temperature influences resulted in a temperature gradientwithin the mixolimnion, whereas temperatures in the transition zone and monimolimnion remained unchanged. The peak in microbial cell counts appeared ata depth of 36 m where oxygen was depleted and maximum concentrations of alternative terminal electron acceptors iron (Fe), manganese (Mn), and sulfate(SO4
2�) were measured. Maximum concentrations of arsenic (As) were located at a depth of 60 m. Sulfide was absent in the mixolimnion and increased tomillimolar concentrations in the transition zone and monimolimnion.
Gies et al.
6810 aem.asm.org Applied and Environmental Microbiology
on May 7, 2018 by guest
http://aem.asm
.org/D
ownloaded from

erationally divided the transition zone into an upper and lowerpart to more accurately reflect potential niche partitioning.
To identify how OTUs partitioned between the mixolimnion,upper part of the transition zone, lower part of the transition zone,and monimolimnion, we conducted a four-way set differenceanalysis of the presence of OTUs (Fig. 3A). Approximately 1% ofthe OTUs were shared between all four water column compart-ments, with the majority of OTUs exhibiting mutually exclusivedistribution patterns (13% unique to the mixolimnion, 21%unique to the upper transition zone, 10% unique to the lowertransition zone, and 21% unique to the monimolimnion) (Fig.3A). Operational taxonomic units associated with a given watercolumn compartment that are absent or rare in other compart-ments are potential ecological indicators. To identify potentialindicator OTUs, we performed a multilevel indicator species anal-ysis. With this analysis we were able to determine indicator speciesfor individual water column compartments and compartmentcombinations. Only 5 to 10% of the compartment-specific OTUswere identified as indicator species (Fig. 3B; see Fig. S2 in thesupplemental material). Indeed, the majority of OTUs that wereidentified as compartment specific in the four-way set differenceanalysis exhibited fine-scale depth partitioning (Fig. 3C and TableS5). Indicators shared between compartments were also uncom-mon with the exception of the lower part of the transition zoneand monimolimnion. In these two compartments, �44% of the
OTUs were identified as indicators. Overall, the majority of OTUindicators were affiliated with unassigned Archaea (25.63%) andcandidate phyla (21.3%), followed by Chloroflexi (16.2%). For adetailed taxonomic breakdown of indicator OTUs, see Table S6.
Taxonomic composition. To determine how the taxonomiccomposition of the microbial community was distributed withinand between water column compartments, we plotted bacterialand archaeal OTUs based on relative abundance (Fig. 4). Thepresence of eukaryotes in Sakinaw Lake is described in the supple-mental material (see Fig. S3 in the supplemental material). All taxaexhibiting intermediate abundance (�0.1%) or above are repre-sented in Fig. 4 and also Fig. S3 in the supplemental material.However, for visualization purposes, only taxa �1% are shown toscale.
The most abundant taxa in the mixolimnion were Alphapro-teobacteria (11.8%) the majority of which were affiliated withSAR11 (9.7%), Betaproteobacteria (10%) mostly affiliated withBurkholderiales (8.1%), Bacteriodetes (13.2%), Actinobacteria(22.3%), Cyanobacteria (16.9%), Planctomycetes (8.3%), and Ver-rucomicrobia (1.1%) (Fig. 4A; see Table S2 in the supplementalmaterial). Archaea were almost absent from the mixolimnion, al-though Methanomicrobia were identified among members of therare biosphere (�0.1%) (Fig. 4B and Table S2) (42, 43). Depth-specific trends within the mixolimnion were observed for severaltaxa, including Cyanobacteria, which decreased rapidly below 5 m,
reads / sample
OTU
s
05000150002500035000
environmental parameter
36
3330
20
5
60
50
55
40
80
36
3330
20
5
60
45
50
55
40
80
120
OTUabundance
45
0 20 40 60 80 100
120
Euclidean
5 20 30 33 36 40 45 50 55 60 80 1200
20
40
60
80
100
Archaea Bacteria Eukaryotes
%
Depth (m)
0 2000 4000 6000 80000
200
400
600
800
1000
1200
1400
1600
1800
2000
Water compartments: mixolimnion upper part of the metalimnion lower part of the metalimnion monimolimnion
CA
B
FIG 2 Relationship between community structure and physicochemical characteristics of the Sakinaw Lake water column. (A) Bacterial operational taxonomicunits (OTUs) contained the majority of pyrotag reads in all samples but the sample taken at a depth of 45 m, where almost 60% of the reads were assigned toArchaea. Eukaryotes vanished almost completely below the mixolimnion. (B) Richness estimates based on count data indicated that the mixolimnion had fewerOTUs than samples from the transition zone and monimolimnion. (C) Hierarchical clustering of the OTU abundance and environmental parameter data(temperature, SA, TEAs, and H2S).
Candidate Divisions Form Syntrophic Networks
November 2014 Volume 80 Number 21 aem.asm.org 6811
on May 7, 2018 by guest
http://aem.asm
.org/D
ownloaded from

and Planctomycetes and Verrucomicrobia, which increased below 5m. Overall, the bacterial composition in the mixolimnion of Saki-naw Lake was similar to other freshwater and meromictic lakeecosystems (17, 44, 45).
Proteobacteria dominated the upper part of the transition zone,including Betaproteobacteria (12.5%), mostly affiliated with Burk-holderiales (7.7%), Deltaproteobacteria (12.9%) mostly affiliatedwith Desulfurobacterales (4%) and Syntrophobacterales (9.6%),
and Gammaproteobacteria (23.8%) mostly affiliated with theMethylococcales (22.4%). In addition to proteobacterial groups,Bacteriodetes (13.2%), Actinobacteria (22.3%), Cyanobacteria(16.9%), Plantomycetes (8.3%), Verrucomicrobia (1.1%), Chloro-biales (1.8%), and Chloroflexi (8.5%) were also abundant in theupper part of the transition zone (Fig. 4A; see Table S2 in thesupplemental material). Interestingly, between depths of 33 m and40 m, a 10-fold increase in candidate divisions, including OP3
2672
628
1342
816
95
158
963
1273
1715
559 86
314
2741
41
33 36 40 455 20 30 50 55 60 80 120
B
Depth (m)
A
0 0.3 0.6 0.77012
00
0 0.6 0.9
0
0 0.6 0.9054
00
73
00
0 0.6 0.9)
0250
0Re
ads
5
1
2
3
4
6
5
1
2
3
4
6
7
1
2
3
1
2
3
4
5
36
3330
20
5
60
50
55
40
80
45
120
indicator OTUs: 25 200 400 600
Water compartments: mixolimnion monimolimnion
C
) )
FIG 3 Partitioning of operational taxonomic units (OTUs) within and between the mixolimnion, upper part of the transition zone, lower part of the transitionzone, and monimolimnion. (A) The Venn diagram revealed mutually exclusive distribution patterns for the majority of OTUs. (B) Number of indicator OTUsin different water column compartments. (C) OTUs that were identified as water compartment specific using the four-way set difference analysis in panel Aexhibited a fine-scale depth partitioning as revealed by a cluster analysis of the associated OTUs. For identification of OTUs within individual clusters of the watercolumn compartments, the clusters were labeled with numbers and associated OTUs were listed in Table S5 in the supplemental material.
Gies et al.
6812 aem.asm.org Applied and Environmental Microbiology
on May 7, 2018 by guest
http://aem.asm
.org/D
ownloaded from

SphingobacteriaFlavobacteria
vadinHA17
BSV13BD2-2
other BacteriodetesAcidobacteria
eria
CyanobacteriaChloroplast
other Cyanobacteria
Clostridia
PhycisphaeraePlanctomycetacia
OM190
vadinHA49other Plantomycetes
OPB35 soil group
other Verrucomicrobia
rae
GIF9
Anaerolineae
vadinBA26Sh765B-AG-111
GIF3
Napoli-4B-65
CaldilineaeFW22
other ChloroflexiCaldiserica
ChlamydiaeDeferribacteres
Nitrospirae Spirochaetes
Verrucomicrobia
Chlorobi
eria
Bacteriodetes
Proteobacteria
Cyanobacteria
Planctomycetes
Chloroflexi
Firmicutes
Ca. Methylacidiphilum
Bacteria
Opitutae
OPB41
33 36 40 455 20 50 55 60 80 12030
other Proteobacteria
Thermophilia
Bacteroidia
Bacilli
Erysipelotrichi
Deinococcus-ThermusElusimicrobia
(%):
BD1-5CD12BRC1
Hyd24-12JL-ETNP-Z39Kazan-3B-28
LD1-PA38MVP-21
NPL-UPA2OC31OD1
OP11OP3OP8
OP9/JS1RF3
SM2F11SR1
TA06TM6TM7
WCHB1-60WS3WS6
WWE1
33 36 40 455 20 50 55 60 80 12030
1.5 3 6 12>0.1
Candidate Phyla
Other
Acidimicrobiia
ML635J-21
Candidate Phyla
Group C3Marine Group I
Euryarchaeota
Thaumarchaeota
ArchaeaThermoplasmata
Miscellaneous
Unassigned
ANME-1Methanocellales
MethanomicrobialesMethanosarcinales
Other
Methanobacteria
H2S (uM)5 300 4000
>0.1 6 12.5 25 5031(%):
A
B
Water compartments:mixolimnion
monimolimnion
FIG 4 (A) Relative abundances of bacterial and archaeal phyla/classes based on relative OTU abundance. All taxa exhibiting intermediate abundance (�0.1%)are represented in the figure; however, for visualization purposes, only taxa with abundance of �1% are shown to scale. Sulfide concentrations at the individualdepths are represented as dots where the radius correlates to the sulfide concentration. (A) Bacterial and archaeal taxa exhibited water compartment-specificdistribution patterns. Microbial dark matter comprised of candidate phyla and unassigned Archaea was predominately recovered from the sulfide-rich part of thewater column. (B) Distribution and abundance of all bacterial candidate divisions in Sakinaw Lake.
Candidate Divisions Form Syntrophic Networks
November 2014 Volume 80 Number 21 aem.asm.org 6813
on May 7, 2018 by guest
http://aem.asm
.org/D
ownloaded from

(4%), OP8 (4%), OP11 (4%), OP9/JS1 (8%), RF3 (5.6%), andWWE1 (7%) was observed (Fig. 4A and B). The upper part of thetransition zone was further marked by a distinct increase in ar-chaeal OTU abundance. Several of these OTUs were affiliated withthe methanogenic Methanomicrobiales (7%) and Methanosarcina-les (3%), ammonia-oxidizing Thaumarchaeota (1.4%), andanaerobic methane-oxidizing (ANME) archaea belonged to therare biosphere (�1%). The remaining archaeal OTUs (44.5%)shared similar identity to Halobacteriales and Methanomicrobialesand could not be assigned to a specific phylum. Overall, the mi-crobial community structure in the upper part of the transitionzone was similar to other methane-rich meromictic lake ecosys-tems (17, 46). However, the diversity and abundance of bacterialcandidate divisions and the relative proportion of unassigned Ar-chaea are unprecedented. Indeed, 25 of the currently estimated 30bacterial candidate divisions were recovered from the upper partof the transition zone. Their recently established affiliation to su-perphyla and the availability of single amplified genomes (SAGs)is summarized in Table S7 (2).
The taxonomic compositions of the lower part of the transitionzone and the monimolimnion were similar for the samples fromdepths of 40 and 45 m of the upper part of the transition zone. Themost abundant Bacteria were affiliated with candidate divisionsOP3 (1.5%), OP8 (3.6%), OP9/JS1 (6.1%), OP11 (4.1%), WWE1(6.1%), and Chloroflexi (22.3%). Depth-specific trends were ob-served for the Chloroflexi, which increased in abundance between45 m and 120 m. This trend has also been reported for Chloroflexiin meromictic Arctic Lake A and Lake Pavin in France (15, 17).Similar to the upper part of the transition zone, OTUs affiliatedwith methanogenic Methanomicrobiales (5.2%) and Methanosar-cinales (4.5%) and unassigned Archaea (30.5%) were also recov-ered. Moreover, ANME-1 abundance approached 1% at a depthof 50 m and remained present throughout the monimolimnion.
Cooccurrence analysis. To identify putative interactions be-tween microbial community members in the Sakinaw Lake watercolumn, we constructed a cooccurrence network. The resultingnetwork contained 130,101 positively correlated cooccurrences(edges) between 1,528 OTUs (nodes) and was composed of fourmodules corresponding to previously defined water column com-partments. Twenty-two OTUs in the network contained �1,000reads, and collectively, these OTUs represented 40% of total readsin the network (Fig. 5A). Three of these OTUs were indicators forthe mixolimnion, one was a multilevel indicator for the mixolim-nion and upper part of the transition zone, eight were multilevelindicators for the lower part of the transition zone and moni-molimnion, and four were multilevel indicators for the upper partof the transition zone, lower part of the transition zone, and moni-molimnion (see Fig. S2 and Table S8 in the supplemental mate-rial). Eight of the multilevel indicators revealed highest abundancein the monimolimnion and displayed a unique correlation patternthat was not observed for other abundant OTUs in the network.Closer inspection of these OTUs revealed linkages between OP8,OP9/JS1, OD1, WWE1, Chloroflexi, Methanomicrobiales, Metha-nosarcinales, and one unassigned archaeal OTU (Fig. 5B). Previ-ous studies have posited a role for OP8, OP9/JS1, OD1, WWE1,and Chloroflexi in providing methanogenic substrates, specificallyacetate and hydrogen (3, 5, 6, 11, 47).
Linkages between OP8, OP9/JS1, and hydrogenotrophic metha-nogenic Methanomicrobiales in the monimolimnion are consistentwith interspecies hydrogen transfer and competition for acetate
during syntrophic acetate oxidation (SAO). In support of this ob-servation, no linkages were observed between OP8 and OP9/JS1 orbetween OP8, OP9/JS1, and aceticlastic methanogens affiliatedwith Methanosarcinales. Conversely, linkages between WWE1,Methanomicrobiales, and Methanosarcinales suggest that this can-didate division is unlikely to perform SAO. To validate networkresults, we evaluated whether publicly available near-complete(see also Table S9 in the supplemental material) Sakinaw LakeOP8, OP9/JS1, and WWE1 SAGs encode components of theWood-Ljungdahl pathway, which is proposed to run in reverseduring SAO (2). Candidate divisions OP8 and OP9/JS1 harboreda complete set of genes encoding the carbonyl and methylbranches of the Wood-Ljungdahl pathway, while WWE1 harboredonly a subset, including genes encoding 5,10-methylene-tetrahydro-folate dehydrogenase/methenyl tetrahydrofolate cyclohydrolase andCO-dehydrogenase/acetyl coenzyme A (acetyl-CoA) synthase (Fig.5C) (48).
DISCUSSION
The water column in Sakinaw Lake (British Columbia, Canada) isa highly stratified ecosystem, in which microbial communitymembers partition into distinct subpopulations on the basis ofwater column redox gradients. This stratification is stabilized by asteep salinity gradient that persists below the oxygen interface.Richness estimates revealed higher diversity in the redox transi-tion zone and monimolimnion than in the mixolimnion, which islikely supported by a continuous supply of nutrients and sub-strates as previously described for other stratified lakes (49, 50).Microbial community cluster analysis mirrored patterns observedfor physicochemical parameters. This distribution pattern pro-motes hypotheses related to redox-driven niche partitioning andmetabolic coupling in the Sakinaw Lake water column.
The microbial community structure in the oxygen-rich, sunlit,and entirely fresh mixolimnion (5 m to 30 m) is dominated byActinobacteria, Cyanobacteria, and Alphaproteobacteria affiliatedwith SAR11 consistent with other freshwater ecosystems recentlydescribed by Newton and colleagues (51). Moreover, eukaryoticOTUs ware also abundant in surface waters and strong correla-tions (Spearmann’s rank correlations of �0.99) between SAR11and eukaryotic opisthokonta as well as SAR supergroup OTUswere identified, indicating potential grazing relationships.
The microaerophilic upper part of the redox transition zone(between 33 and 45 m deep) provides a habitat for abundant aer-obic methane oxidizers affiliated with the Methylococcales (22.4%at a depth of 33 m). As O2 concentrations decrease below 33 m,Proteobacteria abundance increases, consistent with patterns ob-served in other meromictic lake ecosystems (17, 45, 52–54). Atdepths between 33 and 36 m, where concentrations of SO4
2�, Fe,and Mn are at their highest, OTUs affiliated with putative sulfate-reducing Deltaproteobacteria are abundant. Interestingly, candi-date phylum RF3 OTUs increased between 36 and 40 m within theSMTZ. In marine sediments, the anaerobic oxidation of methane(AOM) is associated with similar gradients of H2S and CH4 (55).AOM is driven by syntrophic interactions between sulfate-reduc-ing bacteria (SRB) and ANME (56, 57). While no genomic se-quence information is currently available for RF3, its niche in theSakinaw Lake water column suggests a potential role in sulfur ormethane cycling. Moreover, OTUs affiliated with ANME-1 wererecovered from the rare biosphere in the upper part of the redox
Gies et al.
6814 aem.asm.org Applied and Environmental Microbiology
on May 7, 2018 by guest
http://aem.asm
.org/D
ownloaded from

CH3
-COOH
4[H2]
CH3
CH3-H4folate
CH2-H4folate
COOH
CO2
CH-H4folate
1
2
3
CH3-CO~CoA
4
5
6
7HCO-H4folate
CO2
CO2
CH3-CO
MethanomicrobialesH2
CH4
Methanosarcinales
CH4
CH3
-COOH
interspecies H2 transfer
OP9/JS1
OP8
OD1
Methanomicrobiales
Chloroflexi, GIF9
unassigned Archaeon
WWE1
Methanosarcinales
Methanosarcinales
unassigned Archaeon
Chloroflexi, GIF9
Chloroflexi, GIF9
Bacteriodetes
unassigned Archaeon unassigned Archaeon
Methanomicrobiales
SAR11
Syntrophobacterales
Eukaryote
Eukaryote
Reads1000 2000 4000 5000
e
e
A
C
Water compartments: mixolimnion monimolimnion
OP9/JS1
OP8
OD1
Chloroflexi, GIF9
unassigned Archaeon
WWE1
Methanosarcinales
MethanomicrobialesCH4
C3H7COOHC2H5COOH/
H2
B
CH3
-COOH
CH3-COOH
CH3-COOH
CO2,H2
CO2, H2
CH3-COOH CH4
8
0
FIG 5 (A) Cooccurrence network depicting OTUs present in at least three samples with a minimum of 10 reads using Spearman’s rank correlations at a correlationcoefficient of 0.99. To better resolve potential interdependencies between abundant indicator OTUs (indicator OTUs were marked with boldface letters) and otherabundant OTUs (�1,000 reads), associated nodes were presented outside the main network, without altering edge sets. Edges that connected these 22 nodes to nodes inthe main network are colored blue. (B) Eight of the most prevalent multilevel indicators in the monimolimnion displayed a unique correlation pattern that was notobserved for other abundant OTUs in the network. (C) Single amplified genomes affiliated with OP9/JS1 and OP8 encode all components of the Wood-Ljungdahlpathway. The components of the Wood-Ljungdahl pathway are as follows: compound 1/2, CO dehydrogenase/acetyl-CoA synthase; compound 3, trimethylamine:corrinoid methyltransferase; compound 4, ATP:corrinoid adenosyltransferase; compound 5, methylenetetrahydrofolate reductase; compound 6, 5,10-methylene-tetrahydrofolate dehydrogenase/methenyl tetrahydrofolate cyclohydrolase; compound 7, formyltetrahydrofolate synthetase; compound 8, formate dehydrogenase. Incontrast, WWE1 genomes harbored genes for the carbonyl branch of the Wood-Ljungdahl pathway. The components of the carbonyl branch of the Wood-Ljungdahlpathway are as follows: compound 1/2, CO dehydrogenase/acetyl-CoA synthase; compound 3, 5,10-methylene-tetrahydrofolate dehydrogenase/methenyl tetrahydro-folate cyclohydrolase. Additionally, WWE1 encodes compound 0 (ADP-forming acetyl-CoA synthase).
November 2014 Volume 80 Number 21 aem.asm.org 6815
on May 7, 2018 by guest
http://aem.asm
.org/D
ownloaded from

transition zone and increased in abundance within the moni-molimnion, consistent with water column AOM potential.
As the water becomes more sulfidic in the lower part of theredox transition zone between 50 and 55 m and the monimolim-nion between 60 and 120 m, the diversity and abundance ofMDM, with the potential to mediate cometabolic or syntrophicinteractions, increases (3–6). With more than 25 candidate divi-sions accounting for 40% of SSU rRNA gene sequences and highnumbers of unassigned Archaea, MDM enrichment in SakinawLake is unprecedented. Abundant bacterial candidate divisionswere affiliated with OD1, OP3, OP8, OP9/JS1, OP11, and WWE1.With the exception of WWE1, all of these candidate divisions havebeen previously recovered from other meromictic lake ecosystems(10, 16, 17). Furthermore, genomic potential for OD1, OP3, OP9/JS1, and OP11 has been recently inferred from metagenomic orsingle-cell genomic approaches (3, 6, 58, 59).
Metagenomic reconstruction of OD1 and OP11 genomes re-vealed the potential for fermentative metabolism as well as poly-sulfide reduction to H2S (6). Perry inspected sulfur chemistry inSakinaw Lake in the early 1990s and reported a remarkably highconcentration of polysulfide below the oxygen-sulfide interface(40). Based on this evidence, OD1 and OP11 could contribute tothe high H2S concentrations in Sakinaw Lake through polysulfidereduction. Candidate division OP3 has been proposed to be mag-netotactic with the ability for anaerobic respiration (58, 59). Theavailability of alternative TEAs in Sakinaw Lake is restricted to theredox transition zone, suggesting that OP3 in the monimolimnioncould encode an alternative energy metabolism to previouslystudied OP3 genomes. The genomic potential for OP9/JS1 recov-ered from hot spring sediments revealed a saccharolytic, fermen-tative lifestyle with the potential for cellulose degradation and hy-drogen production (3). In contrast, enrichment cultures fromacetate-amended sulfate-rich, anoxic marine sediments revealed[13C]acetate uptake by OP9/JS1 (60). On the basis of these obser-vations, Webster and colleagues (60) suggested that OP9/JS1could be acetate oxidizers using SO4
2� as a terminal electron ac-ceptor. In Sakinaw Lake, this would be possible only in the upperpart of the redox transition zone where SO4
2� is available suggest-ing a fermentative lifestyle below the transition zone. In support ofthis conclusion, sulfate-reducing genes such as dsr could not berecovered from recently published OP9/JS1 SAGs from SakinawLake (2).
In addition to bacterial candidate divisions, Chloroflexi andmethanogenic Archaea affiliated with Methanomicrobiales andMethanosarcinales are abundant in the lower part of the redoxtransition zone and monimolimnion. In many aquatic ecosys-tems, sediments are considered the main source of CH4 produc-tion. However, the potential role of water column methanogenesisin Sakinaw Lake should not be underestimated and has been pre-viously reported for other meromictic lakes. Under methanogenicconditions, microbial communities commonly consist of primaryand secondary fermenting bacteria, which degrade polymeric sub-strates into hydrogen (H2), carbon dioxide (CO2), and organicacids, including acetate, formate, propionate, and butyrate. Thesesubstrates in turn are used by hydrogenotrophic and aceticlasticmethanogens to convert CO2 and acetate, respectively, into meth-ane (61). Energy yields during the degradation of organic mat-ter into CH4 are low, and syntrophic interactions betweencommunity members are needed to make the process energet-ically more favorable (62). A common strategy used by well-
studied syntrophs affiliated with the Syntrophobacterales and hy-drogenotrophic methanogens is to overcome energy constraintsby interspecies hydrogen transfer (63, 64). A similar interaction isestablished during syntrophic acetate oxidation (SAO), whereacetogenic bacteria are proposed to run the Wood-Ljungdahl cy-cle in reverse while transferring four hydrogen molecules to meth-anogens (48).
Consistent with syntrophic growth modes associated with wa-ter column methanogenesis, Syntrophobacterales and Methanomi-crobiales were abundant in the lower part of the transition zoneand monimolimnion of Sakinaw Lake. Moreover, several MDM,including WWE1, OP9/JS1, OP8, and OD1 manifested statisti-cally significant cooccurrence (Spearman’s rank correlations of�0.99) patterns among themselves and between known methano-gens and putative fermentative Chloroflexi (5, 6, 47). These cooc-currence patterns are consistent with syntrophic interactions driv-ing interspecies hydrogen transfer between OP8, OP9/JS1, andMethanomicrobiales as well as competition for acetate betweenOP8, OP9/JS1, and Methanosarcinales. Metabolic reconstructionfocused on the Wood-Ljungdahl pathway using recently pub-lished Sakinaw Lake OP8 and OP9/JS1 SAG sequences revealedcomplete pathway coverage in both candidate divisions with thepotential to mediate SAO. In contrast, 5,10-methylene-tetrahy-drofolate dehydrogenase/methenyl tetrahydrofolate cyclohydro-lase and CO dehydrogenase/acetyl-CoA synthase were the onlyWood-Ljungdahl pathway components identified in WWE1.Given that WWE1, but not OP8 and OP9/JS1, were linked toaceticlastic methanogens in the network, we suggest that this can-didate division has the potential to produce acetate as a metabolicend product from butyrate oxidation, as recently proposed forWWE1 in a terephthalate-degrading methanogenic bioreactor(11). Syntrophic acetate oxidation has been speculated to be animportant syntrophic pathway in methanogenic bioreactors (48,65). The Sakinaw Lake water column thereby provides an inter-esting convergence of natural and engineered ecosystems with po-tential applications for design and operation of anaerobic biore-actors built for bioremediation and energy generation.
In conclusion, Sakinaw Lake is a model ecosystem in which tostudy population structure and metabolic potential of MDM. Bycombining cooccurrence networks with SAG-enabled metabolicreconstruction, we posit that SAO in the monimolimnion islinked to active methane cycling. Network analysis has previouslybeen combined with biogeochemical measurements to predictphysiology and function of candidate divisions (66); however, toour knowledge, this study is the first to reconstruct syntrophicrelationships based on convergent cooccurrence patterns and sin-gle-cell genomic evidence. Process-oriented studies combinedwith phylogenetic staining and high-spatial-resolution secondaryion mass spectrometry (NanoSIMs) are now needed to validatepredicted syntrophic interactions and provide quantitative in-sights into methane cycling within the Sakinaw Lake water col-umn.
ACKNOWLEDGMENTS
We thank Chris Payne, Elena Zaikova, and Craig Mewis for technicalsupport in the field, Eugene Kuatsjah and Sam Kheirandish for help insample processing, and all members of the Hallam, Crowe, and Pawlowiczlaboratories for helpful comments along the way. We also thank ChristianRinke at the Joint Genome Institute for help with the taxonomic assign-ments of MDM groups.
Gies et al.
6816 aem.asm.org Applied and Environmental Microbiology
on May 7, 2018 by guest
http://aem.asm
.org/D
ownloaded from

This work was performed under the auspices of the Natural Sciencesand Engineering Research Council (NSERC) of Canada, Canada Founda-tion for Innovation (CFI), and the Canadian Institute for Advanced Re-search (CIFAR) through grants awarded to S.J.H. and J.T.B. K.M.K wassupported by the Tula Foundation-funded Centre for Microbial Diversityand Evolution, and E.A.G. was supported by a 4-year fellowship (4YF)from the University of British Columbia.
We declare that we have no conflicts of interest.
REFERENCES1. Hugenholtz P, Kyrpides NC. 2009. A changing of the guard. Environ. Mi-
crobiol. 11:551–553. http://dx.doi.org/10.1111/j.1462-2920.2009.01888.x.2. Rinke C, Schwientek P, Sczyrba A, Ivanova NN, Anderson IJ, Cheng JF,
Darling A, Malfatti S, Swan BK, Gies EA, Dodsworth JA, Hedlund BP,Tsiamis G, Sievert SM, Liu WT, Eisen JA, Hallam SJ, Kyrpides NC,Stepanauskas R, Rubin EM, Hugenholtz P, Woyke T. 2013. Insights intothe phylogeny and coding potential of microbial dark matter. Nature 499:431– 437. http://dx.doi.org/10.1038/nature12352.
3. Dodsworth JA, Blainey PC, Murugapiran SK, Swingley WD, Ross CA,Tringe SG, Chain PS, Scholz MB, Lo CC, Raymond J, Quake SR,Hedlund BP. 2013. Single-cell and metagenomic analyses indicate a fer-mentative and saccharolytic lifestyle for members of the OP9 lineage. Nat.Commun. 4:1854. http://dx.doi.org/10.1038/ncomms2884.
4. Pelletier E, Kreimeyer A, Bocs S, Rouy Z, Gyapay G, Chouari R, RiviereD, Ganesan A, Daegelen P, Sghir A, Cohen GN, Medigue C, Weissen-bach J, Le Paslier D. 2008. “Candidatus Cloacamonas acidaminovorans”:genome sequence reconstruction provides a first glimpse of a new bacte-rial division. J. Bacteriol. 190:2572–2579. http://dx.doi.org/10.1128/JB.01248-07.
5. Wrighton KC, Castelle CJ, Wilkins MJ, Hug LA, Sharon I, Thomas BC,Handley KM, Mullin SW, Nicora CD, Singh A, Lipton MS, Long PE,Williams KH, Banfield JF. 2014. Metabolic interdependencies betweenphylogenetically novel fermenters and respiratory organisms in an uncon-fined aquifer. ISME J. 8:1452–1463. http://dx.doi.org/10.1038/ismej.2013.249.
6. Wrighton KC, Thomas BC, Sharon I, Miller CS, Castelle CJ, VerBerk-moes NC, Wilkins MJ, Hettich RL, Lipton MS, Williams KH, Long PE,Banfield JF. 2012. Fermentation, hydrogen, and sulfur metabolism inmultiple uncultivated bacterial phyla. Science 337:1661–1665. http://dx.doi.org/10.1126/science.1224041.
7. Cordero OX, Ventouras LA, DeLong EF, Polz MF. 2012. Public gooddynamics drive evolution of iron acquisition strategies in natural bacte-rioplankton populations. Proc. Natl. Acad. Sci. U. S. A. 109:20059 –20064.http://dx.doi.org/10.1073/pnas.1213344109.
8. Morris JJ, Lenski RE, Zinser ER. 2012. The Black Queen hypothesis:evolution of dependencies through adaptive gene loss. mBio 3(2):e00036-12. http://dx.doi.org/10.1128/mBio.00036-12.
9. Haruta S, Kato S, Yamamoto K, Igarashi Y. 2009. Intertwined interspe-cies relationships: approaches to untangle the microbial network.Environ. Microbiol. 11:2963–2969. http://dx.doi.org/10.1111/j.1462-2920.2009.01956.x.
10. Borrel G, Lehours AC, Bardot C, Bailly X, Fonty G. 2010. Members ofcandidate divisions OP11, OD1 and SR1 are widespread along the watercolumn of the meromictic Lake Pavin (France). Arch. Microbiol. 192:559 –567. http://dx.doi.org/10.1007/s00203-010-0578-4.
11. Lykidis A, Chen CL, Tringe SG, McHardy AC, Copeland A, KyrpidesNC, Hugenholtz P, Macarie H, Olmos A, Monroy O, Liu WT. 2011.Multiple syntrophic interactions in a terephthalate-degrading methano-genic consortium. ISME J. 5:122–130. http://dx.doi.org/10.1038/ismej.2010.125.
12. Rybak M, Dickman M. 1988. Paleoecological reconstruction of changesin the productivity of a small, meromictic lake in southern Ontario, Can-ada. Hydrobiologia 169:293–306. http://dx.doi.org/10.1007/BF00007552.
13. Boehrer B, Schultze M. 2008. Stratification of lakes. Rev. Geophys. 46:RG2005. http://dx.doi.org/10.1029/2006RG000210.
14. Hakala A. 2004. Meromixis as a part of lake evolution - observations anda revised classification of true meromictic lakes in Finland. Boreal Envi-ron. Res. 9:37–53.
15. Lehours AC, Evans P, Bardot C, Joblin K, Gerard F. 2007. Phylogeneticdiversity of archaea and bacteria in the anoxic zone of a meromictic lake(Lake Pavin, France). Appl. Environ. Microbiol. 73:2016 –2019. http://dx.doi.org/10.1128/AEM.01490-06.
16. Klepac-Ceraj V, Hayes CA, Gilhooly WP, Lyons TW, Kolter R, PearsonA. 2012. Microbial diversity under extreme euxinia: Mahoney Lake, Can-ada. Geobiology 10:223–235. http://dx.doi.org/10.1111/j.1472-4669.2012.00317.x.
17. Comeau AM, Harding T, Galand PE, Vincent WF, Lovejoy C. 2012.Vertical distribution of microbial communities in a perennially stratifiedArctic lake with saline, anoxic bottom waters. Sci. Rep. 2:604. http://dx.doi.org/10.1038/srep00604.
18. Zaikova E, Walsh DA, Stilwell CP, Mohn WW, Tortell PD, Hallam SJ.2010. Microbial community dynamics in a seasonally anoxic fjord:Saanich Inlet, British Columbia. Environ. Microbiol. 12:172–191. http://dx.doi.org/10.1111/j.1462-2920.2009.02058.x.
19. DeLong EF, Preston CM, Mincer T, Rich V, Hallam SJ, Frigaard NU,Martinez A, Sullivan MB, Edwards R, Brito BR, Chisholm SW, KarlDM. 2006. Community genomics among stratified microbial assemblagesin the ocean’s interior. Science 311:496 –503. http://dx.doi.org/10.1126/science.1120250.
20. Wright JJ, Lee S, Zaikova E, Walsh DA, Hallam SJ. 2009. DNA extrac-tion from 0.22 microM Sterivex filters and cesium chloride density gradi-ent centrifugation. J. Vis. Exp. 2009(31):pii1352. http://dx.doi.org/10.3791/1352.
21. Intergovernmental Oceanographic Commission. 2010. The interna-tional thermodynamic equation of seawater – 2010: calculation and use ofthermodynamic properties. Manuals and guides 56. IntergovernmentalOceanographic Commission (IOC), United Nations Educational, Scien-tific and Cultural Organization (UNESCO), Paris, France.
22. Winkler LW. 1888. Die Bestimmung des in Wasser gelösten Sauerstoffen.Ber. Dtsch. Chem. Ges. 21:2843–2855.
23. Cline JD. 1968. Spectrophotometric determination of hydrogensulfide innatural waters. Limnol. Oceanogr. 14:454 – 458.
24. Clesceri LS, Greenberg AE, Eaton AD (ed). 1999. Standard methods forthe examination of water and wastewater, 20th ed. American PublicHealth Association, Washington, DC.
25. US Environmental Protection Agency. 1994. Method 200.8. Determina-tion of trace elements in waters and wastes by inductively coupled plasma- mass spectrometry. Environmental Monitoring Systems Laboratory, Of-fice of Research and Development, US Environmental Protection Agency,Cincinnati, OH.
26. Engelbrektson A, Kunin V, Wrighton KC, Zvenigorodsky N, Chen F,Ochman H, Hugenholtz P. 2010. Experimental factors affecting PCR-based estimates of microbial species richness and evenness. ISME J. 4:642–647. http://dx.doi.org/10.1038/ismej.2009.153.
27. Caporaso JG, Kuczynski J, Stombaugh J, Bittinger K, Bushman FD,Costello EK, Fierer N, Pena AG, Goodrich JK, Gordon JI, Huttley GA,Kelley ST, Knights D, Koenig JE, Ley RE, Lozupone CA, McDonald D,Muegge BD, Pirrung M, Reeder J, Sevinsky JR, Turnbaugh PJ, WaltersWA, Widmann J, Yatsunenko T, Zaneveld J, Knight R. 2010. QIIMEallows analysis of high-throughput community sequencing data. Nat.Methods 7:335–336. http://dx.doi.org/10.1038/nmeth.f.303.
28. Quast C, Pruesse E, Yilmaz P, Gerken J, Schweer T, Yarza P, Peplies J,Glockner FO. 2013. The SILVA ribosomal RNA gene database project:improved data processing and web-based tools. Nucleic Acids Res. 41:D590 –D596. http://dx.doi.org/10.1093/nar/gks1219.
29. DeSantis TZ, Hugenholtz P, Larsen N, Rojas M, Brodie EL, Keller K,Huber T, Dalevi D, Hu P, Andersen GL. 2006. Greengenes, a chimera-checked 16S rRNA gene database and workbench compatible with ARB.Appl. Environ. Microbiol. 72:5069 –5072. http://dx.doi.org/10.1128/AEM.03006-05.
30. Altschul SF, Gish W, Miller W, Myers EW, Lipman DJ. 1990. Basic localalignment search tool. J. Mol. Biol. 215:403– 410.
31. Youssef NH, Ashlock-Savage KN, Elshahed MS. 2012. Phylogeneticdiversities and community structure of members of the extremely halo-philic Archaea (order Halobacteriales) in multiple saline sediment habi-tats. Appl. Environ. Microbiol. 78:1332–1344. http://dx.doi.org/10.1128/AEM.07420-11.
32. Li W, Godzik A. 2006. Cd-hit: a fast program for clustering and compar-ing large sets of protein or nucleotide sequences. Bioinformatics 22:1658 –1659. http://dx.doi.org/10.1093/bioinformatics/btl158.
33. McCune B, Grace JB. 2002. Analysis of ecological communities. MjMSoftware Design, Gleneden Beach, OR.
34. Guler C, Thyne GD, McCray JE, Turner AK. 2002. Evaluation of graph-ical and multivariate statistical methods for classification of water chem-
Candidate Divisions Form Syntrophic Networks
November 2014 Volume 80 Number 21 aem.asm.org 6817
on May 7, 2018 by guest
http://aem.asm
.org/D
ownloaded from

istry data. Hydrogeol. J. 10:455– 474. http://dx.doi.org/10.1007/s10040-002-0196-6.
35. Dufrene M, Legendre P. 1997. Species assemblages and indicator species:the need for a flexible asymmetrical approach. Ecol. Monogr. 67:345–366.
36. De Caceres M, Legendre P, Moretti M. 2010. Improving indicatorspecies analysis by combining groups of sites. Oikos 119:1674 –1684. http://dx.doi.org/10.1111/j.1600-0706.2010.18334.x.
37. Shannon P, Markiel A, Ozier O, Baliga NS, Wang JT, Ramage D, AminN, Schwikowski B, Ideker T. 2003. Cytoscape: a software environment forintegrated models of biomolecular interaction networks. Genome Res.13:2498 –2504. http://dx.doi.org/10.1101/gr.1239303.
38. Clague JJ, James TS. 2002. History and isostatic effects of the last ice sheetin southern British Columbia. Quaternary Sci. Rev. 21:71– 87. http://dx.doi.org/10.1016/S0277-3791(01)00070-1.
39. Vagle S, Hume J, McLaughlin F, MacIsaac E, Shortreed K. 2010. Amethane bubble curtain in meromictic Sakinaw Lake, British Columbia.Limnol. Oceanogr. 55:1313–1326. http://dx.doi.org/10.4319/lo.2010.55.3.1313.
40. Perry KA. 1990. The chemical limnology of two meromictic lakes withemphasis on pyrite formation. Ph.D. thesis. University of British Colum-bia, Vancouver, Canada.
41. Shade A, Jones SE, Caporaso JG, Handelsman J, Knight R, Fierer N,Gilbert JA. 2014. Conditionally rare taxa disproportionately contribute totemporal changes in microbial diversity. mBio 5(4):e01371-14. http://dx.doi.org/10.1128/mBio.01371-14.
42. Bell EM, Laybourn-Parry J. 1999. Annual plankton dynamics in an Ant-arctic saline lake. Freshwater Biol. 41:507–519. http://dx.doi.org/10.1046/j.1365-2427.1999.00396.x.
43. Garcia-Gil LJ, Vicente E, Camacho A, Borrego CM, Vila X, CristinaXP, Rodriguez-Gonzalez J. 1999. Vertical distribution of photosyn-thetic sulphur bacteria linked to saline gradients in Lake ‘El Tobar’(Cuenca, Spain). Aquatic Microb. Ecol. 20:299 –303. http://dx.doi.org/10.3354/ame020299.
44. Gregersen LH, Habicht KS, Peduzzi S, Tonolla M, Canfield DE, MillerM, Cox RP, Frigaard NU. 2009. Dominance of a clonal green sulfurbacterial population in a stratified lake. FEMS Microbiol. Ecol. 70(1):30 –41. http://dx.doi.org/10.1111/j.1574-6941.2009.00737.x.
45. Pasche N, Schmid M, Vazquez F, Schubert CJ, Wuest A, Kessler JD,Pack MA, Reeburgh WS, Burgmann H. 2011. Methane sources and sinksin Lake Kivu. J. Geophys. Res. 116:G03006. http://dx.doi.org/10.1029/2011JG001690.
46. Lehours AC, Bardot C, Thenot A, Debroas D, Fonty G. 2005. Anaerobicmicrobial communities in Lake Pavin, a unique meromictic lake inFrance. Appl. Environ. Microbiol. 71:7389 –7400. http://dx.doi.org/10.1128/AEM.71.11.7389-7400.2005.
47. Hug LA, Castelle CJ, Wrighton KC, Thomas BC, Sharon I, FrischkornKR, Williams KH, Tringe SG, Banfield JF. 2013. Community genomicanalyses constrain the distribution of metabolic traits across the Chloro-flexi phylum and indicate roles in sediment carbon cycling. Microbiome1:22. http://dx.doi.org/10.1186/2049-2618-1-22.
48. Muller B, Sun L, Schnurer A. 2013. First insights into the syntrophicacetate-oxidizing bacteria–a genetic study. MicrobiologyOpen 2:35–53.http://dx.doi.org/10.1002/mbo3.50.
49. Shade A, Read JS, Welkie DG, Kratz TK, Wu CH, McMahon KD. 2011.Resistance, resilience and recovery: aquatic bacterial dynamics after watercolumn disturbance. Environ. Microbiol. 13:2752–2767. http://dx.doi.org/10.1111/j.1462-2920.2011.02546.x.
50. Shade A, Read JS, Youngblut ND, Fierer N, Knight R, Kratz TK, LottigNR, Roden EE, Stanley EH, Stombaugh J, Whitaker RJ, Wu CH,McMahon KD. 2012. Lake microbial communities are resilient after awhole-ecosystem disturbance. ISME J. 6:2153–2167. http://dx.doi.org/10.1038/ismej.2012.56.
51. Newton RJ, Jones SE, Eiler A, McMahon KD, Bertilsson S. 2011. A guideto the natural history of freshwater lake bacteria. Microbiol. Mol. Biol.Rev. 75:14 – 49. http://dx.doi.org/10.1128/MMBR.00028-10.
52. Biderre-Petit C, Jezequel D, Dugat-Bony E, Lopes F, Kuever J, Borrel G,Viollier E, Fonty G, Peyret P. 2011. Identification of microbial commu-nities involved in the methane cycle of a freshwater meromictic lake.FEMS Microbiol. Ecol. 77:533–545. http://dx.doi.org/10.1111/j.1574-6941.2011.01134.x.
53. Peduzzi S, Tonolla M, Hahn D. 2003. Vertical distribution of sulfate-reducing bacteria in the chemocline of Lake Cadagno, Switzerland, overan annual cycle. Aquat. Microb. Ecol. 30:295–302. http://dx.doi.org/10.3354/ame030295.
54. Tonolla M, Peduzzi S, Demarta A, Peduzzi R, Hahn D. 2004. Photo-tropic sulfur and sulfate-reducing bacteria in the chemocline of meromic-tic Lake Cadagno, Switzerland. J. Limnol. 63:161–170. http://dx.doi.org/10.4081/jlimnol.2004.161.
55. Knittel K, Boetius A. 2009. Anaerobic oxidation of methane: progresswith an unknown process. Annu. Rev. Microbiol. 63:311–334. http://dx.doi.org/10.1146/annurev.micro.61.080706.093130.
56. Hallam SJ, Girguis PR, Preston CM, Richardson PM, DeLong EF. 2003.Identification of methyl coenzyme M reductase A (mcrA) genes associatedwith methane-oxidizing archaea. Appl. Environ. Microbiol. 69:5483–5491. http://dx.doi.org/10.1128/AEM.69.9.5483-5491.2003.
57. Hallam SJ, Putnam N, Preston CM, Detter JC, Rokhsar D, RichardsonPM, DeLong EF. 2004. Reverse methanogenesis: testing the hypothesiswith environmental genomics. Science 305:1457–1462. http://dx.doi.org/10.1126/science.1100025.
58. Glockner J, Kube M, Shrestha PM, Weber M, Glockner FO, ReinhardtR, Liesack W. 2010. Phylogenetic diversity and metagenomics of candi-date division OP3. Environ. Microbiol. 12:1218 –1229. http://dx.doi.org/10.1111/j.1462-2920.2010.02164.x.
59. Kolinko S, Jogler C, Katzmann E, Wanner G, Peplies J, Schuler D. 2012.Single-cell analysis reveals a novel uncultivated magnetotactic bacteriumwithin the candidate division OP3. Environ. Microbiol. 14:1709 –1721.http://dx.doi.org/10.1111/j.1462-2920.2011.02609.x.
60. Webster G, Watt LC, Rinna J, Fry JC, Evershed RP, Parkes RJ, Weight-man AJ. 2006. A comparison of stable-isotope probing of DNA and phos-pholipid fatty acids to study prokaryotic functional diversity in sulfate-reducing marine sediment enrichment slurries. Environ. Microbiol.8:1575–1589. http://dx.doi.org/10.1111/j.1462-2920.2006.01048.x.
61. Sieber JR, McInerney MJ, Gunsalus RP. 2012. Genomic insights intosyntrophy: the paradigm for anaerobic metabolic cooperation. Annu.Rev. Microbiol. 66:429–452. http://dx.doi.org/10.1146/annurev-micro-090110-102844.
62. Schink B. 1997. Energetics of syntrophic cooperation in methanogenicdegradation. Microbiol. Mol. Biol. Rev. 61:262–280.
63. Plugge CM, Zhang W, Scholten JC, Stams AJ. 2011. Metabolic flexibilityof sulfate-reducing bacteria. Front. Microbiol. 2:81. http://dx.doi.org/10.3389/fmicb.2011.00081.
64. Stams AJM, Plugge CM. 2009. Electron transfer in syntrophic commu-nities of anaerobic bacteria and archaea. Nat. Rev. Microbiol. 7:568 –577.http://dx.doi.org/10.1038/nrmicro2166.
65. Karakashev D, Batstone DJ, Trably E, Angelidaki I. 2006. Acetateoxidation is the dominant methanogenic pathway from acetate in theabsence of Methanosaetaceae. Appl. Environ. Microbiol. 72:5138 –5141.http://dx.doi.org/10.1128/AEM.00489-06.
66. Peura S, Eiler A, Bertilsson S, Nykanen H, Tiirola M, Jones RI. 2012.Distinct and diverse anaerobic bacterial communities in boreal lakes dom-inated by candidate division OD1. ISME J. 6:1640 –1652. http://dx.doi.org/10.1038/ismej.2012.21.
Gies et al.
6818 aem.asm.org Applied and Environmental Microbiology
on May 7, 2018 by guest
http://aem.asm
.org/D
ownloaded from