illuminating clay: a 3-d tangible interface for landscape
TRANSCRIPT
Illuminating Clay: A 3-D Tangible Interface for Landscape Analysis
Ben Piper, Carlo Ratti* and Hiroshi Ishii
Tangible Media Group MIT Media Laboratory Cambridge, Mass. USA
{benpiper,ratti,ishii}@media.mit.edu
ABSTRACT This paper describes a novel system for the real-time computational analysis of landscape models. Users of the system – called Illuminating Clay – alter the topography of a clay landscape model while the changing geometry is captured in real-time by a ceiling-mounted laser scanner. A depth image of the model serves as an input to a library of landscape analysis functions. The results of this analysis are projected back into the workspace and registered with the surfaces of the model.
We describe a scenario for which this kind of tool has been developed and we review past work that has taken a similar approach. We describe our system architecture and highlight specific technical issues in its implementation.
We conclude with a discussion of the benefits of the system in combining the tangible immediacy of physical models with the dynamic capabilities of computational simulations.
Keywords Tangible user interface, 3D laser scanner, landscape design, physical models, GIS, DEM
SCENARIO A group of road builders, environmental engineers and landscape designers stand at an ordinary table on which is placed a clay model of a particular site in the landscape. Their task is to design the course of a new roadway, housing complex and parking area that will satisfy engineering, environmental and aesthetic requirements.
Using her finger the engineer flattens out the side of a hill in the model to provide a flat plane for an area of car parking. As she does so an area of yellow illumination appears in another part of the model. The environmental engineer points out that this indicates a region of possible landslide caused by the change in the terrain and resulting flow of water. The landscape designer suggests that this landslide could be avoided by adding a raised earth mound around the car park. The group tests the hypothesis by adding material to the model and all three observe the resulting effect on the stability of the slope.
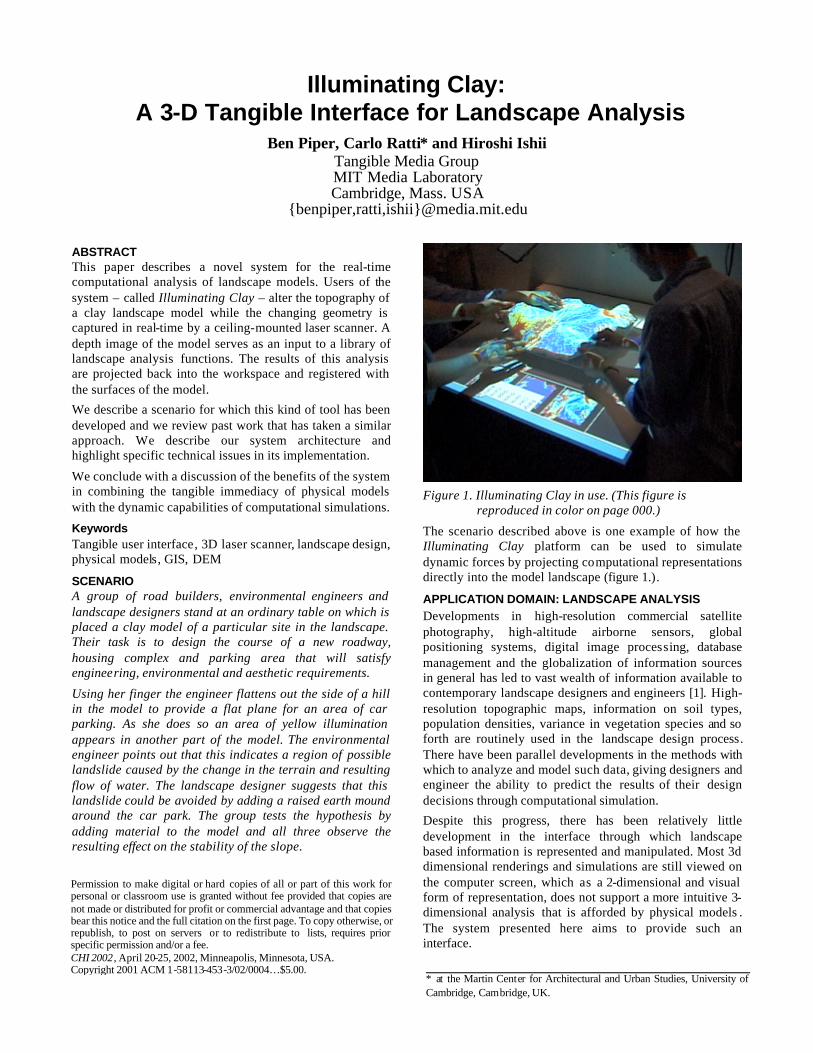
Figure 1. Illuminating Clay in use. (This figure is
reproduced in color on page 000.)
The scenario described above is one example of how the Illuminating Clay platform can be used to simulate dynamic forces by projecting computational representations directly into the model landscape (figure 1.).
APPLICATION DOMAIN: LANDSCAPE ANALYSIS Developments in high-resolution commercial satellite photography, high-altitude airborne sensors, global positioning systems, digital image processing, database management and the globalization of information sources in general has led to vast wealth of information available to contemporary landscape designers and engineers [1]. High-resolution topographic maps, information on soil types, population densities, variance in vegetation species and so forth are routinely used in the landscape design process. There have been parallel developments in the methods with which to analyze and model such data, giving designers and engineer the ability to predict the results of their design decisions through computational simulation.
Despite this progress, there has been relatively little development in the interface through which landscape based information is represented and manipulated. Most 3d dimensional renderings and simulations are still viewed on the computer screen, which as a 2-dimensional and visual form of representation, does not support a more intuitive 3-dimensional analysis that is afforded by physical models . The system presented here aims to provide such an interface.
Permission to make digital or hard copies of all or part of this work for personal or classroom use is granted without fee provided that copies are not made or distributed for profit or commercial advantage and that copies bear this notice and the full citation on the first page. To copy otherwise, or republish, to post on servers or to redistribute to lists, requires prior specific permission and/or a fee. CHI 2002 , April 20-25, 2002, Minneapolis, Minnesota, USA. Copyright 2001 ACM 1-58113-453-3/02/0004…$5.00.
* at the Martin Center for Architectural and Urban Studies, University of Cambridge, Cambridge, UK.

Landscape design and engineering, by definition, occurs over large areas and requires the input of a great number of specialists. These include experts in earth engineering, water management, agrarian management, land economy, legal policy and transport infrastructure to name just a few. Furthermore, landscape interventions inevitably affect large numbers of people living perhaps on or near a particular sight. It is often critical for the designers of a landscape project to communicate their vision to the local inhabitants. It is therefore necessary that the tool of the landscape designer and engineer allow various specialists and lay members to participate in a collaborative design process.
Engineers and designers involved in landscape, architectural and industrial projects continue to put great emphasis on the use of physical model making even in a time of increased virtual visualization. Mitchell [2] cites the example of the contemporary designer, Frank Gehry, who insists on using physical models (which are later digitized) in the early stages of design exploration. He points out that automobile designers work extensively with physical, tape and clay models, even while they have access to sophisticated curved-surface modelers.
There is a great efficiency in representing physical structures with physical, tangible media since such models only differ in scale or material from the final outcome of a design. Physical models offer the user an intuitive understanding of complex geometries and physical relationships that are difficult or indeed impossible to describe in any other way.
On the other hand computer based models, while commonly being limited to 2-dimensional, visual representations, offer many advantages over the physical model. The dynamic quality of the screen allows computational systems to represent entities or forces that change over time. They offer a vast increase in the efficiency of production, reproduction and distribution of models. They also offer the ability to work directly with numeric data and at accuracies that far surpass the tolerances of most physical models.
RESEARCH CONTEXT The prevalence of the 2-dimensional computer screen has made it difficult to combine the benefits of physical and digital models in the same representation. However, there has been a long history of interface designs that attempt this goal. Frazer’s Three-Dimensional Data Input Devices [2] and more recently Gorbet’s Triangles [3] have explored approaches to parallel physical/digital interactions. The Tangible User Interface [4] is increasingly accepted as an alternative paradigm to the more conventional Graphical User Interface, where the ability to manipulate objects in space is more fully utilized. Wellner’s Digital Desk [5] illustrates the efficiencies of augmenting paper based office production with digital tools and methods for storage. Similarly Hinckley’s neuro-surgical interface [6] makes the task of exploring the spatial complexities of the human brain, quite literally, child’s play by using a position
tracked doll’s head and knife to allow users to dissect a graphical representation of the brain. There have been a number of impressive developments in combined graphical/physical interactions. Systems such as the Phantom Arm by SensAble [7] when combined with virtual environments or holography [8] allow for highly convincing interactions. Agrawala et al have looked into methods for painting directly on the surfaces of complex 3D geometries [9] while Raskar has looked into the possibilities for animating computational projection [10] and highlighted some of the difficulties that arise when projecting from multiple sources [11]. Special note is due the work of Underkoffler & Ishii, which directly inspired the approach we have taken in Illuminating Clay. The Urban Design Workbench (Urp) [12] uses digitally augmented tagged physical objects to represent buildings that can be rearranged to facilitate the process of urban design.
Each of these approaches illustrates the enhanced interactions that are afforded by the use of tangible objects in human computer interaction. We hope to combine the benefits of these approaches and provide an interface that is truly practical in the context of landscape analysis.
SYSTEM ARCHITECTURE The system consists of a ceiling mounted laser scanner and computer projector (figure 2.). Using an angled mirror the scanner and projector are aligned at the same optical origin and the two devices are calibrated to scan and project over an equal area. This configuration ensures that all the surfaces that are visible to the scanner can also be projected upon. Once calibrated the scanner/projector pair forms a self-contained I/O device that can be installed above any desired workspace with out the need for further calibration.
Figure 2. The Scanner, Projector and Mirror setup
The scanning system used is a VI-900 Minolta triangulation laser scanner [13]. The scanner operates by projecting a near infrared laser stripe over objects in the scene. Distortions in the shape of this stripe are captured by a camera mounted in the scanner, which is offset by a known distance from the source of the laser stripe. The distortions in the stripe are analyzed by the Minolta

firmware and converted, through triangulation, into distance information.
While we considered many alternative approaches for real-time 3D capture, the laser triangulation approach was chosen because it offered a much faster scan rate than time-of-flight laser scanners and greater accuracy than multiple camera based systems. We chose to use a Minolta scanner because of its appropriate scanning range and because it was provided with a software developer’s kit.
System Software The VI -900 is designed to perform single scans of static objects and scenes. In order to capture the changing geometry of the workspace in real time, it was necessary to write a control script (written in collaboration with Joe Calkins of New River Kinematics [15]) to perpetually scan the scene.
Using the control script, we repeatedly scan the workspace to capture 320 x 240 points in 0.3 seconds. The transfer of this data from scanner to processor (via SCSI) adds an additional component to the scan cycle time. We streamlined the transfer time by discarding all color information and transferring only geometric information. This information is converted into x, y and z coordinates and then finally converted into a Digital Elevation Model (DEM), a raster map that represents the altitude of each pixel as a color value.
This DEM is processed by one of a number of landscape analysis functions, which further reduce the scan frequency. Our current scan cycle ranges between 0.9 and 1.5 Hz depending on the complexity of a given analysis function.
Figure 3. System Architecture Diagram
Projector We use a standard Mitsubishi 640 x 480 LCD projector to cast the results of landscape analysis functions back onto the surfaces of the physical model. LCD projection was found to cause less interference with the laser scanner than compact Digital Light Processing (DLP) projectors based on tilting micro-mirror arrays. We believe this is because the DLP projectors we tested cycle through the red, green and blue portions of the spectrum causing interference with the red laser stripe during the red portion of the color cycle.
Worktable The worktable comprises of a smooth white surface suitable for projection and a platform onto which a model of a specific site is placed. This platform can be rotated to the desired viewing angle.
Figure 4. Table and Rotating Platform. (This figure is
reproduced in color on page 000.)
Two sides of the area around the platform are illuminated with thumbnails from a library of landscape analysis functions. These thumbnails remain active, updating with changes in the model, allowing the easy comparison of different landscape analysis results. The remaining two edges of the work surface are used to project cross sections of the model enhancing the users ’ 3-dimensional understanding of the terrain. Quantitative information relating to points on the model selected by the pointer is displayed at the corners of the worktable. These variables dynamically adjust according to the simulation function that is currently in use. For example these numbers indicate factors such as “Slope: 64°”, “Shadowing: Yes”, “Aspect: South”, etc., depending on the current landscape analysis function.
The graphical elements projected onto the table are oriented radially around the table in order to allow users to approach it from all sides and a wireless trackball allows users to pass the control of the selection pointer to each other irrespective of their location around the table. These measures emphasis the intended use of the table as a platform for simultaneous collaboration.
Figure 5. Top view of the Illuminating Clay work area. (This figure is reproduced in color on page 000.)

Modeling Materials We experimented with several different types of modeling material including LEGO blocks, Fimo modeling clay, plastacine, Silly Putty , un-dried porcelain clay and Crayola Model Magic . We found that a thin layer of plasticine, supported by a metal mesh core, combined the lightness and flexibility of a thin layer of material with the ductile qualities of the inner support and helped to maintain a desired topography. The matte white finish is highly suitable as a projection surface and does not leave a residue on the user’s hands.
Figure 6. Alternative Modeling Materials
SYSTEM OPERATION Depending on the users’ specific needs Illuminating Clay can be operated in one of three modes – SCANcast, CUTcast or CADcast.
MODE 1 – SCANcast SCANcast is the default-operating mode for Illuminating Clay. This mode allows the geometry of the landscape model to be ‘scanned’ and used as the input for one of a number of landscape analysis functions. The results of this function are then ‘cast’ back onto the surfaces of the model. These analysis functions range from augmenting the users geometric understanding of the model (for example highlighting areas of greater and lesser slope) to representing the relationship between dynamic systems (such as water flow) and the fixed topography of the landscape model.
It is often difficult or impossible for the unaided designer to predict how small interventions in the landscape will affect complex, non-intuitive and dynamic systems such as the flow of rain -water over the terrain. These effects may be difficult to imagine but can be computed with some accuracy. By offering a means to represent these systems in real-time, as the user manipulates and adds to the landscape model, it is hoped that Illuminating Clay can support more informed design decisions and give the user a more intuitive sense of complex dynamic systems in the landscape.
Digital Elevation Model As described above, the output of the scanner is a range image that is converted into a Digital Elevation Model (DEM). In order to calibrate the system the unprocessed DEM is projected onto the surface of the model and scaled in order that each scanned point on the model corresponds with each projected pixel.
The DEM is the standard data format used in the geosciences to store topographical information. Its simple data structure – an array of regularly spaced elevation values – is conducive to numerous landscape analysis functions. Over the past decades a great number of algorithms have been developed for this format.
We have provided a small library of standard landscape analysis functions to demonstrate the potential for Illuminating Clay. We have purposefully left this library open ended and allowing room for expansion. A road builder may, after all, require a completely different set of computational lenses on the landscape than a botanist, geoscientist or city planner. Some of these functions are described below.
Slope Variation & Curvature A thorough understanding of the slope and curvature of landscape topography is extremely important in almost all landscape analysis. For example slope gradients affect the positioning of roads, buildings, power-lines and so forth. The calculation of slope and curvature, involves processing the DEM using two Sobel filters to determine the x and y derivatives of the topographic surface ( '
xf and 'yf ). The
resulting gradient is: ififf yx
rr'' +=∇
The absolute value of this function returns the slope at a given point in the topography. The slope value is displayed on the model using a color map ranging from red to purple, where the two extremes correspond to the maximum and minimum slope values.
Figure 7. Slope Variation. (This figure is reproduced in
color on page 000.)

Shadows & Solar Radiation The DEM allows us to simulate the positions of shadows in the landscape. Shadow angles are calculated for a given sun position and are projected onto the model as a black and white image. By changing this sun position over time it is possible to view lighting conditions through the passage of a day or year. It also becomes possible to determine the total amount of solar radiation at a given point on a site of known latitude and longitude. This kind of information may, for example, help the user to position crops, housing complexes, solar energy collectors and other sunlight affected insertions in the landscape. These values can be integrated to form isolines, which can also be projected onto the model. The shadow algorithm was developed by Ratti and Richens [15]. A solar exposure algorithm is being adapted from GRASS [16].
Figure 8. Shadows generated by an object placed in the
workspace. (This figure is reproduced in color on page 000.)
View-shed It is often crucial to know the precise field of view from any given position in the landscape. This field of view is known as the view-shed and this landscape analysis can be performed by passing the DEM through an image-processing algorithm that generates the areas that are visible based on a point in the model selected by the user. Applications are varied, from helping to decide the positioning of line-of-sight telecommunication devices (such as a microwave transceivers) to the passage of routes that maximize or minimize views (scenic or smuggler’s paths).
Least cost of passage This analysis function can help the user determine the most appropriate positioning of a roadway or path, since it indicates trajectories on the landscape that minimizes the cost of passage. This cost can be calculated to take into account different parameters such as the actual cost of construction or the cost in time taken to complete a particular route. In addition information relating to the necessary volume of cuts and fills on the landscape can be
calculated and displayed in real time for the benefit of the user.
Water flow and land erosion The representation of water flow and erosion in the landscape helps the user in sitting housing complexes, dams, roads or other interventions while visualizing the (often non-intuitive) consequences of these interventions. In particular, our land erosion algorithm can show the amplified effects of small modifications in the landscape. We have written an algorithm to calculate the Local Drain Direction (LDD) in real time, while more sophisticated analyses are being adapted from the open source GRASS library [16].
MODE 2 - CUTcast We have shown that the SCANcast mode offers the ability to display information on the surface of a 3 dimensional model. However, SCANcast does not allow 3-dimensional information, relating to conditions above the surface of the model, to be displayed. For example, SCANcast does not provide a means to represent airflow or temperature gradients in the atmosphere to be displayed on the model. If the designer of a wind farm wishes to know the precise wind speed at a point 3 meters above the surface of the landscape they need to insert surface for projection 3 meters above the surface of the model topography.
The CUTcast operating mode, which is presently under development, addresses this problem by offering the user the ability to freeze the geometry of a given scene or landscape for the purposes of 3-dimensional simulation. The user is then free to add surfaces for projection at will, and to ‘cut’ the space above the model without affecting the simulation results.
Any surface can be used to make this cut, whether it is the surface of a stiff sheet of translucent plastic or cardboard or indeed a more complex form such as a sphere or even the user’s hand.
MODE 3 - CADcast The illuminating clay interface relies on the initial production of a scale model of the landscape site. However, constructing this model in an accurate and efficient manner may appear to be a stumbling block in this physical modeling approach to landscape analysis. How does the user first construct an accurate model of the desired site?
The third operating mode – CADcast – allows the user to make 3-dimensional models using standard materials such as clay or plastacine. The CADcast mode operates by comparing the geometry of the workspace with a desired topography stored in computer memory as a ‘CAD’ file. This source of this computer model could range from photogrammetry data purchased from GIS sources or it could be generated from the traced contour lines of conventional topographic maps.
As the user places clay material into the workspace it is illuminated with a color indicating when it is within or outside the volume of the CAD model. By varying this

color (from purple to yellow inside the volume and from orange to blue outside the volume) the CADcast mode indicates the level of disparity between the physical and CAD models. For example if an area of the physical model is highlighted in orange this indicates that it is outside the volume of the digital model. As material is removed from the model the color of the surface becomes progressively bluer until the surface of the physical model and digital model are the same. At this point there is a discrete change to the color red to indicate that an exact match between the surface of the physical and digital models has been reached.
While this technique has the potential for allowing for the time and cost efficient construction of physical models that accurately match digital models of existing landscape the current set-up is not sufficiently accurate or speedy for practical use. Noise introduced by the CCD of the scanning device excludes sub-millimeter tolerances. The technique is also rather slow and laborious and would be vastly improved by faster and more accurate scanning technology. These technologies exist but are currently too expensive for our purposes. Meanwhile, it is possible to produce models in a number of alternative, though less elegant ways. We have used Lego or cardboard laminates to build up a model substructure. It may also be possible to casting the landscape in a 3D mold (NC milled or 3D plotted) using fluidized clay.
Figure 11. CADcast comparing physical digital models (This figure is reproduced in color on page 000.).
DISCUSSION Combined Physical and Digital Representation This paper has shown the potential advantages of combining physical and digital representations for landscape analysis. The physical clay model conveys spatial relationships that can be intuitively and directly manipulated by the user’s hands. This approach allows users to quickly create and understand highly complex topographies that would be time consuming and require an inappropriate degree of precision if produced using conventional CAD tools. We hope that this alternative vision for the computer interface makes better use of our natural abilities to discover solutions through the manipulation of physical objects and materials.
At the same time the projected graphics give the user real-time insight into how geometric changes affect the dynamic systems in the landscape. While many others have taken a similar approach in using tracked physical models to interface with the computer we believe that Illuminating Clay offers a new contribution, by using the surface geometry of the model itself to act as the input and output juncture. In so doing we hope to give the projected information the same tangible immediacy as the clay material itself and allow quantitative data to support the intuitive understanding of the landscape.
Figure 12. User’s hand interacting with physical and
digital representation.
3-Dimensional Display We have demonstrated a simple, but effective approach to displaying 3-dimensional computational data. While being greatly limited by issues of occlusion the approach of projecting directly onto the surface of a 3-dimensional model has the advantage of doing away with the complexities of calibration and costs associated with tracked binocular or holographic displays.
While this form of display offers many benefits we have found the necessity to hold on to many aspects of the conventional GUI interface. We continue to use a mouse curser in order to specify precise points on the model, as an origin for the cross sections and to select different landscape analysis functions. These functions are displayed in a conventional 2D manner around the base of the model and for this reason we have distinguished the 3-dimensional model from the 2-dimensional display by setting it several inches higher on the rotating platform.
Figure 13. The 3-dimensional display offered by projecting
onto the surface of the model. (This figure is reproduced in color on page 000.)

Geometric Input The use of a laser scanner to input physical geometry in real-time offers an alternative vision for computer interaction where the user is free to use any object, material or form to interface with the computer. A drawback with many of the systems that we reviewed is that they rely the position of tracked objects, and not the geometry of the objects themselves, as the input. The tracked approach is limited by relying on fragile or unreliable tagging mechanisms, often with high periods of latency. This in turn requires the necessity to use purpose-built objects that are of a suitable size, shape or material to accept the tracking mechanism preventing the user from freely choosing objects that suite their particular needs. Most significantly, this approach does not allow changes in the form of the tracked objects to be registered since the computer knows only of their position and nothing of their geometric status.
To give a concrete example, Urp [12], a direct inspiration for the work presented here, requires colored optical tags to be attached to the bottom face of building objects, limiting the building structures to wire frame models. Users are free to change the relationship between the optically tracked objects but it is impossible to modify the model buildings themselves with out first updating the associated digital model.
However, the tracked approach does offer the advantage over a purely geometric input of allowing different objects in the system to possess unique properties. For example, Urp allows users to change the material (and resultant computed reflections) of different building models. Our approach makes no distinction between one object and another or even between the work surface and the model itself. It is therefore impossible to attribute particular properties to particular objects or regions in the landscape model. This issue could be tackled by using variances in color to distinguish different entities in the model. However, this approach is not possible to implement with our current system since geometry capture combined color image capture reduces the scan cycle period to around 4 seconds, breaking down the sense of real-time interaction.
In our personal experience as designers we have often used found objects to inspire creativity. We hope that the approach taken in Illuminating Clay supports the critical relationship between the designer and their physical environment by allowing the computer interface to be reinvested with some of the richness and complexity of physical objects.
Figure 14. Arbitrary forms used as input. (This figure is
reproduced in color on page 000.).
FUTURE WORK In designing this system we have actively sought the input and advice of landscape design students and teachers from MIT (Department of Urban Studies and Planning) and Harvard (Graduate School of Design). In general, the tone of these discussions has been extremely encouraging. We have given demonstrations of the system to all these groups and encouraged students to experiment using their own landscape models . However it remains for us to make a clear comparison between this interface and existing methods of human computer interaction in landscape design. While it is impossible to quantify the quality of design itself, it may be possible to compare the ability of the landscape designer to meet certain quantifiable requirements of a given brief. We are currently planning two landscape design classes to take place at the MIT School of Architecture and Urban Planning and at the Harvard Graduate School of Design in 2002.
In preparation for these classes we are increasing the library of analysis functions by systematically translating existing code from the open source GRASS libraries. We are also implementing software that will allow users to generate a view from a chosen position and orientation in the landscape. We are also looking at ways to include aerial photography and non-geometric information (such as maps of soil types and vegetation).
We chose to explore the domain of landscape design since landscape models (generally continuous) allow us to avoid the problems of occlusion that would arise given more complex model geometries. However, we are planning to add another VI-900 scanner that will allow us to scan and project from multiple angles, reducing the problems of occlusion and allow us to extend the platform from the current 2.5D implementation to a full 3D interface. This improvement could allow us to look at more complex 3-dimensional visualization issues, ranging from the virtual dissection of anatomical forms to the design of complex architectural or industrial structures.

AKNOWLEDGEMENTS We would like to William Mitchell, Dean of the MIT School of Architecture and Planning, for his enthusiasm and generous support in the purchase of our laser scanning equipment. Also John Underkoffler for his inspiring work that led directly to these new developments. We also owe a great deal of thanks to our team of 'illuminators' with out which the project would have remained in our imaginations - Bryan Blumenkopf, Ken Goulding, Saro Getzoyan, Kartik Lamba, Aaron Mihalik, Alexander Mekelburg, Ishan Sachdev, Dorothy Shamonsky, Yao Wang, Bo Zhu.
REFERENCES [1] Turner, K. Spatial Data Technologies, from Sandia National Laboratories (Albuquerque, NM, 2000).
[2] Frazer, J. Three-Dimensional Data Input Devices, in Computers/Graphics in the Building Process, Washington (1982).
[3] Gorbet, M., Orth, M., and Ishii, H. Triangles. Tangible Interface for Manipulation and Exploration of Digital Information Topography, in Proceedings of Conference on Human Factors in Computing Systems (CHI '98), (Los Angeles, April 1998), ACM Press, 49-56.
[4] Ullmer, B., and Ishii, H. Emerging Frameworks for Tangible User Interfaces. IBM Systems Journal 393, 3 , 2000, 915-931.
[5] Wellner P. Interacting with Paper on the DigitalDesk. Communications of the ACM 36, 7, 86-96 (July 1993).
[6] Hinckley, K., Pausch, R., Goble, J., and Kassell, N. Passive Real-World Interface Props for Neurosurgical Visualization, in Proceedings of Conference on Human Factors in Computing Systems (CHI '94), ACM Press, 452-458.
[7] SensAble Devices: http://www.sensable.com/
[8] Agrawala, M., Beers A., and Levoy, M. 3D painting on scanned surfaces, Proceedings 1995 Symposium on Interactive 3D graphics, 1995, 145-151.
[9] Raskar, R., Welch, G., and Chen, W. Table-top spatially augmented reality: Bringing physical models to life with projected imagery. Proc. Second Int. Workshop on Augmented Reality (IWAR 99), Nov. 1999, 11-20.
[10] Bandyopadhyay, D., Raskar, R., and Fuchs, H. Dynamic Shader Lamps: Painting on Movable Objects, Proc. IEEE and ACM Int. Symposium on Augmented Reality 2001 (ISAR 2001) , October 2001,
[11] Plesniak W.J. Haptic holography: an early computational plastic. Ph.D. Thesis, Program in Media Arts and Sciences, Massachusetts Institute of Technology, Cambridge, MA, June 2001.
[12] Underkoffler, J., and Ishii, H. Urp: A Luminous-Tangible Workbench for Urban Planning and Design, in Proceedings of Conference on Human Factors in Computing Systems (CHI '99), (Pittsburgh, Pennsylvania USA, May 15-20, 1999), ACM Press, 386-393.
[13] Minolta VI-900 laser scanner: http://www.minolta-3d.com/
[14] New River Kinematics: http://www.kinematics.com/
[15] Ratti, C., and Richens, P. Urban texture analysis with image processing techniques, in: Proceedings of CAADFutures99 (Atlanta, GE, May 1999).
[16] Grass GIS: http://www.geog.uni-hannover.de/grass/index2.html