illiquidity, consumer durable expendi- ture, and monetary
TRANSCRIPT

Illiquidity, Consumer Durable Expendi-ture, and Monetary Policy
By FREDERIC S. MISHKIN*
In the literature on consumer durableexpenditure,1 monetary policy has a majorimpact either through interest rate2 orliquid asset (real balance) effects. The the-oretical justification for the inclusion ofliquid assets as an important determinantof consumer durable expenditures is notparticularly strong,3 and results with thisvariable have been mixed.4 Yet, eventhough there is a solid theoretical basis formonetary policy effects through interestrates, empirical econometric work hasrarely found these effects to be sub-stantial.5
One possible conclusion from research
* Teaching assistant, department of economics,Massachusetts Institute of Technology. I want to thankStanley Fischer, Paul Joskow, Franco Modigliani,William Poole, and the participants in the MoneyWorkshop at M.I.T. for their helpful comments. I wouldalso like to thank Roger Hankin for computational as-sistance. This research was conducted while I was therecipient of a NSF Graduate Fellowship. Further researchsupport has been provided by the Federal Reserve Bankof Boston. The evidence and conclusions set forth hereare solely my own, and do not indicate concurrence bythe Federal Reserve System.
1 See Franco Modigliani; Michael Hamburger; F.Thomas Juster and Paul Wachtel (1972a); MichaelMcCarthy; Albert Hirsch, Maurice Liebenberg, andGeorge Green; Ta-Chung Liu and Erh-Cheng Hwa; andOtto Eckstein, Edward Green, and Allen Sinai.
2 Classified with interest rate effects are the effects ofinstallment credit terms.
3 One justification for the inclusion of liquid assets inconsumer expenditure equations is found in ArnoldZellner, David Huang, and L. C. Chau.
4 In none of the models mentioned in fn. 1 does theliquid asset variable enter significantly and with the rightsign—indeed it often enters with the wrong sign—inboth equations for the autos and parts and nonautocomponents of consumer durable expenditure.
5 Hamburger's study seems to be the only piece ofempirical work where these effects are substantial. Yet,he only finds these powerful effects when interest ratesenter his equations with very long lags.
in this area is that monetary policy hasonly a marginal effect on consumer durableexpenditures. Another possibility, how-ever, is that channels of monetary policyas yet unexplored might be a crucial de-terminant of this type of expenditure.
This paper studies the neglected illiquidaspect of the consumer durable asset. Itfinds that increased consumer liabilities area major deterrent to consumer durablepurchases and increased financial assetholdings a powerful encouragement. Theresults show that monetary policy has astrong impact on consumer durable ex-penditure through two additional channelsof monetary influence: 1) Monetary policyaffects the price of assets in the economy.Consumer financial asset holdings, therebyaffected, influence expenditure on durables.2) Past monetary policy will have affectedthe cost and availability of credit, thusinfluencing the size of consumers' debtholdings and hence consumer durable ex-penditure.
The paper proceeds in the followingway: the next section develops a modelwhich determines the effects of consumerdurable illiquidity on the desirability ofthis asset; the second section contains ag-gregate time-series tests of this model; andthe final section discusses the implicationsfor monetary policy and contains conclud-ing remarks.
I. Illiquidity of the ConsumerDurable Asset
One aspect of the consumer durable as-set that distinguishes it from financialassets is its illiquidity. Well-developed cap-ital markets exist for most financial assets,
642
Digitized for FRASER http://fraser.stlouisfed.org/ Federal Reserve Bank of St. Louis

VOL. 66 NO. 4 MISHKIN: CONSUMER DURABLE EXPENDITURE 643
and cash can be generated with a mini-mum of cost in time, money, and effort byselling them in their near perfect markets.Capital markets for used consumer dura-bles are, on the other hand, highly imper-fect. Durable goods are very heteroge-neous, and much information which iscostly to obtain is needed to determinetheir value.6 Also the bulk and difficulty inhandling of durables leads to high trans-action costs in their purchase or sale.These transaction and information prob-lems lead to a wide spread between theprice the consumer receives from sellinghis used consumer durable and its value inuse.7'8
A simple two-period model of the effectsof consumer durable illiquidity on the de-sirability of this asset is developed below.It is shown that the nature of markets forconsumer durables forces the consumer totake account of his balance sheet status,i.e., his debt and financial asset position,as well as the riskiness of his incomestream, in determining the desired level ofhis consumer durables stock.
Assume that a consumer buys a unit ofdurables with price equal to unity at thebeginning of period one. The durable's in-use value at the end of the period would be1 — d, where d is the depreciation rate.9 Yet,if the consumer suffers a shortfall in in-come so that the durable good has to besold in a distress manner, its full value can-
6 For example, how well has the owner treated hisdurable, has it been damaged, how frequently has it beenused, was it a lemon to start with, etc.
7 The value-in-use is the present discounted value ofthe durable's flow of services.
8 To see why costly information would lead to a spreadbetween selling price and in-use value, see GeorgeAkerlof. In an extreme case no organized market mightexist as a result of information problems. The absence oforganized markets for many types of used consumerdurable goods is quite common.
9 In the case of a durable where there is a plannedtrade-in, the expected costs incurred in the trade-in—transactions and otherwise—are included in depreciation.The value of the durable at the end of the period reflectsthese costs.
not be realized. Its illiquidity stems fromthe imperfect nature of the used con-sumer durable capital market. The degreeof this illiquidity will be described by thevariable , which is the fraction ofin-use value that can be realized from adistress sale. This formulation is quitegeneral: it is not dependent on any specifictype of illiquidity loss; it includes the lossfrom a low sales price as well as from trans-action costs. If, as a result of an incomeshortfall, a distress sale of the durable atthe end of the period is required to raisecash, then the realized value of the durableat the end of the period will be ,where q is less than one.
If there is no distress sale, the one-period opportunity cost of holding adurable rather than a financial asset willbe:
(1)
But if there is a distress sale as a result ofan income shortfall, then:
(2)
where 10 = one-period opportunity cost
10 The opportunity cost in equation (2) assumes thata consumer cannot borrow to cover his income shortfallor that the cost of borrowing over and above the yield onfinancial assets is more than . It is wellknown that financial intermediaries are more than happyto make loans to consumers when they least need it andare extremely reluctant to make loans to consumers whenthey are in financial trouble. If the financial intermediarydoes make a loan at all to a consumer with an in-come shortfall, it charges a very substantial premium tocompensate for the increased risk. Thus the assumptioninherent in equation (2) is quite reasonable. If the dif-ference between the borrowing cost and the yield on fi-nancial assets is less than , the consumer willborrow instead of selling his consumer durables. This canbe incorporated into the above model by replacing
with the spread between the distress bor-rowing rate and the yield on financial assets. This leadsto the same results as found in the text.
The reluctance of financial intermediaries to lend toconsumers in financial trouble explains why most con-sumers hold debt and financial assets at the same time,even if borrowing costs for the consumer not sufferingfinancial distress are somewhat higher than the yield on
Digitized for FRASER http://fraser.stlouisfed.org/ Federal Reserve Bank of St. Louis

644 THE AMERICAN ECONOMIC REVIEW SEPTEMBER 1976
of holding a durable, and r= one-periodreturn on financial assets (which is as-sumed certain).
We can now view the opportunity costof holding durable goods in an uncertainworld with a Tobin-Markowitz mean-variance framework. If the probability ofmaking a distress sale is p and not makinga distress sale is 1 —p, then
where E and Var are the expectation andvariance operators, respectively.
A distress sale occurs whenever con-sumption11 plus debt service (interest plusamortization) is larger than income, plusreadily available financial assets; i.e., when
(5) DS + CON - Y - FIN > 0
where DS= debt serviceCON= consumption
Y— disposable incomeFIN = holdings of financial assets
The permanent income hypothesis im-plies that
(6)
where k=the propensity to consume outof permanent income, and = expectedaverage (permanent) income. If income isa normally distributed random variable,then using the standard normal distribu-tion formula we may write:
financial assets. When a consumer suffers a drop inincome, financial assets are a buffer that help prevent theconsumer from taking losses either by selling his durablesor borrowing at inflated rates to raise cash; thus theconsumer will not try to minimize his borrowings byholding no financial assets as he would in a world ofabsolute certainty and perfect capital markets.
11 Since a distress sale can be avoided at a relativelylow cost by a reduction in consumer durable expenditure,consumption, not consumer expenditure, is the relevantvariable for the necessity of a distress sale.
where =the square root of the incomevariance, with
since k is usually assumed to be less thanone.
Debt service is a positive function of theconsumer's liabilities at the beginning ofthe period, hence
where DEBT=liabilities at the beginningof the period. Now:
Digitized for FRASER http://fraser.stlouisfed.org/ Federal Reserve Bank of St. Louis
VOL. 66 NO. 4 MISHKIN: CONSUMER DURABLE EXPENDITURE 645
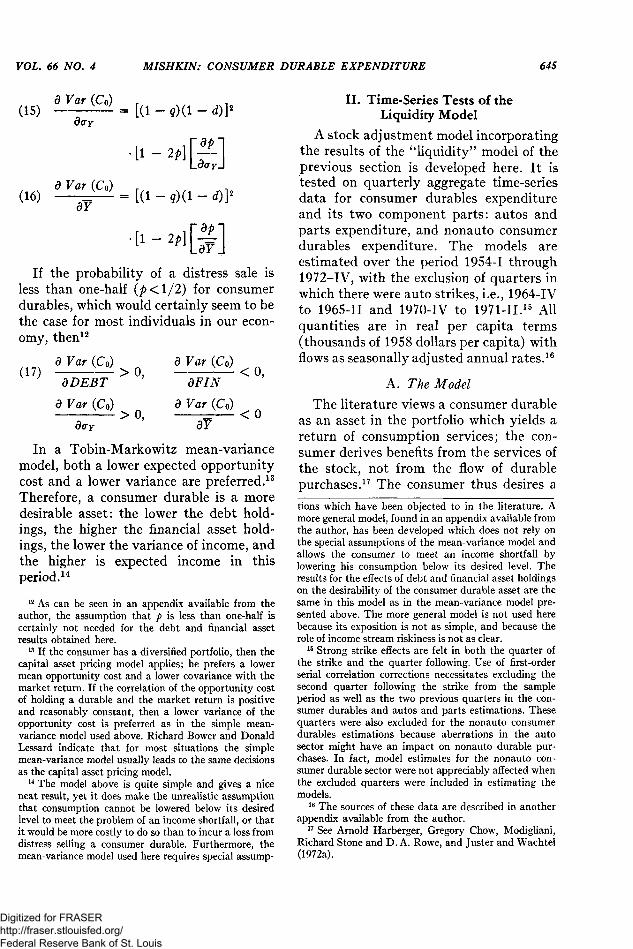
If the probability of a distress sale isless than one-half for consumerdurables, which would certainly seem to bethe case for most individuals in our econ-omy, then12
In a Tobin-Markowitz mean-variancemodel, both a lower expected opportunitycost and a lower variance are preferred.13
Therefore, a consumer durable is a moredesirable asset: the lower the debt hold-ings, the higher the financial asset hold-ings, the lower the variance of income, andthe higher is expected income in thisperiod.14
12 As can be seen in an appendix available from theauthor, the assumption that p is less than one-half iscertainly not needed for the debt and financial assetresults obtained here.
13 If the consumer has a diversified portfolio, then thecapital asset pricing model applies; he prefers a lowermean opportunity cost and a lower covariance with themarket return. If the correlation of the opportunity costof holding a durable and the market return is positiveand reasonably constant, then a lower variance of theopportunity cost is preferred as in the simple mean-variance model used above. Richard Bower and DonaldLessard indicate that for most situations the simplemean-variance model usually leads to the same decisionsas the capital asset pricing model.
14 The model above is quite simple and gives a niceneat result, yet it does make the unrealistic assumptionthat consumption cannot be lowered below its desiredlevel to meet the problem of an income shortfall, or thatit would be more costly to do so than to incur a loss fromdistress selling a consumer durable. Furthermore, themean-variance model used here requires special assump-
II. Time-Series Tests of theLiquidity Model
A stock adjustment model incorporatingthe results of the "liquidity" model of theprevious section is developed here. It istested on quarterly aggregate time-seriesdata for consumer durables expenditureand its two component parts: autos andparts expenditure, and nonauto consumerdurables expenditure. The models areestimated over the period 1954-I through1972-IV, with the exclusion of quarters inwhich there were auto strikes, i.e., 1964-IVto 1965-II and 19704V to 1971-II.15 Allquantities are in real per capita terms(thousands of 1958 dollars per capita) withflows as seasonally adjusted annual rates.16
A. The Model
The literature views a consumer durableas an asset in the portfolio which yields areturn of consumption services; the con-sumer derives benefits from the services ofthe stock, not from the flow of durablepurchases.17 The consumer thus desires a
tions which have been objected to in the literature. Amore general model, found in an appendix available fromthe author, has been developed which does not rely onthe special assumptions of the mean-variance model andallows the consumer to meet an income shortfall bylowering his consumption below its desired level. Theresults for the effects of debt and financial asset holdingson the desirability of the consumer durable asset are thesame in this model as in the mean-variance model pre-sented above. The more general model is not used herebecause its exposition is not as simple, and because therole of income stream riskiness is not as clear.
15 Strong strike effects are felt in both the quarter ofthe strike and the quarter following. Use of first-orderserial correlation corrections necessitates excluding thesecond quarter following the strike from the sampleperiod as well as the two previous quarters in the con-sumer durables and autos and parts estimations. Thesequarters were also excluded for the nonauto consumerdurables estimations because aberrations in the autosector might have an impact on nonauto durable pur-chases. In fact, model estimates for the nonauto con-sumer durable sector were not appreciably affected whenthe excluded quarters were included in estimating themodels.
16 The sources of these data are described in anotherappendix available from the author.
17 See Arnold Harberger, Gregory Chow, Modigliani,Richard Stone and D. A. Rowe, and Juster and Wachtel(1972a).
Digitized for FRASER http://fraser.stlouisfed.org/ Federal Reserve Bank of St. Louis

646 THE AMERICAN ECONOMIC REVIEW SEPTEMBER 1976
certain stock of durables which is a func-tion of permanent income and the userrental cost of capital. The liquidity modeldeveloped in the previous section indi-cates that, in addition, the desired durablesstock is a function of the value of the con-sumer's debt and financial asset holdingsat the beginning of the period. Therefore:
where K* — real per capita desired stock ofdurables,
Yp=real per capita expected aver-age (permanent) income,
CA PC — user rental cost of consumerdurable capital18
(RCB+D)(PCD/PCON),RCB = Moody's AAA corporate bond
rate,D = annual depreciation rate,19
PCD = consumer durables implicitprice deflator,
PCON= consumption implicit price de-flator,
DEBT=real per capita debt holdingsof households—beginning ofquarter,
18 The user rental cost of consumer durable capitalused here is completely analogous to the user rental costof capital in the investment studies of Robert Hall andDale Jorgenson and of Charles Bischoff. The interest ratein the formula above is a nominal interest rate, not areal interest rate as would be appropriate in the Hall-Jorgenson formulation; thus the effect of inflation onconsumer durable expenditure is not incorporated intothis model. Attempts were made to estimate the effectof inflation on consumer durable expenditure and includeit in the model, yet experiments with varied distributedlags of past inflation rates proved fruitless; no significanteffects could be obtained. This is not surprising for theeffect of inflation is by no means clear. On one hand, withconstant nominal interest rates inflation lowers the userrental cost of capital and encourages durable expendi-tures. Yet evidence from consumer surveys indicatesthat inflation increases consumers' perceptions of un-certainty (see Juster and Wachtel, 1972b), and this hasa depressing effect on consumer durable expenditures.
19 The assumed depreciation rate used in calculatingthe capital cost measure for all consumer durables is .20,while it is .25 for autos and parts, and .15 for nonautoconsumer durables.
FIN= real per capita gross financialasset holdings of households(includes demand depositsplus currency, time and sav-ings deposits, bonds, corpo-rate equity, life insurance andpension funds, and other mis-cellaneous assets)—beginningof quarter,
EA = additive error term.
When expected income is high, and thedesired durables stock is high, a changein the user capital cost should cause alarger dollar change in the desired stock ofdurables. Thus, equation (18) is linearizedwith the coefficient of permanent income alinear function of the user rental capitalcost,20 i.e.,
Consumer durable expenditure is mod-eled with the stock-adjustment or so-calledflexible-accelerator model which viewsconsumers as adjusting only slowly to theirdesired stock of durables. The change inthe stock, i.e., net investment, is only afraction, X, of the gap between the desiredand actual stock at the beginning of theperiod. Net investment is also viewed as afunction of transitory income because:1) some portion of transitory income andhence saving should be reflected in con-sumer durable purchases; and 2) transi-tory income is a proxy to some extent forperceptions of income variance21'22 which
20 This assumption is not critical to our argument. IfK* is alternatively assumed to be a linear function of theright-hand side variables in (18), i.e.,
the fit of the estimated model and the asymptotic t-statistics of the coefficients (except for the constant term)change hardly at all, and the important empirical resultsof this paper still hold.
21 Transitory income is a cyclical variable which isrelated to the probability of a worker losing his job andsuffering an interruption of his normal income stream.
Digitized for FRASER http://fraser.stlouisfed.org/ Federal Reserve Bank of St. Louis
VOL. 66 NO. 4 MISHKIN: CONSUMER DURABLE EXPENDITURE 647
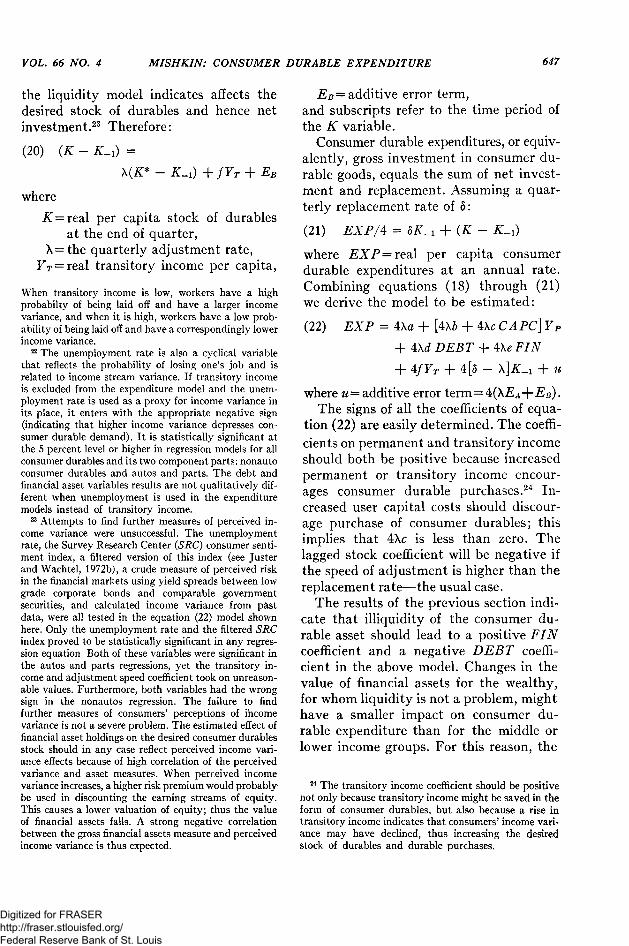
the liquidity model indicates affects thedesired stock of durables and hence netinvestment.23 Therefore:
where
K = real per capita stock of durablesat the end of quarter,
X=the quarterly adjustment rate,YT = real transitory income per capita,
When transitory income is low, workers have a highprobabilty of being laid off and have a larger incomevariance, and when it is high, workers have a low prob-ability of being laid off and have a correspondingly lowerincome variance.
22 The unemployment rate is also a cyclical variablethat reflects the probability of losing one's job and isrelated to income stream variance. If transitory incomeis excluded from the expenditure model and the unem-ployment rate is used as a proxy for income variance inits place, it enters with the appropriate negative sign(indicating that higher income variance depresses con-sumer durable demand). It is statistically significant atthe 5 percent level or higher in regression models for allconsumer durables and its two component parts: nonautoconsumer durables and autos and parts. The debt andfinancial asset variables results are not qualitatively dif-ferent when unemployment is used in the expendituremodels instead of transitory income.
23 Attempts to find further measures of perceived in-come variance were unsuccessful. The unemploymentrate, the Survey Research Center (SRC) consumer senti-ment index, a filtered version of this index (see Justerand Wachtel, 1972b), a crude measure of perceived riskin the financial markets using yield spreads between lowgrade corporate bonds and comparable governmentsecurities, and calculated income variance from pastdata, were all tested in the equation (22) model shownhere. Only the unemployment rate and the filtered SRCindex proved to be statistically significant in any regres-sion equation. Both of these variables were significant inthe autos and parts regressions, yet the transitory in-come and adjustment speed coefficient took on unreason-able values. Furthermore, both variables had the wrongsign in the nonautos regression. The failure to findfurther measures of consumers' perceptions of incomevariance is not a severe problem. The estimated effect offinancial asset holdings on the desired consumer durablesstock should in any case reflect perceived income vari-ance effects because of high correlation of the perceivedvariance and asset measures. When perceived incomevariance increases, a higher risk premium would probablybe used in discounting the earning streams of equity.This causes a lower valuation of equity; thus the valueof financial assets falls. A strong negative correlationbetween the gross financial assets measure and perceivedincome variance is thus expected.
EB= additive error term,and subscripts refer to the time period ofthe K variable.
Consumer durable expenditures, or equiv-alently, gross investment in consumer du-rable goods, equals the sum of net invest-ment and replacement. Assuming a quar-terly replacement rate of :
where EXP=real per capita consumerdurable expenditures at an annual rate.Combining equations (18) through (21)we derive the model to be estimated:
where u— additive error term=The signs of all the coefficients of equa-
tion (22) are easily determined. The coeffi-cients on permanent and transitory incomeshould both be positive because increasedpermanent or transitory income encour-ages consumer durable purchases.24 In-creased user capital costs should discour-age purchase of consumer durables; thisimplies that is less than zero. Thelagged stock coefficient will be negative ifthe speed of adjustment is higher than thereplacement rate—the usual case.
The results of the previous section indi-cate that illiquidity of the consumer du-rable asset should lead to a positive FINcoefficient and a negative DEBT coeffi-cient in the above model. Changes in thevalue of financial assets for the wealthy,for whom liquidity is not a problem, mighthave a smaller impact on consumer du-rable expenditure than for the middle orlower income groups. For this reason, the
24 The transitory income coefficient should be positivenot only because transitory income might be saved in theform of consumer durables, but also because a rise intransitory income indicates that consumers' income vari-ance may have declined, thus increasing the desiredstock of durables and durable purchases.
Digitized for FRASER http://fraser.stlouisfed.org/ Federal Reserve Bank of St. Louis

648 THE AMERICAN ECONOMIC REVIEW SEPTEMBER 1976
unequal and highly skewed distribution offinancial asset holdings in this countrywould tend to sharply lower the aggregatefinancial assets coefficient in a model esti-mated on aggregate time-series data. Onthe other hand, consumer liabilities aredistributed far more equally than financialassets; thus the coefficient on consumerliabilities should still retain a high valuein time-series estimations. Even though theliquidity model does not imply that for anindividual the debt coefficient should bemarkedly larger in absolute value than thefinancial assets coefficient, this result mightbe expected in time-series estimates ofthese coefficients which reflect the dis-tribution effects described above.
B. Empirical Estimates
Equation (22)—whether it be estimatedfor expenditures on all consumer durables,or for autos and parts and nonauto con-sumer durables expenditures—is just oneequation in a simultaneous system; thussimultaneous equation bias will result fromordinary least squares estimation. In theabove model this bias would be especiallysevere for the debt coefficient.25 To avoidleast squares bias, an instrumental vari-able technique has been used.26 Strongserial correlation is evident in all the re-
25 Ordinary least squares estimates of the debt coeffi-cient would be severely biased upward if the error termis positively serially correlated—the usual case. A posi-tive error last period would imply a positive error in thecurrent period, while increased durable purchases lastperiod—a result of the positive error term—would leadto increased debt holdings at the beginning of the cur-rent period. The debt variable and the error term wouldthus be positively correlated, and this would lead to anupwardly biased ordinary least squares coefficient esti-mate. A comparison of the ordinary least squares andinstrumental variables estimates of equation (22) indi-cates that the bias in ordinary least squares estimates isof the predicted direction and is quite strong.
26 The list of instruments includes unborrowed reservesat member banks plus currency outside of banks, thediscount rate, exports, federal government expenditures,the effective rate of personal income tax, these five vari-ables lagged one period, the constant term, and popula-tion.
gression equations, and to achieve efficientestimates a first-order serial correlationcorrection has been made using Ray Fair'smethod and the appropriate additional in-struments.27, 28 The results for each sectorare denoted by superscripts: D for all con-sumer durables; A for autos and parts; andNA for nonauto consumer durables.
The estimates for consumer durables areas follows, with asymptotic t-statistics inparentheses. The coefficient on u-1 is thefirst-order serial correlation coefficient.
R2 = .9932; Durbin-Watson = 1.90; StandardError = .007529.
The results are good. The coefficientsof the debt and financial asset variableshave the signs hypothesized by the liquid-ity model and are highly significant; thecoefficients are over four times their re-spective asymptotic standard errors. Thedepressing effect of debt holdings on con-sumer durable purchases is quite substan-tial; for every $1 of debt held at the begin-ning of the quarter, durable purchases atan annual rate will be decreased by 22 .The value of financial asset holdings has a
27 Except for the lagged stock coefficients, regressionestimates where there was no correction for serial cor-relation were not appreciably different from the correctedregression estimates. The serial correlation correctedregressions exhibited a higher adjustment speed of de-sired to actual stocks.
28 Ordinary least squares estimates using a Cochrane-Orcutt technique for autocorrelation correction are pro-vided in an appendix available from the author. Quali-tatively the results are similar to those in the text (i.e.,signs and t-statistics), though coefficient estimates some-times differ by as much as 30 percent.
Digitized for FRASER http://fraser.stlouisfed.org/ Federal Reserve Bank of St. Louis
VOL. 66 NO. 4 MISHKIN: CONSUMER DURABLE EXPENDITURE 649
significant positive effect on the demandfor durables, though, as might be expected,it is not as strong as the depressing effectof debt; an extra dollar of financial assetsheld at the beginning of the quarter leadsto of increased durables purchases.
In addition, the , and CAPCD
coefficients are all significant and of theexpected sign in the estimated equationabove. The magnitudes of these coefficientsare also quite reasonable; 27 of a $1 in-crease in transitory income is spent onconsumer durables, while a $1 increase inpermanent income leads to somewhere inthe neighborhood of 34 of increased du-rables expenditures. At the means of thesample data the interest rate elasticity ofconsumer durables expenditure is —.14,while the price elasticity is —.71. Thelagged stock coefficient implies that ap-proximately 6 percent29 of the discrepancybetween desired and actual stocks of du-rables is made up within the quarter; thisis an annual adjustment rate of 22 percent.
The consumer durables demand modelpresented so far only allows for lags in theadjustment of actual to desired consumerdurable stocks; i.e., no decision lags areallowed in the consumer's determination ofhis desired stock. This assumption seemsrather naive. The consumer may acquireinformation on his user rental cost of du-rables slowly, and thus his decision on hisdesired stock of durables may be influencedby past as well as present user rental costs.Capital gains or losses may not be con-sidered fully part of financial assets untilthey are realized. Movements in commonstock prices, which lead to unrealizedcapital gains or losses in the short run,should not have their full impact immedi-ately; instead, the valuation of commonstock would affect the desired consumerdurables stock with a distributed lag.
29 This assumes a quarterly replacement rate of.05625, which is the depreciation rate used in computingthe consumer durables stock.
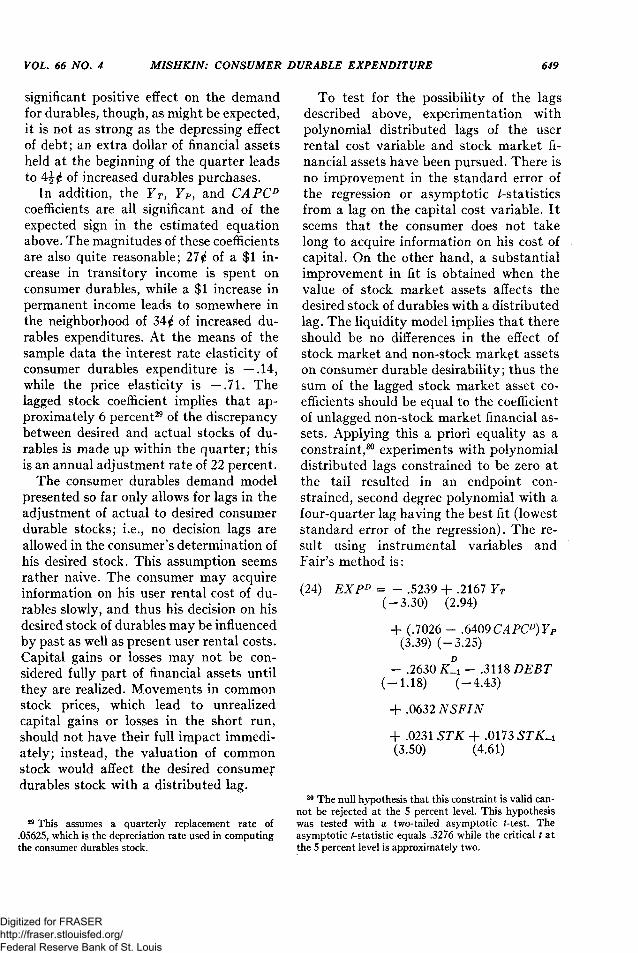
To test for the possibility of the lagsdescribed above, experimentation withpolynomial distributed lags of the userrental cost variable and stock market fi-nancial assets have been pursued. There isno improvement in the standard error ofthe regression or asymptotic t-statisticsfrom a lag on the capital cost variable. Itseems that the consumer does not takelong to acquire information on his cost ofcapital. On the other hand, a substantialimprovement in fit is obtained when thevalue of stock market assets affects thedesired stock of durables with a distributedlag. The liquidity model implies that thereshould be no differences in the effect ofstock market and non-stock market assetson consumer durable desirability; thus thesum of the lagged stock market asset co-efficients should be equal to the coefficientof unlagged non-stock market financial as-sets. Applying this a priori equality as aconstraint,30 experiments with polynomialdistributed lags constrained to be zero atthe tail resulted in an endpoint con-strained, second degree polynomial with afour-quarter lag having the best fit (loweststandard error of the regression). The re-sult using instrumental variables andFair's method is:
30 The null hypothesis that this constraint is valid can-not be rejected at the 5 percent level. This hypothesiswas tested with a two-tailed asymptotic t-test. Theasymptotic t-statistics equals .3276 while the critical t atthe 5 percent level is approximately two.
Digitized for FRASER http://fraser.stlouisfed.org/ Federal Reserve Bank of St. Louis
650 THE AMERICAN ECONOMIC REVIEW SEPTEMBER 1976
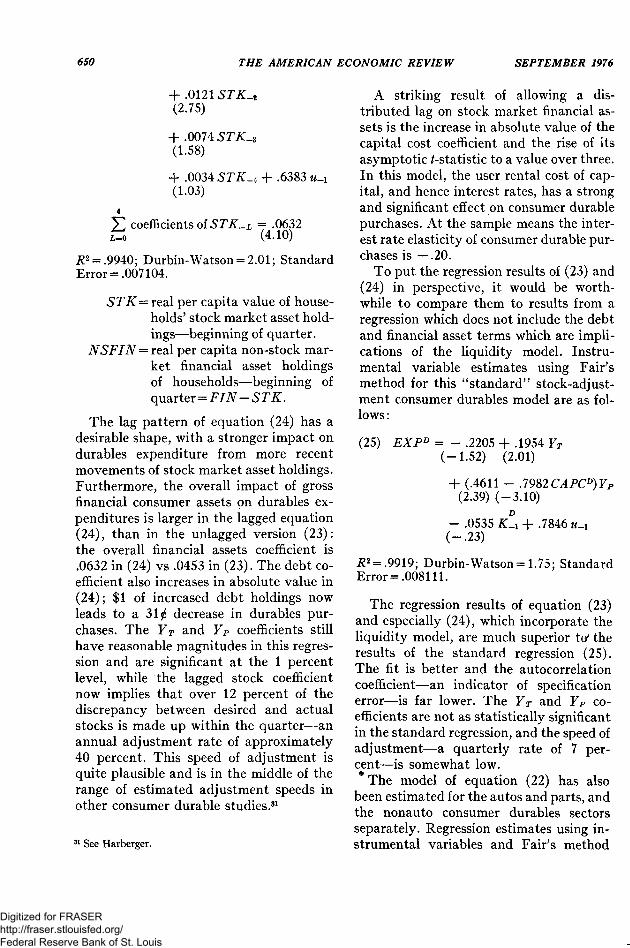
R2 = .9940; Durbin-Watson = 2.01; StandardError = .007104.
STK= real per capita value of house-holds' stock market asset hold-ings—beginning of quarter.
NSFIN = real per capita non-stock mar-ket financial asset holdingsof households—beginning ofquarter= FIN-STK.
The lag pattern of equation (24) has adesirable shape, with a stronger impact ondurables expenditure from more recentmovements of stock market asset holdings.Furthermore, the overall impact of grossfinancial consumer assets on durables ex-penditures is larger in the lagged equation(24), than in the unlagged version (23):the overall financial assets coefficient is.0632 in (24) vs .0453 in (23). The debt co-efficient also increases in absolute value in(24); $1 of increased debt holdings nowleads to a 31 decrease in durables pur-chases. The YT and YP coefficients stillhave reasonable magnitudes in this regres-sion and are significant at the 1 percentlevel, while the lagged stock coefficientnow implies that over 12 percent of thediscrepancy between desired and actualstocks is made up within the quarter—anannual adjustment rate of approximately40 percent. This speed of adjustment isquite plausible and is in the middle of therange of estimated adjustment speeds inother consumer durable studies.31
31 See Harberger.
A striking result of allowing a dis-tributed lag on stock market financial as-sets is the increase in absolute value of thecapital cost coefficient and the rise of itsasymptotic t-statistic to a value over three.In this model, the user rental cost of cap-ital, and hence interest rates, has a strongand significant effect on consumer durablepurchases. At the sample means the inter-est rate elasticity of consumer durable pur-chases is — .20.
To put the regression results of (23) and(24) in perspective, it would be worth-while to compare them to results from aregression which does not include the debtand financial asset terms which are impli-cations of the liquidity model. Instru-mental variable estimates using Fair'smethod for this "standard" stock-adjust-ment consumer durables model are as fol-lows :
R2 = .9919; Durbin-Watson =1.75; StandardError = .008111.
The regression results of equation (23)and especially (24), which incorporate theliquidity model, are much superior to theresults of the standard regression (25).The fit is better and the autocorrelationcoefficient—an indicator of specificationerror—is far lower. The YT and YP co-efficients are not as statistically significantin the standard regression, and the speed ofadjustment—a quarterly rate of 7 per-cent—is somewhat low.* The model of equation (22) has also
been estimated for the autos and parts, andthe nonauto consumer durables sectorsseparately. Regression estimates using in-strumental variables and Fair's method
Digitized for FRASER http://fraser.stlouisfed.org/ Federal Reserve Bank of St. Louis

VOL. 66 NO. 4 MISHKIN: CONSUMER DURABLE EXPENDITURE 651
Note: p= First-order serial correlation coefficient. Allother variables are as defined in the text. Asymptotict-statistics in parentheses.
appear in Tables 1 and 2. Experimentswith endpoint constrained, polynomial dis-tributed lags were also carried out forthese sectors, and, as in the case for allconsumer durable expenditures, the bestfits were obtained with a four-quarter end-point constrained, polynomial distributedlag on stock market assets. The constraintthat the sum of the STK coefficients shouldequal the coefficient on NSFIN was im-posed.32 The estimates incorporating lags
32 The null hypothesis that this constraint is validcannot be rejected at the 5 percent level for either sector.
on stock market asset holdings also ap-pear in Tables 1 and 2.
The results for both the autos andparts and nonauto consumer durable sec-tors are excellent. The debt and financialasset variables are of the right sign andare significant in all cases. The lag patternof stock market assets in the lagged ver-sions of the model is very similar in bothsectors and has a sensible shape; morerecent movements in the value of stock
The asymptotic t-statistic for the auto and parts andnonauto consumer durables regressions were .4294 and1.1728, respectively. The critical t at the 5 percent levelis approximately two.
TABLE 1—AUTO AND PARTS REGRESSIONS
Instrumental Variables Estimates Using Fair's MethodDependent Variable: EXPA
Equations
Coefficient of (26) (27) (28)
Constant Term -.1920 -.2591 -.1570(-2.89) (-3.33) (-2.14)
YT .1002 .0777 .0306(1.42) (1.08) (.34)
YP .2142 .3133 .3432(2.74) (3.42) (3.25)-.1834 -.2458 -.4578(-1.61) (-2.09) (-2.82)
KA-1 -.0194 -.2819 -.4453
(-.08) (-1.10) (-1.40)DEBT -.1731 -.2149
(-4.24) (-3.63)FIN .0398
(4.09)NSFIN .0486STK .0209
(3.53)STK-1 .0139
(4.05)STK-2 .0083
(2.09)STK-3 .0041
(.97)STK-4 .0014
(.45).0486
(3.44).5163 .6045 .7630
R2 .9703 .9738 .9661Durbin-Watson 1.84 1.91 1.63Standard Error .007138 .006759 .007513
TABLE 2—NONAUTO CONSUMER DURABLEREGRESSIONS
Instrumental Variables Estimates Using Fair's MethodDependent Variable: EXPNA
Equation
Coefficient of (29) (30) (31)
Constant Term -.2697 -.3220 -.0753(-3.31) (-3.77) (-1.51)
YT .1511 .1327 .1607(6.26) (5.16) (5.90)
YP .3558 .4291 .1210(3.32) (3.83) (1.99)
CAPCNA'YP -.2421 -.3149 -.2513(-2.94) (-3.58) (-2.90)
KNA-1 -.2633 -.3644 .1389
(-1.38) (-1.85) (1.08)DEBT -.0672 -.1021
(-3.47) (-3.74)FIN .0089
(2.52)NSFIN .0161STK .0046
(2.10)STK-1 .0041
(3.17)STK_2 .0034
(2.23)STK-3 .0025
(1.55)STK-4 .0014
(1.20).0161
(2.96).5758 .5912 .6325
R2 .9974 .9975 .9970Durbin-Watson 2.09 2.17 1.99Standard Error .002574 .002540 .002724
Digitized for FRASER http://fraser.stlouisfed.org/ Federal Reserve Bank of St. Louis

652 THE AMERICAN ECONOMIC REVIEW SEPTEMBER 1976
market asset holdings have greater impacton purchases, as in the estimates for allconsumer durables. The , capitalcost, and lagged stock terms are all of theexpected sign and are usually significant.The magnitudes of these coefficients arealso reasonable. The lagged versions ofthe estimated model for the two sectors,equations (27) and (30), do have a su-perior fit to the unlagged models, (26) and(29); and the quarterly speed of adjust-ment implied by these lagged models isover 12 percent for autos and parts, andover 13 percent33 for nonauto consumerdurables; at annual rates these are bothover 40 percent.
It is interesting to note that the esti-mated debt and financial assets coefficientsare so much larger in the autos and partsregressions than in the nonauto regressions,in spite of the fact that autos and partsmake up not quite half of total consumerdurable purchases. The consumer's finan-cial position seems to have more impacton his decision to purchase an automobilethan it does on his decision to purchase ahousehold consumer durable.34 This is aworthwhile subject for further research.
Standard regression equations for bothsectors where the debt and financial assetsvariables have been excluded have beenestimated and appear as equations (28)and (31) in Tables 1 and 2. For both sec-tors, regression equations which incorpo-rate the results of the liquidity model aresuperior to the standard regressions. Theyhave a better fit, a lower standard error,and a smaller autocorrelation coefficient.Furthermore, in the nonauto consumer
33 These adjustment rates assume a quarterly replace-ment rate of .07 for autos and parts and .045 for nonautoconsumer durables.
34 As a result of indivisibilities in the consumer's port-folio, the absolute size of the loss from selling a durable,and not just the loss per unit of the durable, could beimportant to consumer behavior. High priced durablessuch as automobiles would have a greater potentialabsolute loss from a forced sale than low priced durables,and this might explain the result found above.
durables case the standard regression hasan impossibly low speed of adjustment;only .5 percent of the discrepancy be-tween desired and actual stocks is made upwithin the quarter—an annual rate of 2percent.
Disaggregation of the consumer durablesector into its autos and parts and non-auto consumer durables components hasresulted in further tests of the liquiditymodel. The results are still strongly sup-portive of this hypothesis.
III. Implications for Monetary Policyand Concluding Remarks
The consumer durable expenditure modelwhich incorporates the results of the liquid-ity model developed in this paper leavesmonetary policy with a strong role to playin the demand for one of the most volatilecomponents of gross national product.Three routes for monetary policy effects onconsumer durable expenditures can nowbe envisioned.
1) Monetary policy affects interestrates and hence the user rental cost ofcapital. Tight monetary policy whichraises interest rates will be a strong de-terrent to consumer durable purchases be-cause of the high interest elasticity of con-sumer durable demand indicated by em-pirical results in this paper.
2) In a Tobin, Foley-Sidrauski theo-retical framework, monetary policy has astrong influence on asset prices in theeconomy. Tight monetary policy will leadto a fall in stock and bond prices and willthus result in a smaller valuation of thegross financial assets in the community.This will lead to decreased purchases ofdurables because consumers' financial posi-tions have deteriorated; they are now leftwith a high probability of income short-falls that would have to be met by the dis-tress sale of consumer durables or a dropin consumption.
3) Past monetary policy will haveaffected the cost and availability of credit
Digitized for FRASER http://fraser.stlouisfed.org/ Federal Reserve Bank of St. Louis

VOL. 66 NO. 4 MISHKIN: CONSUMER DURABLE EXPENDITURE 653
to the consumer and will have thus affectedthe size of consumers' liabilities. Easy pastmonetary policy which has encouraged thebuildup of consumer debt holdings willeventually prove a deterrent to future con-sumer durable purchases. The increaseddebt holdings force the consumer to de-sire more liquid assets.35
Viewing the consumer durable as an il-liquid asset which must be traded in im-perfect capital markets has led to a con-sumer durables demand model where per-ceived risk, and consumer liabilities andgross financial asset holdings influence con-sumer durables expenditure. In contrast toother work on macro-economic financialasset effects where net wealth influencesconsumer behavior,36 this approach findsthat the composition of the consumer bal-ance sheet is critical to spending deci-sions.37 The empirical estimates of thismodel have proved very encouraging, andseveral new and apparently potent chan-nels of monetary policy that affect aggre-gate demand have been proposed. Fur-thermore, a traditional path for monetarypolicy effects on consumer durable ex-penditure has proved to be quite powerfulin the model estimated here.
The liquidity model developed in thispaper should also have applications in suchareas as residential housing demand, andthis will be the subject of further research.Many producer's goods, such as inven-
35 Simulations with a macro-econometric model (see theauthor) indicate that the two liquidity channels dis-cussed in (2) and (3) far outweigh the interest rate effectsdiscussed in (1), and are indeed extremely important inthe determination of aggregate demand.
36 For example, see Modigliani.37 An important implication of the analysis of this
paper is that changes in the composition of the house-hold balance sheet which leave net wealth unchangedcan affect the expenditure behavior of households. Anincrease in indebtedness matched by an increase in hold-ings of nonfinancial assets which leaves net wealth con-stant would still lead to a future decline in consumerdurable expenditure; a decrease in the value of financialasset holdings matched by an increase in nonfinancialasset holdings that left net wealth constant would alsolead to a decline in consumer durable demand.
tories and producer's durables are also il-liquid assets; incorporating this featureinto investment models might throw lighton other possible channels of monetarypolicy effects in our economy. This avenueof monetary research should prove veryfruitful.
REFERENCESG. A. Akerlof, "The Market for 'Lemons':
Qualitative Uncertainty and the MarketMechanisms," Quart. J. Econ., Aug. 1970,84, 488-500.
C. Bischoff, "The Effects of Alternative LagDistributions," in G. Fromm, ed., Tax In-centives and Capital Spending, Washington1971, 61-130.
R. S. Bower and D. R. Lessard, "An Opera-tional Approach to Risk Screening," J. Fi-nance, May 1973, 28, 321-37.
G. Chow, The Demand for Automobiles in theUnited States: A Study in Consumer Du-rables, Amsterdam 1957.
O. Eckstein, E. W. Green, and A. Sinai, "TheData Resources Model: Uses, Structure andAnalysis of the U.S. Economy," Int. Econ.Rev., Oct. 1974, 15, 595-615.
R. C. Fair, "The Estimation of SimultaneousEquation Models with Lagged EndogenousVariables and First Order Serially Cor-related Errors," Econometrica, May 1970,38, 507-16.
D. K. Foley and M. Sidrauski, Monetary andFiscal Policy in a Growing Economy, NewYork 1971.
R. Hall and D. Jorgenson, "Tax Policy andInvestment Behavior," Amer. Econ. Rev.,June 1967, 57, 391-414.
M. J. Hamburger, "Interest Rates and the De-mand for Consumer Durables," Amer. Econ.Rev., June 1967, 57, 1131-53.
A. C. Harberger, The Demand for DurableGoods, Chicago 1960.
A. A. Hirsch, M. Liebenberg, and G. R. Green,"The BEA Quarterly Econometric Model,"Bureau of Economic Analysis staff pap. no.22, U.S. Dept. of Commerce, July 1973.
F. T. Juster and P. Wachtel, (1972a) "Antic-ipatory and Objective Models of DurableGoods Demand," Amer. Econ. Rev., Sept.1972, 62, 564-79.
Digitized for FRASER http://fraser.stlouisfed.org/ Federal Reserve Bank of St. Louis

654 THE AMERICAN ECONOMIC REVIEW SEPTEMBER 1976
and -, (1972b) "Inflation andthe Consumer," Brookings Papers, Wash-ington 1972, 1, 71-122.
T.-C Liu and E.-C. Hwa, "Structure and Ap-plications of a Monthly Econometric Modelof the U.S.','Int. Econ. Rev., June 1974,15,328-65.
M. D. McCarthy, The Wharton QuarterlyEconometric Forecasting Model—Mark III,Philadelphia 1972.
F. S. Mishkin, "Monetary Policy and Liquid-ity: Simulation Results," unpublishedpaper, July 1975.
F. Modigliani, "Monetary Policy and Con-sumption," in Consumer Spending and
Monetary Policy: The Linkages, Fed. Re-serve Bank Boston, Monetary ConferenceSeries, No. 5, Boston, June 1971, 9-84.
R. Stone and D. A. Rowe, "The Market De-mand for Durable Goods," Econometrica,July 1957,25, 423-43.
J. Tobin, "A General Equilibrium Approach toMonetary Theory," J. Money, Credit, Bank-ing, Feb. 1969, 1, 15-29.
A. Zellner, D. S. Huang, and L. C. Chau,"Further Analysis of the Short-Run Con-sumption Function with Emphasis on theRole of Liquid Assets," Econometrica, July1965, 33, 571-81.
Survey Research Center, Survey of ConsumerFinances, various years.
Digitized for FRASER http://fraser.stlouisfed.org/ Federal Reserve Bank of St. Louis