ilia bermous november - brainy's share market toolbox · high probability profitable...
TRANSCRIPT
High Probability Profitable Candlestick Patterns
Ilia Bermous
24 November 2010
Content
1. Short Introduction
2. Key Reversal Patterns: Bullish Engulfing
3. Bullish Kicking Pattern
4. Examples of notional profitable trades and their analysis
5. Conclusions
Short Introduction
Human psychology => always to be right
Can we find candlestick patterns with high probability profitable trades based ono Strong reversal (today we will consider for “long” trades only)
o Increase in trading volumes
o etc. => other characteristics will be analysed through examples of recent notional profitable trades)
NOTE: only candlesticks and trading volumes are used to make trading decisions to enter stocks
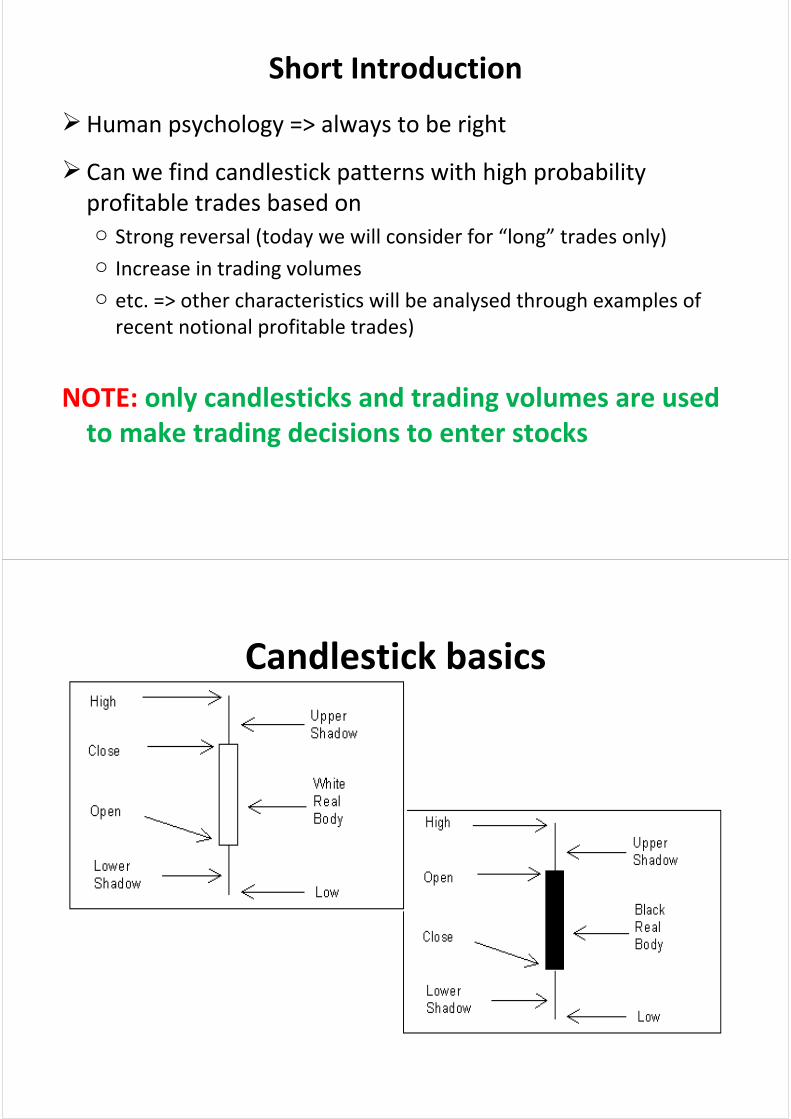
Candlestick basics
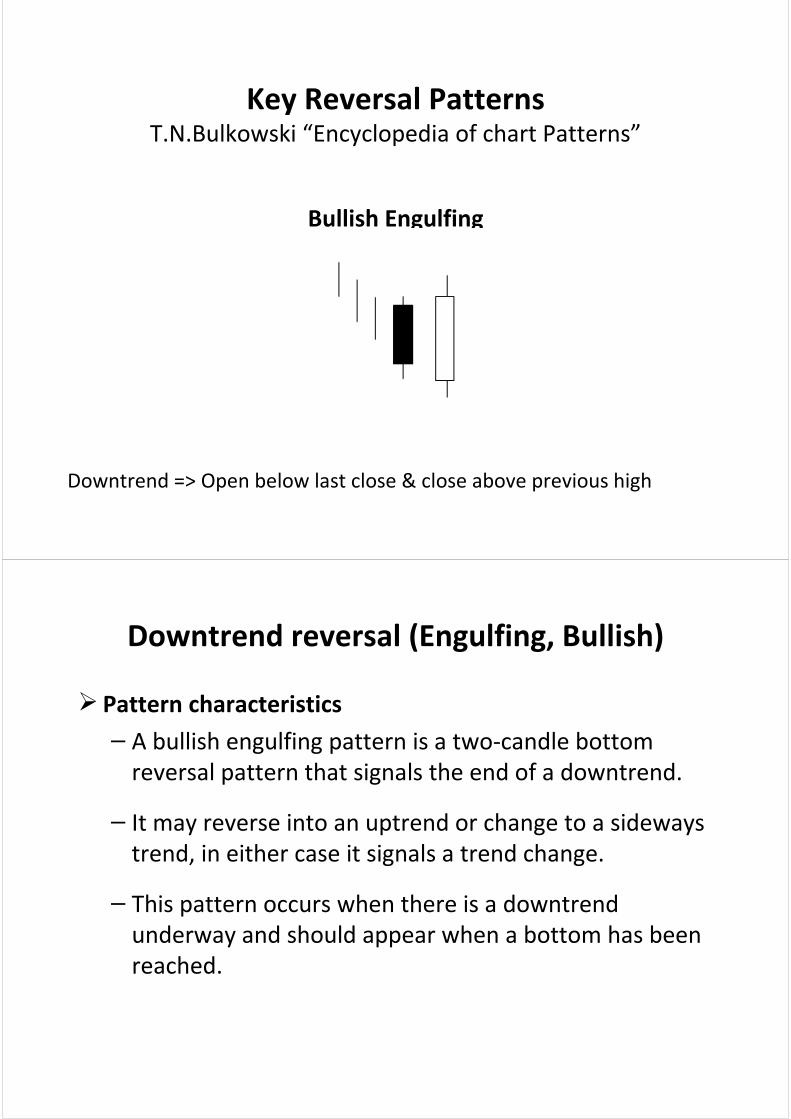
Key Reversal PatternsT.N.Bulkowski “Encyclopedia of chart Patterns”
Bullish Engulfing
Downtrend => Open below last close & close above previous high
Downtrend reversal (Engulfing, Bullish)
Pattern characteristics
– A bullish engulfing pattern is a two‐candle bottom reversal pattern that signals the end of a downtrend.
– It may reverse into an uptrend or change to a sideways trend, in either case it signals a trend change.
– This pattern occurs when there is a downtrend underway and should appear when a bottom has been reached.
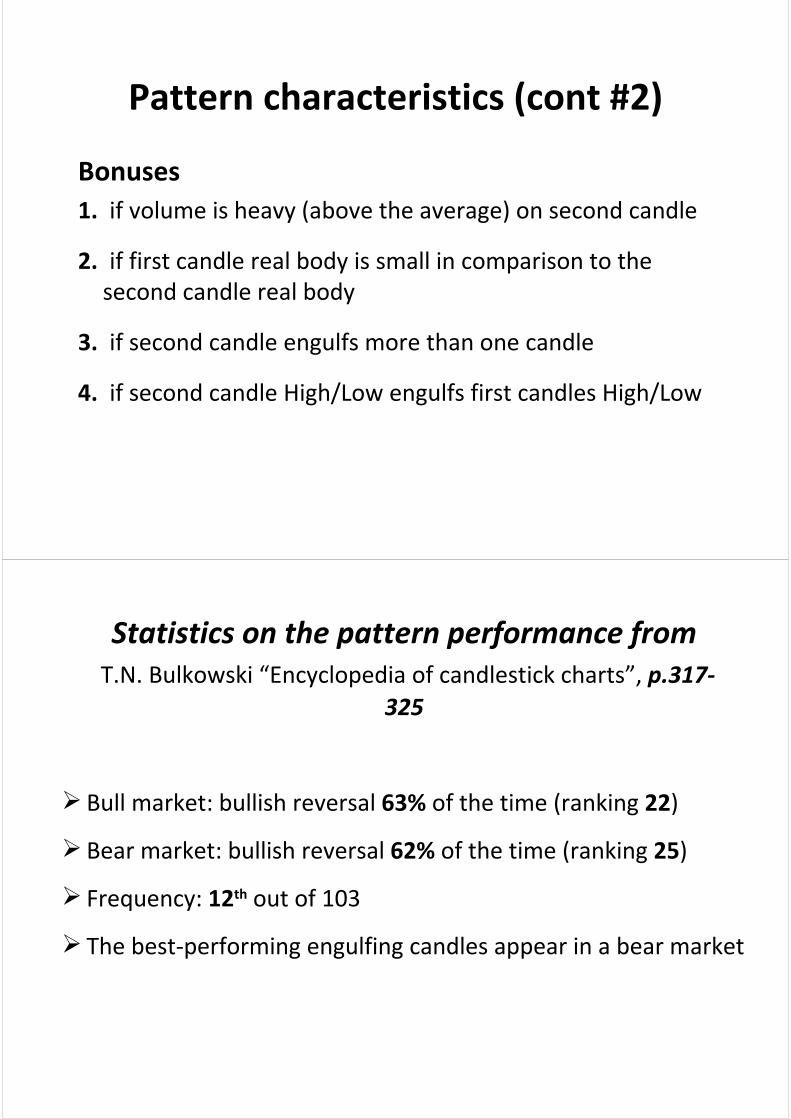
Pattern characteristics (cont #2)
Bonuses
1. if volume is heavy (above the average) on second candle
2. if first candle real body is small in comparison to the second candle real body
3. if second candle engulfs more than one candle
4. if second candle High/Low engulfs first candles High/Low
Statistics on the pattern performance from T.N. Bulkowski “Encyclopedia of candlestick charts”, p.317‐
325
Bull market: bullish reversal 63% of the time (ranking 22)
Bear market: bullish reversal 62% of the time (ranking 25)
Frequency: 12th out of 103
The best‐performing engulfing candles appear in a bear market
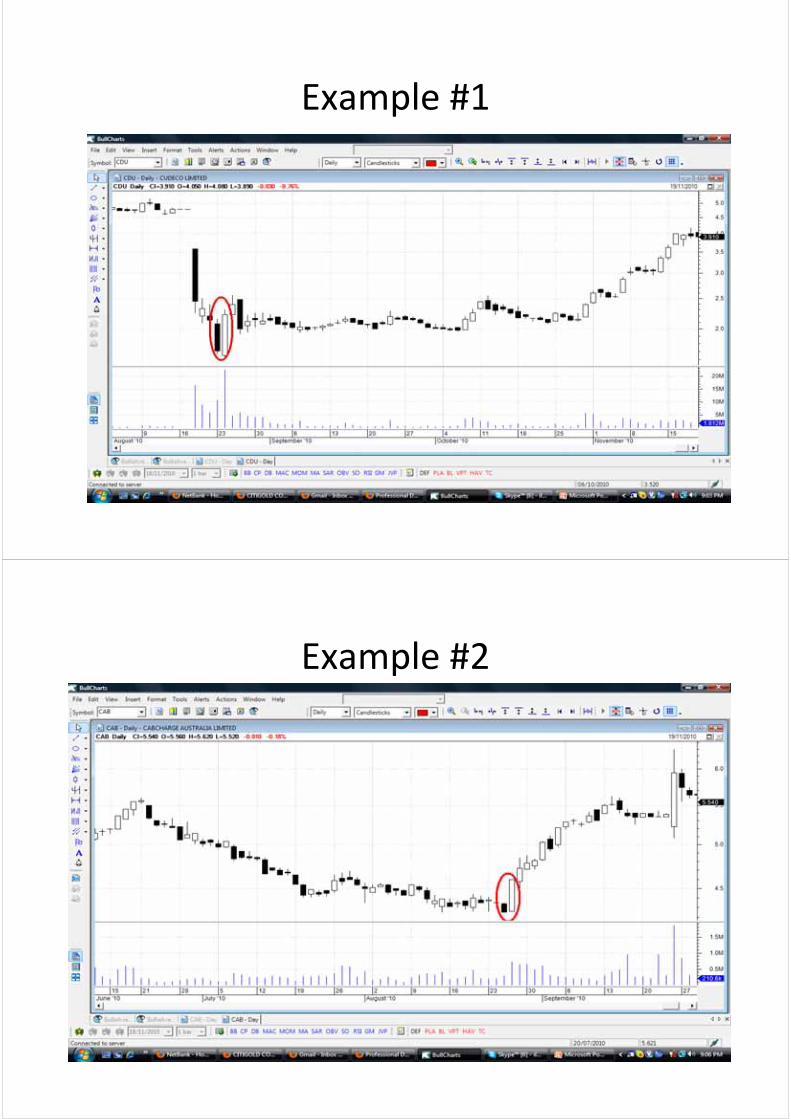
Example #1
Example #2
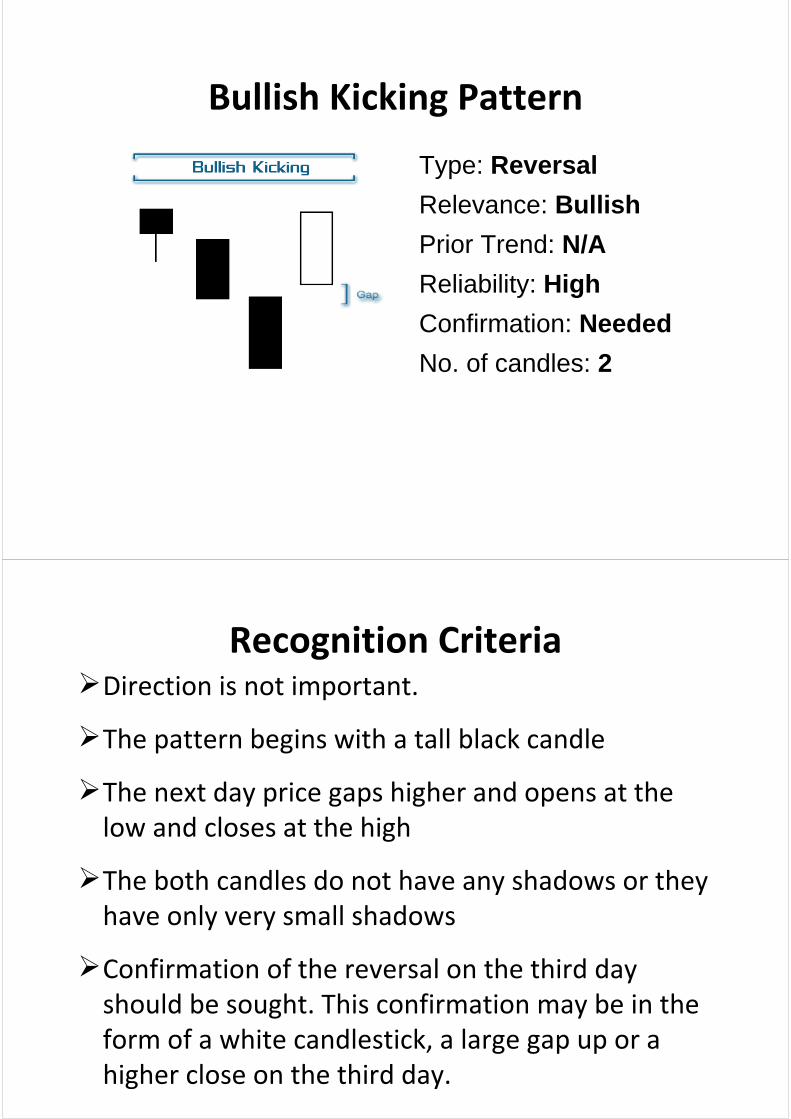
Bullish Kicking Pattern
Type: Reversal
Relevance: Bullish
Prior Trend: N/A
Reliability: High
Confirmation: Needed
No. of candles: 2
Recognition CriteriaDirection is not important.
The pattern begins with a tall black candle
The next day price gaps higher and opens at the low and closes at the high
The both candles do not have any shadows or they have only very small shadows
Confirmation of the reversal on the third day should be sought. This confirmation may be in the form of a white candlestick, a large gap up or a higher close on the third day.
Behaviour and Rank
T.N. Bulkowski “Encyclopedia of candlestick charts”, p.452
Bull market: Bullish reversal 53% of the time (rank 44)
Bear market: Bullish reversal 50% of the time (rank 48)
Frequency: 100th out of 103
Overall performance over time: 96th out of 103
Main goals of my presentation
Based on a reversal signal my idea was to find candlestick pattern setups with high probability profitable trades
During preparation for my presentation in mid August‐ beg October 2010 23 cases with a reversal signal were found, some of them will be discussed in today’s presentationo In 21 cases (out of 23) profit between 10%‐100% was achievable within from several days to several weeks
Main goals of my presentation (cont #2)
Based on the provided examples to make conclusions on what are the main characteristics of the considered setups
Looking at the illustrated candle patterns to memorise the pattern set ups to be used in your future trading
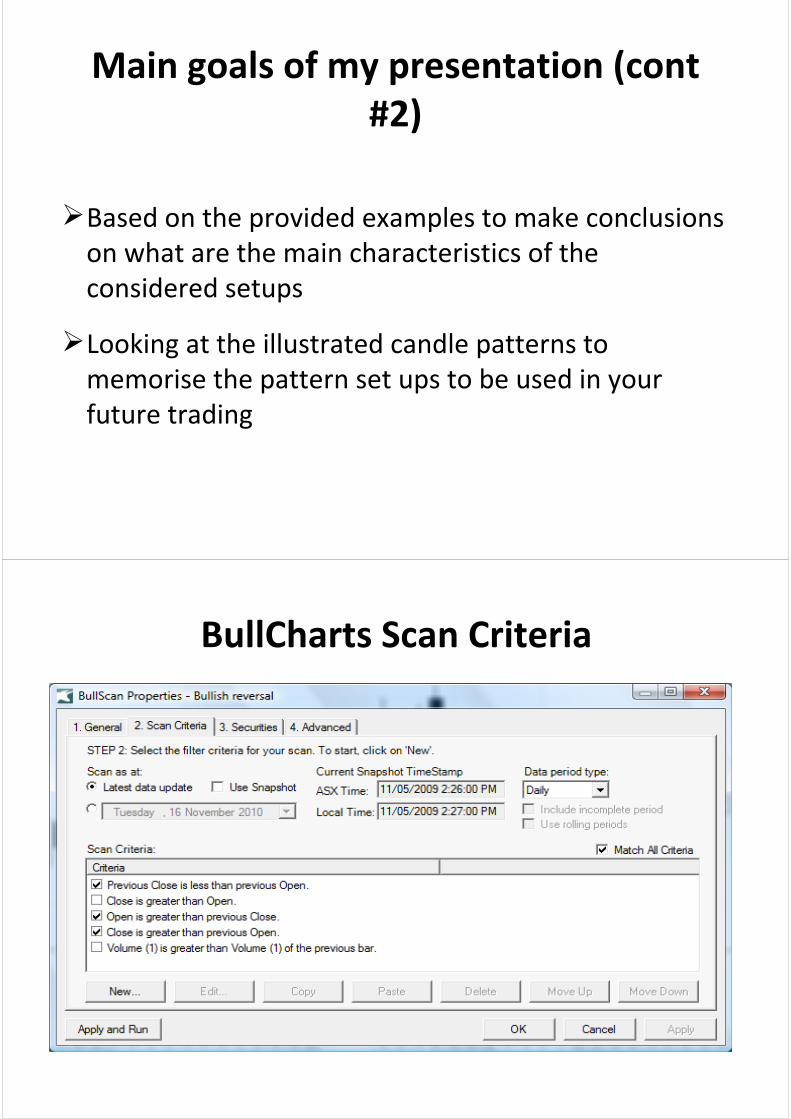
BullCharts Scan Criteria
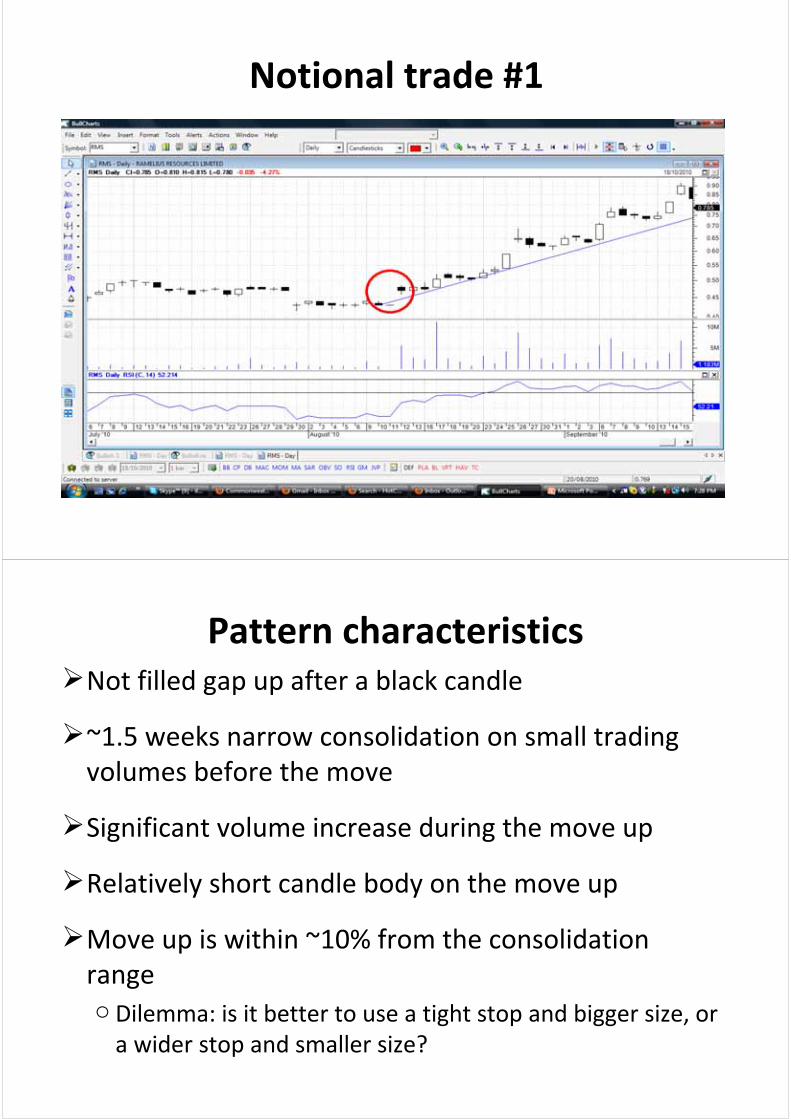
Notional trade #1
Pattern characteristicsNot filled gap up after a black candle
~1.5 weeks narrow consolidation on small trading volumes before the move
Significant volume increase during the move up
Relatively short candle body on the move up
Move up is within ~10% from the consolidation rangeo Dilemma: is it better to use a tight stop and bigger size, or a wider stop and smaller size?
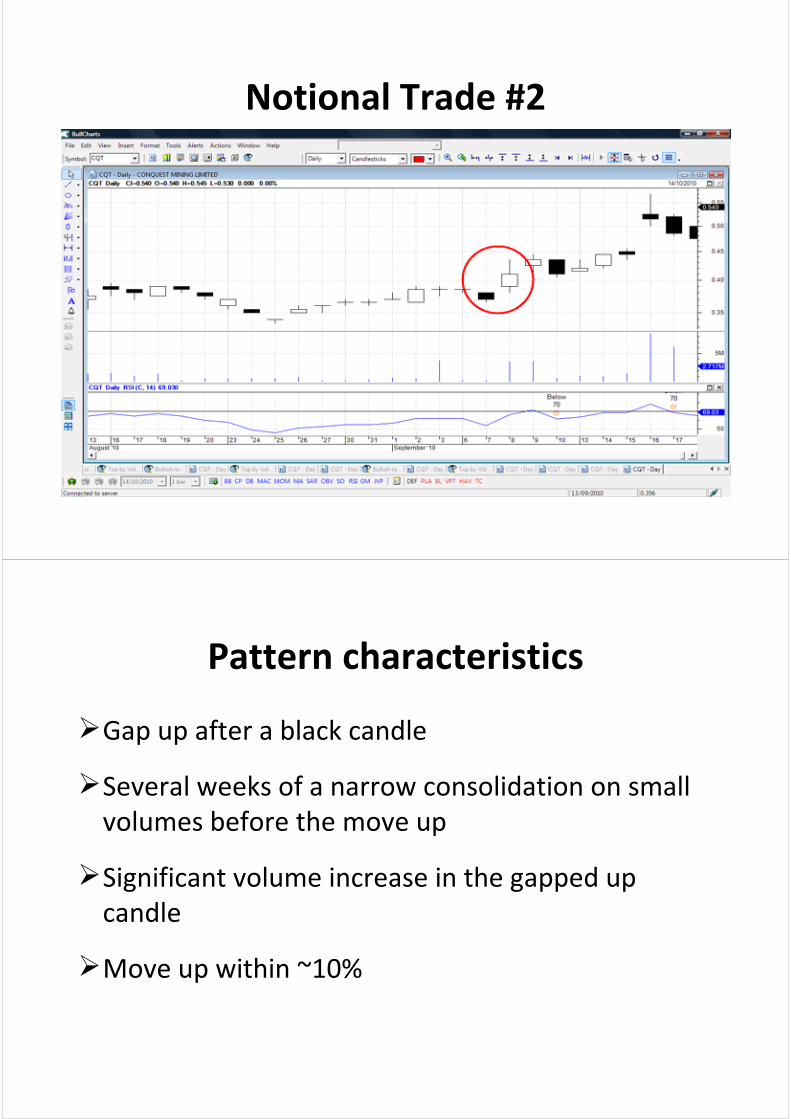
Notional Trade #2
Pattern characteristics
Gap up after a black candle
Several weeks of a narrow consolidation on small volumes before the move up
Significant volume increase in the gapped up candle
Move up within ~10%
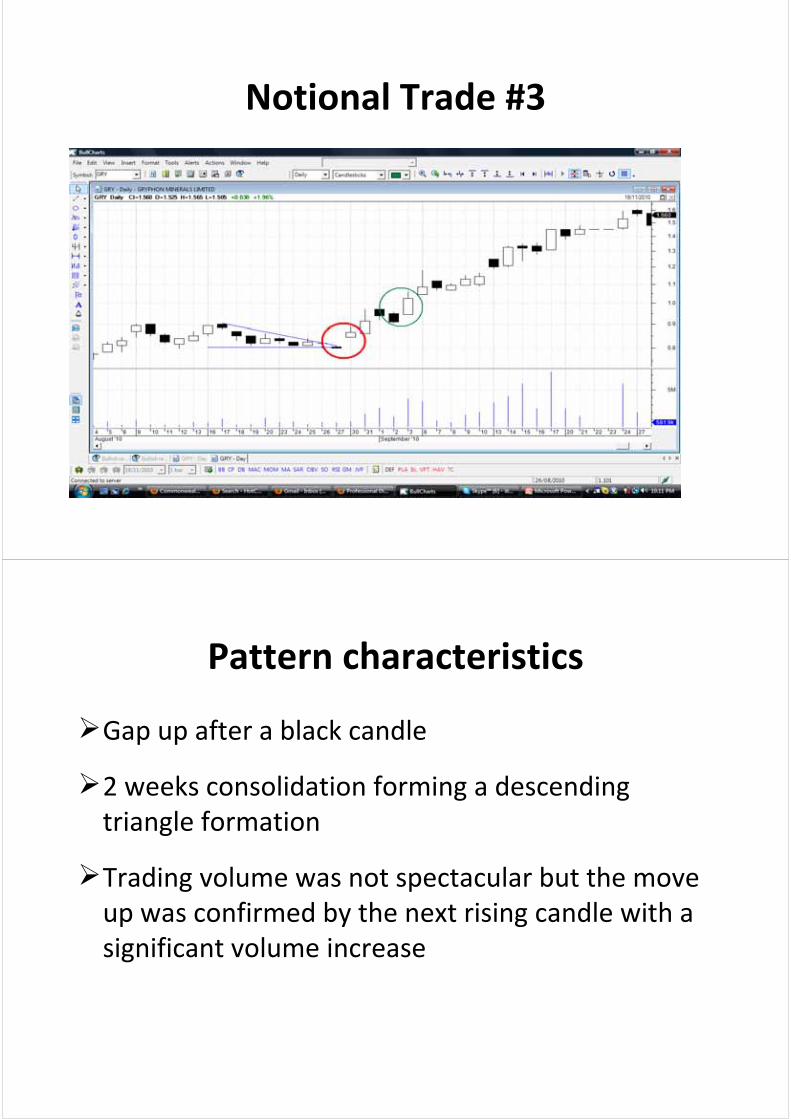
Notional Trade #3
Pattern characteristics
Gap up after a black candle
2 weeks consolidation forming a descending triangle formation
Trading volume was not spectacular but the move up was confirmed by the next rising candle with a significant volume increase
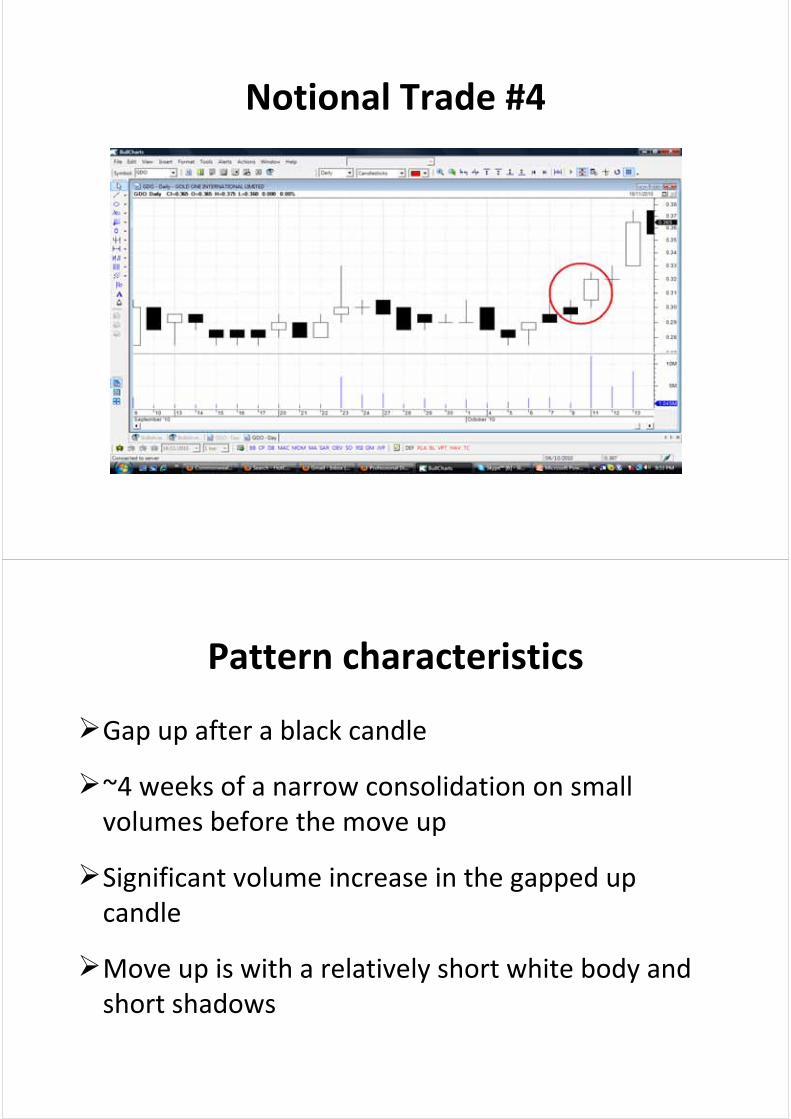
Notional Trade #4
Pattern characteristics
Gap up after a black candle
~4 weeks of a narrow consolidation on small volumes before the move up
Significant volume increase in the gapped up candle
Move up is with a relatively short white body and short shadows
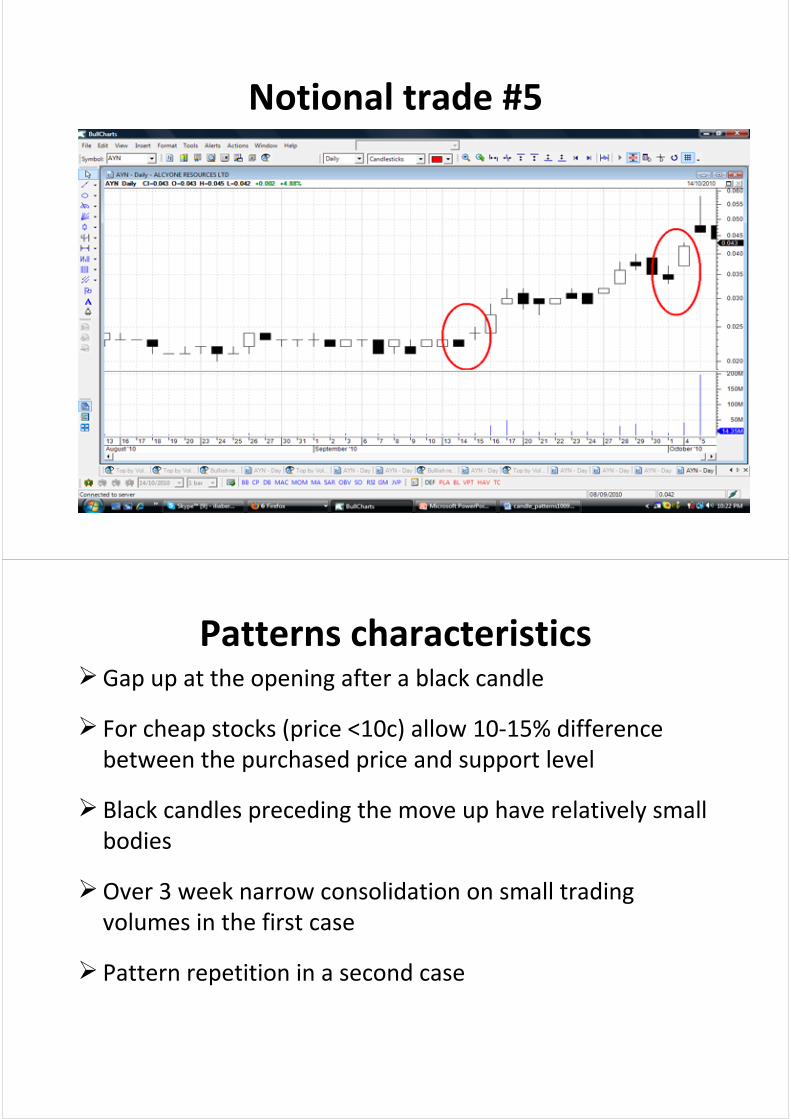
Notional trade #5
Patterns characteristicsGap up at the opening after a black candle
For cheap stocks (price <10c) allow 10‐15% difference between the purchased price and support level
Black candles preceding the move up have relatively small bodies
Over 3 week narrow consolidation on small trading volumes in the first case
Pattern repetition in a second case
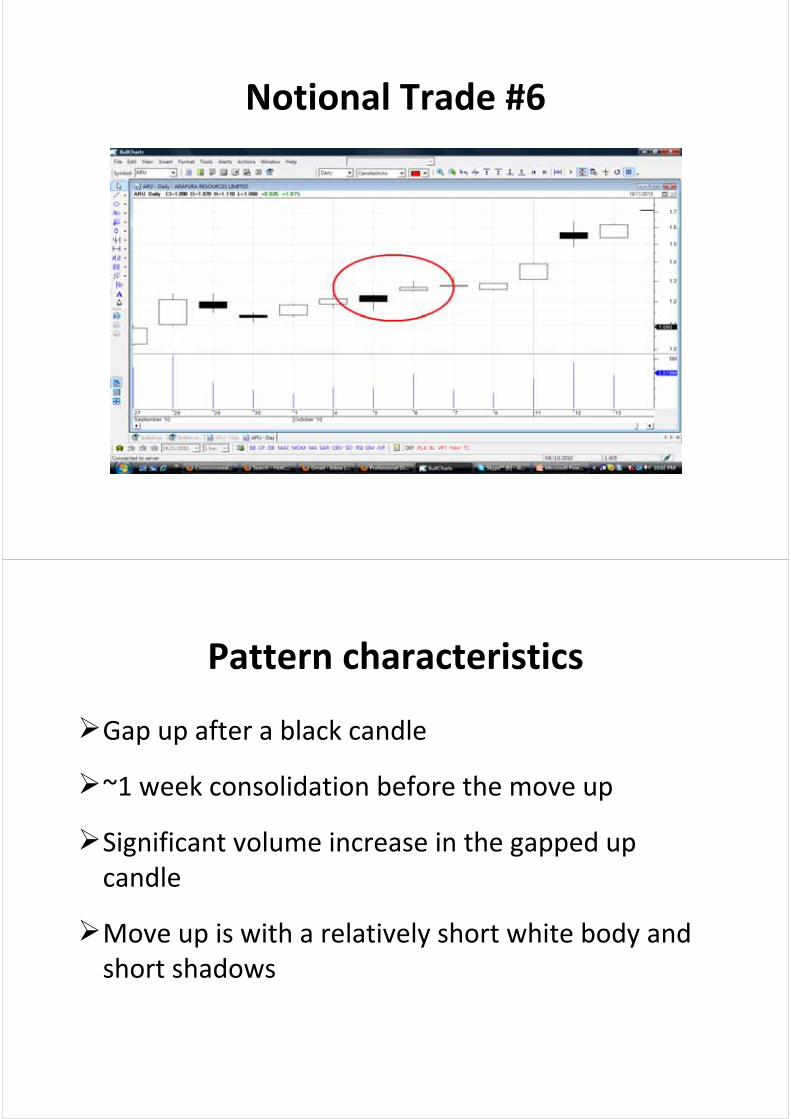
Notional Trade #6
Pattern characteristics
Gap up after a black candle
~1 week consolidation before the move up
Significant volume increase in the gapped up candle
Move up is with a relatively short white body and short shadows
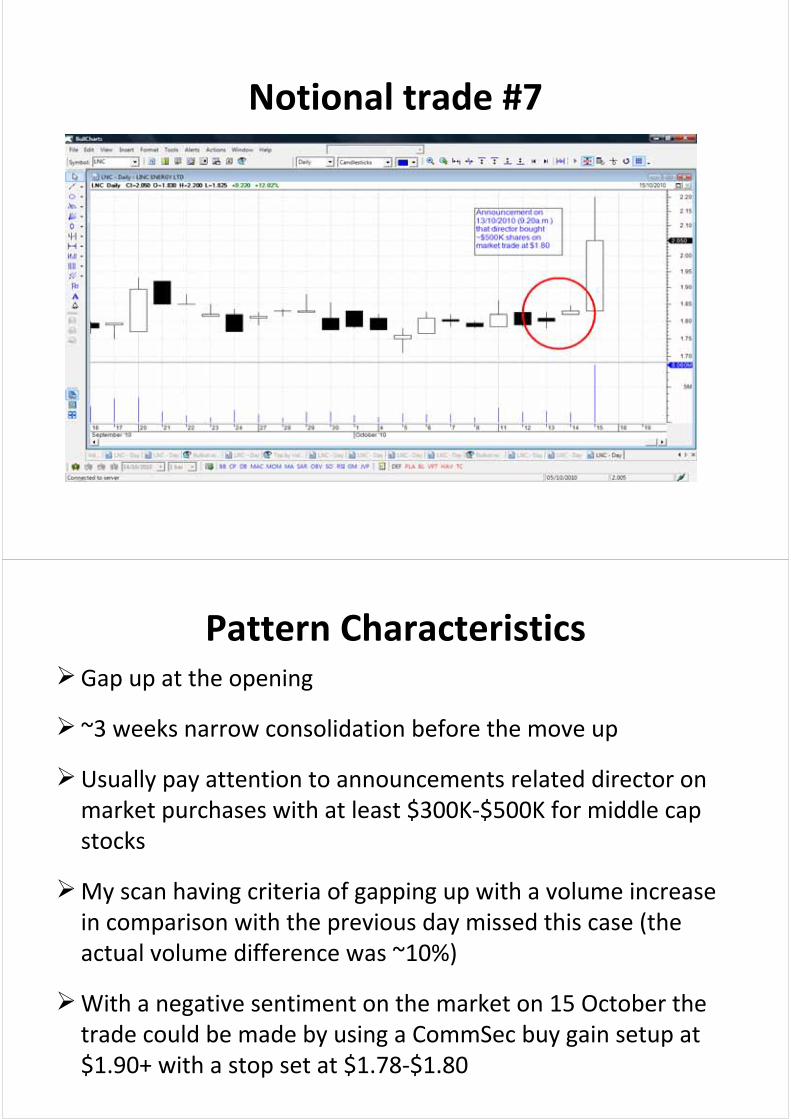
Notional trade #7
Pattern CharacteristicsGap up at the opening
~3 weeks narrow consolidation before the move up
Usually pay attention to announcements related director on market purchases with at least $300K‐$500K for middle cap stocks
My scan having criteria of gapping up with a volume increase in comparison with the previous day missed this case (the actual volume difference was ~10%)
With a negative sentiment on the market on 15 October the trade could be made by using a CommSec buy gain setup at $1.90+ with a stop set at $1.78‐$1.80
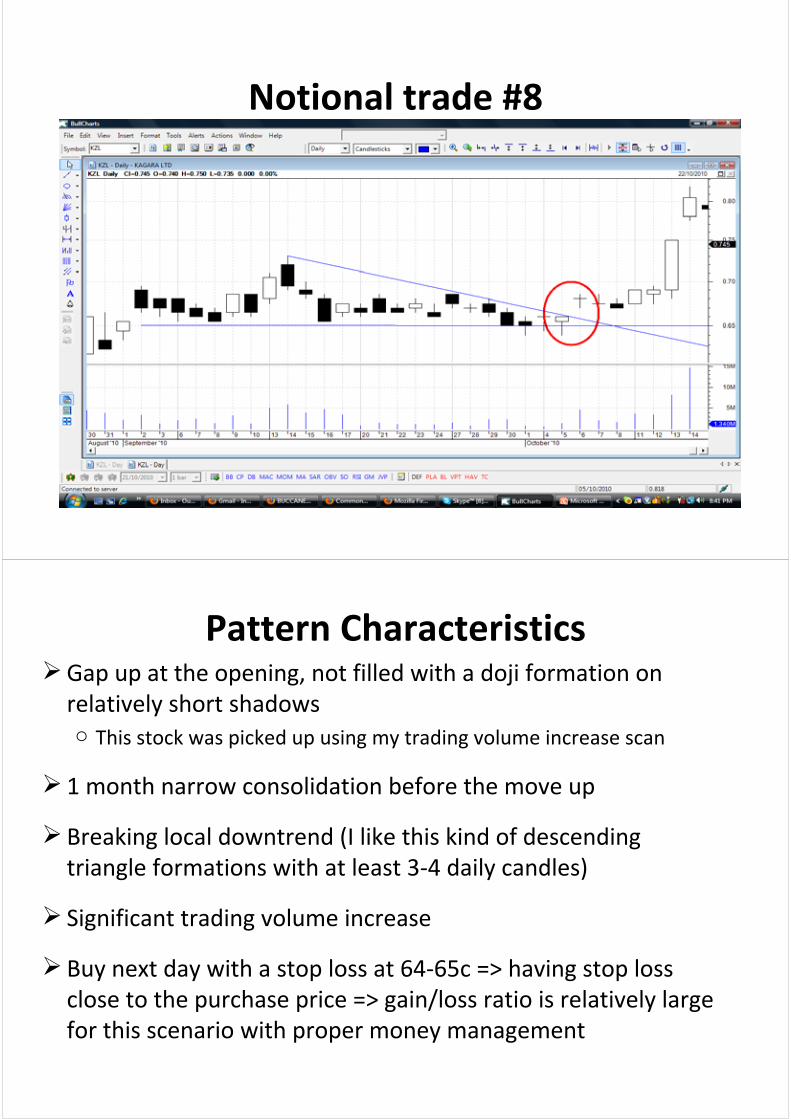
Notional trade #8
Pattern CharacteristicsGap up at the opening, not filled with a doji formation on relatively short shadowso This stock was picked up using my trading volume increase scan
1 month narrow consolidation before the move up
Breaking local downtrend (I like this kind of descending triangle formations with at least 3‐4 daily candles)
Significant trading volume increase
Buy next day with a stop loss at 64‐65c => having stop loss close to the purchase price => gain/loss ratio is relatively large for this scenario with proper money management
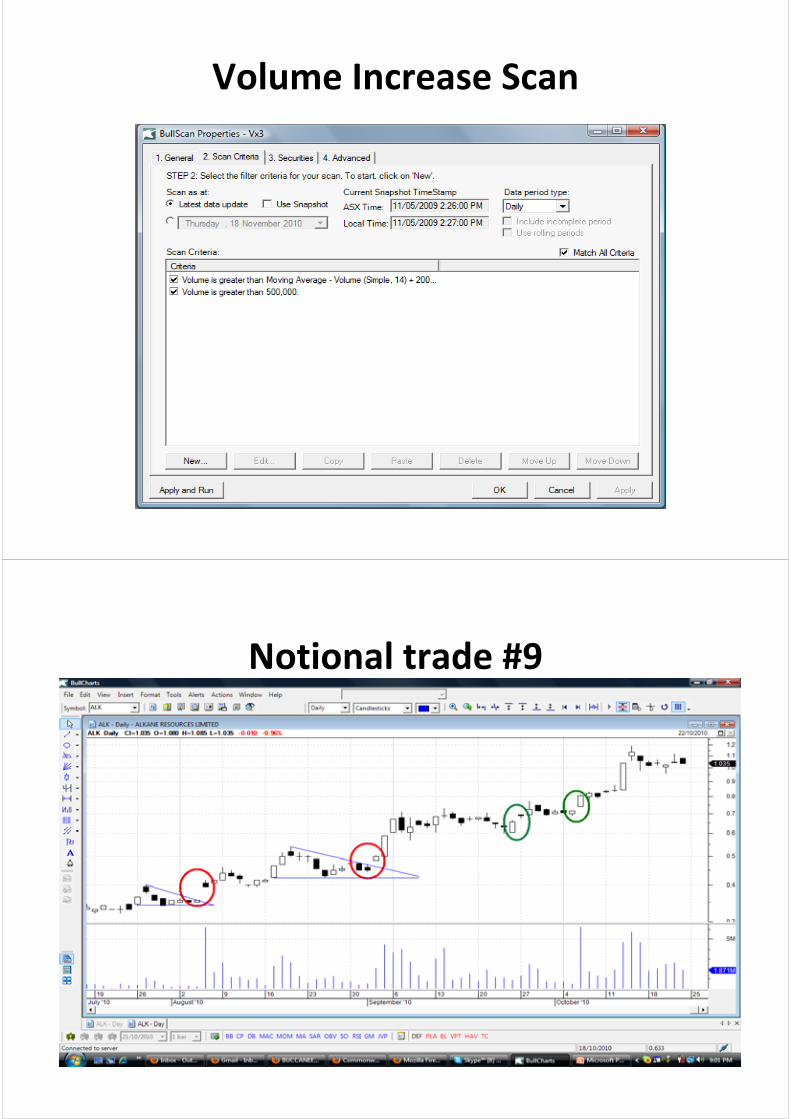
Volume Increase Scan
Notional trade #9
Pattern Characteristics
The first 2 gaps are of my favourite with small bodies, gaps on the opening and breaking descending triangle formations
1‐2 week consolidation with decreasing trading volumes before the move up
Significant trading volume increase in the gapping up candle with a relatively small body and shadows
Gaps are followed all the way in trading this stock
The green formations are tradable setups with Darryl Moley strategy
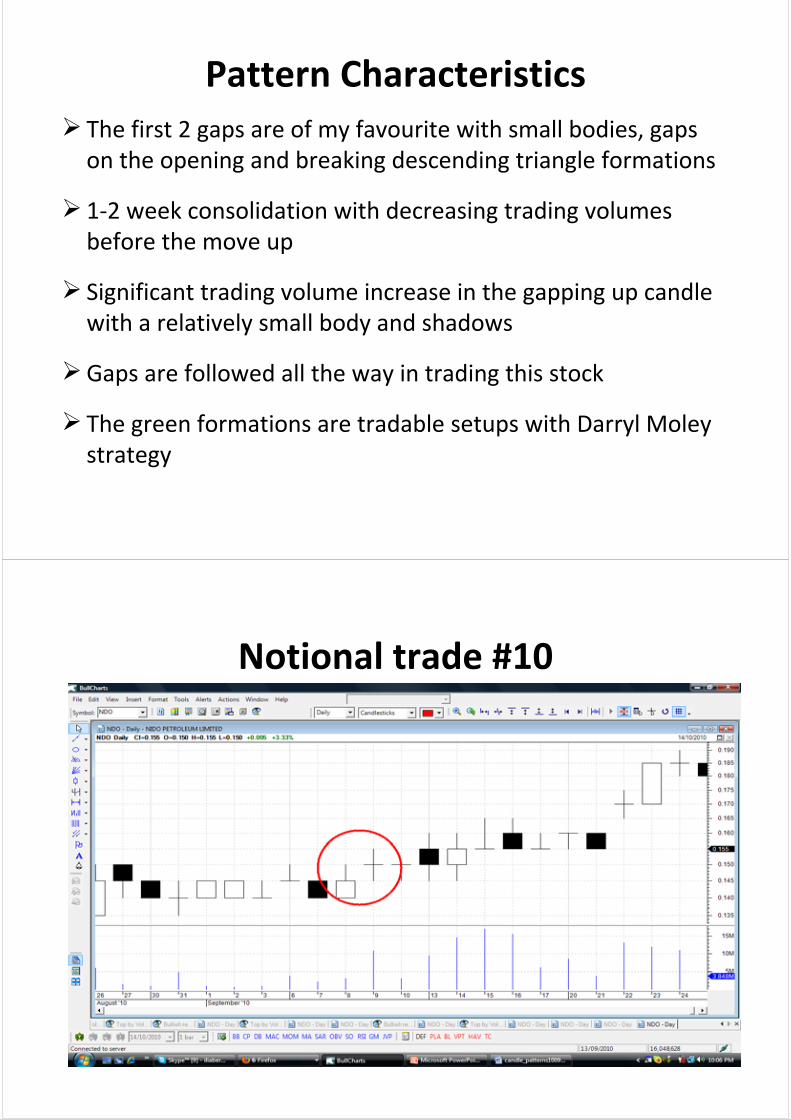
Notional trade #10
Pattern Characteristics
Gap up at the opening
~2 weeks narrow consolidation before the move up
Significant volume increase
Doji candle (no body) in the move up
Price move is <10% from the support level
Conclusions
1. Pattern recognition: black candle (day 1) followed by white candle (day 2) with a gap between opening price on day 2 and closing price on day 1
Gap can be with white, black or doji candle; on day 2
Preferable to have a relatively small body and not long shadows
bonus: black candle with a relatively small body and short shadows is followed by the opening price higher than the opening price day before
Conclusions (cont #2)
2. Pattern appearance:
a) at least after 1‐2 week consolidation on relatively small volumes or
b) descending triangle candlestick formation with at least 3‐4 candles in it with decreasing trading volumes
3. Trading volumes on a break: at least 2‐3 times higher in comparison with the average trading volumes during the consolidation stage
4. Price move on “day 2” should be under 10‐15% from the support level, otherwise need to wait for some consolidation for the entry.
Conclusions (cont #3)
5. Always worthwhile to check whether the stock has had similar patterns in the nearest past during the move up
Books
1. Steve Nison – Japanese Candlestick Charting Techniques
2. Louise Bedford ‐ Secret of Candlestick Charting
3. Louise Bedford ‐ Trading Secrets
4. Stan Weinstein's Secrets For Profiting in Bull and Bear Markets
5. Marcel Link ‐ High Probability Trading
6.T.N. Bulkowski ‐ Encyclopedia of candlestick charts