ilc bdd overview - s21.q4cdn.coms21.q4cdn.com/417792851/files/doc_presentations/2015/company... ·...
TRANSCRIPT

Estrictamente Privado y Confidencial
1Privado y Confidencial
Company PresentationMarch-15

ILC Page 2
ILC subscribed an MoU with Prudential Financial Inc.
Habitat initiated operations in Peru, after being awarded the 1st new affiliates auction for 2 years
2012June 1st
2013
ILC’s Highlights
ILC sold 51% of DesarrollosEducacionales
ILC acquired 67% of the shares of Corp Group Vida Chile S.A.
ILC placed the largest IPO in Chile (US$ 468 million)
June 18th
2013
Vida Cámara was awarded in the D&S insurance auction in Peru
Vida Cámarawas awarded in the D&S insurance auction in Chile
May 12th
2014November 18th 2013
August 19th
2014
ILC subscribed an MoU with the controlling shareholder of Banco Internacional
October 28th
2014
September 13th 2013
December 18-19th
2014
Habitat was awarded in the 2nd
new affiliates auction in Peru for 2 years.
Vida Cámara was awarded in the 2nd
D&S insurance auction in Peru

ILC Page 3
Ownership and stock price
18.3%
performance
difference as of
March 13th, 2015
Ownership structure (Dec-14)
Market Cap (MMUS$)
Stock price (Ch$)
Net Income 9M14 (US$* Th)
1,226
7,445
88,712
P/E 7.97
P/BV 1.54
March 13th 2015
-12.9%
5.4%
Evolution of the stock price
Dividend Pay Out 60%-80%
*Exchange rate of Ch$599.22 as of September 30th, 2014
-30%
-20%
-10%
00%
10%
20%
30%
40%
jul-
12
ago
-12
sep
-12
oct
-12
no
v-12
dic
-12
ene-
13
feb
-13
mar
-13
abr-
13
may
-13
jun
-13
jul-
13
ago
-13
sep
-13
oct
-13
no
v-13
dic
-13
ene-
14
feb
-14
mar
-14
abr-
14
may
-14
jun
-14
jul-
14
ago
-14
sep
-14
oct
-14
no
v-14
dic
-14
ene-
15
feb
-15
ILC IPSA
CChC67.0%
Internationals16.8%
Stockbrokers11.5%
Others4.7%

Estrictamente Privado y Confidencial
4Privado y ConfidencialILC Page 4
September, 2014
Exchange rate: CLP 599.22 per 1USD
(*) As of December 2014
(**) Gross Profit
Pension funds administration (AFP)
Life Insurance Company (Annuities)
Retirement
Sector
Health insurance institution (ISAPRE)
Hospital healthcare services
Outpatient healthcare services
Supplemental health insurance
Healthcare
and life
Insurance
Sector
Network of nine private schools and one
subsidized private school
IT and outsourcing services
Other
Business
US$640.7 mm
Revenues
US$-1.8 mm (**)
US$19.4 mm
Net Income
US$-5.3 mm
72.4%
Ownership
99.9%
US$420.7 mm
US$ 262.7 mm
US$ 12.0 mm
US$ 3.4 mm
99.9%
89.9%
US$6.9 mm US$-0.49 mm
49.0%
32.9%
Company overview
US$231.6 mm* US$155.8 mm* 67.5%

Estrictamente Privado y Confidencial
5Privado y ConfidencialILC Page 5
Revenues come from…
Gross
Salary
Net
Salary
Taxes: Range 0% - 40%
$1.27%
Commission fee
Supplemental health insurance
7%
Additional health contribution
Pension Fund Retirement
Habitat average: Ch$ 691,162 (US$ 1,049)
Chile average: Ch$ 636,713 (US$ 1,139)
Source: Superintendencia AFP, as of Dec-14; exchange rate $606.75
10%
Voluntary savings
Annuity
SavingsRetirement
Programmed Withdrawal
Mandatory Health Insurance
Voluntary Health Insurance
Insurance Healthcare

Estrictamente Privado y Confidencial
6Privado y Confidencial
Our Business
Estrictamente Privado y Confidencial
7Privado y ConfidencialILC Page 7
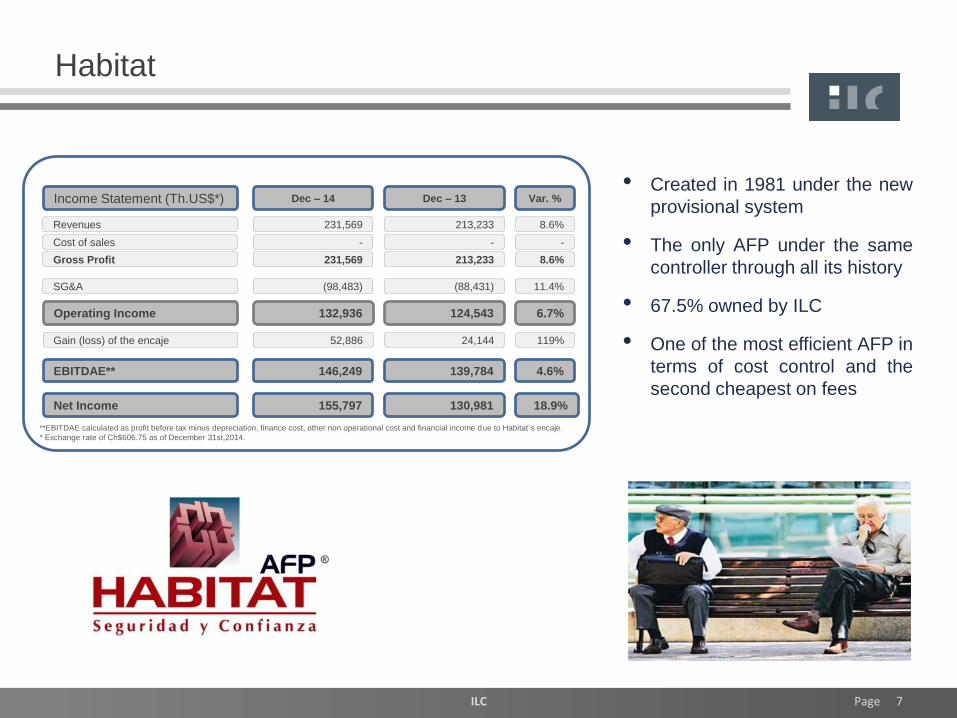
Habitat
Income Statement (Th.US$*)
Revenues
Cost of sales
Dec – 14
231,569
-
EBITDAE**
SG&A
146,249
(98,483)
Operating Income 132,936
Gross Profit 231,569
Dec – 13
213,233
-
139,784
(88,431)
124,543
213,233
Net Income 155,797 130,981
Var. %
8.6%
-
4.6%
11.4%
6.7%
8.6%
18.9%
Gain (loss) of the encaje 52,886 24,144 119%
• Created in 1981 under the new
provisional system
• The only AFP under the same
controller through all its history
• 67.5% owned by ILC
• One of the most efficient AFP in
terms of cost control and the
second cheapest on fees
**EBITDAE calculated as profit before tax minus depreciation, finance cost, other non operational cost and financial income due to Habitat´s encaje.
* Exchange rate of Ch$606.75 as of December 31st,2014.

Estrictamente Privado y Confidencial
8Privado y ConfidencialILC Page 8
1,705,563
1,178,823
979,610
448,348
443,311
172,679
PROVIDA HABITAT CAPITAL MODELO CUPRUM PLANVITAL
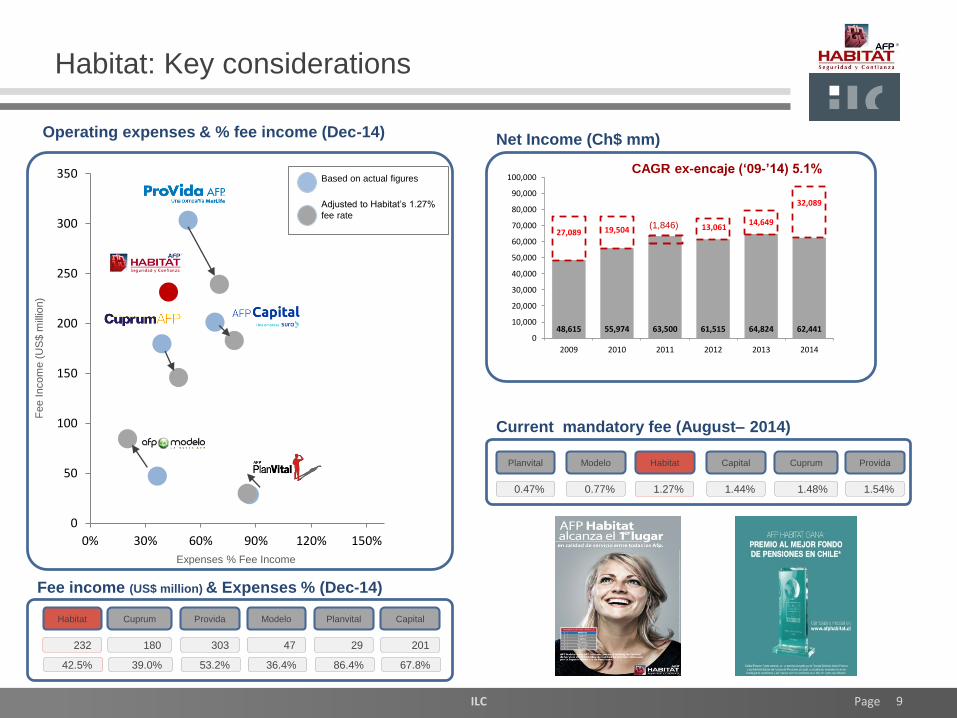
Habitat: Key considerations
Salary base increase
Voluntary savings products
Incorporation of independent workers to the system
Capture of transfers from competitors
Products offered
Mandatory individual capitalization account
Contributions = 10% of gross salary (capped at
~US$3,000 per month)
Voluntary pension contributions
Tax exempt, up to a certain amount
Voluntary savings account
Allows withdrawals at any time
Programmed withdrawals
Pension payment option in which retirees maintain
their account with the AFP
Ample growth opportunities
Total AUM = US$165.4 bn
Source: Superintendencia de Pensiones, as of December 31st, 2014
Contributors distribution (as of December 2014)
Source: Superintedencia de Pensiones1 Contributors / affiliates
Contribution rate1
53.2% 58.9% 57.8% 48.2% 77.0% 56.3%
Habitat25.9%
Provida27.8%
Planvital2.8%
Cuprum21.2%
Modelo1.7%
Estrictamente Privado y Confidencial
9Privado y ConfidencialILC Page 9
0
50
100
150
200
250
300
350
0% 30% 60% 90% 120% 150%
48,615 55,974 63,500 61,515 64,824 62,441
27,089 19,504 13,06114,649
32,089
0
10,000
20,000
30,000
40,000
50,000
60,000
70,000
80,000
90,000
100,000
2009 2010 2011 2012 2013 2014
Net Income (Ch$ mm)
Fee income (US$ million) & Expenses % (Dec-14)
Current mandatory fee (August– 2014)
Operating expenses & % fee income (Dec-14)
Habitat: Key considerations
Based on actual figures
Adjusted to Habitat’s 1.27%
fee rate
Habitat
1.27%
Capital
1.44%
Cuprum
1.48%
Provida
1.54%
Planvital
0.47%
Modelo
0.77%
Fe
e I
ncom
e (
US
$ m
illio
n)
Expenses % Fee Income
Habitat
232
Capital
201
Cuprum
180
Provida
303
Planvital
29
Modelo
47
42.5% 67.8%39.0% 53.2% 86.4%36.4%
CAGR ex-encaje (‘09-’14) 5.1%
(1,846)

Estrictamente Privado y Confidencial
10Privado y ConfidencialILC Page 10
429,034 442,013
471,108507,869
547,553
593,180
636713.0
429,414442,068
475,543
523,877
578,907
638,923
691,162
400,000
450,000
500,000
550,000
600,000
650,000
700,000
750,000
Dec-08 Dec-09 Dec-10 Dec-11 Dec-12 Dec-13 Dec-14
Industry Habitat
Ch$
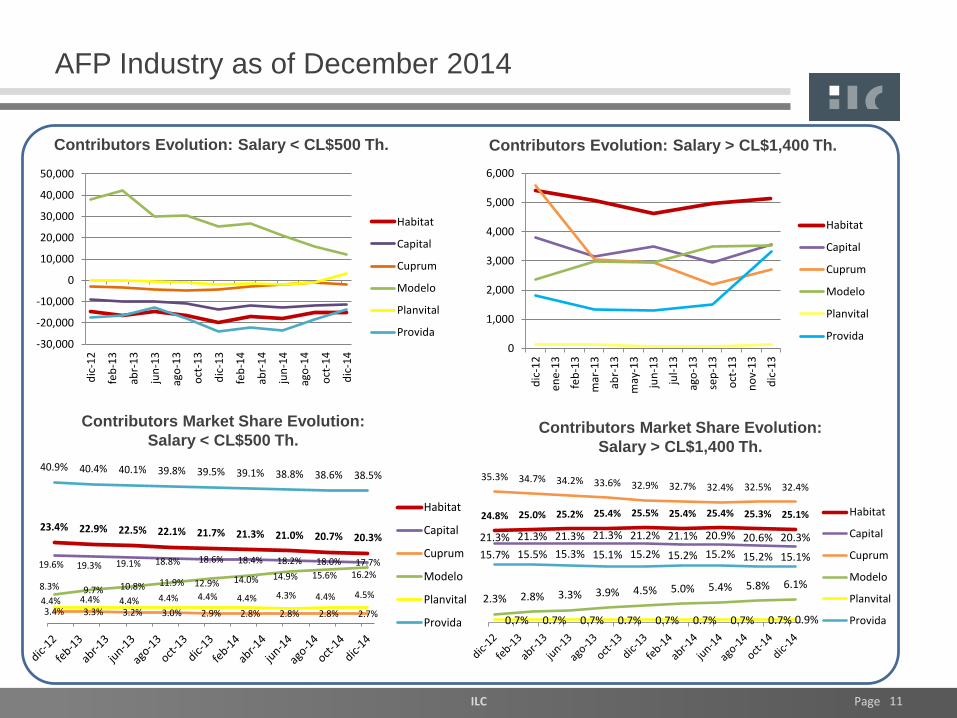
AFP Industry as of December 2014
Evolution of Contributors
Contributor average salary
Evolution of Habitat AUM (US$ Million)
Source: Superintendencia de Pensiones, as of December, 2014
CAGR: 8.3%
CAGR: 6.8%
Source: Superintendencia de Pensiones, as of December,2014
30,793
36,305 37,281
41,805 42,653 42,820
2009 2010 2011 2012 2013 2014
-0.33%
-2.21%
1.18%
17.39%
34.31%
-0.44%
0
400,000
800,000
1,200,000
1,600,000
2,000,000
Habitat Capital Cuprum Modelo Planvital Provida
dic-13 dic-14 var anual %
8.18% 7.42%
8.97%
11.83%12.25%
6.59%7.34%
Habitat Capital Cuprum Modelo Planvital Provida Sistema
Annual growth of Gross Salary(nominal terms)
Estrictamente Privado y Confidencial
11Privado y ConfidencialILC Page 11
AFP Industry as of December 2014
Contributors Evolution: Salary < CL$500 Th. Contributors Evolution: Salary > CL$1,400 Th.
Contributors Market Share Evolution:
Salary > CL$1,400 Th.
Contributors Market Share Evolution:
Salary < CL$500 Th.
-30,000
-20,000
-10,000
0
10,000
20,000
30,000
40,000
50,000
dic
-12
feb
-13
abr-
13
jun
-13
ago
-13
oct
-13
dic
-13
feb
-14
abr-
14
jun
-14
ago
-14
oct
-14
dic
-14
Habitat
Capital
Cuprum
Modelo
Planvital
Provida
0
1,000
2,000
3,000
4,000
5,000
6,000
dic
-12
ene
-13
feb
-13
mar
-13
abr-
13
may
-13
jun
-13
jul-
13
ago
-13
sep
-13
oct
-13
no
v-1
3
dic
-13
Habitat
Capital
Cuprum
Modelo
Planvital
Provida
24.8% 25.0% 25.2% 25.4% 25.5% 25.4% 25.4% 25.3% 25.1%
21.3% 21.3% 21.3% 21.3% 21.2% 21.1% 20.9% 20.6% 20.3%
35.3% 34.7% 34.2% 33.6% 32.9% 32.7% 32.4% 32.5% 32.4%
2.3% 2.8% 3.3% 3.9% 4.5% 5.0% 5.4% 5.8% 6.1%
0.7% 0.7% 0.7% 0.7% 0.7% 0.7% 0.7% 0.7% 0.9%
15.7% 15.5% 15.3% 15.1% 15.2% 15.2% 15.2% 15.2% 15.1%
Habitat
Capital
Cuprum
Modelo
Planvital
Provida
23.4% 22.9% 22.5% 22.1% 21.7% 21.3% 21.0% 20.7% 20.3%
19.6% 19.3% 19.1% 18.8% 18.6% 18.4% 18.2% 18.0% 17.7%
3.4% 3.3% 3.2% 3.0% 2.9% 2.8% 2.8% 2.8% 2.7%
8.3% 9.7% 10.8% 11.9% 12.9% 14.0% 14.9% 15.6% 16.2%
4.4% 4.4% 4.4% 4.4% 4.4% 4.4% 4.3% 4.4% 4.5%
40.9% 40.4% 40.1% 39.8% 39.5% 39.1% 38.8% 38.6% 38.5%
Habitat
Capital
Cuprum
Modelo
Planvital
Provida
Estrictamente Privado y Confidencial
12Privado y ConfidencialILC Page 12
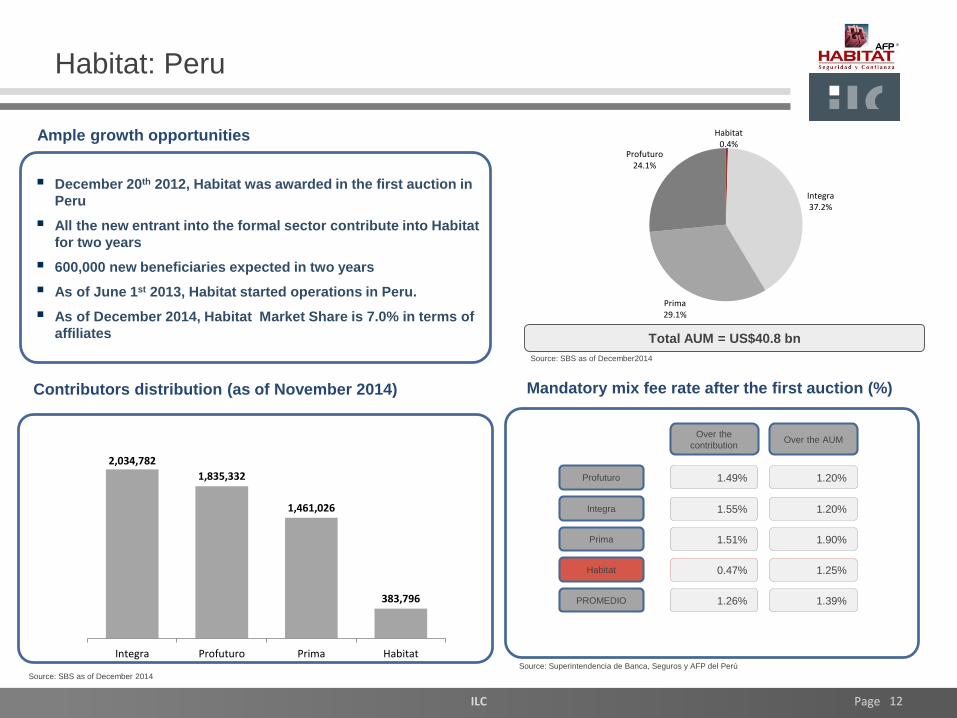
Habitat: Peru
December 20th 2012, Habitat was awarded in the first auction in
Peru
All the new entrant into the formal sector contribute into Habitat
for two years
600,000 new beneficiaries expected in two years
As of June 1st 2013, Habitat started operations in Peru.
As of December 2014, Habitat Market Share is 7.0% in terms of
affiliates
Mandatory mix fee rate after the first auction (%)
Ample growth opportunities
Total AUM = US$40.8 bn
Source: SBS as of December2014
Contributors distribution (as of November 2014)
Prima
1.55%
Over the
contribution
Integra
Over the AUM
1.51%
1.49%Profuturo
PROMEDIO
0.47%Habitat
1.26%
1.20%
1.90%
1.20%
1.25%
1.39%
Source: Superintendencia de Banca, Seguros y AFP del Perú
Source: SBS as of December 2014
2,034,782
1,835,332
1,461,026
383,796
Integra Profuturo Prima Habitat
Habitat0.4%
Integra37.2%
Prima29.1%
Profuturo24.1%

Estrictamente Privado y Confidencial
13Privado y ConfidencialILC Page 13
Potential synergies in the health business
7% of the
gross salary
is the
mandatory
contribution
* The GES plan cost 0.325 U.F since July 1st, 2013
Full coverage of 80
diseases in an
established network *
10% of the
gross salary
is the average
contribution
Average monthly contribution
per contributor: USD $137.8Medical Bill
Monthly primus
Co-payment
between the
company and
the employee
Average monthly contribution
per beneficiary: USD $18.7
% covered by:
% covered by:
% of the
Net Salary
% covered by the
person
or
USD 15.2**

Estrictamente Privado y Confidencial
14Privado y ConfidencialILC Page 14
Consalud
Sep – 14
420,722
(352,308)
(57,805)
12,713
68,414
Sep – 13
383,158
(328,398)
(53,105)
4,851
54,760
12,000 6,805
Var. %
9.8%
7.3%
8.9%
162.1%
24.9%
76.3%
Income Statement (Th. US$*)
Revenues
Cost of sales
SG&A
Operating Income
Gross Margin
Net Income
• Created in 1984 under the new
provisional health system
(Isapre)
• 99.9% owned by ILC
• The price of GES rose to UF
0.325 due to the inclusion of 11
new diseases, since July 1st,
2013
19,148 10,598 80.7%EBITDA**
**EBITDA calculated as profit before tax minus depreciation, finance cost and other non operational cost.
*Exchange rate of Ch$599.22 as of September 30th, 2014.

Estrictamente Privado y Confidencial
15Privado y ConfidencialILC Page 15
Products offered
Consalud: Key considerations
Growing demand prospects
Leading private health insurance provider
and strong market position
Strong brand recognition
Continuous innovation and incorporation of
new technologies
First choice provider for people moving
from the public to the private health
insurance system
Medical plans
Open network plans
Preferred provider plans
Closed network plans
Complementary product offerings
Additional coverage for catastrophic
diseases
Dental plans
Pharmacy plans
18.6%
18.2%
13.6%
29.8%
19.7%
Isapre: 3.12 mm
Fonasa D: 3.0 mm
Fonasa C: 2.2 mm
Fonasa B: 4.9 mm
Fonasa A: 3.2 mm
Source: Superintendencia de Salud, as of September 2014
Others includes Vida Tres and Ferrosalud.
Total Contributors = 1,750,333
Source: Fonasa, as of December, 2012
Consalud20.7%
Cruz Blanca21.0%
Banmédica20.8%
Colmena16.2%
Masvida16.2%
Others5.2%

Estrictamente Privado y Confidencial
16Privado y ConfidencialILC Page 16
Consalud: Key considerations
Source: Superintedencia de Salud and ILC 1 Operating revenues divided by the number of contributors. Exchange rate of Ch$599.22 as of September 30th,2014; 2 Operating expenses divided by operating revenues
Number of Contributors (as of September 2014) Average monthly contribution1 in US$ (Sep. 2014 LTM)
Loss ratio2 (as of September 2014 LTM)Number of Beneficiaries (as of September 2014)
367,125 363,617 362,014
283,619 283,361
74,867
0
50,000
100,000
150,000
200,000
250,000
300,000
350,000
400,000
Cruz Blanca Banmédica Consalud Colmena Masvida Vida Tres
667,073 666,276 658,183
523,943 506,643
140,131
0
100,000
200,000
300,000
400,000
500,000
600,000
700,000
800,000
Banmédica Consalud Cruz Blanca Masvida Colmena Vida Tres
83.6%
85.2%
86.0%
86.8%
87.8%
89.3%
82.0%
83.0%
84.0%
85.0%
86.0%
87.0%
88.0%
89.0%
90.0%
Consalud Cruz Blanca Colmena Vida Tres Banmedica Masvida
137.8 144.9158.0
168.8
194.0
238.2
0
50
100
150
200
250
300
Consalud Cruz Blanca Banmedica Vida Tres Masvida Colmena

Estrictamente Privado y Confidencial
17Privado y ConfidencialILC Page 17
Consalud: Operating data
Mandatory contributions (Ch$ million)
Voluntary contributions (Ch$ million)
Sep -14 LTM
241,378
92,893
TOTAL (Ch$ million) 334,829
Others (Ch$ million) 558
Dec-12
208,126
66,793
275,380
461
Dec-13
231,374
80,426
312,320
520
Source: Superintedencia de Salud, FEFI Consalud as of September 2014.
353,870 361,204 362,014
$ 778,195
$ 864,664
$ 924,907
750,000
800,000
850,000
900,000
950,000
348,000
350,000
352,000
354,000
356,000
358,000
360,000
362,000
364,000
Dec-12 Dec-13 Sep-14 LTM
ContributorsN° Contributors Revenues / Contributor
(Ch$)
671,571 675,665 666,276
$ 410,053
$ 462,241
$ 502,539
350,000
370,000
390,000
410,000
430,000
450,000
470,000
490,000
510,000
530,000
500,000
520,000
540,000
560,000
580,000
600,000
620,000
640,000
660,000
680,000
700,000
Dec-12 Dec-13 Sep-14 LTM
BeneficiariesN° Beneficiaries Revenues / Beneficiary
(Ch$)

Estrictamente Privado y Confidencial
18Privado y ConfidencialILC Page 18
Red Salud
Sep-14
262,726
(205,780)
(39,023)
17,923
56,946
Sep-13
236,861
(186,453)
(33,575)
16,834
50,408
3,428 6,906
Var. %
10.9%
10.4%
16.2%
6.5%
13.0%
(50.4%)
Income Statement (Th. US$*)
Revenues
Cost of sales
SG&A
Operating Income
Gross Margin
Net Income
• One of the main private
healthcare providers, reaching
close to 18.6% of the private
beds in Chile
• 89.9% owned by ILC
• National coverage through a
network of 16 hospitals and 33
medical centers
30,872 30,953 (0.3%)EBITDA**
**EBITDA calculated as profit before tax minus depreciation, finance cost and other non operational cost.
*Exchange rate of Ch$599,22 as of September 30th ,2014.

Estrictamente Privado y Confidencial
19Privado y ConfidencialILC Page 19
68
100
103
105
105
128
256
321
335
400
228
540
Iquique
Las Lilas
Avansalud
UC San Carlos
UC Lira
Tabancura
Las Condes
Indisa
Santa María
Alemana
Bicentario
Davila
Chilean private hospitals by number of beds (2013)
Red Salud: Overview
493*
Red Salud hospitals
Others
ILC market share
(in terms of private
hospital beds):
18,6%
Source: ILC, annual reports of the companies as filed with the SVS, except Clinica Alemana, where the information has been derived from its website; *Represents the original number of beds for this project,
still not approve by the board.
222

Estrictamente Privado y Confidencial
20Privado y ConfidencialILC Page 20
Evolution of revenues – Red Salud
Red Salud: Operating data
Admissions
Emergency room visits
Sep-13
39,140
97,450
Patient days 96,243
Sep-14
39,609
99,822
100,306
Tabancura
Avansalud
Average
ocupancy rate
75.1%
66.2%
Iquique 55.6%
Bicentenario 75.2%
Average lenght of
stay (days)
3.00
1.70
2.40
4.00
September - 14
Includes Bicentenario, Avansalud, Tabancura and Iquique hospitals
Evolution of EBITDA LTM – Clínica Bicentenario (Ch$ mm)
66,442 74,735 78,459
97,369
117,691129,466
0
50,000
100,000
150,000
200,000
250,000
Dec-12 Dec-13 Sep-14 UDM
Hospital revenues Outpatient revenues
Ch$ million
-4,881
-4,418-4,096
-3,508
-3,061
-2,599-2,273
-1,926
-1,331-1,508-1,427
-1,089
-634-594-533-168
100
488740
1,0891,420
1,7641,943
1,849
2,0142,237
2,344
2,351
2,291 2,209 2,1832,2232,576
-6,000
-5,000
-4,000
-3,000
-2,000
-1,000
0
1,000
2,000
3,000
dic
-11
en
e-1
2
feb-1
2
ma
r-1
2
ab
r-1
2
ma
y-1
2
jun-1
2
jul-12
ag
o-1
2
sep-1
2
oct-
12
no
v-1
2
dic
-12
en
e-1
3
feb-1
3
ma
r-1
3
ab
r-1
3
ma
y-1
3
jun-1
3
jul-13
ag
o-1
3
sep-1
3
oct-
13
no
v-1
3
de
c-1
4
jan-1
4
feb-1
4
ma
r-1
4
ab
r-1
4
ma
y-1
4
jun-1
4
jul-14
au
g-1
4
sep-1
4

Estrictamente Privado y Confidencial
21Privado y ConfidencialILC Page 21
Red Salud: Operating data
Evolution of Revenues, Net Income and EBITDA of our private
hospitals and outpatient centers
Income Statement (Sep-14) Megasalud Avansalud Tabancura Bicentenario Iquique
Ch$ millions
Revenues 68,387 25,884 25,231 30,833 4,800
Cost of sales (54,393) (19,377) (19,189) (25,568) (3,203)
Gross Profit 13,994 6,506 6,042 5,265 1,596
SG&A (8,770) (3,486) (4,130) (4,605) (1,043)
Operating Income 5,225 3,020 1,912 660 553
Net Income 4,194 1,513 1,249 (1,790) 306
EBITDA(*) 7,538 4,894 2,971 2,294 842
EBITDA Mg. 11.0% 18.9% 11.8% 7.4% 17.5%(*) EBITDA calculated as Operating Income minus depreciation and amortization
Income Statement (Sep-13) Megasalud Avansalud Tabancura Bicentenario Iquique
Ch$ millions
Revenues 62,032 23,443 23,724 26,590 4,832
Cost of sales (48,548) (18,193) (17,997) (22,803) (3,281)
Gross Profit 13,484 5,250 5,728 3,787 1,552
SG&A (8,118) (2,741) (3,605) (3,480) (1,155)
Operating Income 5,366 2,509 2,122 307 397
Net Income 4,061 1,139 1,485 (1,517) 279
EBITDA(*) 7,597 4,198 3,102 1,804 545
EBITDA Mg. 12.2% 17.9% 13.1% 6.8% 11.3%(*) EBITDA calculated as Operating Income minus depreciation and amortization

Estrictamente Privado y Confidencial
22Privado y ConfidencialILC Page 22
Vida Cámara
Sep – 14
(3,937)
7,486
(7,968)
(9,826)
(1,858)
Sep – 13
(1,691)
6,231
(5,417)
(876)
4,541
(5,315) (649)
Var. %
(132.9%)
20.1%
47.1%
(1021%)
(140.9%)
(719%)
D&S Chile- Gross Profit **
Health and life Insurance- Gross Profit **
SG&A
Operating Income
Gross Margin
Net Income
• Created in 2009 due to the
acquisition of 99.9% of RBS
(Chile) Seguros de Vida S.A.
• 99.9% owned by ILC
• On January 2012 launch the
complementary health
insurance business, adding
more than 9,000 beneficiaries
per month
• As of September 23rd 2013,
Vida Cámara was awarded,
with two of seven fractions, the
D&S insurance auction in Peru.
• As of May 12th 2014, Vida
Cámara was awarded, with two
of nine fractions of the male
pool, in the D&S auction in
Chile.
*Exchange rate of Ch$599,22 as of September 30tth 2014. ** Includes
Technical Margin and Investments results.
Income Statement (Th. US$*)
(5,408) - -D&S Peru – Gross Profit **
Estrictamente Privado y Confidencial
23Privado y ConfidencialILC Page 23
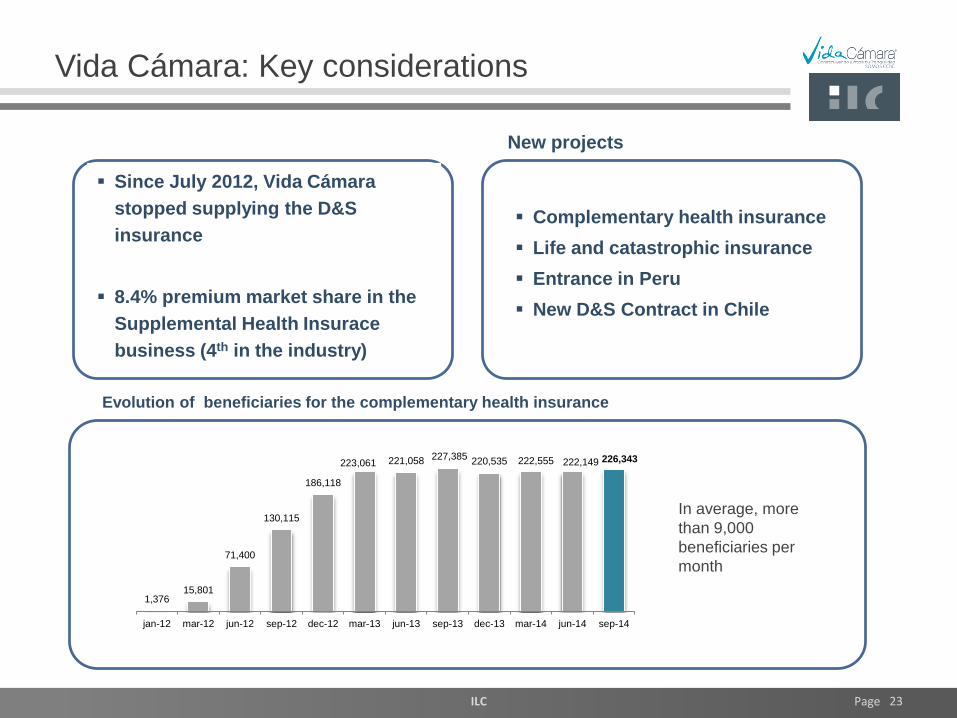
Vida Cámara: Key considerations
Since July 2012, Vida Cámara
stopped supplying the D&S
insurance
8.4% premium market share in the
Supplemental Health Insurace
business (4th in the industry)
Complementary health insurance
Life and catastrophic insurance
Entrance in Peru
New D&S Contract in Chile
In average, more
than 9,000
beneficiaries per
month
Evolution of beneficiaries for the complementary health insurance
New projects
1,37615,801
71,400
130,115
186,118
223,061 221,058 227,385220,535 222,555 222,149 226,343
jan-12 mar-12 jun-12 sep-12 dec-12 mar-13 jun-13 sep-13 dec-13 mar-14 jun-14 sep-14

Estrictamente Privado y Confidencial
24Privado y ConfidencialILC Page 24
Inv. CorpGroupInterhold Ltda.
Corp Group Banking S.A.
FIP Corp Life
Corp Group Vida Chile S.A.
CorpGroup Vida Ltda.
72.4% of the shares
44.9%33.1%
22.0%
100%100% 100%
Corp Group Vida Chile
Sep – 14 (**)
364,500
(601,278)
(18,643)
20,765
39,408
Sep – 13
400,206
(611,936)
(32,423)
(36,353)
(3,930)
19,417 (31,217)
Var. %
(8.9%)
(1.7%)
(42.5%)
157.1%
1103%
162%
Revenues from insurance activities
Cost of Sales
SG&A
Operating Income
Gross Margin
Net Income
• As of November 18th, 2013 ILC
acquired 67% of the shares of
Corp Group Vida Chile S.A.
• The price paid for the shares
and social rights was CLP
$87,250 million (US$ 167.5
mm)
Key Considerations (as of Sep-2014)
• 14.6% Market share on
annuities
• 7.5% Market share on life
insurance direct premium
• 16.5% Market share on AuM
• More than 300,000 policy
holders in CorpVida
*Exchange rate of Ch$599,22 as of September 30tst 2014.(**) ILC only consolidate the 1Q14 period.
Income Statement (Th. US$*)
276,187 207,800 32.9%Revenues from financial result
(6,346) (8,305) 30.9%Non-Insurance Activity Profit
23,043 (27,516) 146.6%Insurance Activity Profit

Estrictamente Privado y Confidencial
25Privado y ConfidencialILC Page 25
Corp Group Vida Chile
Income Statement evolution of Corp Group Vida Chile
subsidiaries
Corpseguros S.A.
Income Statement 9M14 9M13 Var % 3Q14 3Q13 Var %
Premium Income 48,631 53,478 -9.1% 15,534 7,908 96.4%
Annuity 46,639 51,317 -9.1% 14,873 7,208 106.3%
Loans 1,991 2,161 -7.8% 661 701 -5.7%
Result of Investments 121,672 83,200 46.2% 46,289 11,704 295.5%
Reserves and Claims (143,574) (148,387) -3.2% (48,544) (38,991) 24.5%
Gross Profit 26,729 (11,710) 328.3% 13,279 (19,378) 168.5%
Administrative expenses (4,866) (4,450) 9.4% (1,703) (1,654) 3.0%
Operating Income 21,863 (16,160) 235.3% 11,576 (21,033) 155.0%
Non-Operating income 1,309 (617) 312.2% 179 81 -120.2%
Profit before tax 23,172 (16,776) 238.1% 11,755 (20,951) 156.1%
Income tax expenses (2,515) 5,779 143.5% (1,311) 2,161 160.6%
Profit to Corpseguros S.A. (**) 20,657 (10,998) 287.8% 10,444 (18,790) 155.6%
US$ Th. (*) US$ Th. (*)
(*) Exchange rate of $599.22 as of September 30th 2014. (**) ILC only consolidate the 2014 period.
Corpvida S.A.
Income Statement 9M14 9M13 Var % 3Q14 3Q13 Var %
Premium Income 334,340 351,479 -4.9% 100,340 112,986 -11.2%
Annuity 269,096 279,342 -3.7% 80,002 90,023 -11.1%
Individual Life Insurance 54,294 44,429 22.2% 16,597 15,437 7.5%
Corporate 8,698 25,748 -66.2% 2,968 6,842 -56.6%
Loans 2,252 1,959 14.9% 774 684 13.1%
Result of Investments 138,763 100,894 37.5% 57,448 40,247 42.7%
Reserves and Claims (449,828) (455,489) -1.2% (135,703) (154,625) -12.2%
Gross Profit 23,275 (3,116) 846.8% 22,085 (1,392) 1686.7%
Administrative expenses (17,406) (15,977) 8.9% (5,996) (5,935) 1.0%
Operating Income 5,868 (19,094) 130.7% 16,089 (7,326) 319.6%
Non-Operating income (3,977) (973) 308.8% (2,821) (1,760) -60.3%
Profit before tax 1,891 (20,067) 109.4% 13,268 (9,086) 246.0%
Income tax expenses 494 3,548 -86.1% (1,116) 2,932 138.1%
Profit to Corpvida S.A. (**) 2,386 (16,519) 114.4% 12,152 (6,155) 297.4%(*) Exchange rate of $599.22 as of September 30th 2014. (**) ILC only consolidate the 2014 period.
US$ Th. (*) US$ Th. (*)
Estrictamente Privado y Confidencial
26Privado y Confidencial
Financial Summary
Estrictamente Privado y Confidencial
27Privado y ConfidencialILC Page 27
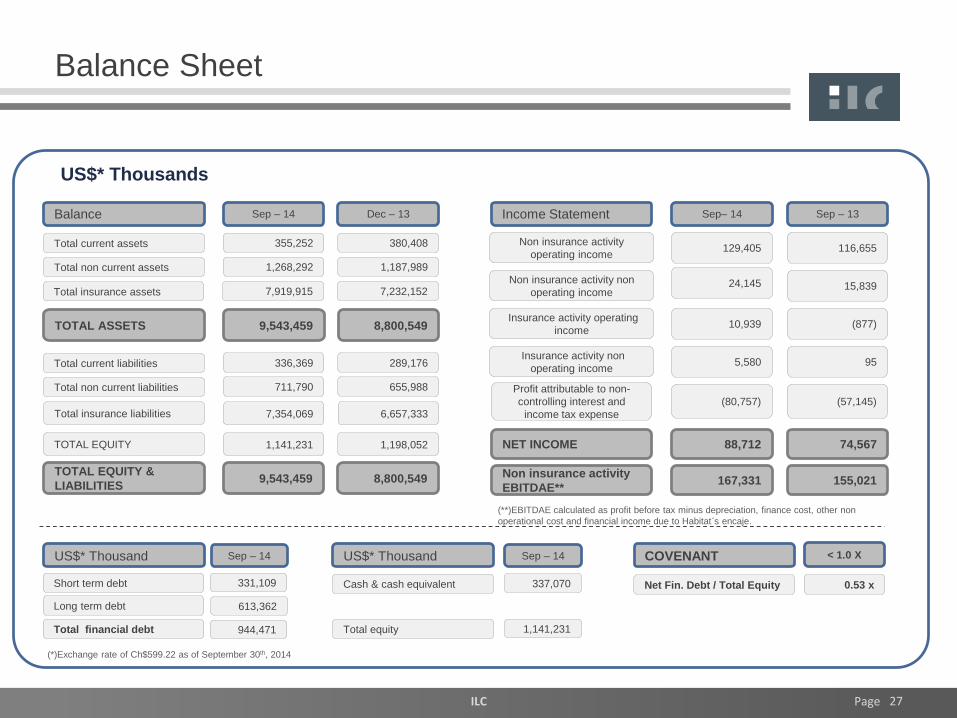
Balance Sheet
Sep – 14
355,252
1,268,292
9,543,459
Dec – 13
380,408
1,187,989
8,800,549
Balance
Total current assets
Total non current assets
TOTAL ASSETS
336,369
711,790
7,354,069
289,176
655,988
6,657,333
Total current liabilities
Total non current liabilities
Total insurance liabilities
1,141,231 1,198,052TOTAL EQUITY
9,543,459 8,800,549TOTAL EQUITY &
LIABILITIES
US$* Thousands
Sep – 14
331,109
613,362
US$* Thousand
Short term debt
Long term debt
944,471Total financial debt
Sep – 14
337,070
1,141,231
US$* Thousand
Cash & cash equivalent
Total equity
< 1.0 X
0.53 x
COVENANT
Net Fin. Debt / Total Equity
(*)Exchange rate of Ch$599.22 as of September 30th, 2014
7,919,915 7,232,152Total insurance assets
Sep– 14
129,405
Sep – 13Income Statement
Non insurance activity
operating income
88,712 74,567NET INCOME
167,331 155,021
Profit attributable to non-
controlling interest and
income tax expense
116,655
24,145Non insurance activity non
operating income15,839
Insurance activity operating
income10,939 (877)
Insurance activity non
operating income5,580 95
(80,757) (57,145)
Non insurance activity
EBITDAE**
(**)EBITDAE calculated as profit before tax minus depreciation, finance cost, other non
operational cost and financial income due to Habitat´s encaje.

Estrictamente Privado y Confidencial
28Privado y ConfidencialILC Page 28
Financial Data (as of September 2014)
Financial Debt
Cash Flow from our main subsidiaries (Sep-14) EBITDA (non insurance business) (Sep-14)
Credit Risk
Feller Rate:
AA+
Humphreys:
AA+
Local credit rating
(*) According to Superintendency of Health regulation. (**) According to the current dividend policy of each subsidiary as of September 2014
Financial Debt
(USD million)ILC Habitat
Vida
Cámara
Corp Group
Vida Chile S.A.C. Machalí Consalud Red Salud
TOTAL
Short Term 30.2 0.1 - 262.3 1.2 0.1 34.8 328.8
Bonds 1.9 - - 18.3 - - 1.0 21.3
Bank loans 28.3 0.1 - 244.0 1.2 0.1 28.0 301.7
Leasing - - - - - - 5.8 5.8
Long Term 241.8 0.4 2.3 177.2 4.7 0.9 188.4 615.7
Bonds 95.0 - - 154.9 - - 76.6 326.6
Bank loans 146.9 - 2.3 22.2 4.7 0.9 34.9 211.9
Leasing - 0.4 - - - - 76.8 77.2
Total 272.0 0.4 2.3 439.5 6.0 1.0 223.2 944.5
Sep-14 Distributable Net
Income (US$ Th)
Dividend Policy**
% Ownership %
Div. to ILC (US$
Th.)
Habitat 56,852 90% 67.5% 34,527
Red Salud 3,428 100% 89.9% 3,082
Consalud* 14,303 100% 99.9% 14,289
Vida Cámara (5,315) 100% 99.9% -
CGVC 19,417 30% 72.4% 4,219
Total 88,686 56,117
105,754 113,791
10,59819,148
30,953
30,8727,716
3,520
0
20,000
40,000
60,000
80,000
100,000
120,000
140,000
160,000
180,000
9M13 9M14
Others
Red Salud
Consalud
Habitat
US$ Th.

Estrictamente Privado y Confidencial
29Privado y Confidencial
Company PresentationMarch-15
For more information, please contact with:
Ignacio González R. María Paz Merino Pagola
CFO Head of Investor Relations
Phone: (56 2) 2477 4606 Phone: (56 2) 2477 4673
[email protected] [email protected]
www.ilcinversiones.cl