ijmperd - a simulation study of domestic hot water …
TRANSCRIPT

www.tjprc.org SCOPUS Indexed Journal [email protected]
A SIMULATION STUDY OF DOMESTIC HOT WATER FOR FLAT PLATE SOLAR
COLLECTOR USING TRANSIENT SYSTEM SIMULATION SOFTWARE (TRNSYS)
MOHD AFZANIZAM MOHD ROSLI1, LOGAN NAIDU PURUSOTHMA NAIDO
2, MOHD KHAIRUL
ANUAR SHARIF3, MAIDI SAPUTRA
4, SULAIMAN ALI
5
1Centre For Advance Research on Energy, Universiti Teknikal Malaysia Melaka, Hang Tuah Jaya, 76100, Durian
Tunggal, Melaka, Malaysia
2Fakulti Kejuruteraan Mekanikal, Universiti Teknikal Malaysia Melaka, Hang Tuah Jaya, 76100, Durian Tunggal,
Melaka, Malaysia
3Jabatan Kerja Raya, Kuala Lumpur, Malaysia
4,5Teuku Umar, Meulaboh, Aceh, Indonesia
ABSTRACT
This paper presents a simulation investigation on the flat plate solar collector by finding out the best performance and
the suitable number of collectors. A validation on the performance of the flat plate collectors in Cyprus is carried out.
The Transient Systems Simulation (TRNSYS) program simulation is conducted to reduce the experimentation time and
avoid high experimental and design cost. The objectives of this project are to obtain the performance of flat plate solar
collector by using TRNSYS as well as to determine the suitable number of collectors for domestic hot water in Melaka
City by govern by Hottell-Whillier-Bliss equation in TRNSYS. The commercial available flat plate collector was used
from MYSOLAR CONCEPT SDN BHD to perform this study. The optimum number of collectors for domestic hot
water in Melaka City was determined by using the series 5 MY-60 flat plate collector. The results show that the increase
in temperature inlet and the temperature outlet of a solar system will proportionally increase the performance of the
flat plate solar collector. The results also show the area of 2.5m2 gives a more optimum temperature output for 78.42%
of the whole annual heating load of domestic hot water in Melaka.
KEYWORDS: Flat Plate Solar Collector, Trnsys, Domestic Hot Water
Received: Jun 08, 2020; Accepted: Jun 28, 2020; Published: Sep 16, 2020; Paper Id.: IJMPERDJUN20201275
1.INTRODUCTION
Renewable energy resources are contributing to the sustainability of energy supply which is why the usage of
renewable energy is shooting up. The increase of renewable energy will reduce the rate of global warming issues
because of gas emission due to energy gain from fossil fuels [1]. Malaysia has annual solar radiation of
1643kWh/m2 and sunshine 4-5 hours per day. Currently, solar energy in Malaysia is frequently for the water pump,
domestic hot water heating system crops drying [2].
Solar photovoltaic and solar thermal systems are groups of direct solar energy technology.Solar
photovoltaic is used for the generation of hot air where else solar thermal systems are used for the generation of
electricity. However, a photovoltaic thermal collector can carry out a simultaneous generation of both electrically
and thermally. It has the advantage to increase the overall photovoltaic thermal efficiency while also saving good
space.
Orig
inal A
rticle International Journal of Mechanical and Production
Engineering Research and Development (IJMPERD)
ISSN (P): 2249–6890; ISSN (E): 2249–8001
Vol. 10, Issue 3, Jun 2020, 13381–13392
© TJPRC Pvt. Ltd.

13382 Mohd Afzanizam Mohd Rosli, Logan Naidu Purusothma Naido,
Mohd Khairul Anuar Sharif, Maidi Saputra, Sulaiman Ali
Impact Factor (JCC): 8.8746 SCOPUS Indexed Journal NAAS Rating: 3.11
Solar energy changes for the production of domestic hot water that includes hot water processing and water pre-
heating ahead of other types of thermal intake. Until 2002, there were 10000 domestic solar water heaters used in Malaysia
(most of them used are from thermosyphon type) with an annual growth rate of 10-15%. However, for the generation of
electricity in rural areas and net metering productions where the systems received a large sum, it is very much noticeable
hat the solar PV implementations in Malaysia are reduced to mainly standalone PV systems [3].
According to this study [4], another way of utilizing the solar energy is the through thermal collectors, in which
solar energy is transformed into useful heat energy in many different applications by using solar collectors [5]. Finding the
area and sizing of the solar water heating system requires a huge number of input data, which is hard to get all the times.
Besides, the high performable designed system will always do better in providing the volume of domestic hot water. The
difficulty in finding the collector areas require the amount of cold and hot water mix at a certain temperature level. In this
study, solar water heating systems (SWHS) is chosen as a tool of solar thermal energy conversion., to reduce the energy
usage in the considered residents.
The prime objective of this study is to find out the performance of flat plate solar collector by using a simulation
software called TRNSYS based on the user input data and as well to study the temperature outlet of hot water using
Hottell-Whillier-Bliss equation. Therefore, the objectives of this project are to perform a TRNSYS simulation in simulating
the temperature input and the temperature output of the flat plate solar collector and finding out the temperature difference
between them which will lead to the find of the best solar collector performance. The optimum number of solar collectors
to be installed in Melaka City using the weather data of Melaka city 2020 and also the Hottell-Whillier-Bliss equation.
The solar collectors will determine the performance of the domestic hot water system and also the heat transfer of
solar water heating system. The surface area of a flat plate solar collector is very much influential in determining the
suitable performance of the solar system in specified locations. The surface areas of the flat plate solar collector also
determine the functionality of the solar system in the industry. In this study, a flat plate solar collector is used in the solar
model to determine performance by using TRNSYS simulation software. Besides that, the suitable number of solar
collectors needed to be installed in Melaka City for an optimum use will find out and also the suitable surface areas of flat
plate solar collectors required by the industry will be determined according to the industry specifications and requirements.
Too much heating of solar heat installations occurs when the solar energy takes in by the solar collector exceeds
the potential of its heat transfer circuit to constantly cool it, which causes excessive temperatures. This is usually because
of low energy demand and this phenomenon is also known as high-temperature output. It is most severe when the flow of
the heat transfer fluid through the collector is stopped because of power outages or component failures which causes the
production to stop.
Overheating that comes from the number of collectors that can add on in the solar collector loop when it is not
taken away to a useful heating job. This can cause inconvenience and may finally lead to heating system failure at worst.
Hottell-Whillier-Bliss equation is used in this study to determine the number of collectors using the domestic hot water.
Solar collectors will convert solar radiation into heat and direct that heat to a medium (water, solar fluid, or air). The heat
produced by solar can be used for heating water. For this study, the flat plate solar collector is used to provide heat to the
domestic hot water system.

A Simulation Study of Domestic Hot Water for Flat Plate Solar Collector 13383
Using Transient System Simulation Software (TRNSYS)
www.tjprc.org SCOPUS Indexed Journal [email protected]
2. Modelling and Validation
2.1 Validation for Cyprus
The general experimental work setup model in Figure 1 in TRNSYS shows the operation of a solar system using a
thermosiphon flat plate collector to analyze the energy and economic performance of low-cost commercial solar thermal
collectors. The weather conditions from March 2017 to May 2017 is linked to the thermosiphon flat plate collector. The
collector is connected to the Tee piece. Both the flow diverter and the tee-piece are linked to the online plotter (Type 65a)
which will produce the graph for the solar system.
The base settings to use in the TRNSYS simulation system are the components that are used for basic solar system
generation. For this study, The TMY2 Reader (Type109) used to provide a reading of weather data in Larnaca, Cyprus
which is to analyze the energy and economic performance of low cost commercial solar thermal collectors.
In the system used in this study, TMY2 reads the weather conditions constantly, and it checks the data of solar
radiation to find radiation of tilted surface radiation and incidence angle for an arbitrary number of surfaces. The
simulation undergoes with Europe weather climate conditions.
As a preliminary result, a validation on the result of the journal by S.A Kalogiroou et al, (2018) study is carried
out. The TRNSYS model scheme of Figure 2 uses the Larnaca, Cyprus weather data from 15 October 2017 – 15 April
2018 generated from Meteonorm 7.3 software. The load profile used in this model did not define in the journal. The
characteristics of system components are modified to obtain the best results. The objective of this model of flat plate
collector is to validate the temperature comparisons of simulated and experimental temperatures.
The variation of inlet and outlet water flow temperature is measured hourly using a flat plate collector from 15
October 2017 – 15 April 2018 data. The linkage of each component is done with precise accuracy and the parameters for
the diverter, solar collector and the tee piece is kept the same as given in the journal. The only difference in the validation
input is the load profile and the undefined input and parameters and the weather data which might cause some variation in
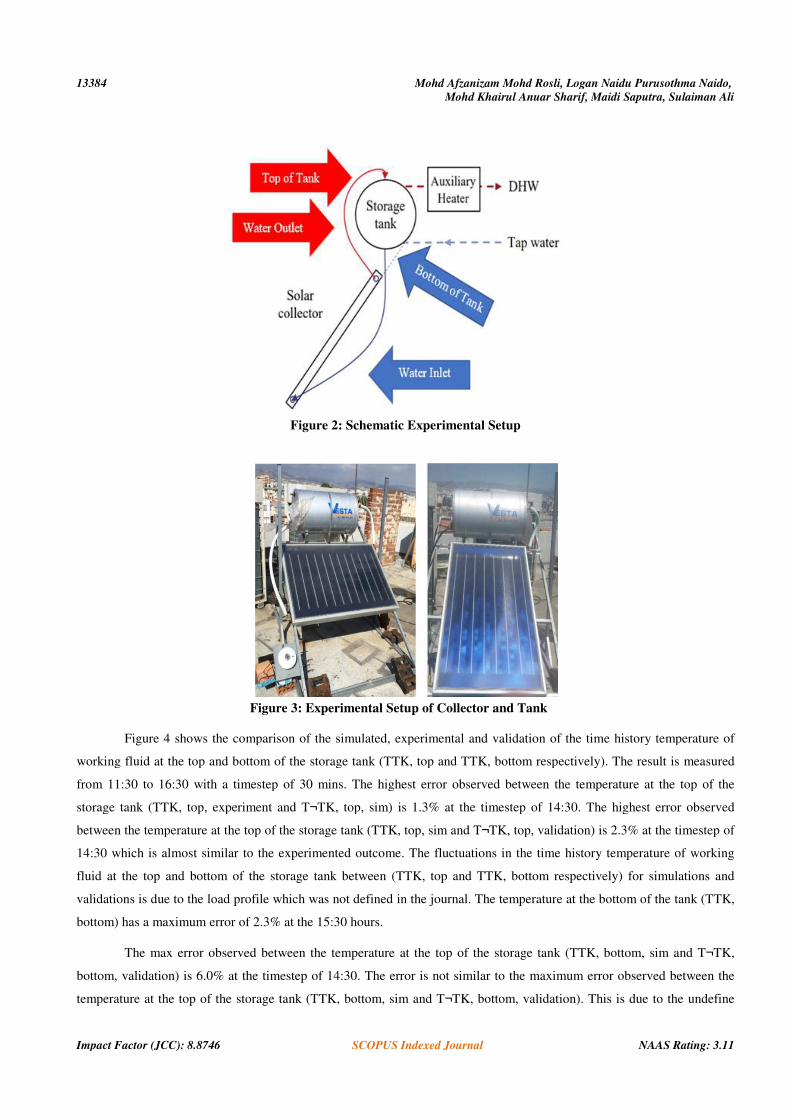
the output. The inlet of the water flow is known as the bottom of the storage tank and outlet is known as the top of the
storage tank as in Figure 2 and Figure 3.
Figure 1: Validated Temperature Input and Temperature Output of
Collector of Karaikudi
13384
Impact Factor (JCC): 8.8746
Figure
Figure 4 shows the comparison of the simulated, experimental and validation of the time history temperature of
working fluid at the top and bottom of the storage tank (TTK, top and TTK, bottom respectively
from 11:30 to 16:30 with a timestep of 30 mins. The highest error observed between the temperature at the top of the
storage tank (TTK, top, experiment and T¬TK, top, sim) is 1.3% at the timestep of 14:30. The highest error observ
between the temperature at the top of the storage tank (TTK, top, sim and T¬TK, top, validation) is 2.3% at the timestep of
14:30 which is almost similar to the experimented outcome. The fluctuations in the time history temperature of working
fluid at the top and bottom of the storage tank between (TTK, top and TTK, bottom respectively) for simulations and
validations is due to the load profile which was not defined in the journal. The temperature at the bottom of the tank (TTK,
bottom) has a maximum error of 2.3% at the 15:30 hours.
The max error observed between the temperature at the top of the storage tank (TTK, bottom, sim and T¬TK,
bottom, validation) is 6.0% at the timestep of 14:30. The error is not similar to the maximum error observed between t
temperature at the top of the storage tank (TTK, bottom, sim and T¬TK, bottom, validation). This is due to the undefine
Mohd Afzanizam Mohd Rosli, Logan Naidu Purusothma Naido,
Mohd Khairul Anuar Sharif
Impact Factor (JCC): 8.8746 SCOPUS Indexed Journal
Figure 2: Schematic Experimental Setup
gure 3: Experimental Setup of Collector and Tank
shows the comparison of the simulated, experimental and validation of the time history temperature of
working fluid at the top and bottom of the storage tank (TTK, top and TTK, bottom respectively
from 11:30 to 16:30 with a timestep of 30 mins. The highest error observed between the temperature at the top of the
storage tank (TTK, top, experiment and T¬TK, top, sim) is 1.3% at the timestep of 14:30. The highest error observ
between the temperature at the top of the storage tank (TTK, top, sim and T¬TK, top, validation) is 2.3% at the timestep of
14:30 which is almost similar to the experimented outcome. The fluctuations in the time history temperature of working
he top and bottom of the storage tank between (TTK, top and TTK, bottom respectively) for simulations and
validations is due to the load profile which was not defined in the journal. The temperature at the bottom of the tank (TTK,
or of 2.3% at the 15:30 hours.
The max error observed between the temperature at the top of the storage tank (TTK, bottom, sim and T¬TK,
bottom, validation) is 6.0% at the timestep of 14:30. The error is not similar to the maximum error observed between t
temperature at the top of the storage tank (TTK, bottom, sim and T¬TK, bottom, validation). This is due to the undefine
Mohd Afzanizam Mohd Rosli, Logan Naidu Purusothma Naido,
Anuar Sharif, Maidi Saputra, Sulaiman Ali
NAAS Rating: 3.11
shows the comparison of the simulated, experimental and validation of the time history temperature of
working fluid at the top and bottom of the storage tank (TTK, top and TTK, bottom respectively). The result is measured
from 11:30 to 16:30 with a timestep of 30 mins. The highest error observed between the temperature at the top of the
storage tank (TTK, top, experiment and T¬TK, top, sim) is 1.3% at the timestep of 14:30. The highest error observed
between the temperature at the top of the storage tank (TTK, top, sim and T¬TK, top, validation) is 2.3% at the timestep of
14:30 which is almost similar to the experimented outcome. The fluctuations in the time history temperature of working
he top and bottom of the storage tank between (TTK, top and TTK, bottom respectively) for simulations and
validations is due to the load profile which was not defined in the journal. The temperature at the bottom of the tank (TTK,
The max error observed between the temperature at the top of the storage tank (TTK, bottom, sim and T¬TK,
bottom, validation) is 6.0% at the timestep of 14:30. The error is not similar to the maximum error observed between the
temperature at the top of the storage tank (TTK, bottom, sim and T¬TK, bottom, validation). This is due to the undefine

A Simulation Study of Domestic Hot Water for Flat Plate Solar Collector 13385
Using Transient System Simulation Software (TRNSYS)
www.tjprc.org SCOPUS Indexed Journal [email protected]
load profile in the modelling scheme of the solar system. The other factor that might contribute to the variation of the
temperature at the top of the storage tank (TTK, bottom, sim and T¬TK, bottom, validation) and the temperature at the top
of the storage tank (TTK, top, sim and T¬TK, top, validation) is the weather data date. The experiment and the simulation
were conducted on the 9th of May 2017 while the simulation for the validation was done by taking the average weather
data of May 2017. The variation of solar radiation and irradiation will cause a change in the simulation output.
Figure 4: Comparison of Temperature.
Figure 5 shows the time history of working fluid mass flow rate (ṁ). The result is measured from 11:30 to 16:30
with a timestep of 30 mins which is the same as the study. The maximum detected an error for the experimented and the
simulated outcome from the study is 2.6% at 14:30. The maximum error between the simulation and the validation came at
the latter stages of the simulation.
The max error came at 16:00 hour with 4% outcome. The validation graph ended a few minutes earlier than the
simulated graph. The time history SolAir temperature (Te’) has a comparison purpose concerning the measured
thermosiphon mass flow rate (ṁ) of the working fluid. The mass flow rate is always in phase with Te’. The experimented,
simulated and validated outcome of the flow rate is low due to the thermosiphon effect produces by the thermosiphon flat
plate collector which circulates the water that is not enhanced by the pump.

13386 Mohd Afzanizam Mohd Rosli, Logan Naidu Purusothma Naido,
Mohd Khairul Anuar Sharif, Maidi Saputra, Sulaiman Ali
Impact Factor (JCC): 8.8746 SCOPUS Indexed Journal NAAS Rating: 3.11
Figure 5: Comparison of Fluid Mass Flow Rate
This shows that the solar system with a thermosiphon flat plate collector without the pump will be less expensive
as there is not an electric device and supply required. This system is more reliable and will last longer than the solar system
with an added pump and forced circulation systems [6]. The experiment and the simulation were conducted on the 6th of
April 2017 while the simulation for the validation was done by taking the average weather data of April 2017. The
variation of solar radiation and irradiation will cause a change in the simulation output.
3. RESULTS AND DISCUSSIONS
3.1 Performance of Flat Plate Collector
The weather data of Melaka City which is generated using the Meteonorm software is inserted into the Online Plotter 1
which reads the data of the flat plate collector and the output data will be transferred to the simulation integration formula
which uses the Hottel-Whillier-Bliss (HWB) equation to calculate the efficiency of the solar collectors and the calculated
data will be segregated in the printer module which gives out the Total value for the entire simulation run hours.
The values that have been calculated in the printer module is the intensity of the solar collector module (I) and the
useful energy extracted by the collector (Qu). The weather data also sends the data to the printer module which will
calculate the intensity of solar collector module (I) and the useful energy extracted by the collector (Qu) with daily results
of the solar collector. The data reader mode has to read and measured environmental and the atmospheric conditions that
occurred during the experiment and send the appropriate readings to be computed by the Theoretical Solar Collector (Type
73).
For this research, the data model is kept at the default TRNSYS setting and the input file and the parameter file
was modified to keep the value logger to measure the file where the input and parameters needed to be converted to the
right units that are being used in Malaysia. The sky model for diffuse radiation is set at four based on the Meteonorm
software readings and the tracking model is set with one as the collector is set at a constant position and the sun moves in
one direction. The ground reflectance is set at a minimum rate as Melaka is a tropical country and the ground reflectance
will less compare to the highest ground reflectance which is 0.7 in the snow-filled country. The slope surface is set at 45

A Simulation Study of Domestic Hot Water
Using Transient System Simulation Software (
www.tjprc.org
degrees and the azimuth is set at 0 as the sun angle will be moving constantly throughout the day.
The system process in figure 6
and it will be transferred to the daily load which has the Hottel
water which will run according to the load profile water draw will move towards the flow dive
a diverter as it will first send the required amount of cold water into the stratified storage tank. Once the tank has taken
enough cold water, the excess cold water will be diverted to the demand tank or most probably to the
The differential controller act as a sensor where it detects the optimum number of solar heats at the collector and
once it detects it, the controller will let the cold
controller has a 100-degree Celsius high limit cut
temperature at the below of the stratified storage tank is at 100 degree Celsius.
The pump will make sure the cold water enters the solar collector in one direction. The heat energy absorbed by
the solar collector will be radiated to the cold water where it will turn to hot water. The hot water will then be stored at
stratified storage tank upper region which is the hot region. The stratified storage tank had two water region which cold and
hot, the one at the middle of it is known as the thermocline region where the upper layer and the lower layer meets. It is
known as a thin distinct layer where the te
The hot water is then transferred to the Tee Piece where the water will be used for household or cleaning
activities. The excess water will be moved to the demand tank where it will
theoretical flat plate solar collector is installed in a series line with a collector area of 5m
is used for this research as the domestic hot water is used. The flow rate was tes
angle modifier (IAM) function will always be kept at the default value of 0.1. The 2nd order was left at 0 as no second
solar collectors were used.
The IAM is set to track the concentrate on the solar collector.
which incident radiation hits the sloped collector surface from the weather file while the horizontal diffuse radiation is
f Domestic Hot Water for Flat Plate Solar Collector
Using Transient System Simulation Software (TRNSYS)
SCOPUS Indexed Journal
degrees and the azimuth is set at 0 as the sun angle will be moving constantly throughout the day.
6 runs starting from the load profile where the data of the water draw will be defined
and it will be transferred to the daily load which has the Hottel-Whillier-Bliss (HWB) equation inserted to it. The cold
water which will run according to the load profile water draw will move towards the flow dive
a diverter as it will first send the required amount of cold water into the stratified storage tank. Once the tank has taken
enough cold water, the excess cold water will be diverted to the demand tank or most probably to the
The differential controller act as a sensor where it detects the optimum number of solar heats at the collector and
once it detects it, the controller will let the cold-water flow out of the stratified storage tank to the pump. The differentia
degree Celsius high limit cut-out where it will be triggered to allow the water in if the water
temperature at the below of the stratified storage tank is at 100 degree Celsius.
Figure 6: Solar System Model
re the cold water enters the solar collector in one direction. The heat energy absorbed by
the solar collector will be radiated to the cold water where it will turn to hot water. The hot water will then be stored at
which is the hot region. The stratified storage tank had two water region which cold and
hot, the one at the middle of it is known as the thermocline region where the upper layer and the lower layer meets. It is
known as a thin distinct layer where the temperature changes much more with depth than in the layers above or below.
The hot water is then transferred to the Tee Piece where the water will be used for household or cleaning
activities. The excess water will be moved to the demand tank where it will be kept until the next cycle begins. The
theoretical flat plate solar collector is installed in a series line with a collector area of 5m2. The fluid specific heat of water
is used for this research as the domestic hot water is used. The flow rate was tested at 40 kg/hr.m
angle modifier (IAM) function will always be kept at the default value of 0.1. The 2nd order was left at 0 as no second
The IAM is set to track the concentrate on the solar collector. The incident solar radiation is known as the rate at
which incident radiation hits the sloped collector surface from the weather file while the horizontal diffuse radiation is
13387
degrees and the azimuth is set at 0 as the sun angle will be moving constantly throughout the day.
he data of the water draw will be defined
Bliss (HWB) equation inserted to it. The cold
water which will run according to the load profile water draw will move towards the flow diverter. The flow diverter act as
a diverter as it will first send the required amount of cold water into the stratified storage tank. Once the tank has taken
enough cold water, the excess cold water will be diverted to the demand tank or most probably to the pipe tank.
The differential controller act as a sensor where it detects the optimum number of solar heats at the collector and
water flow out of the stratified storage tank to the pump. The differential
out where it will be triggered to allow the water in if the water
re the cold water enters the solar collector in one direction. The heat energy absorbed by
the solar collector will be radiated to the cold water where it will turn to hot water. The hot water will then be stored at the
which is the hot region. The stratified storage tank had two water region which cold and
hot, the one at the middle of it is known as the thermocline region where the upper layer and the lower layer meets. It is
mperature changes much more with depth than in the layers above or below.
The hot water is then transferred to the Tee Piece where the water will be used for household or cleaning
be kept until the next cycle begins. The
The fluid specific heat of water
ted at 40 kg/hr.m2. The 1st order incident
angle modifier (IAM) function will always be kept at the default value of 0.1. The 2nd order was left at 0 as no second
The incident solar radiation is known as the rate at
which incident radiation hits the sloped collector surface from the weather file while the horizontal diffuse radiation is

13388
Impact Factor (JCC): 8.8746
known as the rate where the diffuse radiation hits a horizontal surface from the
is the rate at which the total solar radiation touches the horizontal surface from the weather file. All three of the value a
to zero as no strikes of radiation were detected from the weather file. A typic
the surface where the solar collector is located. The angle of incidence from the beam solar radiation and the normal vector
to the sloped collector surface is set at 45 degrees to get the maximum light contac
Figure 7 shows the simulation outcome of a solar collector which was produced by simulating the theoretical flat
plate solar collector with a pump system using TRNSYS 17 with the weather data produce from Meteonorm software. The
location used is from Melaka City January 2020 weather data for 17 hours’ time difference. TiColl and ToColl are known
as temperature input and temperature output respectively.
In the first 17 hours, the TiColl and ToColl started in a constant state with the ambient temperature
temperature of 20°C and 24°C which was generated by the simulation. The highest temperature output produces from the
simulation is 90°C while the lowest is 40°C. Both the temperature input and temperature output have constant temperature
degradation, this is due to the water draw load profile that has been set to 0 if it's not in use. Every 17 hours have a constant
temperature output from the collector where it nearly touches 88°C.
In a closer look based on Figure 8, it can be noticed that the ma
the optimum temperature for domestic usage suitable for cleaning and bathing. The temperature difference between the
temperature input and temperature output is at the lowest difference of 6 °C and the high
temperature. It can be noted here that the highest performance level in this entire process is in every hour. The performance
level is determined by measuring the temperature difference between temperature input and tem
two reason due to temperature difference being between 6°C to 20°C that is because of the cut off high limit which has
been set to the 100°C where any form of the temperature reaching to its boiling point is injuries to the users
usage, so this is done for the safety precautions.
Figure
Besides that, the demand tank which stores the heated excess temperature will supply the input water, as a result of that the
temperature will always be in a moderate temperature. The demand tank is also the reason why the water temperature is not
reaching 0°C. The performance for a domestic hot water system using a flat plate collector can be told that the system
Mohd Afzanizam Mohd Rosli, Logan Naidu Purusothma Naido,
Mohd Khairul Anuar Sharif
Impact Factor (JCC): 8.8746 SCOPUS Indexed Journal
known as the rate where the diffuse radiation hits a horizontal surface from the weather file. The total horizontal radiation
is the rate at which the total solar radiation touches the horizontal surface from the weather file. All three of the value a
to zero as no strikes of radiation were detected from the weather file. A typical value of 0.2 was set for the reflectance of
the surface where the solar collector is located. The angle of incidence from the beam solar radiation and the normal vector
to the sloped collector surface is set at 45 degrees to get the maximum light contact.
shows the simulation outcome of a solar collector which was produced by simulating the theoretical flat
plate solar collector with a pump system using TRNSYS 17 with the weather data produce from Meteonorm software. The
laka City January 2020 weather data for 17 hours’ time difference. TiColl and ToColl are known
as temperature input and temperature output respectively.
In the first 17 hours, the TiColl and ToColl started in a constant state with the ambient temperature
temperature of 20°C and 24°C which was generated by the simulation. The highest temperature output produces from the
simulation is 90°C while the lowest is 40°C. Both the temperature input and temperature output have constant temperature
ion, this is due to the water draw load profile that has been set to 0 if it's not in use. Every 17 hours have a constant
temperature output from the collector where it nearly touches 88°C.
In a closer look based on Figure 8, it can be noticed that the major output is in the mix of 30°C to 66°C which is
the optimum temperature for domestic usage suitable for cleaning and bathing. The temperature difference between the
temperature input and temperature output is at the lowest difference of 6 °C and the highest is at 20°C higher than the input
temperature. It can be noted here that the highest performance level in this entire process is in every hour. The performance
level is determined by measuring the temperature difference between temperature input and tem
two reason due to temperature difference being between 6°C to 20°C that is because of the cut off high limit which has
been set to the 100°C where any form of the temperature reaching to its boiling point is injuries to the users
usage, so this is done for the safety precautions.
7: Simulation Outcome of Melaka Weather Data
Besides that, the demand tank which stores the heated excess temperature will supply the input water, as a result of that the
ture will always be in a moderate temperature. The demand tank is also the reason why the water temperature is not
reaching 0°C. The performance for a domestic hot water system using a flat plate collector can be told that the system
Mohd Afzanizam Mohd Rosli, Logan Naidu Purusothma Naido,
Anuar Sharif, Maidi Saputra, Sulaiman Ali
NAAS Rating: 3.11
weather file. The total horizontal radiation
is the rate at which the total solar radiation touches the horizontal surface from the weather file. All three of the value at set
al value of 0.2 was set for the reflectance of
the surface where the solar collector is located. The angle of incidence from the beam solar radiation and the normal vector
shows the simulation outcome of a solar collector which was produced by simulating the theoretical flat
plate solar collector with a pump system using TRNSYS 17 with the weather data produce from Meteonorm software. The
laka City January 2020 weather data for 17 hours’ time difference. TiColl and ToColl are known
In the first 17 hours, the TiColl and ToColl started in a constant state with the ambient temperature of Melaka
temperature of 20°C and 24°C which was generated by the simulation. The highest temperature output produces from the
simulation is 90°C while the lowest is 40°C. Both the temperature input and temperature output have constant temperature
ion, this is due to the water draw load profile that has been set to 0 if it's not in use. Every 17 hours have a constant
jor output is in the mix of 30°C to 66°C which is
the optimum temperature for domestic usage suitable for cleaning and bathing. The temperature difference between the
est is at 20°C higher than the input
temperature. It can be noted here that the highest performance level in this entire process is in every hour. The performance
level is determined by measuring the temperature difference between temperature input and temperature output. There is
two reason due to temperature difference being between 6°C to 20°C that is because of the cut off high limit which has
been set to the 100°C where any form of the temperature reaching to its boiling point is injuries to the users of domestic a
Besides that, the demand tank which stores the heated excess temperature will supply the input water, as a result of that the
ture will always be in a moderate temperature. The demand tank is also the reason why the water temperature is not
reaching 0°C. The performance for a domestic hot water system using a flat plate collector can be told that the system

A Simulation Study of Domestic Hot Water
Using Transient System Simulation Software (
www.tjprc.org
produces an optimum temperature output. The results show that the component parameters and input produce an optimum
performance for domestic uses only. Due to the limitations set in the differential controller.
Figure 8: The Temperature Difference between t
3.2 Suitable Number of Solar Collectors u
To find a suitable number of solar collectors, the normal efficiency of flat plate solar collector must be around 70% [
Table 1 shows the annual fraction load supplied by
is measured and the total product between the heating load of hot water (L) and the monthly solar fraction (f) with (x)
being the collector losses variables and (y) the incident sol
Melaka city 2016.
Figure 9: The
Table 1:
Month
January
February
March
April
May
June
f Domestic Hot Water for Flat Plate Solar Collector
Using Transient System Simulation Software (TRNSYS)
SCOPUS Indexed Journal
mperature output. The results show that the component parameters and input produce an optimum
performance for domestic uses only. Due to the limitations set in the differential controller.
Temperature Difference between the Simulation Out
Number of Solar Collectors using Melaka City Weather Data 2020
To find a suitable number of solar collectors, the normal efficiency of flat plate solar collector must be around 70% [
shows the annual fraction load supplied by the collector size of 2.5m2. The total of a heating load of hot water (L)
is measured and the total product between the heating load of hot water (L) and the monthly solar fraction (f) with (x)
being the collector losses variables and (y) the incident solar variables. According to the annual fraction load data of
9: The Temperature of Domestic Hot Water Produce
1: Annual Fraction Load Supplied By Collector Size
Month L(GJ) X Y f fL
January 0.8131 2.1 1.17 0.76 0.62
bruary 0.7673 2.3 1.32 0.84 0.64
0.7961 2.32 1.61 0.97 0.77
0.7615 2.33 1.37 0.86 0.65
0.7914 2.33 1.27 0.81 0.64
0.7796 2.31 1.18 0.76 0.59
13389
mperature output. The results show that the component parameters and input produce an optimum
he Simulation Outcome
To find a suitable number of solar collectors, the normal efficiency of flat plate solar collector must be around 70% [7].
The total of a heating load of hot water (L)
is measured and the total product between the heating load of hot water (L) and the monthly solar fraction (f) with (x)
ar variables. According to the annual fraction load data of
f Domestic Hot Water Produce

13390 Mohd Afzanizam Mohd Rosli, Logan Naidu Purusothma Naido,
Mohd Khairul Anuar Sharif, Maidi Saputra, Sulaiman Ali
Impact Factor (JCC): 8.8746 SCOPUS Indexed Journal NAAS Rating: 3.11
July 0.8093 2.31 1.18 0.76 0.62
August 0.8043 2.31 1.24 0.88 0.71
September 0.7828 2.31 1.3 0.83 0.65
October 0.8135 2.3 1.09 0.72 0.59
November 0.8021 2.3 0.93 0.62 0.5
December 0.8299 2.29 0.92 0.62 0.51
Total 9.5509 7.49
The whole annual heating load of domestic hot water in Melaka is 9.55 GJ and the annual fraction of load
supplied by a collector size based on the solar collector is 78.42%. This tells that the solar energy supply to the users is
78.42% which is higher than the optimum efficiency of the solar collector. Malaysia obtains 17 MJ/m2 of solar radiation
per day [8]. From this calculation, it can be noted that the suitable number of collectors for the installation in Melaka city is
only one with an area of 2.5m2 for domestic usage. This outcome produces efficiency above 70% which is the best
performance. The domestic hot water produces using this area of 2.5m gives a more optimum temperature output as shown
in figure 9. The simulation produce will give the users with the right temperature for domestic usage and it will avoid all
the heat hazards produced by the solar collectors. It can be noted that the cut-off limit is still implemented in this
simulation to prevent the temperature reaching extreme conditions.
4. CONCLUSIONS
In a nutshell, temperature inlet and the temperature outlet (TiColl and ToColl) plays a significant role to obtain the
performance of the flat plate collector. Based on the validation results, it proves that when the temperature inlet and the
temperature outlet of a solar system increase, it will proportionally increase the performance of the flat plate solar collector
and at the same time, it also increases the efficiency of the solar system. The best way to find out the performance of the
flat plate collector is to figure out the temperature differences of the TiColl and ToColl. This proves that the high-
temperature difference provides the best performance for a flat plate solar collector in a solar system [9].
For the second objective which is to determine the suitable number of collectors for domestic hot water in Melaka
using Hottell-Whillier-Bliss equation in TRNSYS. The load profile used is based on the weather data produced by the
Meteonorm software of Melaka city in the year 2020.
A single flat plate collector with an area of 2.5m2 is enough for installation in Melaka city. This is due to the
efficiency of the flat plate solar collector which exceeds the 70% mark [10]. The domestic hot water produces using 2.5m2
gives a more optimum temperature output which affects the efficiency. The increase in mass flow rate will also increase
the thermal efficiency of a system, the efficiency also gradually rises with solar intensity during the day[11].
4.1 RECOMMENDATIONS
It is recommended that for future study the research will focus on other types of flat plate collectors that are available at the
market and also in the TRNSYS software of the future. It is recommended that the future study should primely focus on
other types of existing simulating software such as RET screen, gambit, MATLAB and many more to get the precision and
accuracy in solar collector performance. The actual test is recommended to be carried out with the right equipment,
technical and financial supports at the actual location for more in-depth data and results in projection.

A Simulation Study of Domestic Hot Water for Flat Plate Solar Collector 13391
Using Transient System Simulation Software (TRNSYS)
www.tjprc.org SCOPUS Indexed Journal [email protected]
ACKNOWLEDGEMENT
The authors would like to thank the Applied Solar Energy Laboratory, Thermodynamics Laboratory,
FakultiKejuruteraanMekanikal, UniversitiTeknikal Malaysia Melaka and MYSOLAR CONCEPT SDN BHD for the
contribution and supports.
REFERENCES
1. M. R. Islam, S. Rahman, N. A. Rahim, and K. H. Solangi, “TY - JOUR AU - Abd Aziz, PuspariniDewi AU - Wahid, S.S.A. AU - Arief, Yanuar
AU - Aziz, N. PY - 2016/09/15 SP - 35 EP - 43 T1 - Evaluation of Solar Energy Potential in Malaysia VL - 9 DO - 10.3923/tb.2016.35.43 JO -
Trends in Bioinformatics ER -,” Renew. Energy Res. Malaysia, vol. 4, no. 2, 1970.
2. TEJA, M. S. K., RAO, K. N., & POCHONT, N. R. DESIGN, DEVELOPMENT AND EXPERIMENTAL EVALUATION OF SOLAR DRYER.
3. N. Abd. Aziz, P. D. and Wahid, S. S. A. and Arief, YanuarZulardiansyah and Ab. Aziz, “Evaluation of solar energy potential in Malaysia,”
Eval. Sol. energy potential Malaysia. Trends Bioinformatics, no. ISSN 1994-7941, pp. 35–43, 2016.
4. Mansour, T. A., Sawalha, S. A. L. A. M. E. H., & Salem, N. E. S. R. E. E. N. (2013). A Mathematical Model for Solar Assisted Automobile A/C
Based on Absorption Refrigeration System. International Journal of Mechanical Engineering (IJME), 2(4), 75-86.
5. Z. Mekhilef, Saad&Barimani, Meghdad& Safari, Azadeh& Salam, “Malaysia’s renewable energy policies and programs with green aspects,”
Renew. Sustain. Energy Rev., vol. 10.1016/j., pp. 497–504., 2014.
6. N. M. Kumar, K. Sudhakar, and M. Samykano, “Estimation of solar collector area for water heating in buildings of Malaysia,” IOP Conf. Ser.
Mater. Sci. Eng., vol. 342, no. 1, 2018.
7. K. S. Deepak Bishoyi, “Resource-Efficient Technologies,” Model. Perform. Simul. 100 MW LFR based Sol. Therm. power plant Udaipur
India, vol. DOI:10.101, 2017.
8. SAHU, A. K., SUDHAKAR, K., & SARVIYA, R. EFFECT OF SEAWATER ON PROPERTIES OF HDPE MATERIAL USED FOR FLOATING
SOLAR APPLICATIONS.
9. S. A. Kalogirou, R. Agathokleous, G. Barone, A. Buonomano, C. Forzano, and A. Palombo, “Development and validation of a new TRNSYS
Type for thermosiphon flat-plate solar thermal collectors: energy and economic optimization for hot water production in different climates,”
Renew. Energy, vol. 136, pp. 632–644, 2019.
10. M. A. M. Rosli, D. S. M. Zaki, F. A. Rahman, S. Sepeai, N. A. Hamid, and M. Z. Nawam, “F-chart method for design domestic hot water
heating system in Ayer Keroh Melaka,” J. Adv. Res. Fluid Mech. Therm. Sci., vol. 56, no. 1, pp. 59–67, 2019.
11. S. Mekhilef, A. Safari, W. E. S. Mustaffa, R. Saidur, R. Omar, and M. A. A. Younis, “Solar energy in Malaysia: Current state and prospects,”
Renew. Sustain. Energy Rev., vol. 16, no. 1, pp. 386–396, 2012.
12. A. P., “Simulation of Solar Intensity in Performance of Flat Plate Collector,” Int. J. Res. Eng. Technol., vol. 03, no. 06, pp. 36–41, 2014.
13. SALIM, R. D. THE USE OF HALF CIRCULAR UNIT (DISH 1) TO HEAT WATER BY SOLAR ENERGY.
14. S. S. Taib et al., “TiO2 based dye-sensitized solar cell prepared by Spray Pyrolysis Deposition (SPD) technique,” Int. J. Integr. Eng., vol. 10,
no. 1, pp. 109–113, 2018.
15. S. C. R. M. K. P. & R. Pankaj Kumar, “EXPERIMENTAL ANALYSIS OF RENEWABLE ENERGY AS SOLAR AIR HEATER \t\nWITH
ARTIFICIAL ROUGHNESS\t\n,” Int. J. Mech. Prod. \t Eng. Res. Dev. (IJMPERD\t, vol. 4, no. 1, pp. 125–134, 2014.


www.tjprc.org SCOPUS Indexed Journal [email protected]