ijaprr vol1-2-6-1-14geraethopia
TRANSCRIPT

IJAPRR Page 1
International Journal of Allied Practice, Research and Review Website: www.ijaprr.com (ISSN 2350-1294)
IMPLEMENTATION OF STATISTICAL
QUALITY CONTROL FOR SPINNING
PROCESSES OF DIRE DAWA TEXTILE
FACTORY
1 R K Gera, 2 Hewan Taye, 3 Andargachew Bekele 1 Department of Industrial Engineering, Institute of Technology, Dire Dawa University, P.O.BOX100,635, Ethiopia
2 Department of Industrial Engineering Mekelle University, Ethiopia 3Department of Industrial Engineering, Institute of Technology, Dire Dawa University, P.O.BOX100,635, Ethiopia
1 [email protected] 2 [email protected] 3 [email protected]
Abstract: Statistical process control is a powerful collection of problem solving tools useful in achieving process
stability and improving capability through the reduction of variability.SPC can be applied to any process. The major
objective of SPC is to quickly detect the occurrence of assignable causes of process shifts so that investigation of the
process and corrective action may be taken before many non conforming units are manufactured. The eventual goal
of SPC is the elimination of variability in the process. It may not be possible to completely eliminate variability, but
the control chart is an effective tool in reducing variability as much as possible. The main objective of this paper is to
implement SPC schemes, study of control charts and comparison performance of various control charts for bottle
manufacturing data. In the manufacturing environment, quality improves reliability, increases productivity and
customer satisfaction. Quality in manufacturing requires the practice of quality control. This research work
investigates the level of quality control in Lifespan pharmaceutical limited, makers of Lifespan Table Water. The
study involves inspection of some randomly selected finished products on daily bases.
Keywords: Statistical Process Control; Control Charts; Mean; Upper Control Limit (UCL); Center Line (CL) and Lower
Control Limit (LCL)
I. INTRODUCTION
The world economy has undergone rapid changes during the past two decades with the advent
of global competition to an extent that almost every company (large or small) is touched by it in some
ways. Creativity and innovation are necessary to bring forth the change required to obtain competitive
advantage. Quality is the most effective factor a company or organization can use in the battle for
customer/clients. To be competitive, the customers must be satisfied and to satisfy the customers, we
must focus on quality. Quality control provides the philosophy and driving force for designing quality
in order to delight the customers by focusing on best value of a company’s products and services. The
basic goal of quality control is to ensure that the products, services or processes provided meet
specific requirements and are dependable, satisfactory, and affordable and physically sound
(Hotelling, 1947).
A control chart is a statistical tool used to distinguish between variations in a process resulting
from common causes and variation resulting from special causes. Every process has variation. Some
variation may be the result of causes which are not normally present in the process. This could be
IJAPRR Page 2
special cause variation. Some variation is simply the result of numerous, ever-present differences in
the process. Control Charts differentiate between these two types of variation. It consists of three
horizontal lines called; Upper Control Limit (UCL), Center Line (CL) and Lower Control Limit
(LCL). The center line in a control chart denotes the average value of the quality characteristic under
study. If a point lies within UCL and LCL, then the process is deemed to be under control. Otherwise,
a point plotted outside the control limits can be regarded as evidence representing that the process is
out of control and, hence preventive or corrective actions are necessary in order to find and eliminate
the assignable cause or causes.
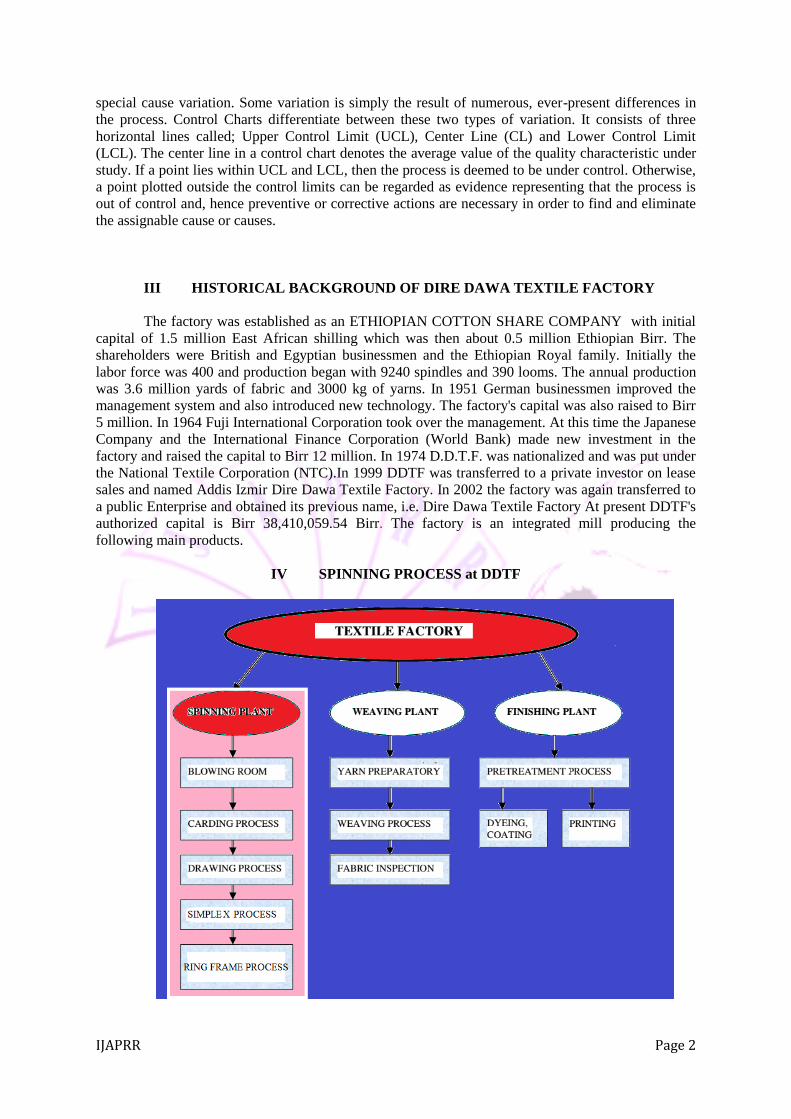
III HISTORICAL BACKGROUND OF DIRE DAWA TEXTILE FACTORY
The factory was established as an ETHIOPIAN COTTON SHARE COMPANY with initial
capital of 1.5 million East African shilling which was then about 0.5 million Ethiopian Birr. The
shareholders were British and Egyptian businessmen and the Ethiopian Royal family. Initially the
labor force was 400 and production began with 9240 spindles and 390 looms. The annual production
was 3.6 million yards of fabric and 3000 kg of yarns. In 1951 German businessmen improved the
management system and also introduced new technology. The factory's capital was also raised to Birr
5 million. In 1964 Fuji International Corporation took over the management. At this time the Japanese
Company and the International Finance Corporation (World Bank) made new investment in the
factory and raised the capital to Birr 12 million. In 1974 D.D.T.F. was nationalized and was put under
the National Textile Corporation (NTC).In 1999 DDTF was transferred to a private investor on lease
sales and named Addis Izmir Dire Dawa Textile Factory. In 2002 the factory was again transferred to
a public Enterprise and obtained its previous name, i.e. Dire Dawa Textile Factory At present DDTF's
authorized capital is Birr 38,410,059.54 Birr. The factory is an integrated mill producing the
following main products.
IV SPINNING PROCESS at DDTF
IJAPRR Page 3
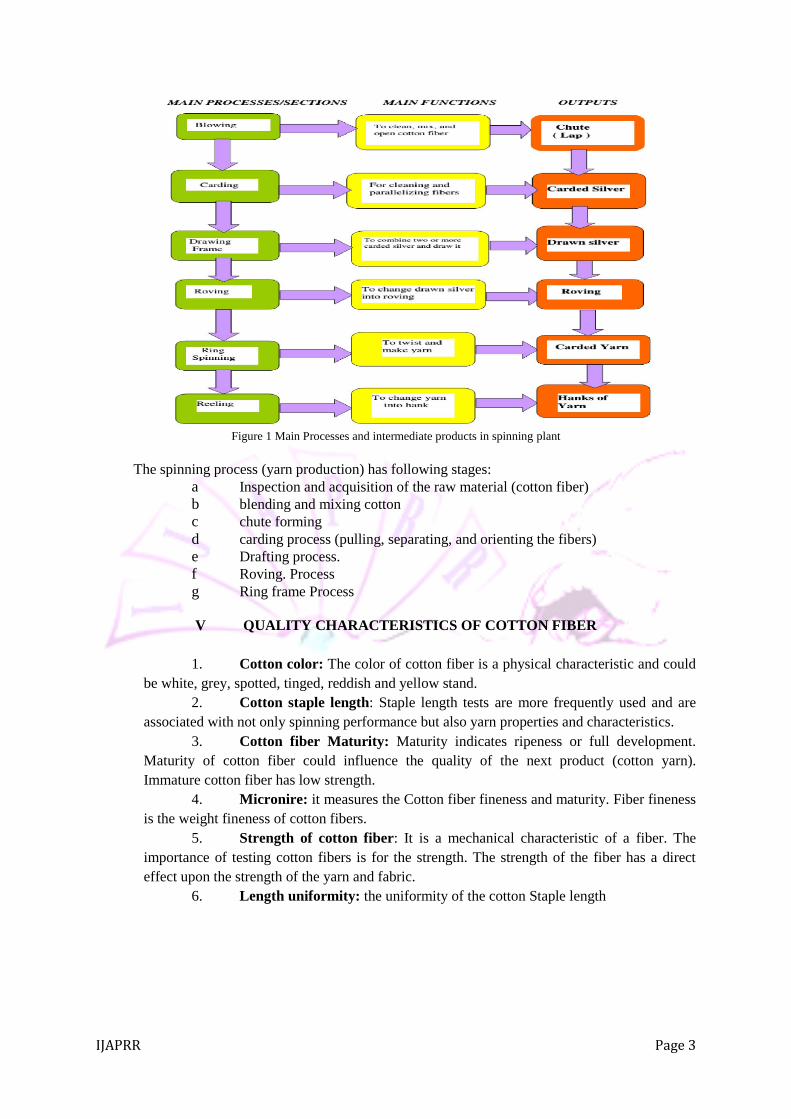
Figure 1 Main Processes and intermediate products in spinning plant
The spinning process (yarn production) has following stages:
a Inspection and acquisition of the raw material (cotton fiber)
b blending and mixing cotton
c chute forming
d carding process (pulling, separating, and orienting the fibers)
e Drafting process.
f Roving. Process
g Ring frame Process
V QUALITY CHARACTERISTICS OF COTTON FIBER
1. Cotton color: The color of cotton fiber is a physical characteristic and could
be white, grey, spotted, tinged, reddish and yellow stand.
2. Cotton staple length: Staple length tests are more frequently used and are
associated with not only spinning performance but also yarn properties and characteristics.
3. Cotton fiber Maturity: Maturity indicates ripeness or full development.
Maturity of cotton fiber could influence the quality of the next product (cotton yarn).
Immature cotton fiber has low strength.
4. Micronire: it measures the Cotton fiber fineness and maturity. Fiber fineness
is the weight fineness of cotton fibers.
5. Strength of cotton fiber: It is a mechanical characteristic of a fiber. The
importance of testing cotton fibers is for the strength. The strength of the fiber has a direct
effect upon the strength of the yarn and fabric.
6. Length uniformity: the uniformity of the cotton Staple length
IJAPRR Page 4
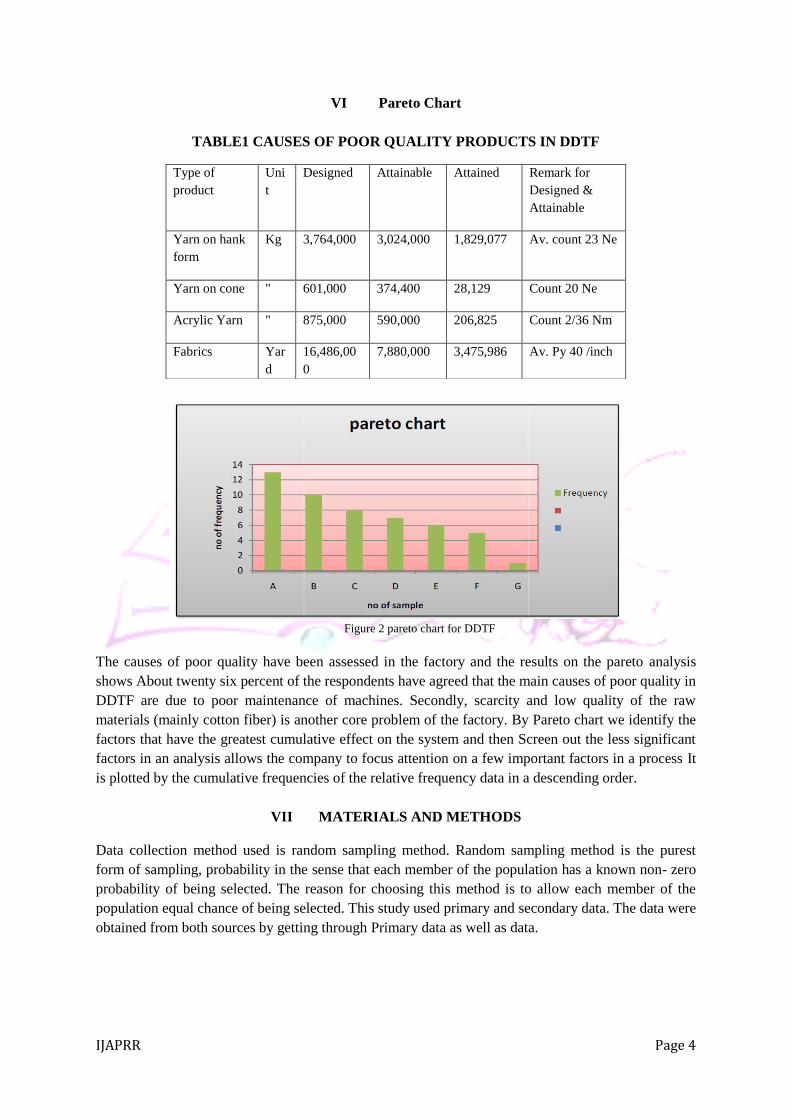
VI Pareto Chart
TABLE1 CAUSES OF POOR QUALITY PRODUCTS IN DDTF
Figure 2 pareto chart for DDTF
The causes of poor quality have been assessed in the factory and the results on the pareto analysis
shows About twenty six percent of the respondents have agreed that the main causes of poor quality in
DDTF are due to poor maintenance of machines. Secondly, scarcity and low quality of the raw
materials (mainly cotton fiber) is another core problem of the factory. By Pareto chart we identify the
factors that have the greatest cumulative effect on the system and then Screen out the less significant
factors in an analysis allows the company to focus attention on a few important factors in a process It
is plotted by the cumulative frequencies of the relative frequency data in a descending order.
VII MATERIALS AND METHODS
Data collection method used is random sampling method. Random sampling method is the purest
form of sampling, probability in the sense that each member of the population has a known non- zero
probability of being selected. The reason for choosing this method is to allow each member of the
population equal chance of being selected. This study used primary and secondary data. The data were
obtained from both sources by getting through Primary data as well as data.
Type of
product
Uni
t
Designed Attainable Attained Remark for
Designed &
Attainable
Yarn on hank
form
Kg 3,764,000 3,024,000 1,829,077 Av. count 23 Ne
Yarn on cone " 601,000 374,400 28,129 Count 20 Ne
Acrylic Yarn " 875,000 590,000 206,825 Count 2/36 Nm
Fabrics Yar
d
16,486,00
0
7,880,000 3,475,986 Av. Py 40 /inch
IJAPRR Page 5
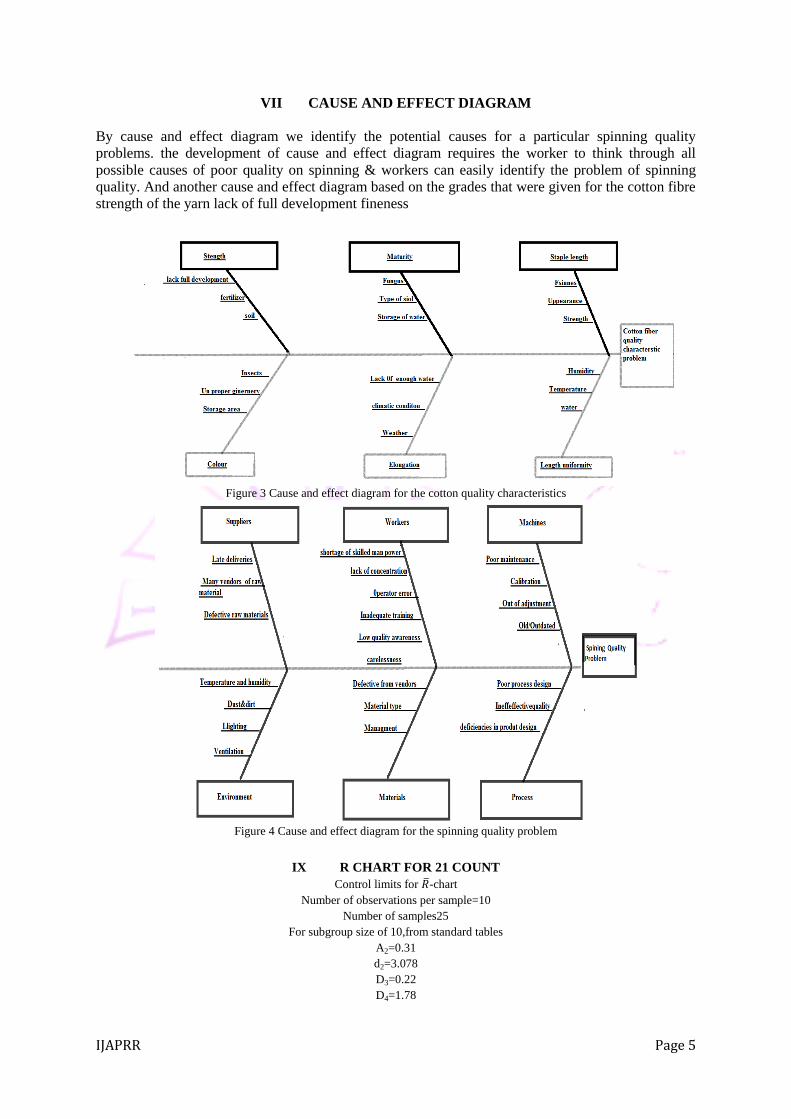
VII CAUSE AND EFFECT DIAGRAM
By cause and effect diagram we identify the potential causes for a particular spinning quality
problems. the development of cause and effect diagram requires the worker to think through all
possible causes of poor quality on spinning & workers can easily identify the problem of spinning
quality. And another cause and effect diagram based on the grades that were given for the cotton fibre
strength of the yarn lack of full development fineness
Figure 3 Cause and effect diagram for the cotton quality characteristics
Figure 4 Cause and effect diagram for the spinning quality problem
IX R CHART FOR 21 COUNT
Control limits for 𝑅 -chart
Number of observations per sample=10
Number of samples25
For subgroup size of 10,from standard tables
A2=0.31
d2=3.078
D3=0.22
D4=1.78

IJAPRR Page 6
Due to1052 fail out of control limits we will develop another control limits by discarding the one item
Figure 5 R- chart for 21 count
.
Again control limits for -chart
CL= =540.20
Table2 THE REVISED RANGE CHART
Range 1 Ucl cl lcl
657 961.556 540.2 118.844
347 961.556 540.2 118.844
861 961.556 540.2 118.844
428 961.556 540.2 118.844
397 961.556 540.2 118.844
555 961.556 540.2 118.844
682 961.556 540.2 118.844
587 961.556 540.2 118.844
762 961.556 540.2 118.844
665 961.556 540.2 118.844
702 961.556 540.2 118.844
479 961.556 540.2 118.844
625 961.556 540.2 118.844
422 961.556 540.2 118.844
588 961.556 540.2 118.844
280 961.556 540.2 118.844
547 961.556 540.2 118.844
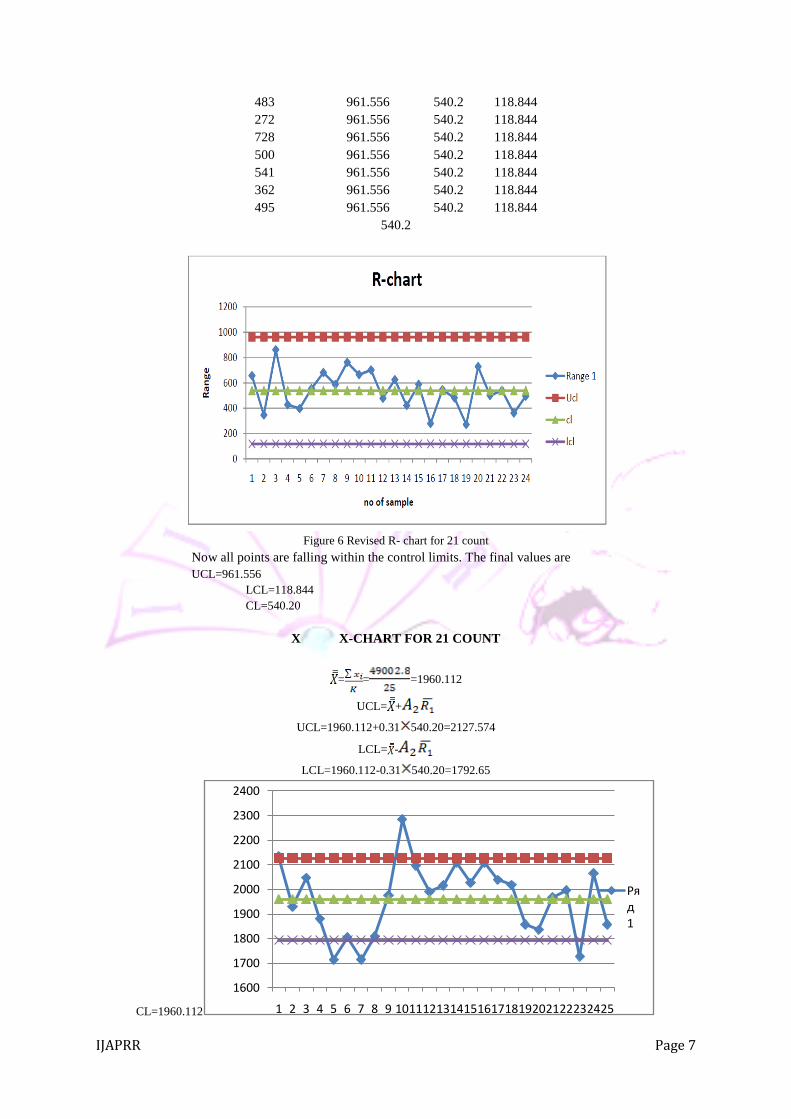
IJAPRR Page 7
483 961.556 540.2 118.844
272 961.556 540.2 118.844
728 961.556 540.2 118.844
500 961.556 540.2 118.844
541 961.556 540.2 118.844
362 961.556 540.2 118.844
495 961.556 540.2 118.844
540.2
Figure 6 Revised R- chart for 21 count
Now all points are falling within the control limits. The final values are
UCL=961.556
LCL=118.844
CL=540.20
X X-CHART FOR 21 COUNT
= = =1960.112
UCL= +
UCL=1960.112+0.31 540.20=2127.574
LCL= -
LCL=1960.112-0.31 540.20=1792.65
CL=1960.112
1600
1700
1800
1900
2000
2100
2200
2300
2400
1 2 3 4 5 6 7 8 9 10111213141516171819202122232425
Ряд1
IJAPRR Page 8
Figure 7 X- chart for 21 count
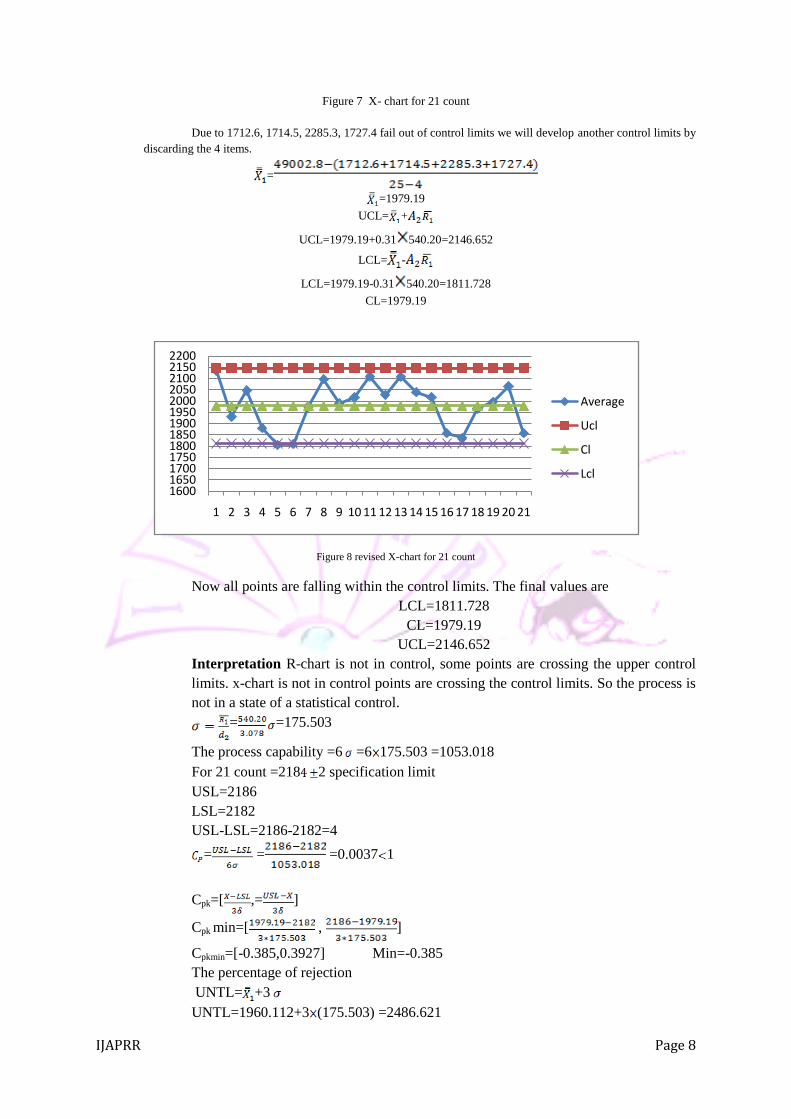
Due to 1712.6, 1714.5, 2285.3, 1727.4 fail out of control limits we will develop another control limits by
discarding the 4 items.
=
=1979.19
UCL= +
UCL=1979.19+0.31 540.20=2146.652
LCL= -
LCL=1979.19-0.31 540.20=1811.728
CL=1979.19
Figure 8 revised X-chart for 21 count
Now all points are falling within the control limits. The final values are
LCL=1811.728
CL=1979.19
UCL=2146.652
Interpretation R-chart is not in control, some points are crossing the upper control
limits. x-chart is not in control points are crossing the control limits. So the process is
not in a state of a statistical control.
= =175.503
The process capability =6 =6 175.503 =1053.018
For 21 count =218 2 specification limit
USL=2186
LSL=2182
USL-LSL=2186-2182=4
= = =0.0037 1
Cpk=[ ,= ]
Cpk min=[ , ]
Cpkmin=[-0.385,0.3927] Min=-0.385
The percentage of rejection
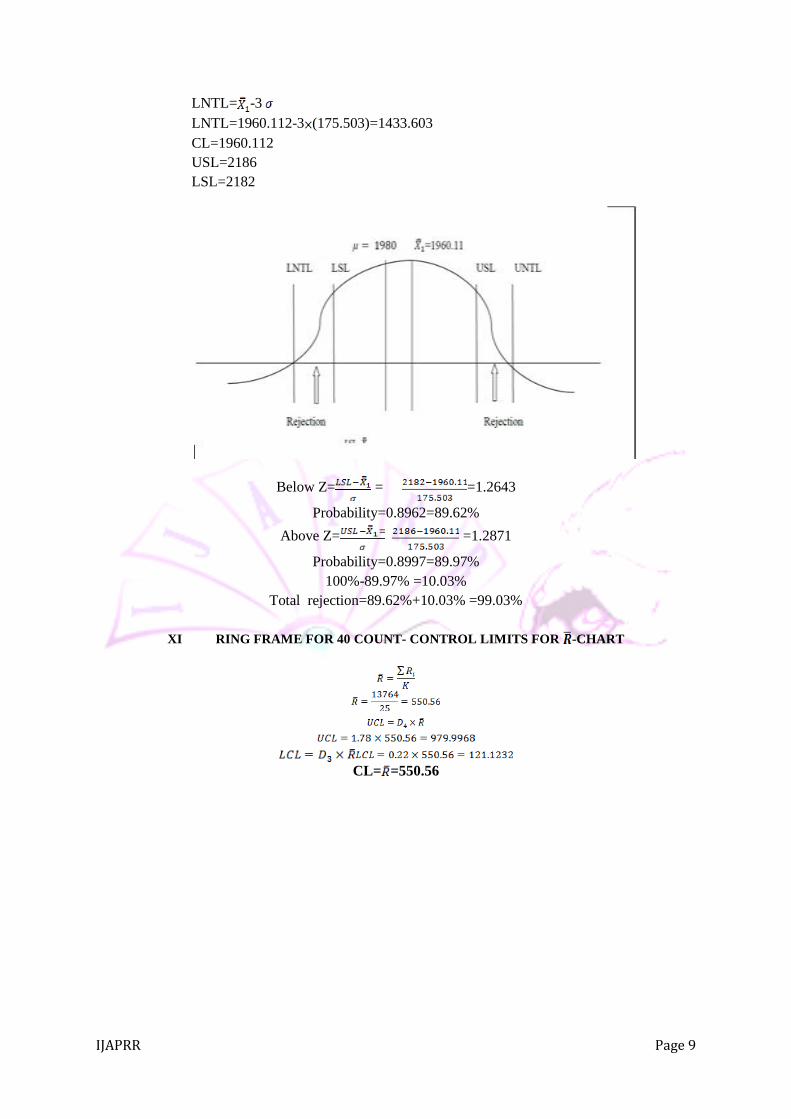
UNTL= +3
UNTL=1960.112+3 (175.503) =2486.621
1600165017001750180018501900195020002050210021502200
1 2 3 4 5 6 7 8 9 10 11 12 13 14 15 16 17 18 19 20 21
Average
Ucl
Cl
Lcl
IJAPRR Page 9
LNTL= -3
LNTL=1960.112-3 (175.503)=1433.603
CL=1960.112
USL=2186
LSL=2182
Below Z= = =1.2643
Probability=0.8962=89.62%
Above Z= =1.2871
Probability=0.8997=89.97%
100%-89.97% =10.03%
Total rejection=89.62%+10.03% =99.03%
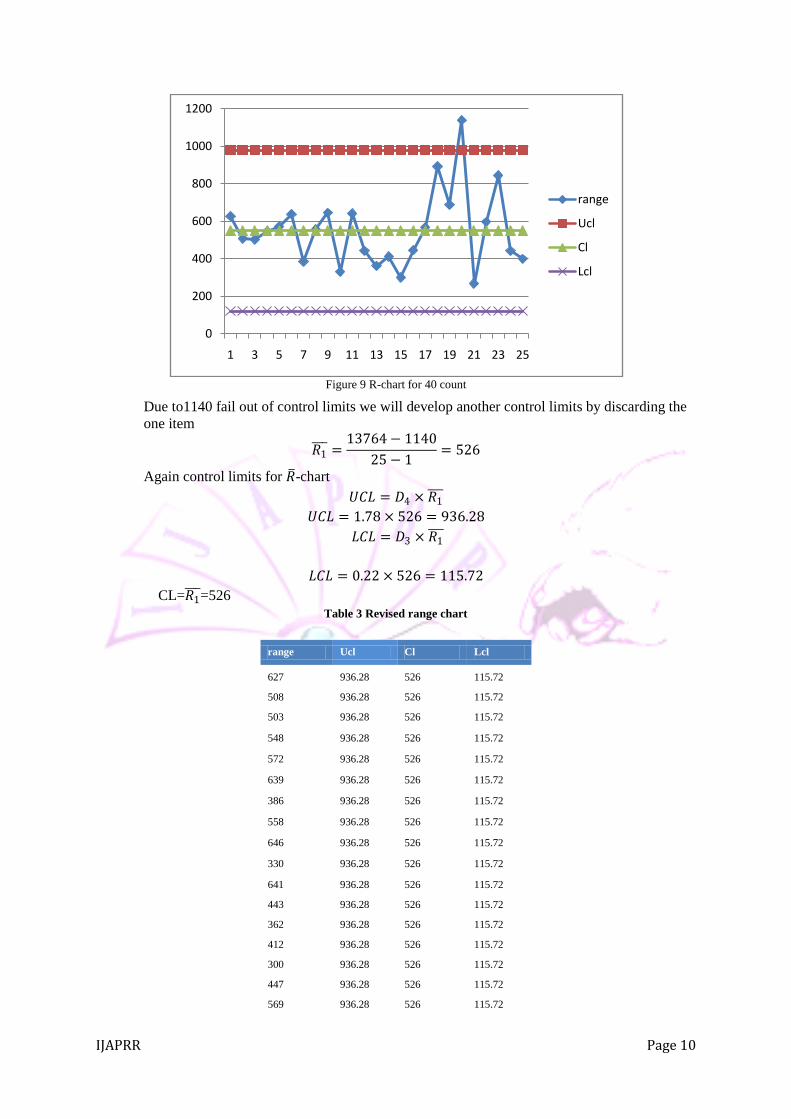
XI RING FRAME FOR 40 COUNT- CONTROL LIMITS FOR -CHART
CL= =550.56
IJAPRR Page 10
Figure 9 R-chart for 40 count
Due to1140 fail out of control limits we will develop another control limits by discarding the
one item
𝑅1 =
13764 − 1140
25 − 1= 526
Again control limits for 𝑅 -chart
𝑈𝐶𝐿 = 𝐷4 × 𝑅1
𝑈𝐶𝐿 = 1.78 × 526 = 936.28
𝐿𝐶𝐿 = 𝐷3 × 𝑅1
𝐿𝐶𝐿 = 0.22 × 526 = 115.72
CL=𝑅1 =526
Table 3 Revised range chart
range Ucl Cl Lcl
627 936.28 526 115.72
508 936.28 526 115.72
503 936.28 526 115.72
548 936.28 526 115.72
572 936.28 526 115.72
639 936.28 526 115.72
386 936.28 526 115.72
558 936.28 526 115.72
646 936.28 526 115.72
330 936.28 526 115.72
641 936.28 526 115.72
443 936.28 526 115.72
362 936.28 526 115.72
412 936.28 526 115.72
300 936.28 526 115.72
447 936.28 526 115.72
569 936.28 526 115.72
0
200
400
600
800
1000
1200
1 3 5 7 9 11 13 15 17 19 21 23 25
range
Ucl
Cl
Lcl

IJAPRR Page 11
893 936.28 526 115.72
688 936.28 526 115.72
268 936.28 526 115.72
597 936.28 526 115.72
845 936.28 526 115.72
442 936.28 526 115.72
400 936.28 526 115.72
Figure 10 Revised R-chart for 40 count
Now all points are falling within the control limits. The final values are
UCL=961.556
LCL=118.844
CL=540.20
XII X-chart for 40 count
𝑋 = 𝑥𝑖
𝐾 =
49002.8
25 =1929.04
UCL=𝑋 +𝐴2𝑅1
UCL=UCL=1929.04+0.31×526=2092.1
LCL=1929.04-0.31×526=1765.98
CL=1929.04
IJAPRR Page 12
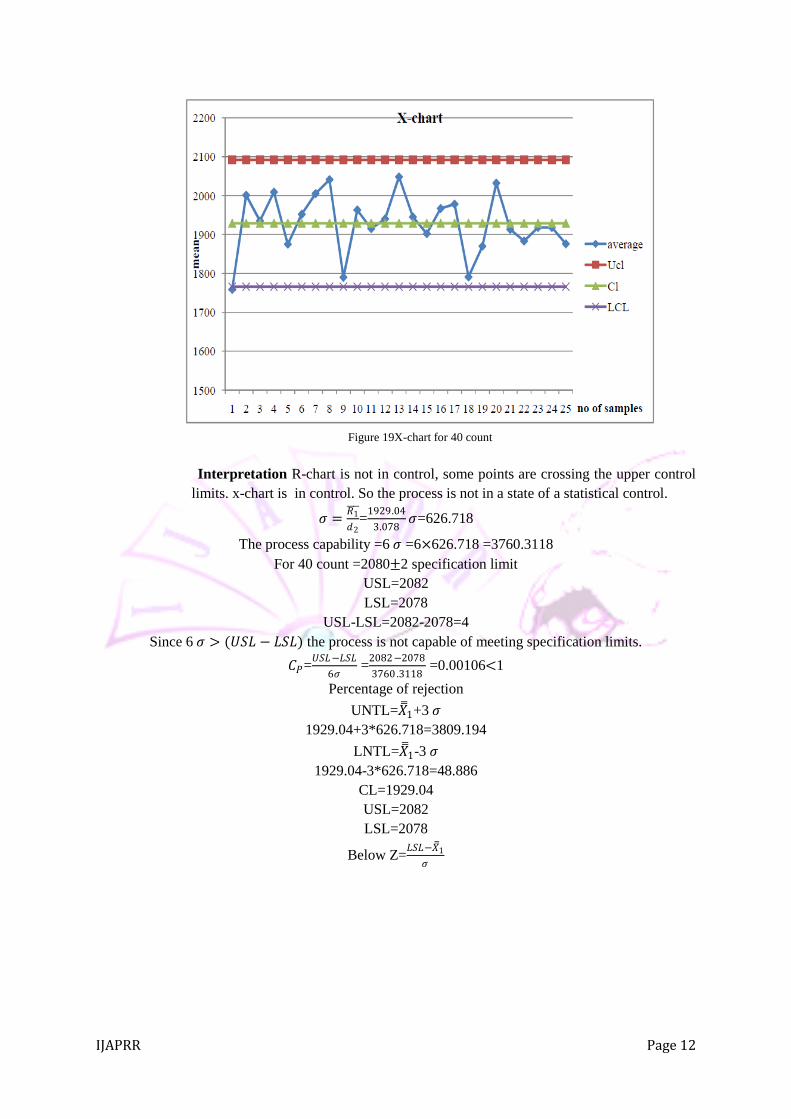
Figure 19X-chart for 40 count
Interpretation R-chart is not in control, some points are crossing the upper control
limits. x-chart is in control. So the process is not in a state of a statistical control.
𝜎 =𝑅1
𝑑2=
1929.04
3.078𝜎=626.718
The process capability =6 𝜎 =6×626.718 =3760.3118
For 40 count =2080±2 specification limit
USL=2082
LSL=2078
USL-LSL=2082-2078=4
Since 6 𝜎 > (𝑈𝑆𝐿 − 𝐿𝑆𝐿) the process is not capable of meeting specification limits.
𝐶𝑃=𝑈𝑆𝐿−𝐿𝑆𝐿
6𝜎 =
2082−2078
3760 .3118 =0.00106<1
Percentage of rejection
UNTL=𝑋 1+3 𝜎
1929.04+3*626.718=3809.194
LNTL=𝑋 1-3 𝜎
1929.04-3*626.718=48.886
CL=1929.04
USL=2082
LSL=2078
Below Z=𝐿𝑆𝐿−𝑋 1
𝜎
IJAPRR Page 13
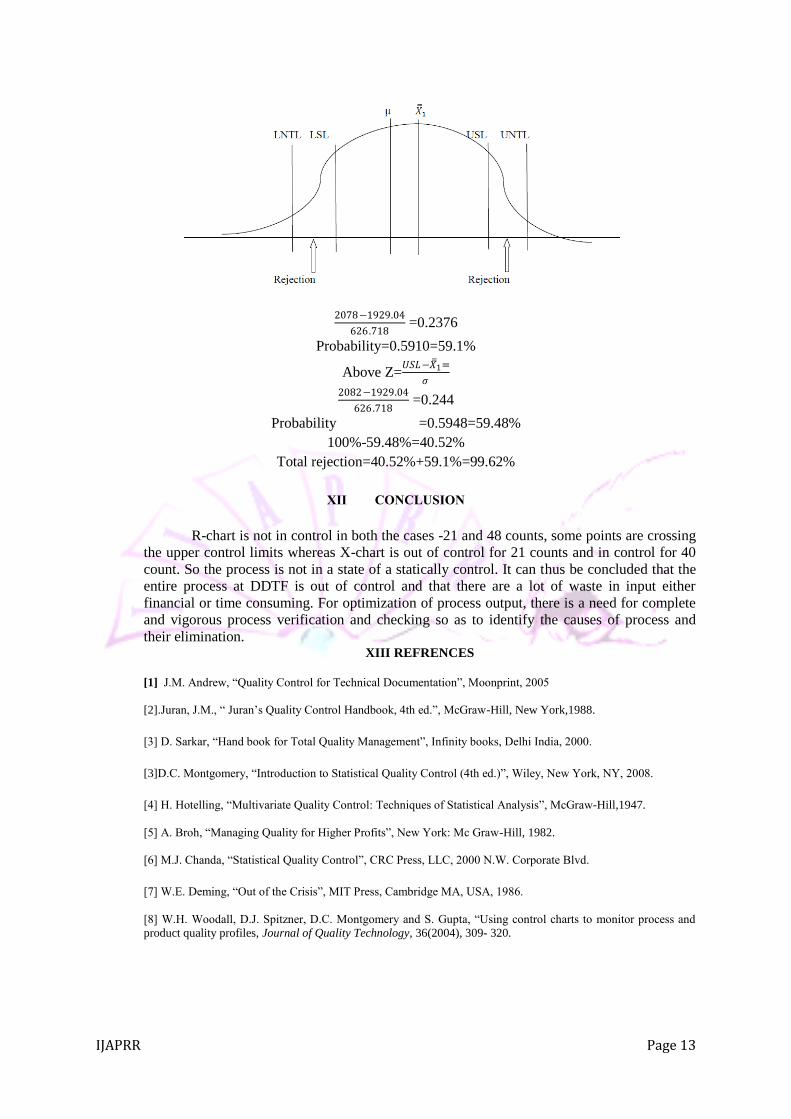
2078−1929.04
626.718 =0.2376
Probability=0.5910=59.1%
Above Z=𝑈𝑆𝐿−𝑋 1=
𝜎
2082−1929.04
626.718 =0.244
Probability =0.5948=59.48%
100%-59.48%=40.52%
Total rejection=40.52%+59.1%=99.62%
XII CONCLUSION
R-chart is not in control in both the cases -21 and 48 counts, some points are crossing
the upper control limits whereas X-chart is out of control for 21 counts and in control for 40
count. So the process is not in a state of a statically control. It can thus be concluded that the
entire process at DDTF is out of control and that there are a lot of waste in input either
financial or time consuming. For optimization of process output, there is a need for complete
and vigorous process verification and checking so as to identify the causes of process and
their elimination. XIII REFRENCES
[1] J.M. Andrew, “Quality Control for Technical Documentation”, Moonprint, 2005
[2].Juran, J.M., “ Juran’s Quality Control Handbook, 4th ed.”, McGraw-Hill, New York,1988.
[3] D. Sarkar, “Hand book for Total Quality Management”, Infinity books, Delhi India, 2000.
[3]D.C. Montgomery, “Introduction to Statistical Quality Control (4th ed.)”, Wiley, New York, NY, 2008.
[4] H. Hotelling, “Multivariate Quality Control: Techniques of Statistical Analysis”, McGraw-Hill,1947.
[5] A. Broh, “Managing Quality for Higher Profits”, New York: Mc Graw-Hill, 1982.
[6] M.J. Chanda, “Statistical Quality Control”, CRC Press, LLC, 2000 N.W. Corporate Blvd.
[7] W.E. Deming, “Out of the Crisis”, MIT Press, Cambridge MA, USA, 1986.
[8] W.H. Woodall, D.J. Spitzner, D.C. Montgomery and S. Gupta, “Using control charts to monitor process and
product quality profiles, Journal of Quality Technology, 36(2004), 309- 320.

IJAPRR Page 14
Prof Wg Cdr R.K.Gera
Born on 4th Nov 1944. He received the B.Sc. Engg.(Electrical) degree from RIT Jamshedpur (Now NIT Jamshedpur) in 1968 and M Tech in
1980 from IIT Kharagpur. He is ex-veteran of IAF and has been trained in France on Mirage-2000 as system analyst. After his premature
retirement from IAF he had a stint as consultant in telecommunication, Operations Mgr in chemical and Branch Mgr export industries before penetrating into teaching profession. He took up teaching assignments in Bahirdar University, ETHIOPIA and Ertrea Institute of
Tecgnology, Asmara in ERTREA (N-W Africa) and various engineering institutions in India since 2000. He has completed various projects
in IAF and Ethiopia, published papers in International journals and presently authoring a book. He has taken up PhD work at JJT University, Jhunjhnu (Raj). Presently engaged by Dire Dawa University, Ethiopia for grooming Industrial Engineers, after retiring as Professor St
Margret Engineering College, Neemrana Rajasthan. His areas of interest span from the technologies for renewable energy to latest trends in
in the field of Industrial Engineering and Operations Research.
Hiwan Taye
An upcoming Industrial Engineer from Department of Industrial Engineering, , Dire Dawa University, Ethiopia. Completed her B.E. (Industrial Engineering), 2006 (EC). She is an enthusiastic researcher and innovator. Presently engaged in teaching and research work
Mekelle University, Ethiopia and is.
Andargachew Bekele
He is an Industrial Engineer from Department of Industrial Engineering, Institute of Technology, Dire Dawa University, graduated in 2006 (EC). A research oriented professional and an independent consultant in the field of Industrial Engineering. He is pursuing his career as an
entrepreneur.