,iiiiiiiiiiiiiifllfll. - dtic
TRANSCRIPT

AD-AII 307 CASE WESTERN RESERVE UNIY CLEVELAND 0ON DEPT OF METAL--ETC F/6 11/6INDIVIDUAL AND COMBINED EFFECTS OF SULFUR AND PMOSPI4ORUS ON TME--ETC CU)MAY 82 E CHANG. J F WALLACE OAA46-79-C-0094
ICLASSIFIED AMMRC-TR-82-33 ".1 2llllllflllllllllllllllllEIIIIIIIIIIIIII~fl..fEEEEIIIIIEEIIEIIIIIIIEEIIII,IIIIIIIIIIIIIIfllfll.

11111 L. 12 .0
111111 .25 LA1 1 III
MICROCOPY RESOLUJTION TEST CHART

lJAD
W AMMRC TR 82-33rm4
r-4 INDIVIDUAL AND COMBINED EFFECTS OF SULFUR ANDd PHOSPHORUS ON THE TOUGHNESS OF HIGH STRENGTH STEELS
May 1982
EDWARD CHANG and JOHN F. WALLACECase Western Reserve UniversityDept. of Metallurgy and Materials Science10900 Euclid AvenueCleveland, Ohio 44106
FINAL REPORT Contract No. DAAG46-79-C-0094Approved for public release; distribution unlimited.
DTICEL-Cic>S JUN 2 8 sm8
Prepared for
- ARMY MATERIALS AND MECHANICS RESEARCH CENTERWatertown, Massachusetts 02172
82 06 28 049

UNCLASSIFIEDSECURITY CLASSIFICATION OF THIS PAGE (Whom Dat Entered)
REPORT DOCUMETTOREAD INSTRUCTIONSBEFORE COMPLElING FORM
'. REPORT NUMBER 2' GOVT ACCESSION NgO 3. RECIPIENT'S CATALOG NUMBER
AMMRC TR 82-33 I i
4. TITLE (and Subtitle) s' TYPE OF REPORT & PERIOD COVERED
INDIVIDUAL AND COMBINED EFFECTS OF SULFUR Final Report -
AND PHOSPHORUS ON THE TOUGHNESS OF November 1979-November '1981
HIGH STRENGTH STEELS S. PERFORMING ORG. REPORT NUMBER
7. AUTHOR(a) 6. CONTRACT OR GRANT NUMBER($)
DAAG46-79-C-0094Edward Chang and John F. Wallace
S. PERFOIRMING ORGANIZATION NAME AND ADDRESS 10. PROGRAM ELEMENT. PROJECT. TASKCase Western Reserve University AREA & WORK UNIT NUMBERS
Dept. of Metallurgy and Materials Science D/A Project: IL162105AH8410900 Euclid Avenue AMCMS Code: 612105.H840011Cleveland, Ohio 44106
IM. CONTROLLING OFFICE NAME AND ADDRESS 12. REPORT DATE
Army Materials and Mechanics Research Center May 1982ATTN: DRXMR-K 13. NUMBER OF PAGESWatertown, Massachusetts 02172 173
14. MONITORING AGENCY NAME & ADORESS(if diflfernt from Controffine Office) IS. SECURITY CLASS. (of this r~)
Unclassified
ISa. DECL ASSI FIC ATI ON/ DOWNGRADINGSCHEDULE
1b. DISTRIBUTION STATEMENT (of this Report)
Approved for public release; distribution unlimited.
17. DISTRIBUTION STATEMENT (of the abstract entered In Block 20. it different from Report)
IS. SUPPLEMENTARY NOTES
I$. KEY WORDS (Continue on reverse side it necessary and Identify by block uumber)
Low alloy steels Impurities ToughnessPhosphorus 4340 steel Embrittlement
Sulfur Mechanical properties Test temperatures
20. ABSTRACT (Continue on reverse aide It necessary and identify by block number)
(SEE REVERSE SIDE)
FOR
DD AN 73 1473 EDITION OF I NOV 63 IS OBSOLETE UNCLASSIFIED
SECURITY CLASSIFICATION OF THIS PAGE (Wn Date t.rre-,t)

1NCLASSIFIED
69CURIT, CLASIFICAYION OF THIS PAGIlU1* DaOe Em1eeldJ
Block No. 20
ABSTRACT* •
This investigation was unaertaken to determine the feasibility of speci-fying a maximum sum of phosphorus plus sulfur contents rather than a maximumfor each element as related to the effects that these elements exert on thetoughness of steel. ----Pist-.' computer analysis of the literature was con-ducted *L the-. t4Z$on the influence of phosphorus and sulfur in the toughnessof steel. Then, an experimental program was undertaken to produce a seriesof 4340 cast steels with a matrix of phosphorus and sulfur contents includinglow, medium and high values of each. These s$els were heat treated by oilquenching Vmartensite and tempering at 1100 f to a 150 ksi yield strengthand at 400 F to a 220 ksi yield strength. The steels were then tested todetermine the tensile properties, Charpy V-notch transition curves for regu-lar and precracked specimens and the static fracture toughness properties.
The behavior of phosphorus and sulfur on the toughness of these steels issufficiently different that it does not appear feasible to substitute the sumof the elements for maxima for each in specifications for steels requiringspecific toughness properties. Phosphorus raises the transition temperatureand embrittles the steel significantly, particularly at high strengths and inthe presence of sharp notches. Phosphorus is in supersaturated solid solutionin the steel and embrittles the steel because of the higher friction stressof the lattice for dislocation motion. Sulfur increases the number of sulfideinclusions and lowers the toughness by the decohesion of sulfide inclusionsduring the early stages of plastic deformation of the mtrix.The-low- energyrequired for decohesion reduces the total energy required for crack propaga-tion. Although both elements lower the toughness measurements, their effecton the toughness is sufficiently different so that similar toughness can onlybe expected under a few conditions.
The different influence of each element on the toughness results in anequal amount of both elements producing transition curves that cross over oneanother when plotted. The high phosphorus steels have higher fracture energyat higher temperatures and lower fracture energies at lower temperatures be-cause increasing phosphorus raises the transition temperature. Increasing sul-fur lowers the ductile shelf energy but has little influence on the transitiontemperatures for the medium strength steel and above room temperature for thehigh strength steel. The phosphorus plus sulfur contents only provide a pre-dictable influence in the toughness valves under conditions at which thesecross over temperatures occur. This temperature varies with notch acuity andcomposition.
Phosphorus increases the yield strength, the temperature dependence of theyield strength and the notch sensitivity of the steel. The fatigue crack growthrate is decreased to a small extent by higher phosphorus and sulfur contentsfor the medium strength steel. However, for the high strength steel, phosphorusgreatly increases the fatigue crack growth rate but sulfur has no effect onthis rate.
The computer analysis of data in the literature on the influence of phos-phorus and sulfur on the toughness showed the individual the collective effectsof these elements clearly. These results were confirmed by the experimentalwork.
UNCLASSIFIED
$ECUMI.V CLASSIFICATION OF THIS PACEfWh.e, Dot& El-od)

TABLE OF CONTENTS
Page
Table of Contents 1
Introduction 3
A. Effect of Phosphorus and Sulfur on Mechanical
Properties of Steels 3
B. The Toughness of Materials 5
B.1. Effect of a Notch 6B.2. Effect of Strain Rate 6
B.3. Load-Temperature Diagram Analysis 7B.4. Development of Fracture Toughness Concept 8
B.5. Dynamic Fracture Toughness 9
B.6. Fracture Toughness of Elastic-Plastic
Materials 9
C. Objectives of this Investigation 10
Computer Analysis 10
A. Introduction 10
B. Regression Analysis and Results 11
C. Discussion on Computer Analysis 13
D. Conclusions from the Computer Analysis 18
Materials and Procedures 18
A. Melting and Casting Practice 18
B. Sectioning, Machining and Heat Treatment 19
C. Hardness and Tensile Tests 20
D. Charpy Impact Tests--Conventional, Instrumentedand Instrumented Precracked 20 ion For -
E. Plane Strain Fracture Toughness Test 21 GA&IZAB0
F. Fatigue Crack Propagation Test 21 ncei
G Metallography and Fractography 21 rica- - -
i 5isy bu tion/ _-
AvailabiliY CodeS_
1 DiMt Spcial
La

TABLE OF CONTENTS
... Continued ...
Page
Results and Discussion
A. Chemical Composition of Materials 22
B. Microstructure 22
C. Effect of P and S on Hardness and TensileProperties 22
D. Effect of P and S on Charpy V-Notch ImpactProperties 23
D.l. Charpy Impact Transition Curves 23D.2. Fracture Energy Correlations and Transition
Temperature of 1100°F Tempered Steels 25D.3. Fracture Energy Correlations and Transition
Temperature of 4000F Tempered Steels 26
E. Effect of P and S on Plane Strain FractureToughness 27
F. Effect of P and S on Dynamic Fracture Toughness 27
G. Effect of P and S on Fatigue Crack Propagation 28
Mechanism of Embrittlement 29
A. Effect of P and S on Strain Rate and Notch Sensi-tivities of 4340 Medium and High Strength Steels 29A.l. Strain Rate Sensitivity as Affected by P and S 29
A.2. Notch Sensitivity as Affected by P and S 30
B. Effect of P and S on Dynamic Tensile Properties 31
B.1. Tensile Strength as Affected by P and S 31B.2. Plane Strain Ductility as Affected by P and S 32
C. Fractographs of Fractures 35
C.1. Mode of Fracture as Affected by P and S 35C.2. Mode of Fracture as Affected by Strength
Level 36
Conclusions 37
References 39
Tables 45
Figures 83
Appendices 164
Distribution List 171
2

INTRODUCTION
A. Effect of Phosphorus and Sulfur on Mechanical Properties of Steels
The deleterious effect of phosphorus and sulfur on the mechanicalproperties of steel was recognized in the early days of steelmaking. In1909, ASTM specified 0.04% max. P and 0.05% max. S for structural steel. (1)As early as 1919, there was so much concern about the behavior of phosphorusand sulfur in the steel that a special team called the "Joint Committee onInvestigation of the Effect of Phosphorus and Sulfur in Steel" was formedby the joint action of 11 organizations. (2) The program of this committeewas to investigate the individual effect of phosphorus and sulfur on plaincarbon wrought and cast steels. The concept of the combined effect of bothelements was not evaluated.
The effect of phosphorus on low carbon steel was thoroughly studied
by Hopkins and Tipler. (3) Enzian (4) also made a similar study, but heinvestigated the simultaneous variations in phosphorus and nitrogen on theproperties of low carbon steel. Phosphorus increases the tensilestrength, (3,4) yield strength (3,4) impact transition temperature (3) anddecreases the impact energy (4) of this material.
Sulfur, on the other hand, apparently does not increase the tensileor the yield strength of low to medium plain carbon steel. (5) Loweringthe sulfur content from 0.06% to 0.02% results in some improvement in theductility and toughness of low strength steel. (5)
The mechanisms of embrittlement of phosphorus and sulfur in steels isof considerable significance in determining their relative effects insteels. Phosphorus dissolves substitutionally in iron, and its solubilityin c-Fe has been determined: 10000 C, 2.14%; 800*C, 1.01%; 600*C, 0.56%;and 400*C, 0.28%. (6) By extrapolating to lower temperatures, it is noted,as shown in Figure 1, that the solubility of P in c-Fe is about 0.015% atroom temperature. (6,7) However, in the metastable state, Hopkins andTipler found no evidence of second phase precipitation for Fe-0.31% Palloy, (3) apparently because of the very slow kinetics of phosphorus ina-iron at lower temperatures. In the presence of carbon and silicon, aphosphorus content of more than 0.12% in gray iron results in phosphideparticles called steadite. (8) According to the Fe-S equilibrium phasediagram, sulfur is not soluble in ct-iron. It is generally agreed thatphosphorus strengthens the iron matrix by a solid solution strengtheningmechanism. (9) Phosphorus embrittles the steel by either increasing theyield strength of the material (3) or preferentially segregating to thegrain boundaries (10) and causing intergranular failures. (3,11,12) Sulfurforms nonmetallic inclusions with manganese (assuming the presence ofsufficient manganese) in the liquid and solid. (13,14)
At low carbon and low strength levels, phosphorus significantlystrengthens the iron matrix by solid solution hardening. The yield strengthis proportionally increased and ductility and toughness decreased with anincrease of phosphorus content (3,4) because of an increased friction stress
3

in shear (Ti) and corresponding decreased plastic zone size (R) as shown* subsequently in this paper. On the other hand, sulfur does not change
the strength of low strength steel since the sulfide interparticle spacingis considered too large to operate as an Orowan strengthening mechanism. (15)The reduction in ductility and toughness results from the notch effect inthe presence of sulfide particles. The notch effect promotes a stress con-centration and microcrack nucleation ahead of the main propagating crack. (16)The result is a higher microcrack advancing velocity, smaller plastic zonesize and decreased toughness with an increase of sulfur content.
At higher strength levels, the effect of phosphorus on the strength ofsteel is not well-documented. It is unclear whether embrittlement by matrixstrengthening, which occurs in the case of low carbon steel, or embrittlementby enhanced phosphorus segregation or co-segregation with metallic elementsto the grain boundaries, plays the major role in lowering the toughness ofthe steel.
As the strength of the steel increases, however, the sulfur is alsoobserved to be deleterious in 0.26% C, 1.5% Mn steel. An increase ofsulfur from 0.005% to 0.053% increases the yield point from 73.7 to 77.1 ksiand decreases RA and CVN at room temperature from 71.7% to 37.5% and109 ft-lb to 10 ft-lb respectively. (17) In this example, the yield pointincreases 4.4% only, while the RA and CVN decrease 47.7% and 90.8%, re-spectively. In another 1% Ni, Cr, Mo cast steel, low and high sulfur steelexhibit virtually no difference in tensile properties. (18)
These results indicate that sulfur does not strengthen the iron crystal,and sulfide inclusions contribute very little in strengthening the steel byacting as a second phase. The deleterious effect of sulfur results from thenotch effect or stress concentration effect produced by the sulfide in-clusions. Sulfur may also segregate to the grain boundaries and thus em-brittle the steel.
Typical reports of the effects of phosphorus and sulfur on the CharpyV-notch impact transition curve for alloyed steels are shown in Figures 2 (19)and 3 (18). Phosphorus and sulfur affect both the impact energy and impacttransition temperature. Figure 2 indicates that the primary effect of smallincreases in phosphorus is to shift the transition curve to the right.
The effects of sulfur on the notch toughness of low alloy high strength0.3 C, 2.5 Ni, 0.8 Cr, 0.45 Mo wrought steel were studied by Hodge et al. (20)No such systematic study of the sole effect of phosphorus on the notchtoughness of low alloy wrought steels was found. This work indicates that:
1) The decrease in maximum (upper ductile shelf) Charpy V-notch impactenergy value with sulfur content is more marked at lower sulfur than athigher levels as shown in Figure 4A. The Charpy V-notch impact energy in-creases sharply for sulfur contents below 0.04%. This is the basis forspecifying a maximum sulfur content of 0.04% in low alloy steels.
2) Neither the fracture transition temperature, as indicated by thetemperature at the midpoint of the steeply sloping portion of the curves
4

ip
shown in Figure 4B, nor the ductility transition temperature, such as thetemperature for an energy value of 15 ft-lb, is greatly affected by thesulfur content. This is an important point and will be discussed later.
The relative influence of phosphorus and sulfur in cast low alloysteel is also of interest. Zotos (21) studied the significance of re-duced phosphorus and sulfur content on cast AISI 4325 low alloy steels.However, in reality, the phosphorus contents were kept virtually constant.The results of the relative % RA, Charpy V-notch impact energy at -20'Fand % elongation correlate very well with the sulfur contents. For each0.010% change in sulfur contents, % RA, Charpy V-notch energy and elonga-tion change 9.75%, 7.82 ft-lb and 2.15%, respectively. The impact tran-sition curve was not reported in the publication.
The effects of high phosphorus and high sulfur contents on the duc-*l tility transition behavior of cast AISI 8630 steel were reported by
Breznyak and Wallace. (22) The influence of carbon, phosphorus and sulfuron the NDTT of normalized and tempered Cr-Mo steels was investigated byDutcher et al. (23) Sigala (24) studied the effects of different chemicalcomposition and heat treatment on the toughness of cast railroad componentsteel. The influence of chemical composition, including phosphorus andsulfur as variables on the toughness of high strength, low alloy caststeel is reported by Larson and Herlihy. (25) A similar experiment onmedium carbon cast steels processed under controlled atmospheres has beenpresented by Wright and Quarrell. (17)
Birkle et al (26) have analyzed the fracture toughness of wrought0.45 C, Ni, Cr, Mo steels with different sulfur contents. Kula andAnctil (27) suggest a correlation between fracture toughness and phosphorusplus sulfur for wrought SAE 4340 steel, as shown in Figure 5. Recently,Groves and Wallace (28) also found a similar correlation for cast AISI 4335steel as shown in Figure 6.
So far, much has been presented about the effect of phosphorus andsulfur on the toughness of steel. However, as will be discussed in detaillater, few of these investigations contain the proper type or amount ofdata to permit a statistical analysis of the relative influence of phos-phorus and sulfur on the toughness of steel. Mickelson (29) studied thesimultaneous variation of phosphorus and sulfur in various compositionrange on the toughness of AAR Grade B cast steel. A correlation betweentransition temperature and phosphorus + sulfur was proposed based on thiswork. (29)
B. The Toughness of Materials
Toughness is the capacity of a material to absorb energy by elastic orelastic-plastic deformation before fracture. The value of toughness de-pends on the composition, structure and processing of steel. The toughnessalso depends on the extrinsic variables or states to which it is subjected.Geometry (notch, size of specimen) and strain rate, among the extrinsicvariables, are considered significant in the toughness of a material.
5

B.1. Effect of a Notch
The presence of a notch in a material raises the tensile stress inthe region below the notch by the following ways: (16)
1) The notch raises the effective strain rate (Ceff) below thenotch. For strain rate sensitive material, the yield stress increases withincreasing strain rate and the yield stress of an unnotched specimen (Gy)will be increased to oy* below the notch.
2) The notch enhances strain hardening rate (do/dceff) by concen-trating plastic strain in the "tensile specimen" below the notch. Thisincreases Oy*.
3) The notch introduces a triaxial stress state below the notch.During local yielding at the notch of a nonstrain-hardening material, thetensile stress distribution (Oyy) ahead of the notch is modified and in-creased to ayy = oy + Oxx = Ko(p)Oy, where oxx is the tensile stress incrack advancing direction and Ka(p) is the plastic stress concentrationfactor.
B.2. Effect of Strain Rate
As a crack advances in a material, the dislocations move and join themoving crack and the crack-tip is relaxed plastically. This relaxationprocess depends on the number of mobile sources, multiplication process(Frank-Reed or cross slip) and the velocity of the gliding dislocations.As the strain rate increases, the velocity of the dislocations to join thecrack becomes relatively slower, and the plastic zone size or the toughnessof material is reduced accordingly.
For Frank-Reed source multiplication, assume that dislocationvelocity (V) is related to local shear stress (T L), friction stress inshear (Ti) and temperature (T) as:
V-Voexp tL (A)
where A is a constant and Vo is the velocity of dislocation as TL and Tapproach infinity. Following similar procedure as Tetelman and McEvily, (16)it can be shown that plastic zone size (R) can be expressed as:
G2bT Vc VcR - fn ( s), where Vo <1c 1 (2)
where G is the modulus of elasticity in shear, b is Burgers vector, Vc isthe advancing velocity of the microcrack and 8 is a constant.
6

I,
From Eq. (2) it is noted that the toughness of a material increases
with increasing temperature and with decreasing friction stress and strain
rate. In addition, the effect of strain rate on the toughness of a ma-
terial follows a logarithmic relation.
Increasing the loading rate also increases the friction stress or
yield stress for BCC metals.
The effect of notch severity and strain rate on the plastic zone size
(and hence toughness) and ductile-brittle transition behavior for low
strength material is shown in Figure 7. Higher strain rate as shown in
Figure 7A increases the yield strength from oy to Oy*. The tensile stressdistribution ahead of the notch reaches a maximum =max M xdisribtio aeadof henoth rachs maimu y = K p)ay* at
elastic-plastic interface. Smaller notch radius or severer notch increases
the stress level and therefore reduces the plastic zone size from R to R'.In Figure 7B, the brittleness transition temperature (TD) of an unnotchedspecimen, the temperature at which the maximum tensile stress beneath the
notch root reaches the cleavage fracture strength (of*) and induces fractureupon yielding, is raised to TD(N) for a notched specimen.
B.3. Load-Temperature Diagram Analysis
Figure 8 shows the typical variation of general yield load (PGy), localyield load (PLY), and fracture load (PF) with temperature, for a low
strength BCC Charpy specimen loaded in bending. (16,30) In region I,cleavage fracture occurs immediately upon local yielding when the first slipband forms near the notch root. In region II, fracture is caused by plasticconstraint induced cleavage fracture as imposed by triaxial stress state.Cleavage fracture occurs at the elastic-plastic interface, where the maximumtensile stress omax reaches the cleavage fracture strength (of*). Inregion III, fraclure results from plastic constraint and strain hardeninginduced cleavage fracture. In region IV, above the initiation transitiontemperature (Ts(N)), fracture is initiated by fibrous tearing.
B.4. Development of Fracture Toughness Concept
Engineering materials have been known to fracture at a stress well
below the theoretical strength by 10 to 100 times. To explain this dis-crepancy, Griffith, in 1921, postulated that flaws such as cracks, whichare inherently present in structures, result in a stress concentration thatinitiates fracture at low stress levels. (31) Consider an infinite platewith a crack held between fixed grips, the crack propagates when theelastic energy release rate is faster than the rate of created surface
energy of the system. Griffith then used a stress analysis that was de-veloped by Inglis (32) to show that fracture stress (OF) is related toYoung's Modulus (E), surface energy (ye), and crack length (2a) by theequation:
F E(2ye) (3)
II71a

Irwin (33) and later Orowan (34) suggested that the Griffith fracturecriterion for ideally elastic solid could be modified and applied tobrittle materials and metals by taking into account the plastic work (ye)
* in addition to elastic surface energy that is required for crack extension.Modern fracture mechanics was initiated by Irwin (35) who adopted the
- stress analysis by Westergaard (36) defined a term K = o vav' called stressintensity factor, where a is a parameter depending on specimen and crackgeometry. This stress intensity factor is more appropriate in describinga local stress field near a notch. The Irwin's analysis of fractureassumes that crack extension occurs when stress intensity factor reachesa critical value called fracture toughness (Kc), while the energy releaserate defined as G = K2/E (in plane stress) is equal to Gc, the criticalstrain-energy release rate. Thus,
~KC 2
Gc2 (4)
E
And
EGc KcOF = a 5
With the development of a testing method for fracture toughness, itwas recognized that the quantity of fracture toughness under condition ofplane strain (KIc), as illustrated in Figure 9A, was a material constantindependent of specimen size (37) and therefore a more valuable parameterof materials. To ensure that a plane strain condition is obtained, it hasbeen determined that the crack length of specimen (a) and thickness (B)should be greater than the quantity 2.5(KIc/oy) 2 . The details of the planestrain fracture toughness test method are specified in ASTM E399-78a.
Wells proposed that the crack-tip of a notched structure undergoes adisplacement called crack-opening displacement (COD) when this structureis subjected to a tensile load. (38) It has been experimentally determinedby Robinson and Tetelman (39) that COD is related to strain energy releaserate (G) and yield strength (Oy) through the relationship for many ma-terials:
G- AcyCOD, A= 1 (6)
COD= K2-l-V2) (in plane strain) (7)Eoy
where v is Poisson's ratio.
Prior to the development of the plane strain fracture toughness (Klc)concept, other test methods such as Charpy impact test or dynamic tear testhave been widely used for notch-toughness measurement. However, few ornone of these test results can be used directly in fail-safe design
8
against fracture. Successful use of the data depends on extensive fieldexperiences. The plane strain fracture toughness approach provides aquantitative relationship between maximum allowable stress for a givencrack size or vice versa. This information can be directly applied tostructural design.
B.5. Dynamic Fracture Toughness
It has been noted in Section B.2. that a high strain rate can reducethe toughness of a material. For some uses it may be more desirable tomeasure the "dynamic" plane strain fracture toughness (KId) at a muchhigher strain rate than those specified in "static" plane strain fracturetoughness tests. Unfortunately the requirements of both test proceduresare stringent and costly, especially for lower strength materials, (40,41)and therefore usually excluded for quality control or surveillancepurposes.
In an attempt to circumvent this problem, an instrumented Charpy testhas become available. (42) This test permits both the load time (ordeflection) and consequently energy time information of the unprecracked orprecracked Charpy specimen to be measured during the normal impact event.The instrumented fatigue-precracked Charpy test resembles the dynamicplane strain fracture toughness test in many ways except that specimen sizeis frequently too small for lower strength materials. An experiment com-paring KIc, KId, and KId obtained from instrumented precracked Charpy im-pact test for ASTM A533B steel (c y = 70 ksi) is illustrated in Figure 9B. (43)
B.6. Fracture Toughness of Elastic-Plastic Materials
In recent years, interest in linear elastic fracture mechanics (LEFM)has been extended to elastic-plastic fracture mechanics aiming at estab-lishing the fracture criteria for elastic-plastic materials. Of thetechniques suggested, Crack-Opening Displacement (COD), R-Curve Analysis,and J Integral are promising methods.
As suggested in Eq. 6, COD fracture criterion is equivalent to the LEFMcriteria when LEFM applies. In contrast to LEFM, however, COD measurementcan be made when considerable plastic flow occurs ahead of a crack forelastic-plastic materials. The British Standards Institution has estab-lished methods for COD testing. (44)
An R-Curve analysis is a plot of crack growth resistance (KR) in amaterial under specific conditions of temperature, strain rate and platethickness as a function of crack extension (Aa). Experimental method forR-Curve measurement is addressed in ASTM publications. (45-47)
The J-Integral, as proposed by Rice, is a method of characterizing thecomplicated elastic-plastic stress-strain field by taking an integrationpath far away from the crack tip. (48) Begley and Landes have used multiplespecimens to calculate J and applied it as a fracture criterion. (49,50)The accuracy of estimating J by many techniques employing a single specimenwas evaluated. (51,52) In addition, an experimental procedure to measurethe critical J value (Jjc) has been proposed. (53) J was related to COD
9

in a similar way to Eq. 6 as (54)
J = XOyCOD, X 0.48 - 2.98 (8)
In addition to the above techniques, an equivalent-energy concept de-veloped by Witt enables the determination of Kic with small specimen by anempirical method. (55,56)
C. Objectives of this Investigation
The reduction in toughness of steels that occurs at higher sulfur andphosphorus levels has been well established, as indicated in the literature.Because of the loss in toughness, various specifications require maximumsulfur and phosphorus levels for steels. The presence of this requirementfor both elements results in higher manufacturing costs because of thedifferent melting conditions needed to remove phosphorus and sulfur fromthe steels. This investigation is primarily directed towards determiningwhether it is feasible to specify a total sulfur plus phosphorus contentfor the steels rather than maxima for the individual elements. This deter-mination is to be made by using toughness as the criterion. The behaviorof phosphorus and sulfur on the tensile properties of the steels will bestudied to a minor extent and only when appropriate.
The project consists of two phases. First, a computer analysis ofthe available data from the literature employing a multiple regressiontechnique is conducted to determine the individual and collective effect ofphosphorus and sulfur on the toughness of steels. Then experimental workthat determines this relationship will be conducted and compared to theresults of the computer analysis.
II. COMPUTER ANALYSIS
A. Introduction
Although the reduction in toughness of steel that occurs at higherphosphorus and sulfur levels has been well known for a long time, mostinvestigators consider only either element as a variable in their investi-gation. Therefore, the weight of individual contribution and combinedeffects of these two elements on the dynamic behavior of steel are lesscertain. Systematic studies with statistical significance on the effectsof phosphorus and sulfur on the toughness of steel are rarely documented.
In an attempt to analyze the separate and collective effects of phos-phorus and sulfur on the toughness of steel, a computer analysis based onthe published literature using a multiple regression method (57,58) wasundertaken. The significant question that it is desired to address Is
10

whether the available literature on the influence of sulfur and phosphoruson the steel can be employed to predict, with sufficient accuracy, theeffect of simultaneous variation in each on the toughness of steel. Thisinformation is desired to determine whether it is feasible to specify amaximum value for the sum of sulfur and phosphorus rather than individualmaxima for each element as far as their effects on the toughness of steelis concerned.
B. Regression Analysis and Results
Since the toughness of steel depends on several variables, it isnecessary to simplify the problem and to include only those significantvariables in a multiple regression analysis. It would have been desirableto include as many variables as possible in regression equation; however,this is impractical since insufficient test results or samples are reportedin the various papers. As will be seen later, even with only three vari-ables, some unreasonable results were obtained.
The toughness (TF) of steel depends on its structure and the presenceof defects such as non-metallic inclusion and porosity. The structure isrelated in a complicated manner to many variables such as compositionaland impure elements (E), processing-solidification, welding and thermal-mechanical treatment (PR) for a specific geometry of specimen (D) testedat certain strain rate (U), and environment and temperature (ET). Thisrelationship is mathematically described as follows:
TF = f (E, PR, D, t, ET. ..... ) (9)
This relationship is complicated and should be simplified to find the cor-relation between toughness and phosphorus and sulfur desired in this work.To do this, only one type of steel will be considered at each time. Thisenables a consideration of variations in only one element such as carbon (C)instead of all compositional elements. Furthermore, consideration is re-stricted to only tempering temperature (T) in the thermal-mechanical treat-ment, and phosphorus and sulfur in the category of impurities. If all otherfactors are kept constant, Eq. (9) can be simplified to the form:
=TFi f(Ci, Ti, Pi' Si)+ + E
or (i0
TF= f(C, T, P, S)
where i's are for specific values and Ei is unobservable random error. (59)
Including the variables of carbon and tempering temperature in Eq. (10)complicates the problem. However, in certain experiments in the publishedliterature, carbon contents and tempering temperature are kept virtuallyinvariant. For others, these variables can be normalized to some standard
r11

values. In both cases. Eq. (10) may be rewritten as:
TF= f(P, S) (11)
Obviously, the investigations with this characteristic are relatively few.
More importantly, however, even when these data are available in the liter-ature, multiple regression analysis will not automatically provide ameaningful result if the sampling of phosphorus and sulfur are not repre-sentative.
In general, TF can be expressed explicitly in terms of P and S as:
TF - Bo + BIP + C1P2 + + B2S + C2S
2 +
+ D.P.S + D2P.S2 + D3P
2,S + ..... (12)
where B's, C's, and D's are constants. The coupling terms such as P.S,p.S2, and P2.S will not be employed since it is believed that phosphorusand sulfur embrittle the steel independently as a result of differentmechanisms.
TF B,+ BIP + C -P2 +- + B2 S + C2 S2 + (12)
Very often toughness can be adequately expressed as linear or exponentialfunctions such as shown in Eq. (14) and Eq. (15), respectively:
TF BD + BIP + B2 S (14)
TF Boe - (B1P + BzS) (15)
In the present study, the regression analyses were performed with theaid of a 1108 Univac digital computer. The standard multiple regressionsubprogram was provided by Chi Corporation and was available in the softwareitems. (60) A typical program is indicated in Appendix A.
Seven regression analyses were made to determine the effect of phos-phorus and sulfur on the toughness of cast and wrought, plain carbon andlow alloy steels. The criteria used for toughness determination wereCharpy V-notch or Izod impact energy (CVN, Izod), plane strain fracturetoughness (KIc), nil ductility transition temperature (NDTT) and 15 ft-lbCharpy V-notch transition temperature. In each analysis, the regressionanalysis was undertaken to determine the separate or individual effect ofphosphorus and sulfur on the toughness. The regression analysis was thenperformed to find the correlation between toughness and phosphorus andsulfur, with phosphorus and sulfur in the regression equation simultaneously.Lastly, phosphorus plus sulfur was employed as a single variable to deter-mine whether it would fit better with the regression analysis.
12

In each regression analysis, correlation coefficient (R) and standard
error of estimation (SEE) are automatically computed and furnished by the
computer in addition to the regression coefficients (B's). In some cases,
the experimental data were normalized to the same carbon content or temper-
ing temperature before it was placed into the computer regression analysis
program.
Tables 1, 2, and 3 show the results of the correlation between impact
energy and phosphorus and sulfur from the works of Larson and Herlihy, (25)
Wright and Quarrell, (17) and Zotos, (21) respectively. Table 4 shows the
effect of phosphorus and sulfur on the fracture toughness of wrought 4340
steel based on Kula and Anctil's research. (27) The correlation between
. Charpy V-notch impact energy and fracture toughness of AISI 4335 cast
steel and phosphorus and sulfur as reported by Groves and Wallace (28) is
listed in Table 5. The deleterious effect of ihosphorus and sulfur as ob-
tained from Dutcher et al on the nil ductility transition temperature (23)
and from Mickelson on Charpy V-notch transition temperature (29) is shown
in Table 6 and Table 7, respectively. In Table 2 and Table 5, curvilinear
equations are used to fit the data better, otherwise linear equations are
used.
C. Discussion on Computer Analysis
As mentioned previously, insufficient test data can cause unreasonable
results in regression analysis. Examples of this behavior are shown in
* Eqs. (16) and (17) from Tables 4 and 5 respectively.
vi1 c (4000 F) - 53.41 + 193.4P- 1348.0S
Klc (700 0 F)= 77.23+ 1292.OP- 2362.OS
CM= 17 .55e- (36 .0 9 P - 5.056 S) (17)
The first two cases indicate that phosphorus is beneficial to fracture
toughness while the third indicates that sulfur is beneficial to Charpy
V-notch impact energy; this, of course, is inaccurate as shown by many
studies. (20,21,26-28)
One factor that requires consideration is whether the particular re-
gression analysis conducted is significant or meaningful. The reliabilityof a regression analysis depends on unobservable random error, such as
experimental error, and the number of samples. In this analysis, the
errors from biased samples rather than random samples seems responsible for
most of the unreasonable results. An example of this behavior is the cor-
relation between CVN and phosphorus and sulfur simultaneously, as shown in
Table 5 and graphically represented in Figure 1OA. LMN is a surfacerepresenting the variation of CVN in accordance with phosphorus and sulfur.
OH is a line equidistant from OP and OS, which represents the chemicalcomposition when P = S. The phosphorus and sulfur contents of alloys are
shown as dots on POS plane. The range of variation of CVN corresponding
13

to these alloys is depicted as the strip MX on the LXN surface. It isevident that the deviation of chemical composition away from OH is arti-fically small, which corresponds to the narrow strip MX. Essentially,the regression analysis is asked to predict a full surface LMN on thebasis of narrow surface MX. The closer the values of P and S are to OH,the more difficult it becomes for the regression analysis to determine towhat extent phosphorus or sulfur actually contribute to the variation ofCVN. The error in this example is large and produces the ridiculousresult of Eq. (17) or the corresponding graphical representation inFigure 10B.
This behavior is explained further in Figure 1OC. This figure repre-. ents a plane perpendicular to OH, such as along AB. The shaded area re-
presents unobservable or experimental error and A'B' the exact change ofCVN with the corresponding change in chemical compositions along AB. For alarge deviation of composition from P = S, such as E, the predicted re-gression line is GH which is away from A'B' but at least has the same ten-dency. If the deviation of chemical composition from P = S is small, suchas F, the predicted regression line IJ will be completely wrong in bothsize and direction.
Sampling near the OH line or when a P = S corresponds to a narrowstrip MX on the LMN surface, as shown above. An additional analysis wasperformed by adding samples one by one away from OH to determine the effecton the regression analysis. When the samples are sufficient in number andcover a large area in the P - S plane, the predicted toughness shouldapproach a stable value as the number of samples approaches infinity. Onlywhen the toughness becomes stabilized during a sampling convergence testobtained by increasing the number of samples in the regression analysiswould the result from the analysis become meaningful.
This sampling convergence test was employed for all seven regressionanalyses in this investigation to determine whether this test can serve toreject the unreasonable regression analysis results and confirm the reliableones. The results of such tests are shown in Figures 11-17. In eachfigure, the chemical compositionsare shown by dots in (A). The digit num-bers represent the successive total number of cases in a regression analysis;3 means samples 1, 2, and 3 are included in a regression analysis, and 4means samples 1, 2, 3, and 4 are included, and so on. When analyzed in thismanner, only Figure 17 demonstrates satisfactory results. All regressioncoefficients, B0 , B1 , and B2 , converge and the contributions from un-observable errors are overpowered and damped away as the number of samplesincreases. Some convergence was obtained for the data in Figures 11 and 12.Equations (16) and (17) were shown to be inaccurate by Figures 14 and 15,respectively.
If the sequence or order of adding samples to the regression equationis random, instead of as shown in Figure 17A, the sampling convergent testexhibits a similar result, as indicated in Figure 18. The minimum numberof samples depends on the variation from the P = S line. When data aresimilar to that shown in Figure 19, fewer samples are needed than in caseswhere the data are closer to the P = S line.
14

The individual effect of phosphorus and sulfur on the toughness ofsteels is confirmed in this investigation. One typical example is shown inFigure 20. These plots can be examined to determine whether the correlationbetween toughness and phosphorus plus sulfur is closer than one between
toughness and either phosphorus or sulfur. It has been determined that thecorrelation with the sum of these elements is closer than for the individualelements when there are sufficient samples that consist of a variety ofheats of chemical compositions, as for the data in Tables 1 and 7. Thecorrelation coefficient is higher when the sum is plotted as shown inFigure 21A compared with the individual element correlations in Figures 20Aand 20B. However, this is not the case if the compositions are biased, thesum of the elements does not provide as good a result. This is the case inTable 2 where, in one series Alloy 17A-18C, the phosphorus contents are keptvirtually constant ai:- in another series Alloy 24B-24D the sulfur contentsare kept constant. In this instance, the correlation coefficient -0.6608appears to be only an average of -0.1133 and -0.9621 for the individualcorrelation with phosphorus and sulfur, respectively. A correlation betweentoughness and phosphorus and sulfur simultaneously will always produce abetter fit for the experimental results in terms of the correlation co-
efficient as shown in Tables I through 7. However, the multiple regressionanalysis will not necessarily provide more useful information unless thesignificance of analysis is verified.
The variation of transition temperature (15 ft-lbs criterion) with asimultaneous change in phosphorus and sulfur contents for AAR Grade B caststeel (29) can be depicted in the two-dimensional representation usingP + 0.7S as a single parameter as shown in Figure 21B in the light of thefollowing equations rewritten from Table 7:
Tran. Temp. (°F) = -26.08 + 701.6P + 495.5S (18)
or Tran. Temp. (OF) P -26.08 + 701.6 (P + 0.7S) (19)
Phosphorus as shown in Eqs. (18) and (19) is more potent compared to sulfurin raising the transition temperature of Grade B cast steel. For this steelthe specification for chemical composition is 0.05% max. P and 0.05% max. S.
The transition temperature corresponds to 0.05% P and 0.05% S, by Eq. (19),is 23.56°F. By inserting this value into Eq. (19) we obtain:
P + 0.7S 0.085 (20)
Equation (20) actually represents a specification equivalent to the one of
P 9 0.05% and S i 0.05%. The advantages of the proposed specification sug-gested in Eq. (20) are:
1) The parameter P + 0.7S is highly correlated with the transitiontemperature of the Grade B steel, while phosphorus or sulfur content indi-vidually only suggests a loose correlation with this property.
15
2) The range of the chemical composition allowed by the specificationis extended to 0 £ P < 0.085 and 0 £ S < 0.12 as long as Eq. (20) is obeyed.This provides more leeway for compositional variations in steel making, and
3) Since the parameter P + 0.7S is highly correlated to the toughnessof this steel, it is a more accurate quality control value.
Alternatively a specification, as shown in Eq. (21), is also justifiedfor the similar arguments.
P + S £ 0.10 (21)
Again the prediction of toughness in terms of transition temperature is
much improved by using P + S as a single parameter instead of P or S in-dividually. In Eq. (21) we have assumed that phosphorus and sulfur areinterchangeable, purely additive, and equally potent in lowering thetoughness of the steel. However, it has been suggested by Eq. (19) thatphosphorus is actually more deleterious than sulfur. Taking this intoconsideration for the steel with very high phosphorus contents, a modifi-cation of Eq. (21) to Eq. (22) can be employed for all chemical compositionsof phosphorus and sulfur:
P + S 4 0.09 (22)
The primary consideration of toughness thus far in this discussionhas been in terms of the criterion of transition temperature. The toughnessas evaluated by the Charpy V-notch impact energy is also important. Thework conducted by Larson and Herlihy (25) as shown in Table 1 and Figure 11suggested that sulfur is more influential in lowering the room temperatureIzod impact energy for AISI 4335 cast steel as expressed in the followingequations:
Izod (ft-lb) = 28.00 - 177.9P - 241.2S (23)
or Izod (ft-lb) P 28.00 - 177.9 (P + 1.3S) (24)
These equations indicate that sulfur is about 30% more effective inlowering the room temperature Izod impact energy. If P + S together aretaken as a single parameter to determine the effect on the toughness ofthis steel, the result is represented by Eq. (25):
Izod (ft-lb) 27.83 - 211.1 (P + S) (25)
16

The correlations are improved by employing either P + 1.3S or P + S
over the correlations using P or S content individually as shown by comparing
the correlation coefficients in Table 1. Assuming that the phosphorus andsulfur specifications for AISI 4335 steel are 0.035% max. and 0.040% max.,respectively, the proposed corresponding specifications considering roomtemperature Charpy V-notch impact energy as the criterion are indicated ineither Eq. (26) or Eq. (27):
P + 1.3S < Q.09 (26)
P + S i 0.075 (27)
Equation (26) provides a slightly better fit with the experimentalresults. If very high sulfur heats are considered, a slight modificationof Eq. (27) to Eq. (28) is indicated:
J
P + S < 0.07 (28)
Additional support for the position that sulfur is more detrimentalto the steel based on the room temperature impact energy is provided byWright and Quarrell's work on plain carbon cast steel shown in Table 2. (17)The alloys investigated in Wright and Quarrell's experiments contain anexceptionally high 0.22-0.32% aluminum content and therefore the regressionanalysis from Table 2 may be subject to some question. However, a compari-son of three heats from their experiments is shown below:
ALLOY P(%) S(%) CVN(ft-lb)
17A 0.009 0.021 55.017D 0.009 0.053 10.024D 0.077 0.021 30.5
At 0.009% phosphorus the CVN is decreased 14.06 ft-lb for every 0.01% in-crease in sulfur; on the other hand, at 0.021% sulfur level, CVN is de-creased 3.60 ft-lb for every 0.01% increase in phosphorus.
It is noted that a systematic statistically significant study on theeffects of phosphorus and sulfur on the toughness of steel has not been con-ducted. Accordingly, the relative effect of phosphorus and sulfur on theroom temperature Charpy V-notch impact energy and transition temperature forthe same steel is not available. It is postulated, by comparing Eq. (19)with Eq. (24) for different types of cast steels, that the role of phosphorusin steel is mainly one of shifting transition temperature and the role ofsulfur is in shifting the impact energy. This behavior of phosphorus andsulfur in steel is schematically represented in Figure 22. Equation (19),Eq. (24), Table 2, Figure 2, and Figure 4B indicate that this behavior ispossible.
17

r
D. Conclusions from the Computer Analysis
A computer analysis by the regression analysis technique was under-taken to determine the individual and combined effects of phosphorus andsulfur on the toughness of carbon, low and medium alloy steels. Thetoughness, as expressed by impact energy from Charpy V-notch and Izod tests,plane strain fracture toughness, nil ductility transition temperature and15 ft-lb transition temperature in the Charpy V-notch test, has been cor-related to phosphorus and sulfur separately, phosphorus and sulfur simul-taneously, and phosphorus plus sulfur as a single variable for severalsteels using the data available in the technical literature. The resultsallow the following conclusions.
1) The correlation between toughness and phosphorus plus sulfur iscloser than one between toughness and either phosphorus or sulfur whenthere are sufficient sample that consist of a variety of variations in bothsulfur and phosphorus.
2) A sampling convergence test was employed in the multiple regressionanalysis for the case of free variables in the equation, namely toughness,phosphorus and sulfur. .i ,,s te6.L was successful in determining the signifi-cance or meaningfulness of a multiple regression analysis.
3) Higher sulfu- and phosphorus contents reduce the toughness ofcarbon, low and medium alloy steels. Higher phosphorus contents in steelappear mainly to raise the transition temperature; increasing sulfur con-tent lowers impact tnergy.
4) It seems possible to consider some modification of the maximumvalues of phosphorus and sulfur contents in steel based on these results.These modifications should be to require a maximum sulfur plus phosphorusvalue in place of individual sulfur and phosphorus maxima.
III. MATERIALS AND PROCEDURES
A. Melting and Casting Practice
The steel selected for this investigation was AISI 4340 steel of thefollowing nominal composition:
%C %Mn %Si %Ni %Cr %Mo
0.38/0.43 0.60/0.80 0.35/0.45 1.65/2.00 0.70/0.90 0.20/0.30
Two one-thousand-pound heats of this steel have been cast and processed.The charge materials and their compositions are listed in Table 8. Thesteels were air melted in a basic-lined high frequency induction furnace.
18

The melting practice for both heats consisted of the following;
1) Cold charge electrolytic iron, electrolytic nickel, and lowcarbon steel scrap.
2) When molten, deslag and add FeMo.
3) Heat to 2850'F and boil for five minutes with pig iron.
4) Heat to 2900*F and block with FeSi and FeMn.
5) Add FeCr.
6) Tap into a preheated ladle at 30000F and deoxidize with0.07%Al and 0.05%CaSi.
7) Compensating additions of silicon and manganese were madeto the ladle along with the deoxidizer as needed to maintainthe desired levels of silicon and manganese during theholding of the heat.
8) Variations in phosphorus and sulfur were made by addingthese elements as FeP and FeS to the ladle with the de-oxidizer and compensating additions.
9) Pour into sand molds at about 2900*F.
Each tap was cast into a green sand mold to produce a casting of thedimensions shown in Figure 23. This casting was designed with an adequateriser and taper and no evidence of microshrinkage occurred in any casting.
The first heat was tapped and poured into seven castings designatedI, E, N, 0, M, A, and P; the second heat was tapped and poured into ninecastings designated J, F, K, B, L, G, C, H, and D.
B. Sectioning, Machining and Heat Treatment
All of the cast blocks were sectioned, machined and heat treated inaccordance with the procedures as described below:
Remove riser
600*F x 24 hr. A.C.
1800*F x 4 hr. A.C.
1200*F x 2 hr. A.C.
Section and machine test pieces to 0.020 inch oversize
1550*F x 1 hr. O.Q.
11000 F x 2 hr. O.Q. or 400*F x 2 hr. A.C.
Finish machine
19
L ____--------- -- - -

The casting design is shown in Figure 23. The layout of tensile, Charpyimpact and plane strain fracture toughness test specimens is indicated inFigure 24. For each cast block, half of the specimens were tempered at1100*F and the other half at 400*F to provide two strength levels for thesteels.
C. Hardness and Tensile Tests
The tensile test specimen used in this study had a 0.500 inch diametertest section with a 2.0 inch long gauge length per ASTM A370-77. Tensiletests were conducted at room temperature on a 60,000 lb capacity BALDWINtesting machine at crosshead speed of 0.005 in/min or an equivalent strainrate of 0.25%/mn. Load versus elongation was provided by the outputs ofa mechanical load device and an LVDT extensometer that were fed into anX-Y recorder. The Rockwell C hardness measurements were conducted on thefinish machined Charpy impact specimens.
D. Charpy Impact Tests--Conventional, Instrumented and InstrumentedPrecracked
The conventional Charpy impact test was conducted on a Wiedemann-Baldwin machine using a maximum energy capacity of 100 ft-lbs with astriking velocity of 10.9 ft/sec. Standard V-notch specimens were testedover the temperature range -320*F to 320*F per ASTM E23-72 and A370-77.
Instrumented precracked Charpy impact test was performed with similarprocedures on the same machine instrumented with Dynatup Model 500 manufac-tured by Effects Technology, Inc. The instrumentation package has beenfully described elsewhere. (42,61,62) Precracking of the Charpy impactspecimens was conducted on a standard ManLab precracker. The sample wasfatigue precracked using tension-zero loading. The a/W ratios obtainedranged from 0.33 to 0.37 (where a = crack length = notch + precrack depth,and W = 0.394 inch).
Both elastic and elastic-plastic fractures were obtained in this in-vestigation. Load-time and energy-time traces were obtained for all pre-cracked specimens tested. Measurements of the crack length were made atthe following three positions: at the center of the crack front and at twoother locations between the center and edge. The average of these threemeasurements of crack lengths is used to calculate dynamic fracture tough-ness, KId. The calculation of KId values was straightforward for elasticfractures with the help of the linear elastic fracture mechanics relation-ship for the three point bending specimen. However, for elastic-plasticfracture no standard method exists for the calculation of fracture toughness.Equivalent energy concept as proposed by Witt was used in this investigation.The procedure to calculate Kid values is presented in Appendix B.
Instrumented Charpy V-notch impact test was performed in a similar wayon specimens M, A, and P only to measure the effect of high sulfur andphosphorus on the load or yield strength versus temperature under the con-ditions of high strain rate loading and plastic constraint as imposed bythe impact loading.
20

E. Plane Strain Fracture Toughness Test
A compact tension specimen of ASTM E399-78a was chosen for the Klctest. The specimen dimensions were: thickness (B.) 1.000 inch;depth (W) = 2.000 inch; crack length (a) = 0.958 4 a 4 1.060 inch. AnMTS Model 632.01 clip-on gauge with displacement working range 0.150 inch(0.475-0.625 inch) was attached to the specimen. The crack (a) consistsof three sections, a 1/8 inch wide slot, a 0.003 inch wide EDM slot, anda sharp fatigue precrack. The fatigue precrack length was longer than0.05a or 0.05 inch, and maximum stress intensity factor, Kf, of the fatigueload was less than 60% of the "KQ" in accordance with ASTM E399-78a.
The compact tension specimen was fractured at room temperature on anMTS 810 machine. During the test, signal of load and displacement acrossthe notch, as measured from a 50,000 lb load cell and a clip-on gauge, wasfed into MTS recorder as load (Y) and strain (X), respectively. Loadingrate was 0.0125 in/min or approximately 90,000 psi Vin/min within the rangeof ASTM requirement. Following testing, the crack length was measured ina similar way, as described for instrumented precracked Charpy impactspecimen, and the load-displacement curve analyzed per ASTM requirements.
F. Fatigue Crack Propagation Test
The fatigue crack propagation rate was measured on all compact tensionspecimens prepared for the fracture toughness test prior to fracture. Thetest was conducted in air at room temperature on the same machine used forKl, test. A stroke control was chosen to prevent a possible open-loopcondition. (63) A load fluctuation range at 5 Hz frequency was maintainedas a constant by adjusting the span of the MTS control system and calibratedon the ocilloscope. The stress intensity factor range (AKI) was 40.0ksivin and 20.0 ksiv'in for 1100*F and 400°F tempered steels, respectively.In both cases, a stress ratio R = Klmin/KImax = 0.1 was used. A Gaertnermicroscope mounted in a micrometer slide was employed to measure the fatiguecrack extension. The micrometer slide was accurate to 0.001 mm. Todetermine the effect of high sulfur and high phosphorus on the behavior offatigue crack propagation at different stress intensity factor ranges,additional tests also conducted on M, A, and P specimens.
G. Metallography and Fractography
Metallographic specimens were prepared from center of the casting usingstandard technique. The volume fraction of nonmetallic inclusions wasmeasured by point count method per JISG0555. (64) Fracture surfaces ofselected Charpy V-notch specimens were examined using a Cambridge StereoscanS4-10 Scanning Electron Microscope.
21

IV. RESULTS AND DISCUSSION
A. Chemical Composition of Materials
The chemical analyses of the steels cast in the two heats are listedin Table 9. The analyses of all elements in the 4340 type steel are withinthe specified range and reasonably close to each other except for the de-liberate variation of sulfur and phosphorus contents. The matrix of phos-phorus and sulfur contents produced by the various analyses on these twoheats is shown in Figure 25.
B. Microstructure
The microstructures of the castings tempered at both 400°F and 1100°Fwere examined. In unetched specimens, both Type II and Type III sulfideinclusions occurred and were generally segregated to the interdendriticregions. The non-metallic inclusion content for all the castings producedis reported in Table 10. Etching the specimens revealed a typical quenchedand tempered martensitic structure. No difference in microstructure can bedetected as affected by either sulfur or phosphorus, except for highersulfide inclusion content of the higher sulfur steels.
C. Effect of P and S on Hardness and Tensile Properties
The hardness and tensile properties of the steels studied are summari-zed in Tables 11 and 12. The matrices in Figures 26 and 27 show the varia-tion in Rockwell C hardness and yield strength, respectively, as affectedby phosphorus and sulfur for medium strength (tempered at 1100°F) and highstrength (tempered at 400'F) 4340 cast steels. As indicated in thesefigures, phosphorus very slightly increases the hardness and yield strengthof both strength level steels, whereas sulfur has a negligible effect.From Tables 11 and 12, it is noted that the ultimate tensile strength isalso insensitive to the variations of phosphorus and sulfur. The truefracture strength and tensile reduction of area are, however, much affectedby these two elements, as shown in Figures 28 and 29.
The effect of phosphorus and sulfur on the tensile properties of 4340cast steel is summarized as follows.
1) Phosphorus very slightly increases the hardness and yield strength,whereas sulfur has a negligible effect.
2) The ultimate tensile strength is not sensitive to the variation ofphosphorus and sulfur.
3) Both the true fracture strength and tensile ductility are signifi-cantly reduced by phosphorus and sulfur. Sulfur is slightly more potentthan phosphorus in reducing the true fracture strength and tensile ductilityfor both strength level steels.
22

D. Effect of P and S on Charpy V-Notch Impact Properties
D.I. Charpy Impact Transition Curves
The Charpy impact properties of all the steels studied are summarizedin Tables 13 through 19. The influence of increasing phosphorus at varioussulfur levels on the Charpy V-notch impact properties from -320*F to +320*Fis listed in Figures 30-1 through 30-4 for the steels tempered at 1100*F.These figures indicate the fracture energy, percent fibrosity in thefracture, and lateral expansion as a function of testing temperature. Thesteels A, B, C, and D in Figure 30-1 show effect of increasing phosphorusat high sulfur (0.050%S) levels, the sulfur levels gradually drop for E, F,G, and H (0.035%S) in Figure 30-2, for I, J, K, and L (0.025%S) in Figure30-3, and for low sulfur (0.010%S) in the M, N, 0, and P steels in Figure30-4. It is noted that the fracture energy and lateral expansion increaseas the sulfur content decreases.
Similar data showing the Charpy V-notch transition temperature curveover the -320°F to +320°F range are demonstrated in Figures 31-1 to 31-4for these steels tempered at 400°F to the higher hardness. The fractureenergy and lateral expansion data are plotted. No distinct fibrosity tran-sition was observed. Steels A, B, C, and D in Figure 31-1 show the effectof increasing phosphorus levels at the high sulfur 0.050%S levels; steelsE, F, G, and H in Figure 31-2 show the same effects at a lower sulfur of0.035%S; steels I, J. K, and L in Figure 31-3 show the transition curvesfor increasing phosphorus with a 0.025%S content; and steels M, N, 0, andP in Figure 31-4 demonstrate the transition curves for increasing phos-phorus at the lowest 0.010%S level.
The combined effects of phosphorus and sulfur contents on the CharpyV-notch transition curves over a range of -320°F to +320*F are plotted inFigure 32. The curves at the top in "A" show the transition curves forthose steels tempered at 1100°F and the curves in the bottom, Figure 32B,indicate the transition curves after tempering at 400°F. The transitioncurves plotted in this figure combine the lowest, intermediate and highestsulfur and phosphorus contents for each steel.
The Charpy V-notch transition curves plotted in Figures 33-1 through33-4 indicate the effect of increasing phosphorus with a constant sulfur
level in the top of "A" plots and increasing sulfur contents with a constantphosphorus level in the bottom or "B" plots. The lowest sulfur and phos-phorus levels are held constant in Figure 33-1; intermediate sulfur andphosphorus levels are held constant in Figures 33-2 and 33-3; and the highestsulfur and phosphorus levels are constant in Figure 33-4. All these steelsin Figure 33 are tempered at 1100*F. A dashed line has been plotted oneach figure in Figure 33. The data along this line indicate the maximumvariation in Charpy V-notch impact fracture energy among the four curves ateach testing temperature. This curve is the locus of points showing thedifference in impact energy between the highest and lowest level at each
temperature.
The Charpy V-notch fracture energy transition curves plotted inFigures 34-1 through 34-4 show the same type of curves with constant sulfur
23
and constant phosphorus levels and increasing amounts of the other elementfor the steels tempered at 400*F. The lowest level of the constant elementsis in Figure 34-1, intermediate levels in Figures 34-2 and 34-3 and highestlevel in Figure 34-4. A dashed curve showing the maximum difference inimpact energy at each testing temperature also appears on each plot in thisfigure.
Examination of the curves in Figures 33 and 34 indicates that increasingphosphorus levels move the transition curves to the right or higher tempera-tures. The change in the level of fibrous energy on the upper shelf fractureenergy is relatively small. The increasing sulfur levels, however, havelittle effect on the transition temperature of the curves. The level offibrous fracture energy or the upper shelf energy is significantly decreasedby increasing sulfur levels. This difference in the relative effects of thetwo impurity elements produces different shapes of the dashed curves showingthe difference between the maximum and minimum energy at each temperature.These dashed curves for the plots with increasing sulfur levels are similarin shape to transition curves but depressed to lower levels of fracture
* energy. The similar curves for the plots with increasing phosphorus havemaximum values in the transition temperature range and minimum values at thehighest and lowest testing temperatures where the fractures are either allductile or brittle.
The Charpy V-notch impact energy transition curves plotted in Figure 35show the relative transition temperature behavior of phosphorus and sulfur.Each plot compares the two steels with counterpart combinations of theseelements at both the 1100'F and 400'F tempering temperature level. The plotin Figure 35-lA is for the highest phosphorus, lowest sulfur steel plottedagainst the highest sulfur, lowest phosphorus level. Figure 35-lB is thesecond highest phosphorus and second lowest sulfur steel versus the secondhighest sulfur, second lowest phosphorus steel. In a similar manner theother plots in Figure 35 compare the following steels:
Figure 35-2A Highest phosphorus, second lowest sulfur vs.highest sulfur, second lowest phosphorus.
Figure 35-2B Second highest phosphorus, lowest sulfur vs.second highest sulfur, lowest phosphorus.
Figure 35-3A Highest phosphorus, second highest sulfur vs.highest sulfur, second highest phosphorus.
Figure 35-3B Second lowest phosphorus, lowest sulfur vs.second lowest sulfur, lowest phosphorus.
Since higher sulfur lowers the fracture energy in the ductile fractureregion but has little effect on the transition temperature and higher phos-phorus raises the transition temperature but has less effect on the fibrousfracture energy levels, the two transition curves for the equal amount ofthese impurity elements cross or intersect as indicated on Figure 35-1.This intercept point averages -115F for the steels tempered at 1100OFand +150*F for the steels tempered at 4000 F. This is considered to be thetesting temperature at which sulfur and phosphorus are exerting equivalent
24
effects on the impact fracture energy.
Figure 35-4 contains the Charpy V-notch transition curves for the
lowest sulfur, lowest phosphorus steel versus both the lowest sulfur,
highest phosphorus and lowest phosphorus, highest sulfur steel. In thisfigure, the curves for the 1100'F temper are plotted at the top figure andfor the 4000 F temper in the bottom figure. This plot demonstrates the de-crease in fibrous impact energy levels with the higher sulfur content, andhigher transition temperature with the higher phosphorus content.
D.2. Fracture Energy Correlations and Transition Temperature of 1100*FTempered Steels
The effect of phosphorus content on the fracture energy of the CharpyV-notch specimens broken at -II5°F (ave. cross over temperature in Figure 35)at various sulfur levels is shown in Figure 36A. The influence of sulfurlevel on this -115F fracture energy is shown at different phosphorus levelsin Figure 36B. These data are for steels tempered at 1100°F. It is ob-served that the slope or rate of decrease of fracture energy with increasingphosphorus (Figure 36A) is comparable to that with increasing sulfur(Figure 36B) at the cross over temperature. The effect of combined sulfurand phosphorus contents on the fracture energy at this temperature isplotted in Figure 36C. The equally, and therefore additively, detrimentaleffect of sulfur and phosphorus at -115*F is reflected in a fairly goodcorrelation between fracture energy and P + S as a parameter in Figure 36C.
Similar results to Figure 36 on both sides of -115F, namely -150*Fand 80'F or room temperature, are plotted in Figures 37 and 38. Below thecross over temperature at -150'F, phosphorus is slightly more deleteriousthan sulfur in lowering the fracture energy, as indicated by comparing theslopes in Figures 37A and 37B. Howev6 , the combined phosphorus plus sulfurplots versus fracture energy at this temperature as shown in Figure 37C aresmooth and decrease uniformly from high to low energy levels with increasingtotal phosphorus plus sulfur contents.
When these plots of increasing phosphorus, increasing sulfur and in-creasing phosphorus plus sulfur are compared at the higher, room temperature
testing temperature (Figure 38), it is noted that the slope or rate of de-crease of fracture energy versus sulfur content is considerably greater thanversus the phosphorus content because of a larger effect of sulfur on theupper shelf fracture energy. The combined phosphorus plus sulfur contentversus fracture energy curve exhibits much more scatter. This suggests apoor additive nature of P + S as a single parameter in measuring the toughnessof steels fractured much above the ductility transition temperature.
The effect of phosphorus on the transition temperature is clearly il-lustrated in Figure 39 where the percent fibrosity in the fracture is plotted
against the testing temperature for steels of increasing phosphorus levelstempered at 1100*F. Higher phosphorus contents with base sulfurs of 0.010%S(Figure 39-lA), 0.025%S (Figure 39-1B), 0.035%S (Figure 39-2A) and 0.050%S(Figure 39-2B) all indicate steadily higher transition temperatures at higherphosphorus levels.
25
Similar plots of percent fibrosity versus testing temperature for in-
creasing sulfur levels at constant phosphorus contents in Figure 4Q uemon-strate practically no effect of sulfur on the transition tempera:ure at allconstant phosphorus levels. All of these steels were tempered at 1100*F.
Plots of the 50% fibrosity transition temperature versus % phosphoruscontent, percent sulfur content, and percent combined phosphorus and sulfurcontents in Figure 41 show a direct increase in transition temperature withphosphorus, no effect of sulfur, and a definite trend of increasing the tem-perature with combined higher phosphorus and sulfur content. However, thecombined element plot exhibits significantly more scatter. Plots of the50% energy transition temperature versus the phosphorus, sulfur, and com-bined phosphorus and sulfur contents in Figure 42 show a similar influenceof the elements on this transition.
D. 3. Fracture Energy Correlations and Transition Temperature of 400*FTempered Steels
Similar plots that were made for the steels tempered at 400*F are shownin Figures 43-46 for the higher strength steels tempered at 4000 F. In thissteel the average cross over temperature between the higher phosphorus andsulfur steels in Figure 35 occurred at +150*F. For this reason the effectof increasing phosphorus and sulfur levels on the fracture energy were com-pared at +I150*F in Figure 43, -20*F in Figure 44, and +320*F testing tem-perature in Figure 45. These plots indicate a similar amount of decreasingfracture energy with increasing phosphorus or sulfur at -150*F in Figures 43Aand 43B. The correlation with combined sulfur and phosphorus contents(Figure 43C) is fairly close for all steels. The lower testing temperatureof -20*F for these steels tempered at 400°F demonstrates a slightly steeperslope in Figure 44A than that in Figure 44B. This indicates a similarityto those steels tempered at 1100*F that phosphorus is slightly more harmfulthan sulfur to the steel below the cross over temperature. The correlationbetween the combined phosphorus plus sulfur contents and the fracture energyat this testing temperature is fairly good, although more erratic than at+1500F.
At the higher testing temperature of +320*F, increasing phosphoruscontent has only a small influence on the fracture energy as shown in
Figure 45A. Some decrease in this energy is apparent at the lowest sulfurlevel but this effect has just about disappeared at the higher sulfur con-tents. Increasing sulfur content. However, reduces the fracture energysharply as shown in Figure 45B. The fracture energy is also reduced by in-creasing sulfur plus phosphorus, as indicated in Figure 45, but considerablescatter occurs.
The effects of the phosphorus, sulfur, and combined phosphorus and sul-fur contents on the 50% energy transition temperature are plotted for thesteels tempered at 400*F (Figure 46). This 50% energy transition temperatureincreases steadily with limited scatter at increasing phosphorus content inFigure 46A. Increasing sulfur content has no effect on the transition tem-perature as shown in Figure 46B. While the 50% transition temperature does
26
increase with combined phosphorus and sulfur contents as indicated in
Figure 46C, the data exhibit a large amount of scatter. This larger scatter,
compared with the 50% transition temperature of 1100*F tempered steels, is
partly due to the slope of transition curve of 4Q0.F tempered steel which
is much flatter in the transition temperature range; and, for the samequantity of experimental error in CVN energy measurement, the correspondingerror of 50% transition temperature measurement is much larger.
E. Effect of P and S on Plane Strain Fracture Toughness
The load displacement plots of the Klc test for the medium strength4340 steel tempered at 1100*F exhibited distinct pop-ins which were takenas the critical loads. For high strength steel tempered at 400°F thecritical load was defined at 5% load offset since no evident pop-in can bedetected. The results of KIc tests are listed in Table 20 and 21. All ofthe tests of 400'F tempered steels met the ASTM E399-78a requirement and,therefore, the KIc values are valid. For most of the 1l00l F temperedsteels, however, the specimen thicknesses are undersized, the tests areinvalid and, therefore, the conditional fracture toughness KQ's areassigned.
Individual and combined effects of phosphorus and sulfur on the roomtemperature plane strain fracture toughness of the medium strength steelsare shown in Figure 47. The result agrees fairly well with its counterpartCharpy V-notch test (Figure 38). Sulfur is more deleterious than phosphorusfor medium strength 4340 steel tested at room temperature.
The Charpy tests conducted at room temperature for high strength steelhave indicated that both phosphorus and sulfur reduce the toughness sub-stantially. However, the KIc test as shown in Figure 48 for the same steelalso tested at room temperature indicates that phosphorus has a pronouncedeffect, whereas sulfur has little effect on the plane strain fracture tough-ness of this high strength steel. The reason for this behavior is ex-plained in Sec. A.2., Chapter V.
The plots as indicated in Figures 47C and 48C correlating Kq and KIcwith P + S for both strength level steels show significant scatter. Thosesteels that contain approximately equal amounts of phosphorus and sulfurprovide a fairly good correlation, as shown by the solid circles in thesame figures. This is in agreement with the results of Groves and Wallace. (28)
F. Effect of P and S on Dynamic Fracture Toughness
The dynamic fracture toughness properties of all the steels investigatedare summarized in Tables 22 and 23. The combined effects of phosphorus andsulfur contents on the dynamic fracture toughness curves over a range of-320'F to 320*F or 400*F are plotted in Figure 49. The curves in Figure 49Aat the top show the transition curves for those steels tempered at 1100OFand the curves at the bottom (Figure 49B) indicate the transition curvesafter tempering at 4000 F. The curves in this figure combine the lowest,intermediate, and highest sulfur and phosphorus contents for each steel.
27

The transition curves plotted in Figure 50. s.how the individual and
combined effect of phosphorus and sulfur on the dynamic fracture toughness
behavior. This plot contains the KId transition curves for the lowest
phosphorus and lowest sulfur, highest phosphorus and lowest sulfur, lowest
phosphorus and highest sulfur, and highest phosphorus and highest sulfur
steels.
As occurred with the Charpy tests, higher sulfur contents lower thefracture energy in the ductile fracture region but have little effect onthe transition temperature. Higher phosphorus contents raise the tran-sition temperature but have less effect on the upper shelf toughness. Thetwo transition curves, namely high phosphorus and low sulfur versus lowphosphorus and high sulfur, also cross or intersect in Figure 50 for bothstrength levels. This intercept point averages -II0F for steels temperedat 1100'F and 230*F for the steels tempered at 400°F compared to -II5*F and150°F for the counterpart Charpy V-notch tests. Dynamic fracture toughnesshad little influence on the cross over temperature for the steel temperedat 11000F but significantly raised the temperature for the steel temperedat 4000F. This suggests an effect of phosphorus and sulfur on the notchsensitivity at the two different strength level steels, and this will bediscussed later.
Figure 51 shows the effect of phosphorus plus sulfur contents on thedynamic fracture toughness of the medium strength steels tested at -150*F,-110°F, and 80°F, corresponding to below, at, and above the cross overtemperature. A similar plot for higher strength steels tested at 80*F,230*F, and 400'F is illustrated in Figure 52. It is noted that a highdegree of correlation between KId and P + S exists only at the cross overtemperatures, which are -l00*F for the medium strength steel and 230OFfor the high strength steel. Below the cross over temperature, for bothstrength level steels, phosphorus is more deleterious in lowering thefracture toughness and therefore the fracture toughness of high phosphorusspecimens is scattered to the lower bound of the curves in Figures 51A and52A. On the other hand above the cross over temperature, for both steels,sulfur is more deleterious in lowering the fracture toughness and thereforethe fracture toughness of high sulfur specimens is scattered to the lowerbound of the curves in Figures 51C and 52C.
G. Effect of P and S on Fatigue Crack Propagation
The results of fatigue crack propagation test are listed in Tables 24and 25. The variation of fatigue crack growth rate with stress intensityfactor, as affected by phosphorus and sulfur for medium and high strength4340 cast steels, is shown in Figure 53. Examination of this figure indicatesthe following.
1) The 200 ksi yield strength steel has a higher fatigue crack growthrate than the 150 ksi yield strength steel at the same stress intensityfactor range. In contrast, Imhof and Barsom report no difference betweenthe different strength levels for wrought 4340 steel. (65)
2) Both phosphorus and sulfur increase the fatigue crack growth rateof the 150 ksi yield strength steel slightly.
28
3) Phosphorus sharply raises the fatigue crack growth rate of the220 ksi yield strength. steel, whereas sulfur has virtually no effect atthis strength level.
4) The fatigue crack growth rate is correlated to the fracturetoughness in all the steels studied. An increase in fracture toughness de-creases the fatigue crack growth rate.
5) At a stress intensity factor range well below the critical fracturetoughness, fatigue properties are not significantly affected by phosphorusand sulfur. The effect of phosphorus and sulfur on fatigue approachestheir effect on the fracture toughness as the stress intensity factor rangeof a material approaches its critical fracture toughness.
Metallographic examination of the fatigue growth paths in these steelshas yielded the following observations.
1) The fatigue crack paths may detour from the straight line to joininclusions.
2) The fatigue crack paths of the high strength steel is straighterthan for medium strength, presumably because the plastic deformation isless extensive and the plastic zone size is smaller at the crack-tip of thehigh strength steel. This suggests that sulfide inclusions, and thereforesulfur, have less effect on the fatigue propagation property of high strengthsteel because less sulfide inclusions are encountered in the fatigue crackpaths, this confirming the experimental results.
V. MECHANISM OF EMBRITTLEMENT
A. Effect of P and S on Strain Rate and Notch Sensitivities of 4340 Medium
and High Strength Steels
A.l. Strain Rate Sensitivity as Affected by P and S
The rate of increase of the stress intensity factor (KI) for bothstatic and dynamic fracture toughness can be estimated by dividing thestress intenisity factor by the time needed to reach this value. The valuesof Kic and KId are calculated to be %l.5 ksivriin/sec and %6.0 X 10⁵ ksiv'in/sec,respectively. The ratio of rate of increase of stress intensity factor fordynamic fracture toughness test versus static fracture toughness test,KId/KIc, is therefore ' 4 x l0s times.
Figure 54 plots the dynamic fracture toughness (KId) versus plane strainfracture toughness (Kic) of both 400*F and 1100*F tempered steels tested atroom temperature. It is observed that the discrepancies in fracture tough-ness as measured by static and dynamic test methods are small. Based onthis, it appears that both the medium and high strength steels are strain
29

* rate insensitive. No evidence was found that phosphorus and sulfur couldaffect the strain rate sensitivity of the steels studied. One possibleexplanation of the strain rate insensitivity of this materil is that itstempered martensite structure contains a high density of dislocations.Similar results were observed for 300 Maraging steel. (66)
A.2. Notch Sensitivity as Affected by P and S
It has been acknowledged in Sec. E, Chapter IV that for 40D0 F temperedhigh strength steel, sulfur exhibits a substantial detrimental effect on thetoughness as measured by the Charpy V-notch test, but exerts little in-fluence on the results of the plane strain fracture toughness test. It wasalso suggested earlier that phosphorus and sulfur might influence the notchsensitivity of medium and high strength 4340 steels.
Figure 55 contains both the impact and dynamic fracture toughnesstransition curves for both strength levels of this 4340 steel. To exhibitthe maximum effect of phosphorus versus sulfur, two steels are compared,with one containing high phosphorus and low sulfur and the other, lowphosphorus and high sulfur. The CVN specimen has a notch radium of 0.01inch as compared with 0 radius for dynamic fracture toughness specimen.
For the steel tempered at 1100*F, a reduction in notch radius from0.01 inch to 0 inch shifts the cross over temperature from -120OF to -110 0F,or a small difference. However, for the high strength steel tempered at400*F, a reduction in notch radius of the same amount raises the cross overtemperature substantially or from 1500F to 270*F. These shifts are attri-buted to the relative shifting of high phosphorus and low sulfur steeltransition curve versus low phosphorus and high sulfur steel transitioncurve associated with a change in notch radius. In other words, phosphorusand sulfur exert a different notch sensitivity effect on the materialsinvestigated. This hypothesis is presented below.
The sensitivity of the impact energy of a specimen to the severity ofa notch is defined, ior the purpose of this experiment, as notch toughnesssensitivity ratio (NTSR):
= Impact energy per unit area of p-0 Charpy specimenNTSR= Impact energy per unit area of p-0.01" CVN specimen (29)
where p denotes radius of a notch. NTSR is a measurement of sensitivity ofimpact fracture energy to the severity of a notch and is therefore dis-tinguished from the notch sensitivity of tensile strength to a notch.
The notch toughness sensitivity ratios as measured by comparing thefracture energy per unit area of precracked Charpy V-notch specimen versusconventional Charpy V-notch specimen for both 1100°F and 400*F temperedsteels are presented in Tables 26 and 27.
The effect of phosphorus and sulfur on the notch toughness sensitivity
ratio of medium and high strength 4340 cast steel is shown in Figure 56.
30
The steel with a lower NTSR value indicates that this steel is more suscepti-
ble to a reduction of toughness in the presence of a notch. It is noted thatphosphorus increases the notch toughness sensitivity (decreases the NTSR) ofthe medium strength steel and sulfur reduces this sensitivity of the highstrength and probably also the medium strength steel. It is also noted inthe same figure that those steels having higher strength or lower strengthbut tested at low temperature are more sensitive to the severity of notchin reducing the impact fracture energy.
The effect of notch severity on the cross over temperature in Figure 55can be understood in the light of Figure 56. In Figure 55A for the steeltempered at IO0 *F, as the notch radius decreases from 0.01 inch to 0, thefracture toughness transition curve of the high sulfur steel is raised up-ward or remained unchanged relative to its CVN transition curve. However,the fracture toughness transition curve of the high phosphorus steel isdepressed downward relative to its CVN transition curve; this occurs becausethe toughness of the high phosphorus, medium strength steel is notch tough-ness sensitive. The result is a shift of cross over temperature to highertemperatures. Similar arguments also apply to Figure 55B for 400*F temperedhigh strength steel. In this case the fracture toughness transition curveof high sulfur steel is raised upward relative to that of the high phosphorussteel because the toughness of the high sulfur, high strength steel is rela-tively notch insensitive.
A smaller shift of cross over temperature to the right in Figure 55A ascompared with Figure 55B is because the slope of the curve near the crossover temperature of Figure 55A is much steeper and, for the same quantity ofdeviation in fracture toughness, the shift in cross over temperature is pro-portionally smaller.
B. Effect of P and S on Dynamic Tensile Properties
B.1. Tensile Strength as Affected by P and S
The load-deflection and load-temperature curves from the instrumentedCharpy V-notch impact tests permit the determination of the effect of phos-phorus and sulfur on the dynamic tensile behavior of medium and high strength4340 cast steels tempered at 1100*F and 400*F, respectively.
ylThe experimental results of pre-general yield fracture load (PF), generalyield load (PGy), and maximum load after general yield (PM) are shown inTables 28 and 29 for medium and high strength steels, respectively. Sincethe load-deflection curve of all the steels studied exhibited the round housetype of curve, the general yield load was determined as shown in Figure 57.Figure 58 plots the variation of load and CVN impact energy with temperaturefor low phosphorus and low sulfur, low phosphorus and high sulfur, and highphosphorus and low sulfur, medium strength 4340 cast steels.
In Figure 58, TD(N) denotes the brittleness transition temperature fora notched specimen in which fracture occurs upon general yielding, and TS(N) ,the initiation transition temperature which is the lowest temperature atwhich fracture is initiated by fibrous tearing. It is noted that an increasein temperature from TD(N) to TS(N) for the 0.010%P, ).0ll%S, and the 0.050%P,
31

0.012%S medium strength steels shown in Figure 58 corresponds to the tempera-ture range in which the fracture load rises sharply beyond the general yield
load. The impact energy also increases sharply and the fracture changes fromessentially all cleavage to fibrous tearing in this temperature range. For
the 0.007%P and 0.049%S steel, however, the fracture load is depressed to a
lower value compared to the higher fracture load for the other steels in the
same temperature range between TD(N) and TS(N. An increase in phosphorus,
while maintaining sulfur constant, produces the following effects on medium
strength 4340 cast steel.
1) Phosphorus increases the yield strength at all temperatures and the
temperature dependence of yield strength more noticeably at lower tempera-tures. The yield strength (0y) of high phosphorus steel is related to
friction stress (Gi) and grain size (d) through the Hall-Petch relation:
ay(xp,T)- ai(xp,T) + K(x p , T)d (xp) (30)
where x is % phosphorus content, T is temperature, and K is temperaturedependence of grain size. Ky is assumed to be independent of temperaturesince twinning is not believed to be a mode of deformation even at very lowtemperature because of the high density of precipitates, dislocations, andother substructures for the materials studied. Therefore,
Ky(xpT)- Ky(xp) (31)
and Oy(xp,T) - Oi(xpT) + Ky(xp)d- (xp) (32)
The derivatives of the above equation become:
a y x e , T ) ao i ( x p , T ) ( 3
Y-T (34)aI "T xp" (3 T
Phosphorus, in 4340 medium strength steel, increases the friction
stress which in turn increases the yield strength of the lower phosphorussteel. The effect that phosphorus content exerts on the temperature de-pendence of friction stress, and hence the yield strength, is presUmablycaused by the decrease in solubility of phosphorus and the increase indegree of supersaturation with the decrease in temperature shown in Figure 1.
2) Phosphorus slightly increases the strain hardening rate which isresponsible for a higher fracture load of 0.050%P and 0.012%S steel as com-pared with that of 0.010%P and 0.011%S steel between 00 F to -150*F, althoughthe latter steel has a higher fracture strain at all temperatures.
3) An increase in phosphorus from 0.010% to 0.050% decreases the clea-vage fracture strength (of*) from 440.2 ksi to 410.0 ksi as calculated inAppendix C.
32

4) An increase in phosphorus from 0.010% to 0.050% increases thebrittleness transition temperature by 72*F (from -266 0 F to -1940F), theinitiation transition temperature by 90*F (from -110°F to -20*F) and the50% fibrosity transition temperature by 71'F (from -194*F to -123*F). Theeffect of phosphorus in shifting the ductile-brittle transition temperatureis explained in Figure 59. Phosphorus increases the yield strength, thetemperature dependence of yield strength, and decreases the cleavage fracturestrength. Together these raise the brittleness transition temperature fromTD(N) to TD(N).
A similar plot showing the variation of load and CVN impact energy withtemperature for low phosphorus and low sulfur, low phosphorus and high sulfur,and high phosphorus and low sulfur, high strength 4340 cast steels isexhibited in Figure 60. One significant characteristic in Figure 60 is that,above the brittleness transition temperature (TD(N)), the fracture loadfollows almost immediately upon general yielding for the 0.010%P, 0.011%S,and the 0.050%P, 0.012%S high strength 4340 cast steels. This is in con-trast to the case in Figure 58 for medium strength steels. Since a sharprise in the fracture load and the corresponding fracture toughness beyondTD(N) is believed to be caused by a relaxation of the triaxial stress state(a decrease in K( )max), the absence of this behavior is an indicationwhich explains the failure of the high strength steel to undergo a distinctductile to brittle transition. A high sulfur content in the high strengthsteel also causes a depression of the whole load-temperature curve in theentire temperature range studied. The fracture load, however, does notreach the general yield load of the low sulfur steels.
An increase in phosphorus produces the following effects on high
strength 4340 cast steel:
1) Phosphorus increases the yield strength at all temperatures.Whether phosphorus also increases the temperature dependence of yield strengthat lower temperature cannot be determined because of a major uncertainty inextrapolating the general yield load of 0.050%P, 0.012%S steel to lowertemperatures.
2) An increase in phosphorus from 0.010% to 0.050% decreases thecleavage fracture strength (uf*) from 524.9 ksi to 509.3 ksi as calculated inAppendix C.
3) An increase in phosphorus from 0.010% to 0.050% raises the brittle-
ness transition temperature greatly by 344*F (from -440 F to +300 0 F).
B.2. Plane Strain Ductility as Affected by P and S
Plane strain ductility is an important property of a material. Itmeasures the ductility of this material under a plane-strain plastic strainstate. (67) It is therefore reasonable that the fracture toughness of amaterial should correlate with the plane strain ductility rather than theaxisymmetric ductility.
The deflection at maximum load (dM) from a Charpy impact test is ameasurement of ductility in a notched condition. A relation between de-
33

flection of a Charpy V-.notch specimen loaded in three-point bending and thetrue strain was established by Wilshaw and was taken as the true fracturestrain in the Charpy V-notch specimen: (68)
Cf,CVN -n(l + 8dM) (35)
where dM is in inches. The results of deflection at maximum load and truefracture strain in Charpy V-notch specimen for 0.012%P and 0.011%S, 0.007%Pand 0.049%S, and 0.050%P and 0.012%S 4340 medium and high strength caststeels are listed in Tables 28 and 29. Clausing has shown that Ef,CVN is ameasure of plane strain ductility. (67)
The critical crack-opening displacement (CODId) is a measurement ofcrack tip displacement under plane strain dynamic conditions prior to crackpropagation. The CODId results at various test temperatures for 0.012%P and0.011%S, 0.007%P and 0.049%S, and 0.050%P and 0.012%S medium and high strength4340 cast steels as listed in Tables 30 and 31 are calculated from Eq. (7):
CODId(T)=KId2 (T)(1 - v2) (7)Id(T) E(TL)cy(T)
where KId was taken from the dynamic fracture toughness tests at varioustemperatures. The modulus of elasticity (E) of 4340 steel at 80'F wasmeasured at 29.0 x 10 psi from the tensile test. Variation of E withtemperature was estimated in accordance with: (69)
E(T) - (29.48-0.006T)x 106 psi, where T in OF (36)
The variation of yield strength (0y) with temperature was estimated fromthe general yield load at various temperatures as measured in Figures 58 and60 in accordance with:
Oy(T) - 31.6 FGy(T) psi, for medium strength 4340 steel
(37,$ o¥(T) - 35.0 FGY(T) psi, for high strength 4340 steel
This relationship was demonstrated in Appendix C.
The effects of phosphorus and sulfur at various temperatures on thecritical crack-opening displacement (CODId) and true fracture strain in CVNspecimen (cfCVN) of medium and high strength 4340 cast steels are shown inFigures 61 and 62. Similar to the transition curves of CVN impact energyand dynamic fracture toughness, cross over temperatures associated with highphosphorus, low sulfur and low phosphorus, high sulfur 4340 cast steels alsooccurred for each case in Figures 61 and 62.
It is Poted from fracture mechanics, as shown in Eq. (7) that KId% (CyCODd)" -. Comparing KId in Figure 50, oy in Figures 58 and 60, and CODIdin Figures 61A and 62A shows that the general shape of KId transition curve is
34

mainly determined by CODId rather than Gy. This occurs because the per-centage variation of CODId with temperature is much larger than for Gy.The yield strength, however, modifies the shape of the CODId transitioncurve to obtain the KId transition curve.
The crack-tip geometry of a propagating crack is defined by the radiusand the crack-opening displacement which is dependent on the true fracturestrain at the crack tip. A relation between critical crack-opening dis-placement and true fracture strain in the CVN specimen for medium and highstrength 4340 cast steels is shown in Figure 63.
Figure 64 shows the normalized CODId and Ef cvN of the 0.007%P and0.049%S, 0.050%P and 0.012%S steels compared to the 0.012%P and 0.011%Ssteel at both medium and high strength levels. The result clearly indicatesthat phosphorus embrittles the steel at low temperature. Some recovery inthe normalized CODId value of the 0.050%P steel below -200*F occurs whenthe reference 0.012%P and 0.011%S steel also becomes brittle. This confirmsthe results shown in Figures 33A and 34A, where the variation in CharpyV-notch impact energy (dashed line) passes through a maximum in each case.Enzian also observed a similar effect of phosphorus on the work-embrittle-ness behavior of low carbon steel. The maximum detrimental effect ofphosphorus occurs at intermediate amount of cold work. (4) Sulfur reducesthe ductility and therefore toughness of the steel at higher temperaturesas indicated in Figure 64. At the cross over temperature, phosphorus andsulfur equally embrittle the steel.
Figure 65 is a similar plot to Figure 64. The effect of the strengthlevel of high sulfur steel on the normalized critical crack-opening dis-placement is shown in Figure 65A, and that of high phosphorus steel on thenormalized critical crack-opening displacement is indicated in Figure 65B.It is noted that phosphorus is more detrimental to the CODId and thereforethe fracture toughness of 4340 cast steel at the higher strength level overa wide temperature range. Sulfur reduces the CODId at all temperatures.This reduction is more pronounced for lower strength steel.
C. Fractographs of Fractures
C.l. Mode of Fracture as Affected by P and S
Examination of the fracture surfaces of the Charpy V-notch specimensfor the high phosphorus versus high sulfur steels at both strength levelsshows a distinct fibrosity transition for the lower strength steel. Thehigh strength steel has a brittle fracture at low temperature that becomesonly somewhat more ductile at high temperature. Examination of the fractureof medium strength steel under the scanning electron micLoscope indicatesthe following.
1) Below the cross over temperature, -200*F, the fracture of 0.049%Shigh sulfur steel consists of mixed quasicleavage facets and dimples inter-connected by tear ridges; the large dimples are nucleated by sulfide in-clusions. The fracture of 0.050%P high phosphorus steel is characterizedby quasicleavage features.
35
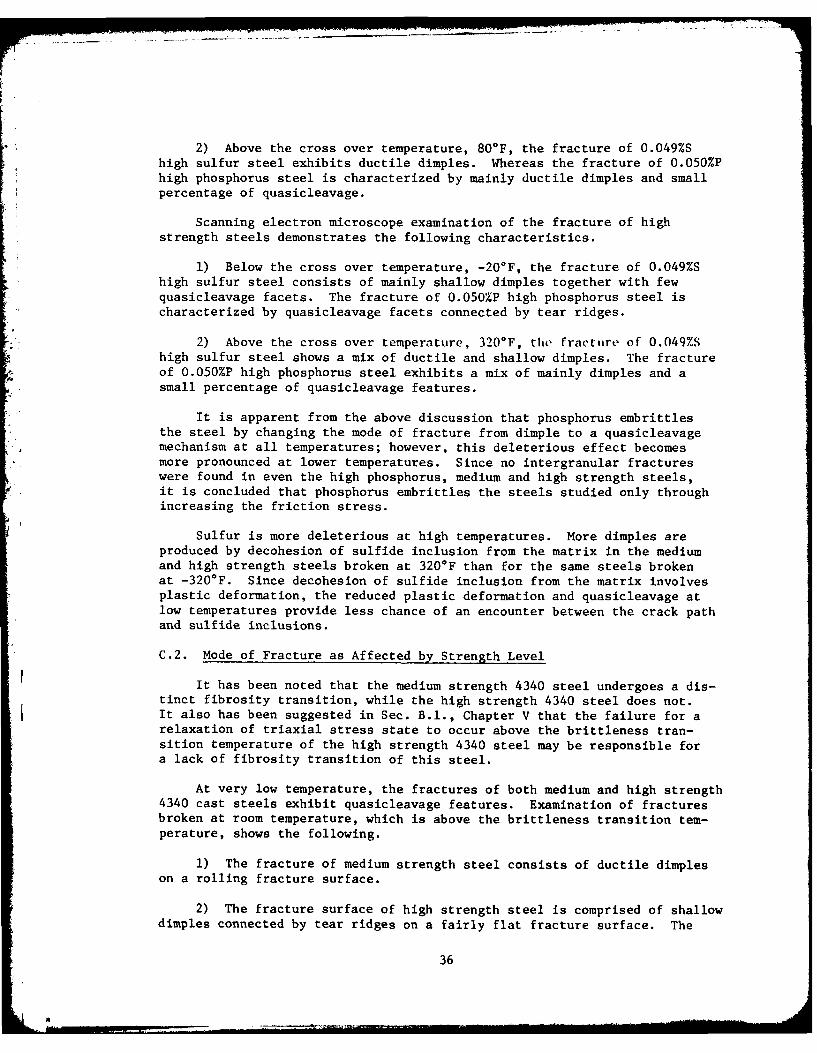
2) Above the cross over temperature, 800 F, the fracture of 0.049%Shigh sulfur steel exhibits ductile dimples. Whereas the fracture of 0.050%Phigh phosphorus steel is characterized by mainly ductile dimples and smallpercentage of quasicleavage.
Scanning electron microscope examination of the fracture of highstrength steels demonstrates the following characteristics.
1) Below the cross over temperature, -20*F, the fracture of 0.049%Shigh sulfur steel consists of mainly shallow dimples together with fewquasicleavage facets. The fracture of 0.050%P high phosphorus steel ischaracterized by quasicleavage facets connected by tear ridges.
2) Above the cross over temperature, 320°F, the fracture of 0.049%Shigh sulfur steel shows a mix of ductile and shallow dimples. The fractureof 0.050%P high phosphorus steel exhibits a mix of mainly dimples and asmall percentage of quasicleavage features.
It is apparent from the above discussion that phosphorus embrittlesthe steel by changing the mode of fracture from dimple to a quasicleavagemechanism at all temperatures; however, this deleterious effect becomesmore pronounced at lower temperatures. Since no intergranular fractureswere found in even the high phosphorus, medium and high strength steels,it is concluded that phosphorus embrittles the steels studied only throughincreasing the friction stress.
Sulfur is more deleterious at high temperatures. More dimples areproduced by decohesion of sulfide inclusion from the matrix in the mediumand high strength steels broken at 320*F than for the same steels brokenat -320*F. Since decohesion of sulfide inclusion from the matrix involvesplastic deformation, the reduced plastic deformation and quasicleavage atlow temperatures provide less chance of an encounter between the crack pathand sulfide inclusions.
C.2. Mode of Fracture as Affected by Strength Level
It has been noted that the medium strength 4340 steel undergoes a dis-tinct fibrosity transition, while the high strength 4340 steel does not.It also has been suggested in Sec. B.1., Chapter V that the failure for arelaxation of triaxial stress state to occur above the brittleness tran-sition temperature of the high strength 4340 steel may be responsible fora lack of fibrosity transition of this steel.
At very low temperature, the fractures of both medium and high strength4340 cast steels exhibit quasicleavage features. Examination of fracturesbroken at room temperature, which is above the brittleness transition tem-perature, shows the following.
1) The fracture of medium strength steel consists of ductile dimpleson a rolling fracture surface.
2) The fracture surface of high strength steel is comprised of shallowdimples connected by tear ridges on a fairly flat fracture surface. The
36

tear ridge is a ligament broken behind the main crack front and is a signof localized plane stress state fracture. This difference is consideredresponsible for a large difference in the measured lateral expansion be-tween medium and high strength 4340 cast steels.
VI. CONCLUSIONS
1. Although increasing content of both phosphorus and sulfur lowersthe toughness of steel, the effect of these individual elements varies sig-nificantly. The toughness was reduced by larger amounts of each elementwhether measured by Charpy V-notch transition curves for regular or pre-cracked notches, or by fracture toughness measurements. Higher phosphorusraises the transition temperature of the Charpy curves and lowers thestatic, room temperature, fracture toughness of the medium and high strengthsteels. However, higher sulfur content has little effect on the transitiontemperature but lowers the ductile shelf energy and insignificantly reducesthe static fracture toughness of the high strength steel. Because of thisdifferent behavior of the two elements, utilizing the sum of the two inpreference to individual maxima could fail to provide the same relativetoughness under various stress conditions.
2. The reason that phosphorus and sulfur affect the toughness dif-ferently is because of the diverse mechanisms by which this toughness islowered. Phosphorus is present in supersaturated solid solution below about200°F and increases the friction stress for dislocation motion through thelattice, thereby embrittling the steel. The sulfur has no solubility inthe steel and forms sulfide inclusions that reduce the cohesive strengthbetween the inclusion and matrix interface of the steel, thereby facilitatingfracture but without the embrittling influence of phosphorus.
3. For equal amounts of phosphorus and sulfur, their different effectson the transition curves result in a cross over temperature for the twosteels. Above the cross over temperature, the higher phosphorus steel hashigher fracture energy and below this temperature, the higher sulfur steelhas higher energy. This cross over temperature occurs at relatively lowtemperatures (about -115F) for the medium strength (150 ksi yield strength)steel and at higher temperature (about 150*F) for the high strength (220 ksiyield strength) steel. These cross over temperatures are raised for thesharper notch obtained with the precracked Charpy tests. This cross overtemperature behavior is consistent with the effect of these elements on themeasured toughness and the mechanism by which each lowers the toughness.Good correlation between the toughness and the phosphorus plus sulfur onlyoccurs at these cross over temperatures.
4. In addition to the primary objective of this study discussed inthe above conclusions, several other behavioral characteristics of phos-phorus and sulfur were observed during the testing.
37

(a) Phosphorus increases the notch toughness sensitivity of thesteel but sulfur decreases this sensitivity.
(b) The fatigue crack growth rate correlates with the fracture tough-ness. Phosphorus and sulfur have a small deleterious effect on the fatiguecrack growth rate of 150 ksi yield strength steel. However at the 220 ksiyield strength level, phosphorus sharply increases the fatigue crack growthrate while sulfur has virtually no effect.
(c) Phosphorus increases the tensile yield strength, the temperaturedependence of yield strength, and decreases cleavage fracture strength;these factors raise the ductile to brittle transition temperature and pro-mote the quasicleavage mode of fracture.
(d) The medium strength 4340 steel undergoes a distinct fibrositytransition, while the high strength 4340 steel does not. This is attributedto a lack of relaxation in triaxial stress state above the brittlenesstransition temperature.
5. A computer analysis undertaken to determine the individual andcollective effect of phosphorus and sulfur on the toughness of steels wassuccessfully employed to show the influence of each element and their sum.The results of computer analysis were confirmed by the subsequent systematicexperiments.
38
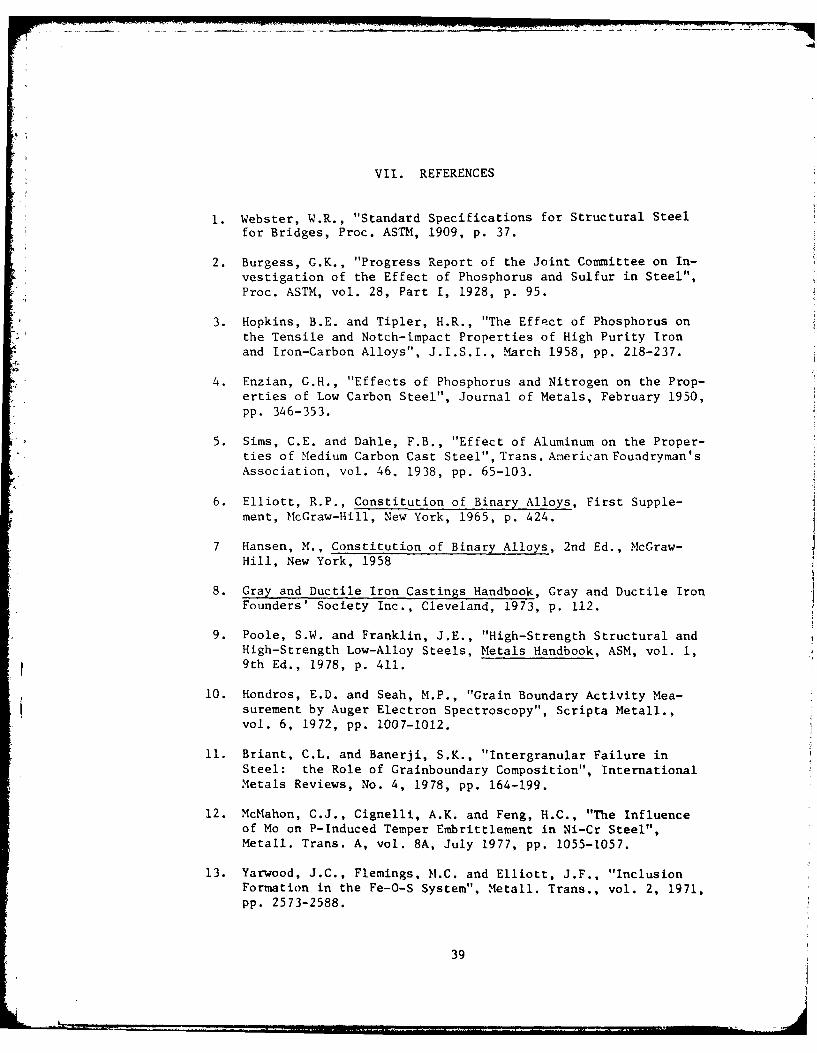
VII. REFERENCES
1. Webster, W.R., "Standard Specifications for Structural Steel
for Bridges, Proc. ASTM, 1909, p. 37.
2. Burgess, G.K., "Progress Report of the Joint Committee on In-vestigation of the Effect of Phosphorus and Sulfur in Steel",Proc. ASTM, vol. 28, Part I, 1928, p. 95.
3. Hopkins, B.E. and Tipler, H.R., "The Effect of Phosphorus onthe Tensile and Notch-impact Properties of High Purity Ironand Iron-Carbon Alloys", J.I.S.I., March 1958, pp. 218-237.
4. Enzian, G.H., "Effects of Phosphorus and Nitrogen on the Prop-erties of Low Carbon Steel", Journal of Metals, February 1950,pp. 346-353.
5. Sims, C.E. and Dahle, F.B., "Effect of Aluminum on the Proper-ties of Medium Carbon Cast Steel", Trans. American Foundryman'sAssociation, vol. 46. 1938, pp. 65-103.
6. Elliott, R.P., Constitution of Binary Alloys, First Supple-ment, McGraw-Hill, New York, 1965, p. 424.
7 Hansen, M., Constitution of Binary Alloys, 2nd Ed., McGraw-Hill, New York, 1958
8. Gray and Ductile Iron Castings Handbook, Gray and Ductile IronFounders' Society Inc., Cleveland, 1973, p. 112.
9. Poole, S.W. and Franklin, J.E., "High-Strength Structural and
High-Strength Low-Alloy Steels, Metals Handbook, ASM, vol. 1,
9th Ed., 1978, p. 411.
10. Hondros, E.D. and Seah, M.P., "Grain Boundary Activity Mea-surement by Auger Electron Spectroscopy", Scripta Metall.,vol. 6, 1972, pp. 1007-1012.
11. Briant, C.L. and Banerji, S.K., "Intergranular Failure inSteel: the Role of Grainboundary Composition", InternationalMetals Reviews, No. 4, 1978, pp. 164-199.
12. McMahon, C.J., Cignelli, A.K. and Feng, H.C., "The Influenceof Mo on P-Induced Temper Embrittlement in Ni-Cr Steel",Metall. Trans. A, vol. 8A, July 1977, pp. 1055-1057.
13. Yarwood, J.C., Flemings, M.C. and Elliott, J.F., "InclusionFormation in the Fe-O-S System", Metall. Trans., vol. 2, 1971,pp. 2573-2588.
39

14. Flemings, M.C., Solidification Processing, McGraw-Hill Book
Company, Inc., New York, 1974.
15. Brown, L.M. and Ham, R.K., "Dislocation- Particle Interac-
tions", Ed. by Kelley, A. and Nicholson, R.B., Strengthening
Methods in Crystals, 1971.
16. Tetelman, A.S. and McEvily, A.J., Fracture of Structural
Materials, John Wiley & Sons, Inc., New York, 1967.
17. Wrights, J.A. and Quarrell, A.G., "The Effect of ChemicalComposition on the Occurrence of Intergranular Fracture inSteel Castings Containing Aluminum and Nitrogeti", ... l.,vol. 200, April 1962, pp. 299-307.
18. Jackson, W.J., "QT 35 Cast Steels", Iron and Steel, vol. 44,April 1971, pp. 115-123.
19. Gill, G.M. Sweeney, B. and Bradshaw, J., "Factor Affectingthe Properties of Cast 13% Cr Steels", British Foundryman,vol. 59, November 1966, pp. 463-473.
20. Hodge, J.M., Frazier, R.H. and Boulger, F.W., "The Effects
of Sulfur on the Notch Toughness of Heat Treated Steels",Trans. AIME, vol. 215, October 1959, pp. 745-753.
21. Zotos, J., "Cast Low Alloy Steels Ductility and Toughness",Trans. AFS, vol. 67, 1959, pp. 698-704.
22. Breznyak, E. and Wallace, J.F., "The Effect of Sulfur andPhosphorus on the Dynamic Properties of Cast Steels", Steel
Founders' Society Research Report No. 71, October 1968.
23. Dutcher, D., Byers, D. and Wieser, P., "The Nil DuctilityTransition Temperature of Cast Steels", SFSA Report No.75, August 1971.
24. Sigala, P.C., "The Influence of Chemical Composition and HeatTreatment on the Toughness of Cast Railroad Component Steel",
Master Thesis, Case Western Reserve University, Cleveland,1977.
25. Larson, H.R. and Herlihy, F.B., "Development of Low AlloySteel Compositions Suitable for High Strength Steel Castings",Trans. AFS, vol. 67, 1959, pp. 718-731.
26. Birkle, A.J., Wei, R.P. and Pellissier, C.E., "Analysis ofPlane-Strain Fracture in a Series of 0.45C-Ni-Cr-Mo Steelswith Different Sulfur Contents", Trans. ASM, vol. 59, 1966,pp. 981-990.
40

27. Kula, E.B. and Anctil, A.A., "Tempered Martensite Embrittle-
ment and Fracture Toughness in SAE 4340 Steel", Journal of
Materials, vol. 4, December 1969, pp. 817-841.
28. Groves, M.T. and Wallace, J.F., "Plane Strain FractureToughness of Cast Steel", Journal of Steel Castings Research,
No. 74, March 1976, pp. 1-15.
29. Mickelson, C.G., "How Do Sulfur and Phosphorus Affect CastSteel?", Metal Progress, January 1964, pp. 84-86.
30. Wullaert, R.A., "Applications of the Instrumented Charpy Im-pact Test", ASTM STP 466, ASTM, 1970, pp. 148-164.
31. Griffith, A.A., "The Phenomena of Rupture and Flaw in Solids",Trans. Royal Society of London, A-221, 1920.
32. Inglis, C.E., "Stresses in a Plate Due to the Presence ofCracks and Sharp Corners", Proc. Institute of Naval Archi-tects, 1913.
33. Irwin, G.R., "Fracture Dynamics", in Fracturing of Metals,ASM. Cleveland, 1948.
34. Orowan, E., "Fracture Strength of Solids", in Report onProgress in Physics, vol. 12, Physical Society of London,1949.
35. Irwin, G.R., "Analysis of Stresses and Strains Near the Endof a Crack Traversing a Plate", Trans. ASME, J. of AppliedMechanics, vol. 24, 1957.
36. Westergaard, H.M., "Bearing Pressures and Cracks", Trans.ASME, J. of Applied Mechanics, 1939.
37. Stephens, R.I., "Linear Elastic Fracture Mechanics and ItsApplication to Fatigue", SAE Paper No. 740220, 1974.
38. Wells, A.A., "Unstable Crack Propagation in Metals-Cleavageand Fast Fracture", Proc. of the Crack Propagation Symposium,
The College of Aeronautics, Cranfield, England, 1961, pp.210-230.
39. Robinson, J.N. and Tetelman, A.S., in Fracture Toughness andSlow-Stable Cracking, ASTM STP 559, ASTM, 1974.
40. Shabbits, W.O., Pryle, W.H. and Wessel, E.T., "Heavy SectionFracture Toughness Properties of A533 Grade B Class 1 SteelPlate and Submerged Arc Weldment", HSSTP-TR-6, 1969.
41
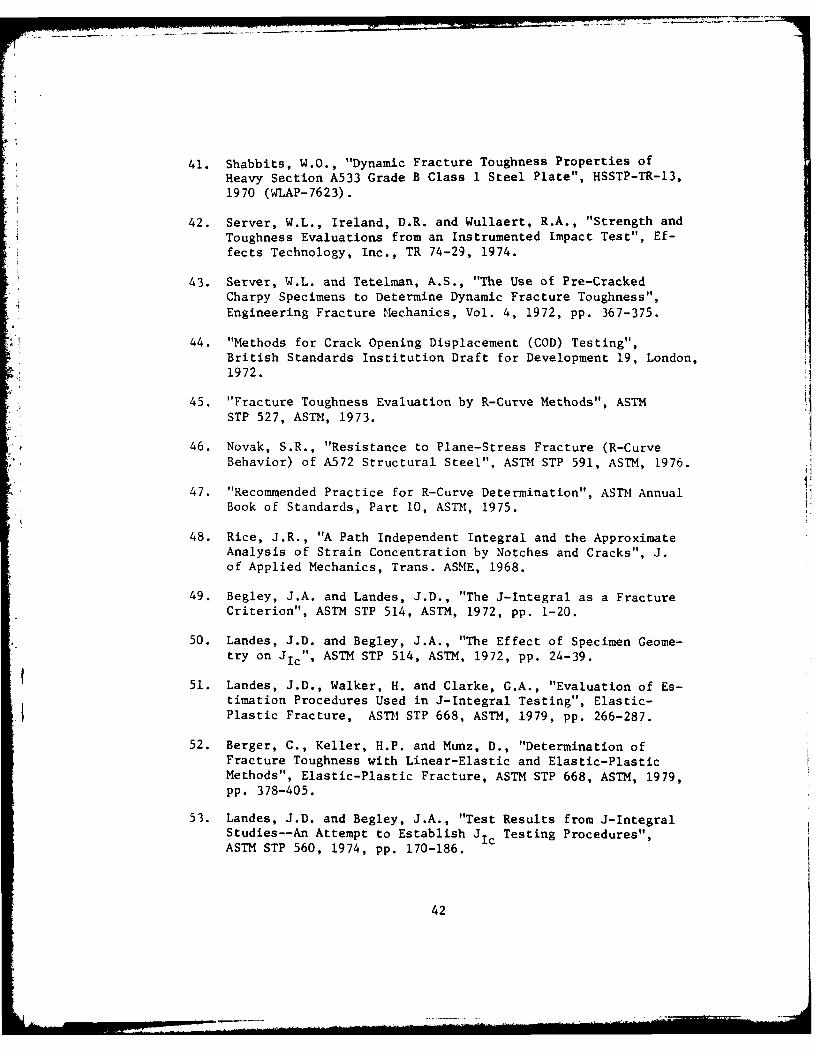
41. Shabbits, W.O., "Dynamic Fracture Toughness Properties of
Heavy Section A533 Grade B Class 1 Steel Plate", HSSTP-TR-13,
1970 (WLAP-7623).
42. Server, W.L., Ireland, D.R. and Wullaert, R.A., "Strength and
Toughness Evaluations from an Instrumented Impact Test", Ef-fects Technology, Inc., TR 74-29, 1974.
43. Server, W.L. and Tetelman, A.S., "The Use of Pre-CrackedCharpy Specimens to Determine Dynamic Fracture Toughness",Engineering Fracture Mechanics, Vol. 4, 1972, pp. 367-375.
44. "Methods for Crack Opening Displacement (COD) Testing",British Standards Institution Draft for Development 19, London,1972.
45. "Fracture Toughness Evaluation by R-Curve Methods", ASTMSTP 527, ASTM, 1973.
46. Novak, S.R., "Resistance to Plane-Stress Fracture (R-CurveBehavior) of A572 Structural Steel", ASTM STP 591, ASTM, 1976.
47. "Recommended Practice for R-Curve Determination", ASTM AnnualBook of Standards, Part 10, ASTM, 1975.
48. Rice, J.R., "A Path Independent Integral and the ApproximateAnalysis of Strain Concentration by Notches and Cracks", J.of Applied Mechanics, Trans. ASME, 1968.
49. Begley, J.A. and Landes, J.D., "The J-Integral as a FractureCriterion", ASTM STP 514, ASTM, 1972, pp. 1-20.
50. Landes, J.D. and Begley, J.A., "The Effect of Specimen Geome-try on JIc"' ASTM STP 514, ASTM, 1972, pp. 24-39.
51. Landes, J.D., Walker, H. and Clarke, G.A., "Evaluation of Es-timation Procedures Used in J-Integral Testing", Elastic-$ Plastic Fracture, ASTM STP 668, ASTM, 1979, pp. 266-287.
52. Berger, C., Keller, H.P. and Munz, D., "Determination ofFracture Toughness with Linear-Elastic and Elastic-PlasticMethods", Elastic-Plastic Fracture, ASTM STP 668, ASTM, 1979,pp. 378-405.
53. Landes, J.D. and Begley, J.A., "Test Results from J-IntegralStudies--An Attempt to Establish JIc Testing Procedures",ASTM STP 560, 1974, pp. 170-186.
42

54. Paranjpe, S.A. and Banerjee, S., "Interrelation of Crack
Opening Displacement and J-Integral", Engineering Fracture
Mechanics, Vol. 11, 1979, pp. 43-53.
55. Witt, F.J., "Equivalent Energy Procedures for Predicting
Gross Plastic Fracture", Fourth National Symposium on Fracture
Mechanics, Carnegie Mellon University, August 1970.
56. Witt, F.J. and Mager, T.R., "A Procedure for Determining
Bounding Values on Fracture Toughness, Klc at Any Tempera-
ture", Fifth National Symposium on Fracture Mechanics,
University of Illinois, September 1971.
57. Ezekiel, M. and Fox, K.A., Methods of Correlation and Regres-sion Analysis, Linear and Currilinear, 3rd Ed., John Wiley &
Sons, Inc., New York, 1959.
58. Kerlinger, F.N. and Pedhazur, E.J., Multiple Regression in
Behavioral Research, Holt, Rinehart and Winston, Inc., 1973.
59. Yamane, T., Statistics--An Introductory Analysis, Harper &Row Company, 1964.
60. Nie, N.H., Bent, D.H., and Hull, C.H., Statistical Package
for the Social Sciences, 2nd Ed., McGraw-Hill Book Co., Inc.,1975.
61. Ireland, D.R. and Server, W.L., Utilization of Dynatup Velo-cometer, Effects Technology, Inc., TR72-16, 1972.
62. Dynatup Technical Literature, Effects, Technology, Inc.,
Bulletin D102, 1980.
63. Operator's Manual, Automated Materials Test System, No.
914.80, MTS System Corp., Minneapolis, Minnesota.
64. JIS Hand Book--Ferrous Materials and Metallurgy, Japanese
Standards Association, 1974, Tokyo, Japan.
65. Imhof, E.J. and Barsom, J.M., "Fatigue and Corrosion Fatigue
Crack Growth of 4340 Steel at Various Yield Strength", ASTMSTP 536, ASTM, 1973, pp. 182-205.
66. Bertolo, R.B., Fracture Toughness of Aluminum Die CastingDie Steels, Ph.D. Thesis, Case Western Reserve University,Cleveland, 1976.
43

67. Clausing, D.P., "Effect of Plastic Strain State on Ductility
and Toughness", International Journal of Fracture Mechanics,
Vol. 6, No. 1, 1970.
68. Wilshaw, T.R., "The Deformation and Fracture of Mild SteelCharpy Specimens", SU-DMS Report No. 66-6, Stanford UniversityJanuary 1966.
69. Briggs, C.W., Ed., Steel Castings Handbook, 4th Ed., Steel
Founders Society of America, 1974, pp. 419-421.
44

I>n
C14
n 0 0. Lm14
z zj
-~ 0 cn
C4 0 rz C1. I I I I I I I i I I ,* *
* 4.1 11 11 'n III inf r
0 0-
E- 4c 0
NN
0 E- 0
N r. t
0-4 0 - 0 4
E-S-
0 L : C E-0EE-
0 Eni 0n
0 0
C C;c/c C ;( C; C ;C
"a ~ " m -I awN T n1. 0 J O nO n OC4r 0 0
z CA ~ CL.0 = C ( C ; C C0-cno
u a CU CCC U ,0
N4 N4 -4C4
II I I I II I I I I I-4~ J L t L - K-r * %U mL
45
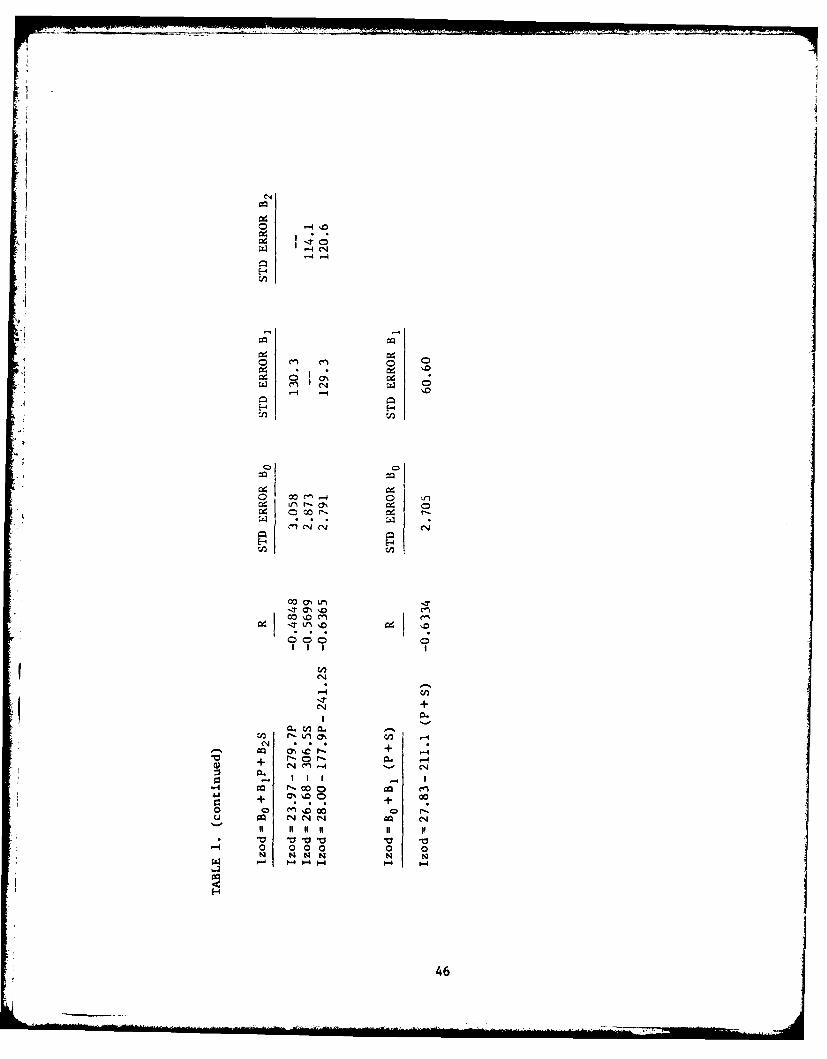
04I
-4 -1
E-
.4)
'-4 m -4'.
ce U- -(% 004 C) oo - Cd r
000 00 I M
C'4
a.
Q) e NN ) - C4
+ + OQ m. -D0040 r
on ~ ~ C1 C400 C
-4 0 0 00 0 0N N NN N
46

0
Ar
0 -
Hn ZI -4 -4
I-. 0
W- 0 1 -
0 C)0 0 0
H z
L0m0 00 - c7(- 0 (O
I H-44-
01K0 LW0
>. W- - 4- -4 04 u4C1
z H43 C-) Lr'4 ' 0
H~~ 1--1 0 0 00 0 04
Ln 0H 00 %0 cn CO
I? Zl . A *
4-4 4
rzu U, + u
C, *~ 47

04 r~ -4
E-4 -.
4.J -4
>z4U 0n
W:~ 0z 0
u 0
*E- 4 L
* 0 -~C ~ciz C1 ITI)N L r-1 D0
I cn> . I 0Cl r o 0
0 LJ-)
-lr 00 1eC4--..4 00. c
Z3 C'4 000000000 -
0 1-4-4<E-
-0 N 0 im 40% '-D 14 en 00 n- F-D r-4 00 0 r400000- 0 0 as
0 E 00 0 000 000 0
o z
oo 0
Co :D 92 0cn 00 +
w-a N 7 + I'D.-ad '.0 m .r, Co '0
40 Ui Lt4 .D 0 ITgs o CN4 'T LM o tn.
> >2 > >~E-4 ) U L
48

:4 C14 CY
00
0 l-4 co c4 0Lf) fL 00IJn
0.. 04 0* '01 L<- i r , r - ' D - %D c n0C I 0;
on co 04
000 -0
0. cc . . * 4 O C)
to OD LtOO
0 0 -4 cou Cc14 %0 00 0
000
0 0 0 C
a, Lflff C4 M~ 4
CD 0o cc acc0 )0. 00 00 O.4 (n
00000
0) 0 0.00.4 It I
-- 4 1-04 ClO 0-
0000) 14100 WN -.00 U0 00 I +
+ +
M.- + Q 4 - on 0. Cr
0-4 6-4
49I I I I I

c'J
E-
:4 0 0
o t' 000
w C%4 10 10 0 00
cn C
0r 0
C) 00 0
c.'J +
0. cn P.
44 c - af +4
+ + 0
-4 9-4 -*-% -9
- I I + 50

ON
* H < 0C'.o cn .
tn Ln- - 10c
z 4
H I 0
w W - -41 0E O 0 z Lt) 00
z 0 E-4 E-
r. I. 0n0 p 4
~ e.m -4 00- - rZ. 'T O 4 ~N
"a . W .-0 -4 %D-CWf w- 00 0 0S 0 C H; CO d , 1 nI
tn o
H E-4 ~ -
0 cn +Hl Un -4UI N -4 Mp n l' M
Ci . V 00 -D 000 000
w 0 H- Ow C. i -
0~~0 Lr-NcVO4S cc -4.
*b 00 -4 9 0
co H4 C4 -4 co t14
0 0 0 -
51- if
I A ? L I 0

E-44
~~~o -4 -. 0 0
E-4 N
0 0 m' 00 W
-4-
0V 0 0
+ 041 1r. 126 -4C~
-
JJ + N J~ 052

|I
0 0
~I N C'
o
- uo 0
0n 00o00
o I
- -4
E -4 ,..-4
= , , 000000
H J O N iO n
0 E4 ~'~0 -0
En N I -5
0 ON m ..
' -4 . ... i.0 E-0
u + -4 0 4
.Cq 0
'0
H u H
53 r
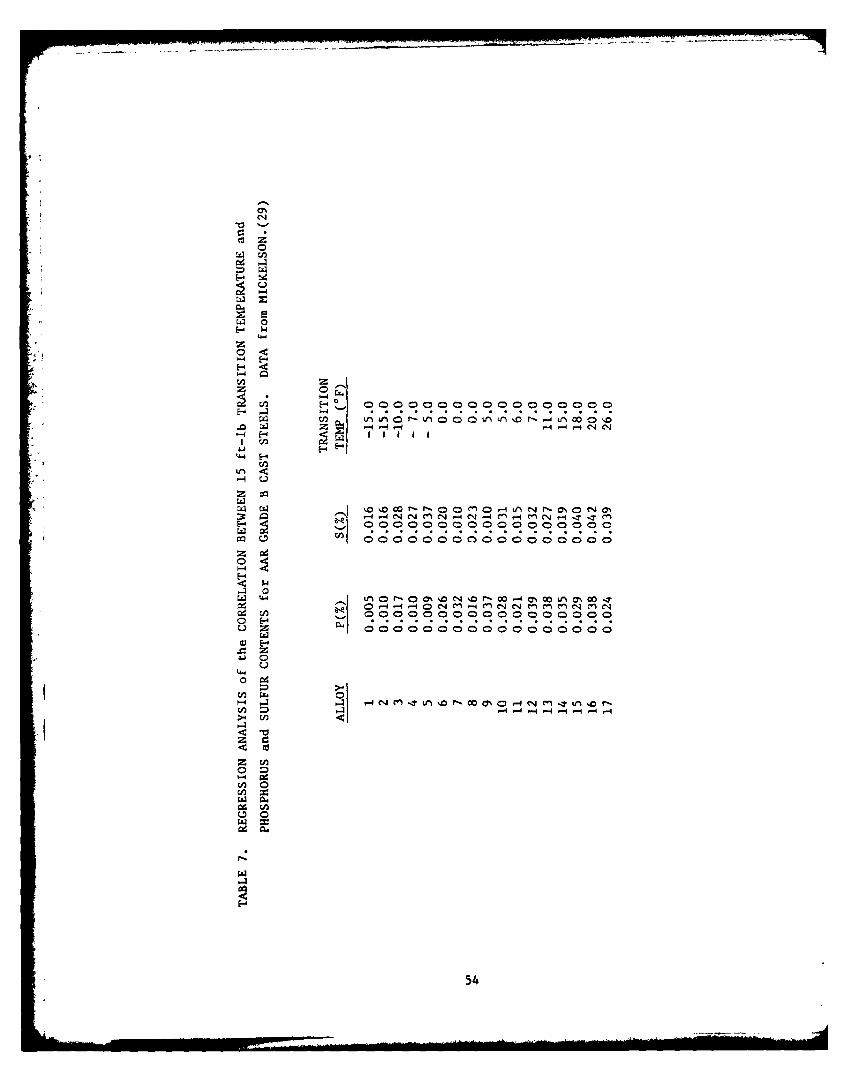
0%'C*4
ul0
-4w
W
-4-
E-E-,tm-4 E-
z co
%D 000r f-0 C 0)000A00000ONo0N0Y-4 Z -4 4 .-4 C, - 4 -4M 4 lC4 q ? i T n
z Pd
A 0
U,0 .q-I4 -4 0 N c 4 C14 (N m. m C14 m
0 E-
W
.z W
4h 0
454

cn
-4 1 ,-
-E -
as a0- 4 L
r
%0 C'4 0 T-
r-l 00 %0 1 0~-4 m% enI
o T 00 00
C;
0%+
$ CNI -4* ~ *-- U, I0
+ +4 + ++
"acc * *c
- N + N0CDI I
55

0
oA 0
-40 0 0
00
-44
06 e0
-~-10
L) M
0 &j CAL'j0 ~ 0 -4 -A -t 1w r- m. 0 0 0 C
0) 0 4 0 A 0 a~
000
1-4 -4 #W
cnc
C56

-. 4 Cfl ' ) 00 o r- m C-4 en '. LIn 0 n 'D .0 cn C,4
Lfb I- Ln 0 4 -.7 m0 m. 0 . ~~ '
- 0 0P -00 '.D c r- r- '.0 r- 00 0 D L D %
m% .4 -4 C14 '. 0 0 '.0 0 Ir' e'J cn LIj r-4 -4 r-4 C'.lTn '.7 LI' LnU' e M ~ c'4 'T cJ e4 - 1 -
-I 9
04
zE-
01 0%Y 0% M C m% ON 00 00 00 m% 0 %c! C C"! C"! c! C! C C I c C l i C'4 c"4 c
0
-Z
00 0 c 00 C1 0 a, z~ eq 00 % , .r .0 '0
in C-4 .4 -a m m 4 4 - - 4 -
co0% 0% Go~~ .0 0, co 00 0 r ,Hn e n C1 e n e n C1 m cl m e
0~~~ ~~~~~~ A.- - % ~ - ~ ~ . ' -
57

TABLE 10. EFFECT of SULFUR CONTENT on the VOLUME FRACTION (V%)
of NON-METALLIC INCLUSIONS.
OXIDE PLUS TOTALSULFIDE MICROPOROSITY INCLUSION
CASTING S (wt. %) (V%) (V%) (V%)
A 0.049 0.29 0.42 0.71
B 0.051 0.31 0.22 0.53
C 0.051 0.32 0.37 0.69
D 0.052 0.34 0.23 0.57
E 0.036 0.18 0.29 0.47
F 0.038 0.24 0.21 0.45
G 0.036 0.20 0.25 0.55
H 0.040 0.20 0.30 0.50
I 0.027 0.13 0.21 0.34
J 0.022 0.13 0.27 0.40
K 0.023 0.15 0.17 0.32
L 0.025 0.14 0.23 0.37
M 0.011 0.07 0.20 0.27
N 0.011 0.06 0.22 0.28
0 0.011 0.06 0.26 0.32
P 0.012 0.08 0.17 0.25
58

Qj 'o0 -r 'm~ m' r. 'D ~ ~ 0~-4 -4 -4 -4 -4 4 14 m 'J N 4 4 4 N r4-4
-4-4-4 -4 -4
0 4 0CD -40C4 -. 7r- - Lf '0 r-4 Cn T'. t-
-~ C~ ~-C14 -.7 fl r- 00 ON C, 'o -4 -n 'T-4 LrI
L14 U') Lt% dLn Ur4 Lf L11. 11i Lf) Ln Ln V 'D U.) Lf) .)
E- 0 - 1~ C'A . C* m o o '0 z0' 'D r- 00 %0 CN 114
01 -T O r O n 0 T ' ' Lt4 Li) 'T vi :r '0 (N- - 1-4 -4 ,-4 -4 . 1 4 -4 r- -q r-4 r -1 140-4 0
4
0
In nC l l
z
'-4 z-4 -
1-4
59
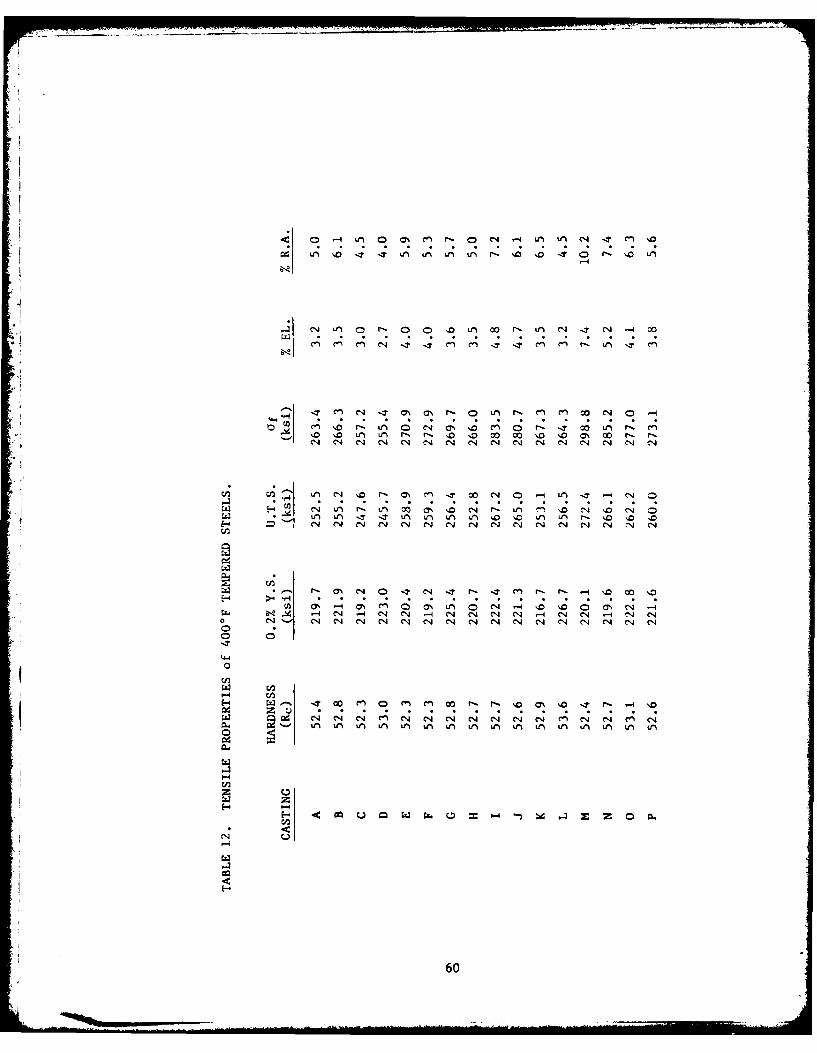
en m -4 4 -It 0 m' m~ m- 0- LM -4 L cn
6. ED m O ID~ r- L4 a f~ ON LD W- IT wC Ln 0 - 'cn
N o 0- r- o 00 'C NO' CON I'0 r-, N N
CN " N N CN CN N CN Nq C4 N N CN N N4
tO Lfn N 'C N. -n 'T 00 CO 0 -4 Lt -T (- , N O
~~qU NL4~ rN L4 ~ gOa 'N LF4 2 CN CN* Ltn Ln4 '' '-T Lr) Ld) U-$ ULi 'D No LF4 V) N. 'C 'E- CV " Ng N- NI N N N N N NI N CN N CN
C-4P, 3 CbN. Nd - N .-4 N4 N -I N4 N4 C N .-4 N1 N Nf N1 -
0 N'' N N N4 N CN N4 N N4 N N4 N CN N1 N- N N0
0
w- -g C4 C4 0 C; V4 C; N V .C4 a' 4C - 4' -4.......................................................................... ......................
Nn ' N N N N 4 N N 0 N.
WI j U f4 U 1i U t4 U ~ L~U
-60

14 0- 4 1-0 C4 -4 r4 0 n m~0~ I, N t
- n CW e jr a 0n %DO No ON '0 r~ 00.-4 .- 4 .- 4 -4 N CN -4 C-4 C' C4 C V4 Cn% M~ "~ 0
-4 'o o Lf) r- 00 -4 0% 0 14 11r .0 '0 0
N -4 -4 14 4 N N 4 N4 c' C NJ c, n C -I CI4
Old, ID It O N CDr-r T 0 I -4 -l en I. 0 ICA~~ N- -Nrf C -4 C1 Nq N - C q
E- L 9 C
N- en0 W N OM r- m ~ Ln m- a%% m.- 4 -4 -4 -- 4 -4 N- N .4 (-4C'
w 4 N. -4 - VIN cn -4 W Nn LA -
-4 4
.0.
P-444- -
E-
61

-L-
0 r 1 14. t- 0 Lf 14 N -4 1- N% ~ -
00 0 r - ,D 'i o -n 1 a - 4 00 0r 0 Lr 'O~I- - 4 - -4 -4 -4 -4 .- 4 r-4 -
-- 4
0E-4
-4 c!-
0
0
0 " ~-T C. 0 0 0~c 0 en C4 .-4 Le N 0 0 L 0
00
-4 ' i
.4 000
62

C4 -4 --4 -4 --4 -4 -4 -4 -4 A4 -4 -4 -1 4 - 4 -
H
~~~I~~ 0 0 0 0 0 0 0 0 0-4c 0 0 0 0 0 0 0 0 0 0 0 0 0 0 0
>I A4 -4 -4 -1- ~ 4 - -
a.
0
~000000000000000 0* 1 -4 ~ - - -4 -4 -4 4 4 -4 -4 --4 -.4 -
O0 0 0 0 0 0000o000o0 00 0
-4T -4- 4 - 4 - -4 - 4 - 4 -
U - 0 OOVO~oooOoO~ocoo
-0
0
-4L) " 4 n-
ooi0
c"J~~ ~ I/~t 4 ~ ~ -4 Ln N' .- 4 -M M -4 N-
01
ale
cc
63

L4 r LM - -4 wO -4 cn C14 -I 0 a.0000 Na '.Z E -r. ,e -40 a i Ln e-40ON Lf) Cn 0 r- '0 -IT ON C0
3 *0 -.4 -4 r-4 -4 "4 -4 -4 r-4 -4 '-4 -4 -4
U>4
u E-
ELI
0 -4 4 -1 -4 -4 -4 -
tf))
0
E--
u C)
o o 'D' ; ; (:
-~ -4
0 a:
C.) -- w C- -4
0 -44
Z i -4 -4 .- 4 -4 N N C C~C C-4
0~'0 Xr4 z' '.- 0 0 'C CJ'0I
0.64

-4-4 -4 -4
1 -- 4
-4-4 -4 -4
c! 0 0 L0I ~ C C ' C u c - -
-4 -4 14
\Z Ln IT Cl) - IT In m -4 00 L
0
4 1 C C a r Il C4 C4 I"............................. .........................................................
W r ~ ~ . ~ L ~ c O -* -
z
CA
H6

0! r - -4 -4 r- 4 -4 -4~ -) C 14 ~ -~
cw
0Lt4 Q0 Q .4 0 L1 N 0 % O
0..0
V l 0 00 N 0 C 4~ N .
1i 0 C0 0000 0--4 r-4 0 0-0 NO
00
C-'-1-
CC
00E4 0 0 0 0 0 0
H6

0 L~ 0 0 un 0 00 Lfl 0 0 00 LA" LnCD --T ~ - 0 Lf)4 4 "o -'T -T -T
cn a% w- 4-4w C- 4 L - , O
00 Lr)
- u M
a.j
Lti r
0 wC4 0
00
0 4.4
670

A
TABLE 20. PLANE STRAIN FRACTURE TOUGHNESS of 1100°F TEMPERED 4340
CAST STEEL.
K 2
2.5( "?)cy KCASTING a/W PQ (ibs) (in) (ksivin)
A 0.530 12,875 1.08 97.0
B 0.520 12,365 0.91 90.0
C 0.519 11,400 0.77 82.7
D 0.523 11,200 0.75 82.5
E 0.516 15,250 1.38 109.5
F 0.524 14,375 1.32 105.9
G 0.516 14,000 1.12 100.5
H 0.528 12,870 1.06 96.1
1 0.523 17,200 1.88 126.2
J 0.520 16,300 1.66 118.6
K 0.522 15,450 1.37 113.1
L 0.523 15,130 1.32 111.1
M 0.520 17,750 1.99 129.2
N 0.521 17,950 2.00 131.0
0 0.524 16,200 1.56 119.4
P 0.522 15,625 1.46 114.4
68
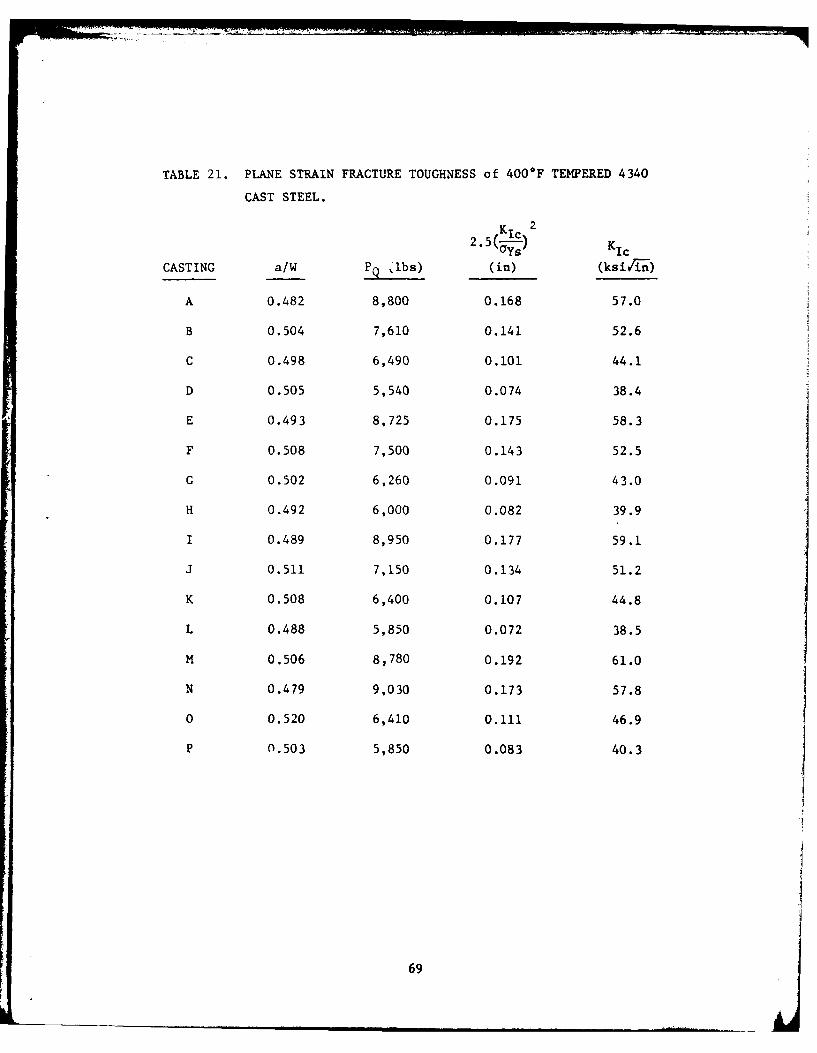
TABLE 21. PLANE STRAIN FRACTURE TOUGHNESS of 40*F TEMPERED 4340
CAST STEEL.
K Ic 2 A
CASTING a/W PQ 'Ibs) (in) (ks i /i-7)
A 0.482 8,800 0.168 57.0
B 0.504 7,610 0.141 52.6
C 0.498 6,490 0.101 44.1
D 0.505 5,540 0.074 38.4
E 0.493 8,725 0.175 58.3
F 0.508 7,500 0.143 52.5
C 0.502 6,260 0.091 43.0
H 0.492 6,000 0.082 39.9
1 0.489 8,950 0.177 59.1
J 0.511 7,150 0.134 51.2
K 0.508 6,400 0.107 44.8
L 0.488 5,850 0.072 38.5
M 0.506 8,780 0.192 61.0
N 0.479 9,030 0.173 57.8
0 0.520 6,410 0.111 46.9
P 0.503 5,850 0.083 40.3
69
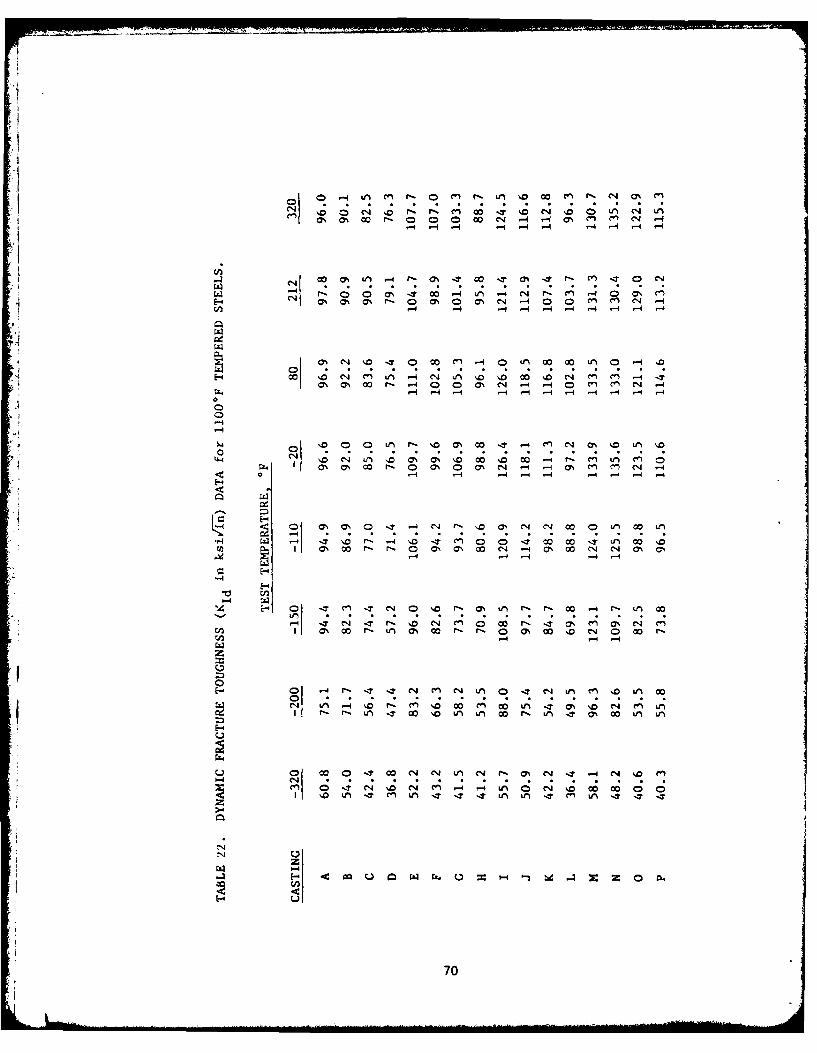
*11o ~ ~ ~ ~ 1- -4 r-4 04 4~t' . ~ c O
E- C14 % ON M r- 00a0 CS " -4 -I 0 Cl Cn N -4CAI 4- -4 -4 -4 4 -4 -i r-4 -4
aN M CO % L r- 14 0 0 0% C4 -I -1 - M~ M "O -
-4-
C- rD 000mo % M~ %0 00 %0i - r, en '-00 MCc 0% 0 - 00% 00% ~" - --0 I I N '-I
Cfi -I -4 -4 4 -4 .- - -4
-'.0 (NI -~LP4 %0 -.T M 0 '0 - .? W M ~ : -1 n Ww% r" r - a~ 000 M ~ w0 "- 1-4 a% w-14 m
-4 ~4 - 4 -4 1-
-4-
u 4 '0 04 0 Lf m- '0 00 en 00 .-4 IT 0% No 0 Lrm '.0
C1 0%4C F 0 0% 00% N -l -4 0% F- Ien a IT 0 -1 - - 4 Ln (D C4 4-0 00 00 0
07
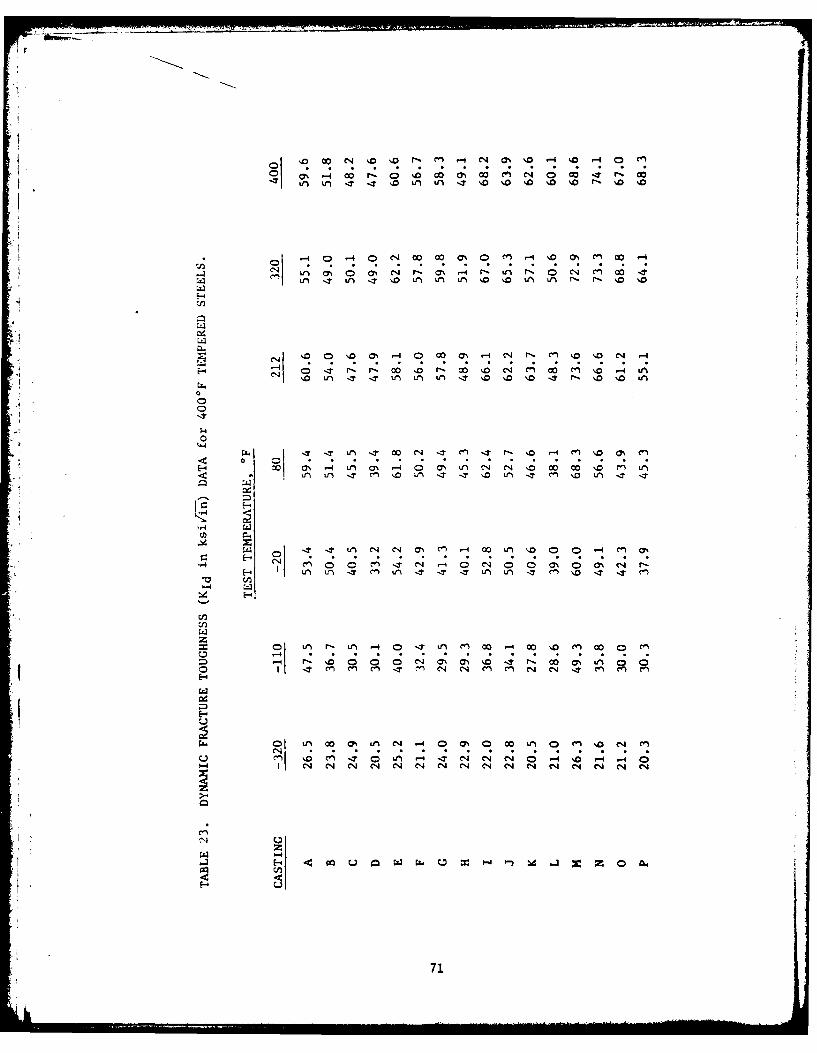
0 n tn4T0I0 c-' Ln -T %D 0 0 I %-D o %0
4 C1 L14 0% 0:% CYNC- r- CN - r- Un N.I 0 C1 en -0w n L1 'T a/ --T o Ln ul L1% '.0 '.D Vf Ln 4 r- N 0 '0
-4j 0 IT '. 0 N. r, 0 o C1 'C.e 0 .-4 Lf4C1 0 L T -T Lt Ln 1JM IT %.0 '.D '.0 'T r I'D %.D 114
4 04
0
-M -n uT -O? o C" -7 C % -o Lr - ro) .- D C4 '%T~
C.: E- 0 lC 0 9 9 C 0E-4 1 0% cn 0 % 00TN %4 c% (4 c'4 C-) ch '.0 a% c4
E- in i-) -,t L -. T 'T 'T - r) ' -.r C-) \.o L' 'T .
-- 4
:D r, %00 C('4 (ON (7N 0. 0 0%0 0% ('n N0. rT C-) C' e ' - 1* N C- 4 en ~ m C-4 '.j C
E-4 J
Z~ 0 i/14 C-. Cf4 004 C~ 4 C1 C0 C4 (' 0- C-
-~r' ' 0 0 '4% % .0-~N.~ 71,

TABLE 24. FATIGUE CRACK GROWTH RATE (10-6 in/cycle) of 1100*F
TEMPERED 4340 CAST STEEL.
STRESS INTENSITY FACTOR RANGE, AK, ksi/ii
CASTING 30 35 40 50 60
A 6.6 11.0 14.6 33.0 57.0
B 13.0
C 14.8
D 14.6
E 12.3
F 13.3
G 13.4
H 14.5
I 11.8
J 13.2
K 12.1
L 13.8
M 6.6 10.8 11.7 25.5 44.0
N 12.3
0 12.7
P 6.8 11.0 13.2 30.0 46.0
72

TABLE 25. FATIGUE CRACK GROWTH RATE (10-6 in/cycle) of 400°F
TEMPERED 4340 CAST STEEL.
STRESS INTENSITY FACTOR RANGE, AK, kbi-n
CASTING 15 20 25 30 35
A 2.1 4.7 7.6 10.6 17.0
B 5.0
C 8.0
D 9.6
E 4.7
F 4.8
G 6.8
H 9.0
1 4.4
3 4.7
K 5.6
L 7.9
M 2.3 4.2 7.4 10.4 16.5
N 4.7
0 5.9
P 2.8 7.4 10.5 22.0 37.5
73
I t . . . . ..*i i li l i n Ji l I . . . . . . . ]

TABLE 26. EFFECT of CHEMICAL COMPOSITIONS and TEST TEMPERATURE on
the NOTCH TOUGHNESS SENSITIVITY RATIO of 1100*F TEMPERED
4340 CAST STEEL.
TEST TEMPERATURE, -F
CASTING -320 -200 -150 -110 -20 80 212 320
A 0.497 0.671 0.856 0.805 0.810 0.850 0.856 0.876
B 0.578 0.711 0.812 0.865 0.800 0.886 0.775 0.844
C 0.457 0.614 0.785 0.697 0.712 0.698 0.673 0.758
D 0.570 0.493 0.578 0.584 0.722 0.618 0.712 0.767
E 0.401 0.653 0.747 0.711 0.799 0.729 0.718 0.785
F 0.379 0.632 0.640 0.698 0.737 0.682 0.761 0.895
G 0.330 0.696 0.798 0.648 0.853 0.807 0.763 0.895
H 0.451 0.543 0.841 0.700 0.883 0.755 0.733 0.692
I 0.336 0.628 0.873 0.804 0.792 0.803 0.801 0.786
J 0.409 0.492 0.790 0.842 0.835 0.834 0.830 0.832
K 0.423 0.431 0.577 0.628 0.831 0.785 0.739 0.784
L 0.637 0.515 0.780 0.890 0.813 0.800 0.783 0.884
M 0.430 0.569 0.762 0.824 0.790 0.809 0.883 0.761
N 0.345 0.443 0.712 0.827 0.815 0.843 0.867 0.882
0 0.458 0.481 0.691 0.886 0.727 0.841 0.800 0.734
P 0.323 0.439 0.683 0.727 0.739 0.824 0.790 0.739
74

TABLE 27. EFFECT of CHEMICAL COMPOSITIONS and TEST TEMPERATURE on
the NOTCH TOUGHNESS SENSITIVITY RATIO of 400*F TEMPERED
4340 CAST STEEL.
TEST TEMPERATURE, -F
* CASTING -320 -110 -20 80 212 320
A 0.344 0.541 0.584 0.628 0.583 0.770
B 0.320 0.461 0.523 0.552 0.602 0.602
C 0.349 0.442 0.522 0.550 0.439 0.762
D 0.422 0.416 0.515 0.446 0.653 0.595
E 0.265 0.382 0.538 0.587 0.476 0.555
F 0.252 0.382 0.441 0.425 0.547 0.642
G 0.289 0.384 0.348 0.484 0.538 0.589
H 0.326 0.475 0.511 0.406 0.478 0.594
I 0.275 0.271 0.341 0.407 0.463 0.623
J 0.237 0.376 0.421 0.412 0.560 0.630
K 0.266 0.345 0.404 0.422 0.602 0.556
L 0.383 0.392 0.499 0.490 0.522 0.620
M 0.418 0.365 0.446 0.521 0.569 0.603
N 0.280 0.316 0.358 0.389 0.492 0.570
0 0.370 0.442 0.392 0.404 0.477 0.516
P 0.402 0.426 0.468 0.403 0.549 0.593
75

14
C) -4C4 -4
~~~0~~ c1 N r 4 4~
E- -4 N N 4 CN N' N4
-4 4
00 ON '-p N4 0 -n C14~ ~'o C14 N4 -4 N en mN
F-4
04
I~~~ I N N N
0. CD4 - 0 a 0 0 0 00
z. Z D u)L
z- -4
z 0 0 0 0 0 00
o1 cn0
V) E40 0 0 0
~~~~C ai 0 0 C-4 0 0~ fcoe C' NO - c4 0 0 0 ~ C% . 4 e
C.)t c1 c,4 -4 -4 L~
-
co -u00 0 0 0-
0 0 0 0 ~ 0 ~ ' '.
N76 (~-
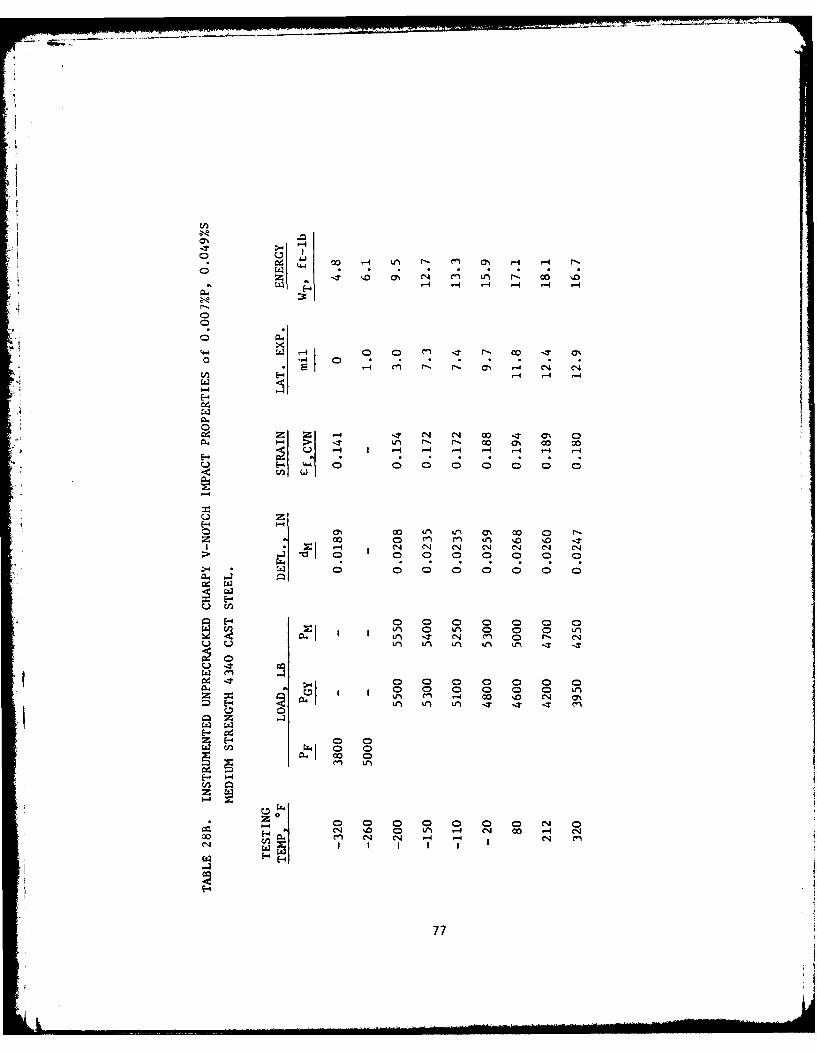
0 ,-4 Lr) r- M' 0% 1-4 ,-4 r-
-4 4-4 -4 -4 -4
0 0
1.4 C1 r r- O r-I C14 C14
1-4 -4 1 -4 -4 -4 r-4
E- - C ;4
z ~ 0o 0 0n 0n 0n 0 0 0T
I =1~ -4 CN 0 % C14 C'J C14
n 0T 04 0 0 0" 01
0 . T . 4
a. 0 0) 0D 0 0 0 0nz 0 Un1 0 0D 0 a%
E-Lri -7 n -z 0T IT cn
00 uEi-~U~u 7 -
(n
0 0
0 0 1
01 0 0 r 0 0 0 00 1-4 000 E- n 4 C14 -4 -4 ('.4 m
77

DQ -4
z
-4 -4
PL.4 C nNI 0 001- 4 1- 4
z~ o 00 CD0) r C14>1 -4 -4 C* C4 J C14 C-1
0n 0 0.~ 0~'
W -nZ4 *1 0 a C) - % 0
0. 0) 000000V)0
C.z Lf f,
Ln I- IT -I, -t I
wA w
PL. I U,~ H ~f U, - -L -
E-
H0 '-4-4cj~CA
78

7777-
-44
* 00 0 00 m
-- 4
4 'T 10 r- o c'j 1
C C
'-44
He -4 C C
0n 0 C) 0 0
C0 0 0D 0 0D
-n-4 ~0 00 rt
'.0 '0 '.0 ,ri V
0 0 -
- z 0CCl c.-I 0 0 0- 0 0
m cq
HZW
H 79
CNOU
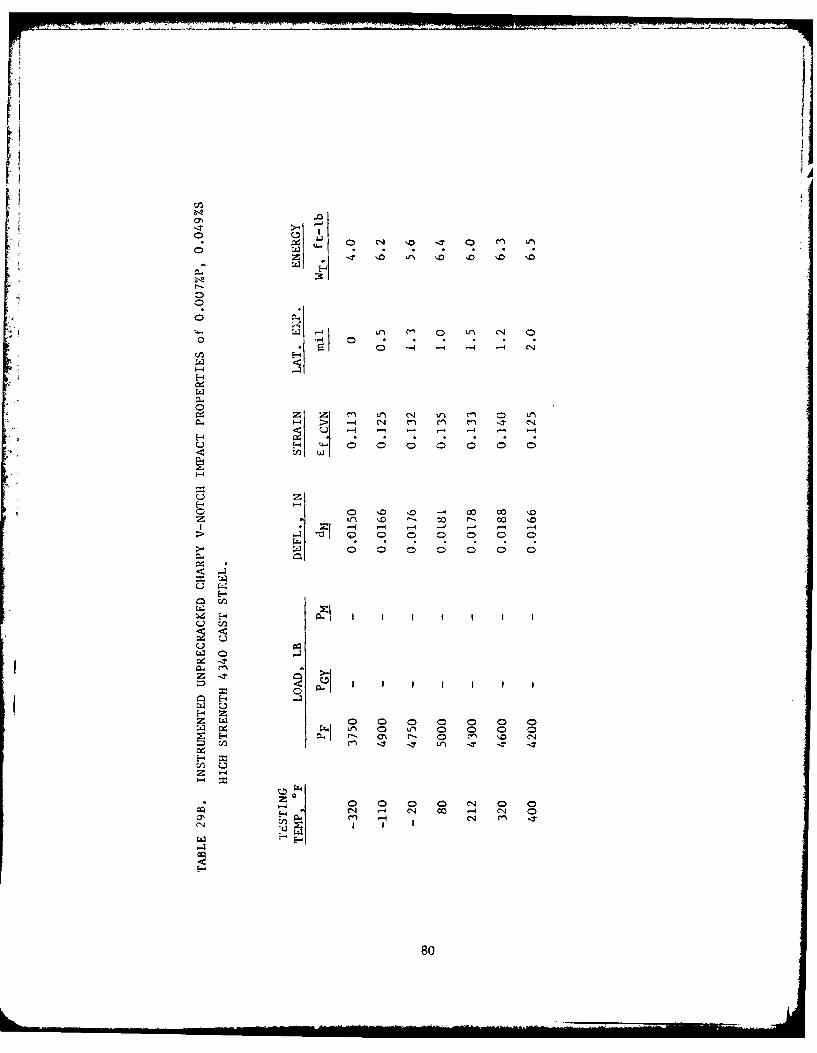
44 N
-4 4 C
Z Z ~ \O Lf (14 L .O rl CD O
00 0
H4- -q - -.10 0 00 D C
I!.Z rO0 0 0 CD C0 0 0
W WL ) ) C 0 0
HZ
z 0 0) 0 0 01 0 00-4 C1 LrN 00 - CN
Hn 'AC1
0'80
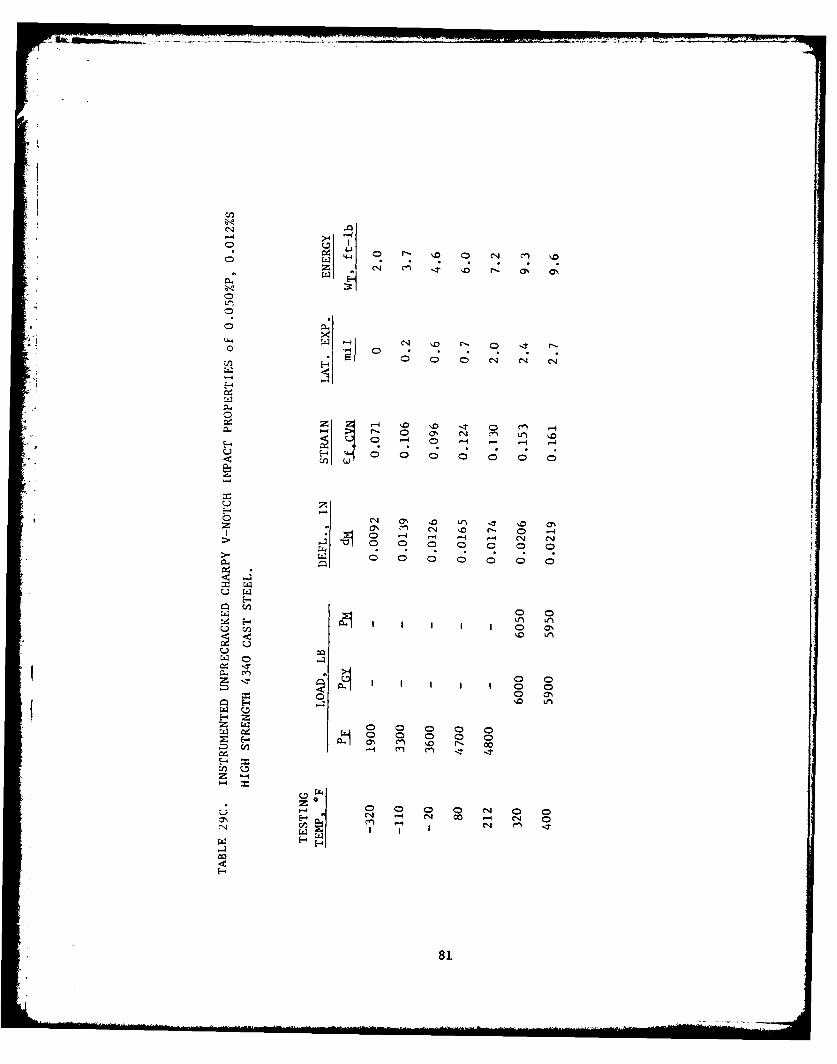
CDJ
0 IC c .
E-4
C)
z 0 0 "1 , o~ f
1 0 C -4 0 -4 -4 C14 '-4
0. .
u wE-4
W CD0 O f, ~ .Z~~~L 1 N ' fn0 -0 -4 4 - (N ON
0 0 0 0t0
5..
IZ 0 -3 o L
E- 0Z t C
0E-4z
P-4 0 0 0 C0E- -4 14 00 -
In C14 r-
-4E-4
81
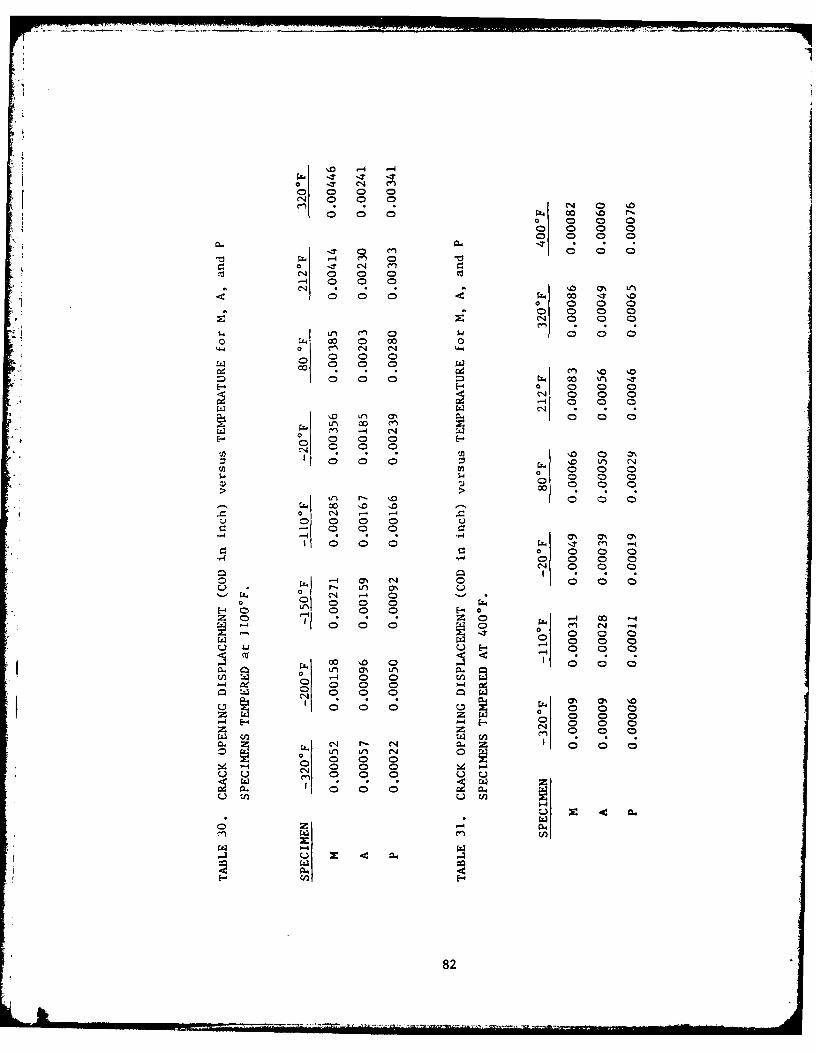
0 0 0 0
44 0 0 0000 11 c
-14 0 C0 0 0
0 0 0 00 0 0
0 0 0 0r c ~ '1 o 0l 0 0
Cd~~ 00 0d 0::D~~ 0 0 0
E- CD 00D 00
0 r 0 00 0l
0 0 0C) 0 0
-0 0 9u-n r- D 0 0 0
0) 0 0 0
0 C 0 0De
0-0 0 C) cC4 0 0 0
r- U, 0o 0 C0 0
000
00 ro CD0Ln L4CD. -4 0o CD
-4 a 0 0 0
0~~ 0D0C 0 0)z0 0 0 0
C.I.~~~ 0 04 0l 14o
0 0
4 ~ ~ CN 030 (
0 ~L)
- I 0 00E-
cc ~.o 0 0 02
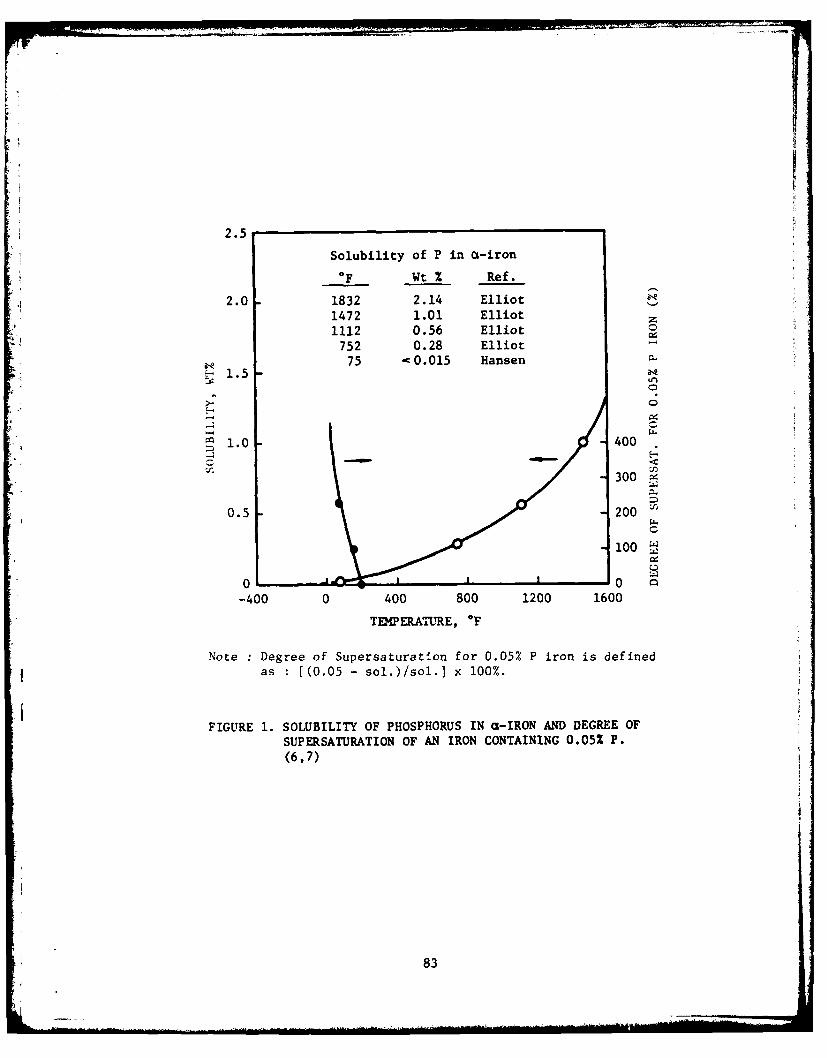
2.5
Solubility of P in (%-iron
OF Wt % Ref.
2.0 1832 2.14 Elliot1472 1.01 Elliot
1112 0.56 Elliot752 0.28 Elliot-
75 -0.015 HansenE-1.5
1.0 400
300
0.5 200
C
10 H00 o-400 0 400 800 1200 1600
TEMERA-LURE, OF
Note Degree of Supersaturation for 0.05% P iron is defined
as :[(0.05 - sol.)Isol.] x 100%.
FIGURE 1. SOLUBILITY OF PHOSPHORUS IN (%-IRON AND DEGREE OFSUPERSATURATION OF AN IRON CONTAINING 0.05% P.(6,7)
83

2420
160000
w 0
fr.4 120 s
00.
> 160a 8.40 o
u 80
STEL (19)0
00
0 62 0
z so -- - so
-100 -80 -60 -40 -20 0 20 40 60 80 100
TEMPERAtURum.C
FIGURE 3. EFFECT OF SULFUR CONTENT ON THE CHARPY V-NOTCHTRANSITION CURVE FOR A LOW CARBON 1-1/2% Ni-Cr-Mo QUENCHED AND TE24PERED STEEL. (18)
84

-N Do
0_ __ 00 oo--- 0
E-. Z -
0 0
* ~sPumfld-IOOi '2flDA Ad,o0gD
-CE- Im
z U :
854

A 0
0\O 040000F
4 ~0
0 0
-20
s- 0 0.01 0.02 0.03 0.04 0.05
P + S, WT%
FIGURE 5. VARIATION OF FRACTURE TOUGHNESS WITHSULFUR PLUS PHOSPHORUS CONTENT FOR400 AND 700*F TEMPERED 4340 WROUGHTSTEELS. (27)
86
I 4wm
km

30
26
24
22
20
S14
12
> 0
6040
2O.02 0.04 0.06 0.06 0.10 0.12 0.14
P+S (wt%)
120
0100
1 so
, 40
20-
I I I I0.02 0.04 0.06 0.0 0.10 0.12 0.14
P+ S wt %)
FIGURE 6. EFFECT OF PHOSPHORUS AND SULFUR CONTENT ON (A) CVN,
AND (B) KIc IN 4335 CAST STEEL. (28)
87

IPlastic Elastic
* PlasticN
maxa y Small notch radius P1
I Largenotch radius 0
4 (A)
DISTANCE FROM CRACK-TIP
T r
Y 1yTD D(N)
T~eERATURE
FIGURE 7. EFFECT OF NOTCH SEVERITY AND STRAIN RATE ON THE (A)PLASTIC ZONE SIZE (R), AND (B) BRITTLENESS TRANSI-TION TEMIPERATURE (T))
88
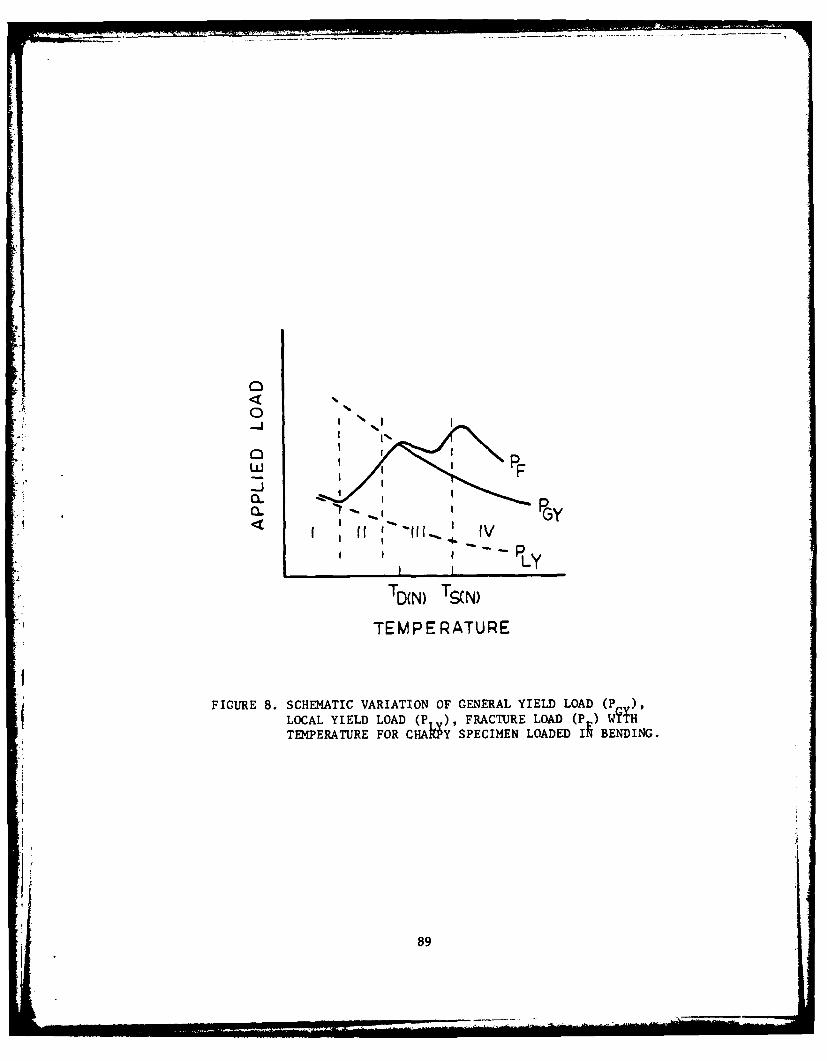
0
I , I
FLy
TD(N) TS(N)
TEMPERATURE
FIGURE 8. SCHEMATIC VARIATION OF GENERAL YIELD LOAD (P),LOCAL YIELD LOAD (P ), FRACTURE LOAD (P ) WMTEMPERATURE FOR CHA9Y SPECIMEN LOADED IN BENDING.
ii
89

iii
000
'o t
z c
cjn
~r'2n
990

CvN CVIL
N0 0.05%) P(%)
0 0.050.10
(A) (B)
CVN
RANGE OF UNOBSERVABLEERANDOM ERROR 0I B'
DEVIATION OF CHEMICAL
COMPOSITION FROM Pz S.,_ A C B --..-
INCREASING S P a S INCREASING P
(C)
FIGURE 10. SCHEATIC REPRESENTATION TO EXPLAIN THE UNREASONABLE
REGRESSION RESULT CAUSED BY INAPPROPRIATE SAMPLING:
(A) THREE DIMENSIONAL RELATIONSHIP AMONG CVN AND P,S,
(B) GRAPHICAL REPRESENTATION OF EQU. (17), AND (C) A
PLANE PERPENDICULAR TO OH AND PARALLEL TO OM IN (A).
91

~L.C
z L
0 0 0 0 00 0
00~L 0
0
92~

E-.
z
a'
I I
N N2 -
00 0 R 0
0 d d C; c C; o E
%'S-
93o

T 116-SI 307 CASE WESTERN RESERVE UNIV CLEVELAND 0O4 DEPT OF METAL-ETC F/6 11/6INDIVIDUAL. AND COMBINED EFFECTS OF SULFUR AND PH4OSPH4ORUS ON TIE--ETC (U)MAY A2 E CHANG. J F WALLACE DAAOA-79-C-0094
UNCLASSIFIED AMMRC-TR-82-33 NI.
IND

111122
lii 1.00 I:::
11111L2 111. 4
MICROCOPY RESOLUTION TEST CHART

jl
z
, .,
C..v
?11
S--4-- N
R 1 46. 0 N
- I. - -
I I III a IIp S S
O 0 e0n,0,
0j,
m Jo o ' -- o' 0 0";
Ng
oo
94. '
.4 59
.- 4
I I I I

-2
- -
cy 0
0000 0 0 .W ty0n .O0
* 0 0 0 - - -- U.
* 0
0- z00
o so
Im.
C; 0U - - N ~ 0
% 'S P-4
9.95

A "o
40.1ogo 0 0 z
Im
E- i
00
U I j-.-.
80 0 m 04
f" 0- - EnN
40 E- 44
I I I I I I I i i I
o go000
*0~~ Is-~
96f

00
02
0 00 0 g 0
§So 00 0 aq 0 e 0. 21'4
0- W
z.
Fn.
0 -
% 'S '-
97
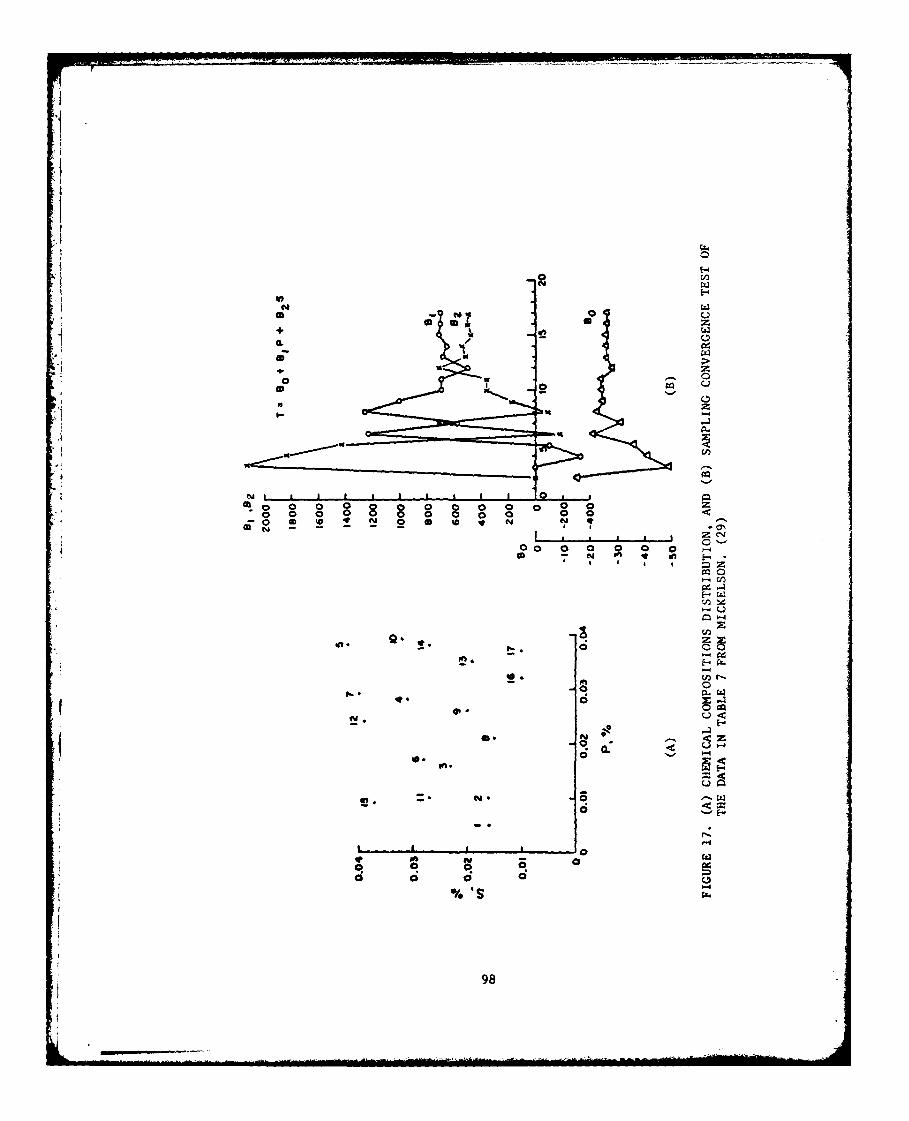
.1
0 0
a. or Q*u
9.98
* 0. ,z, n I | I 0 ,
* i I J J
00 0 0 0 0 0
0 0~
9-,. 0 0
, - €0 -: :
I I
r 98
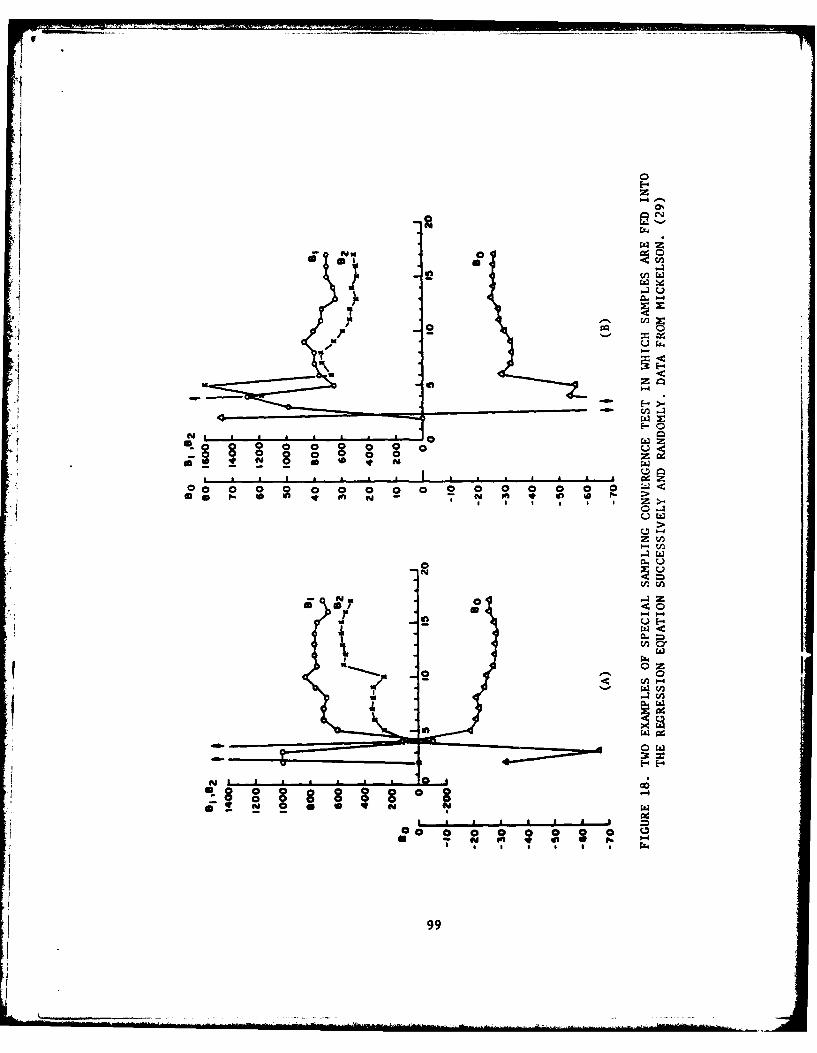
I"w0 8 0 0 0-8 00 0 8 0
14 z- C 0
0 z
W-
E-0
N 0wco o o oa
:8 ~ a 99

z
jw z
U~ u~N W
100

U-w 0
0 T 1~-459+ 746.2 P~200
~1 0 00 00
-0
0t 01 0 0 R
0 00
.7 176
n °-20 (A)
I"o 0.02 0.04 0.06Pi %
0. 30L / °
~ 20I- 0 - 0
z-I0 0
' o T -1 o.7 + 572 .7 S
Q 0
~-20to (B)
0 0.02 0.04 0.06
S,%
FIGURE 20. INDIVIDUAL EFFECT OF (A) PHOSPHORUS AND (B) SULFURCONTENT ON THE 15 FT-LB CHARPY V-NOTCH IMPACT TRAN-SITION TEMPERATURE.
101

LL0
U 3 0
1 20-0
w 100.00
LU T:26-66 + 607. 9 P P+S)
0-to 0
0 +S 0/
0-
6
L _200
< -3 0 0 J- 2.871.P45S
I- 0
D 20 R0086
w-3 0 0
0 0.2 0.4 00 0.8 .0
TE P RA U E (A)0 US N P01 + S AS A. PSAE E , N BUS N P
"-I7 A
AR M T R
10

.
LOW P, LOW S
HIGH P, LOW SLOW P. HIGH S
I-
0
0.
0TEMPERATURE
FIGURE 22. SCHEMATIC REPRESENTATION OF THE POSTULATEDRELATIVE EFFECT OF PHOSPHORUS AND SULFUR ONTHE IMPACT TRANSITION BEHAVIOR OF STEEL.
103

II~
104

U-w I-
I-L
Ia
L a
UU
zW____ E-
N0 V)__ 0 0
zzU) C
EZD-
0l L) 0
105

i|i
0.06
* t B C,
0.05 ,
H0.04 E F
0 G
Y;0.03-L
K L
0.02
M N 0 P0.00
0 II It i
0 0.01 0.02 0.03 0.04 0.05 0.06P.,%
FIGURE 25. CHEMICAL COMPOSITION DISTRIBUTION OF PHOSPHORUSAND SULFUR FOR CASTINGS FROM A TO P.
106

N. a0
en 0
-4
LLI,
* AL
'0 U4 0
0I (NI LA, 0LLALIm
Mo
LIIs
107

C1
C-1cGo0
N . -40
* C)
r-4 _4 lb.LrI*4
10 0T -
C4) 01-4 LM
1-4 -
-~EA-
N-
I I I I I
0/108
lkz

00
L14 ~C14
r- -4
C14r-. r-.04
NN 4.0D0.
N *
r- Cr- cNN (1
0. 00
co Q.- N ,
0 0
000
00 0
.04oc
ON -74 ooco 0. 4.0
-4 , 4 0.
00 0
-0D 0 0.
00 C0
og10 LA C1
0~ 0CN
109
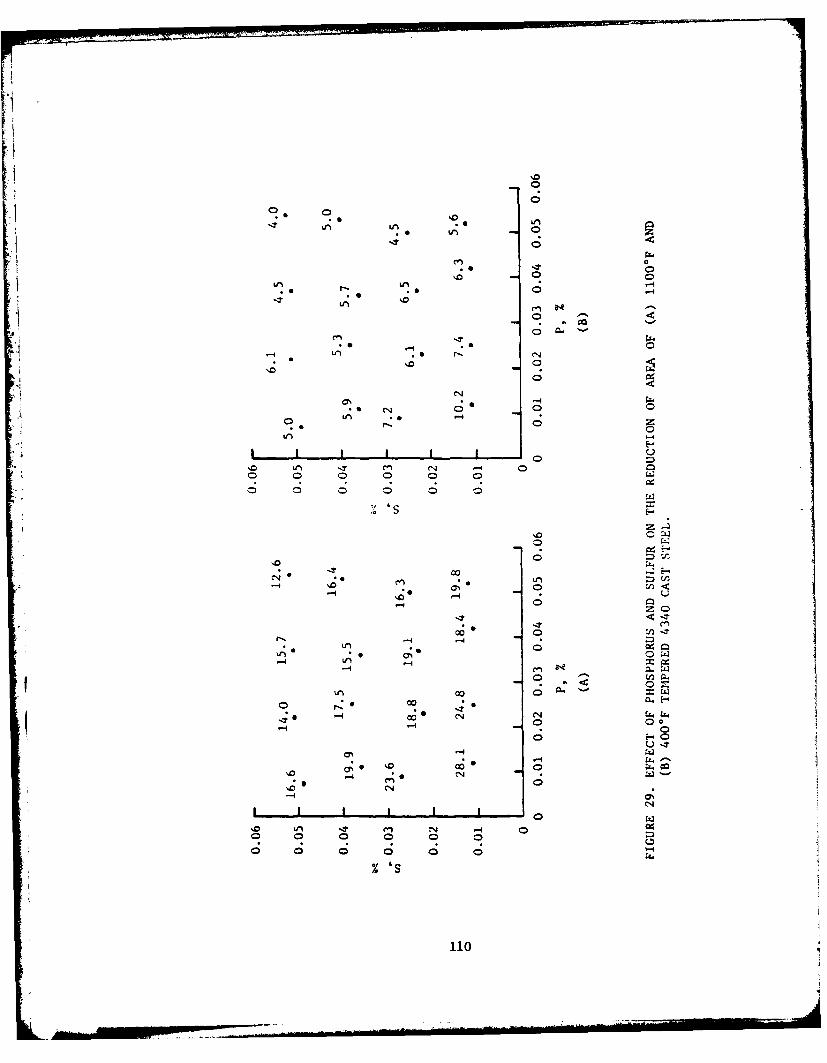
-40L L14
CN 0
0
0
'0 0
.0 . 0 -.)
-~ 0 0
-q-
-4 C-4
0 Ln IT 0
74s
'11
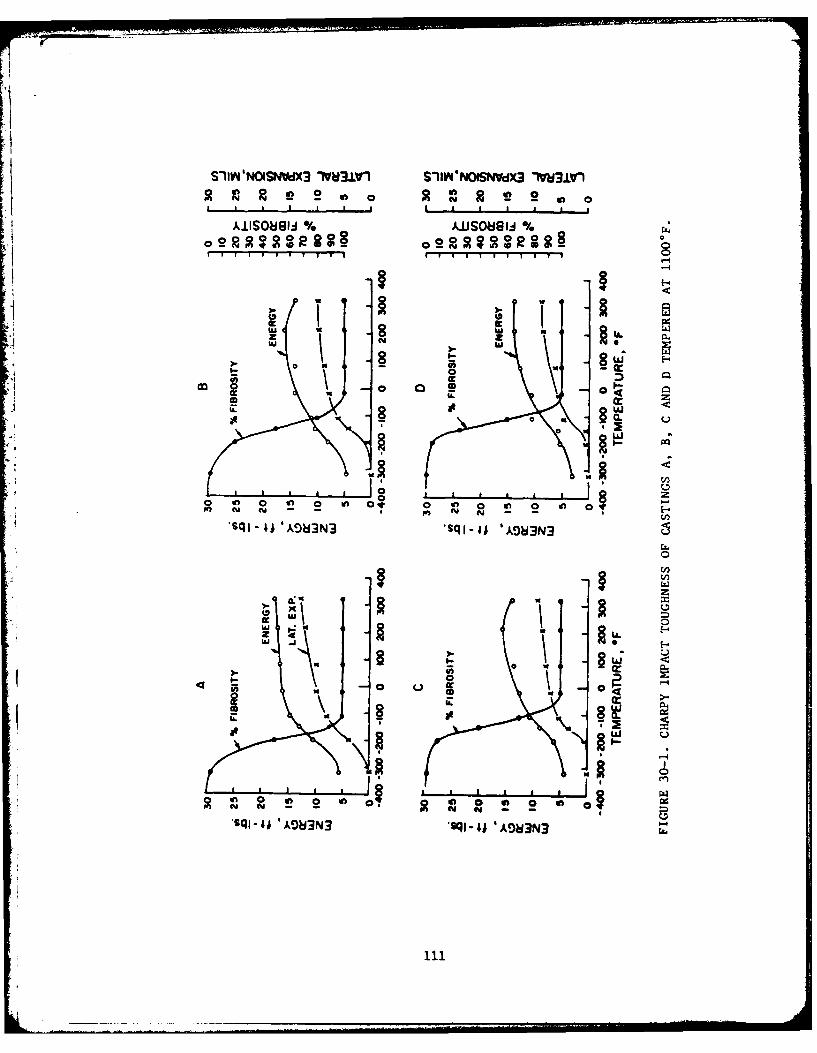
S'1VI4 NOSNWdX3 ""VIV S1HN'NOISN~dX3 -"3Lr
0~
co~oc~o <
__ _ _ _ _ _ _ 0
00Io
u
w 4
0 0 0 0,
00
A 8AG34 'kVN

SIIV&NOtSNVdX3 1Vh11.V1 S1II'NOISNVdX3 IV3.LW
AIISO88IW % AlIso~9IU %
I2 2 I2 I_ _ __ _ _ I I I1-- F FF
8 -4
0i w
04
0 c0I'. wzw x
0 in 0 In o in 0, in 0 t 0 in 0 E
on Y em - - N N - cn
'Sql-44 'AD3N3 *S.I-U A3N30
8. w) x" 0 0
0 Iw
0 5 ~UIK w
t 3ui t 0 1.-
IL 00
p~~~ 'KwpzwE paI
2 ~ ~~~ - 2'Sl4 'A!)3N3 J'A903N3 -
112

SI1WNOISNVdx3 lV~VV SIIW'OSN~dX3 VI31VI
0 w
z
t Ur
di a a 0 0~C 0 'o a C C
sq 1 4 'kI 3N 'AO&i3N3 q-
00
41 'ASN g AeN
11

SiI WNOISNVWX3IWU3V1 S1IIW4'NOISN~dX3 1VW3lV1o ~a~ a 0 2 a o
AlIsohlg,.1 AdISO8811 %0
I I I I I I I I I I I I I F I -i
2Y Le2n0Q
00
ew y
4 I4R
o 0 L0czSq -$ aAO3N 'SJ4 '%
114.

S 1UYI NOISN~dX3 -"3±LVI S1IIVACNOISN~dX3 IV~3iV1a 0
Q 0y
g w8
o cc
o 0 cl 0 u
C) UJ
0 '
sq 4 'ANON3 *q-44 A463N3
115

S-IVY'NOISNVdX3 -W3±1 SuN Y'NOISN~dX3 7"~3L1-
IL
'~ 827
LLoz 49
w 91
11116
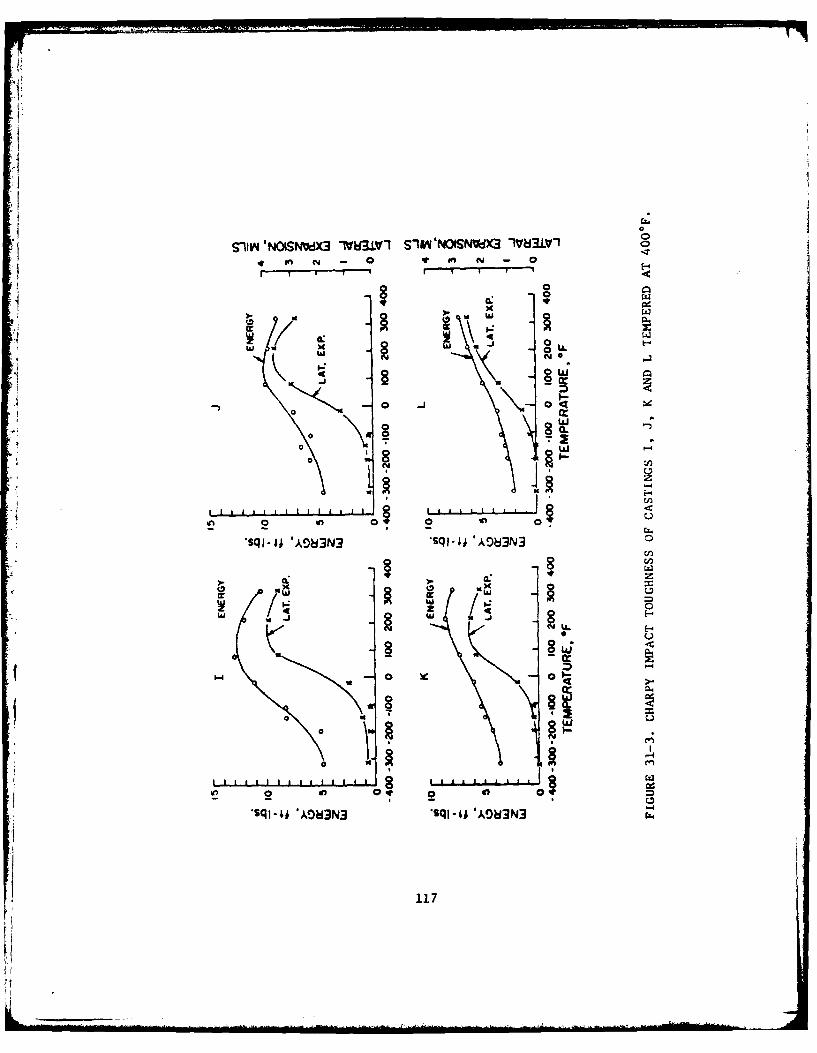
00
SilkNOI~dX TV3W1S1I~'NOSN~3 13±0
w S L
0
w 0 w
U. -4
fn0
sq *~AOU3N3sq j;' klN
117~AO3N

00
t~~~ 2 - urN
. a .
ww
2 in0 i
sq1~ 'A983N3 sq 1I41 'A%3N3
.L.
V z
x u
wit19 0 a'xW
1U -4 -t33'q-;'% N
118

40 (A)
35 0.012 % P,0.011l% S
u5 0 0.023 %P, 0.022% S
A25
>: 20'3 0.036 % P, 0.036 %S
z 0.054 % P,0.052 %S10
5
0-400 -300 -200 -100 0 100 200 300 400
15 ()
0.012 % Pv 0.011 % S
S10. 0.023 %P, 0.022% S
0.036%P, 0.036%S
LJ 5- 0.054%Ps 0.052%Sz
-400 -300 -200 -100 0 100 200 300 400
TEMPERATURE, 0F
FIGURE 32. COMBINED EFFECT OF PHOSPHORUS AND SULFUR ON THECHARPY IMPACT TOUGHNESS OF (A) 1100-F, AND (B)400OF TEMPERED 4340 CAST STEEL.
119

.---- ,-x,O.0l2 %P, 0.011 %S35 (A) '.025%P,0.0I %s
0 0.40 %P,o.01 %S
30 0.050 %P, 0.012 %S
25
L20
o> ' 5 -
35 - . .. .oos P ~o
w 10w
5
-400 -300 -200 -100 0 100 200 300 400
35 (B)0.012 % P, 0.011 % S
~~K-K0.009 % P. 0. 027 % S
30
25 0.011% P, 0.036 % S
A200. 007 % P, 0.049 % S
1I5
w 10
5
-400 -300-200 -100 0 100 200 300 400
TEMPERATURE, 0 F
FIGURE 33-1. EFFECT OF INCREASING (A) PHOSPHORUS AT NOMINAL 0.010%S,AND (B) SULFUR AT NOMINAL 0.010%P ON THE CHARFY IMPACTTOUGHNESS OF 11000 F TEMPERED 4340 CAST STEEL.
120

~ A)0. 009 % P, 0.027 % S
300. 02 3 %P,0.022% S
fl25 0.037 % P, 0.023 % S
0.050 % P, 0.025 %S20
zW 10
-400 -300 -200 -100 0 100 200 300 400
00.025 %P,0.011 %S
35 (B)
30 0.0 23 %P, 0.022% S
~25
0.025 % P, 0.038% S
w 5 0. 022% P,0.051 % SzLu 10
$ 5
-400 -300 -200 -1OO 0 100 200 300 400TEMPERATURE, OF
FIGURE 33-2. EFFECT OF INCREASING (A) PHOSPHORUS AT NOMINAL 0.025%S,AND (B) SULFUR AT NOMINAL 0.025%P ON THE CRARPY IMPACTTOUGHNESS OF 1100*F TEM4PERED 4340 CAST STEEL.
121
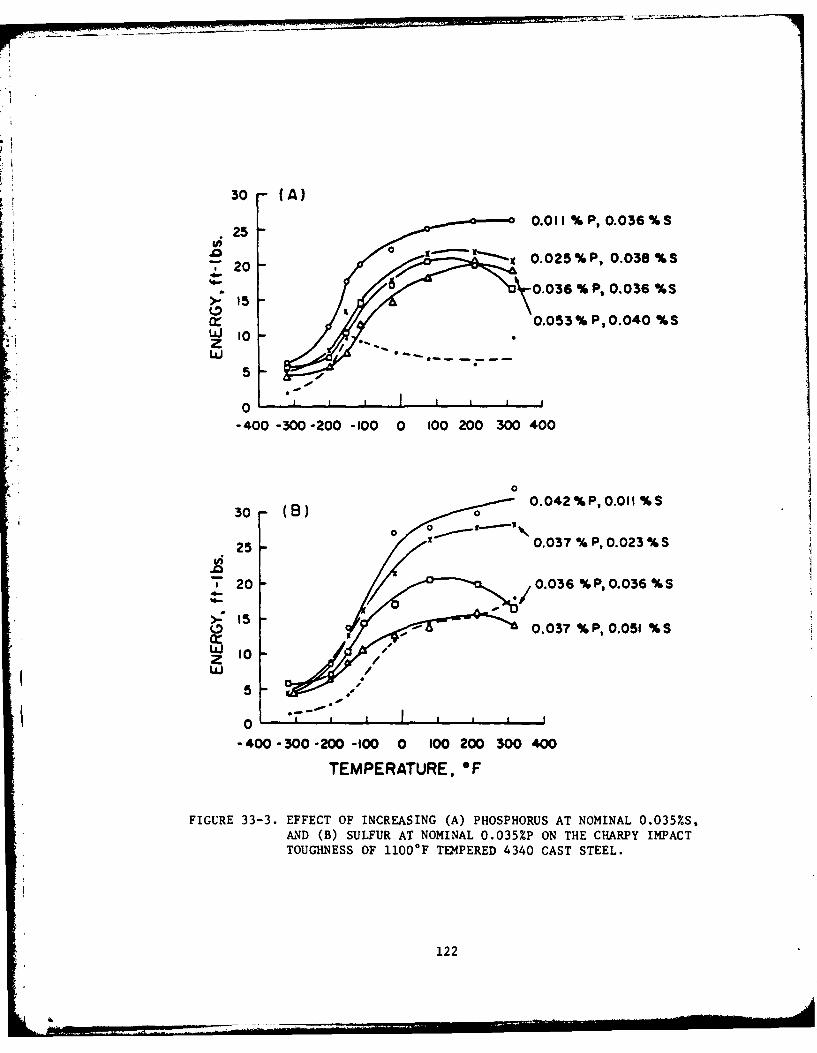
30 (A)0.011 %p,0.036%S
25
20 '-~ ~ 0.025 %P, 0.038 % S
0.036 % P. 0.036 %S
cr ~0.053 % P0.040 % SUJ 10zLU
5
0
-400 -300 -200 -100 0 100 200 300 400
0
30 (B) 0 0.042%P, 0.011 %S
25 -0.037% P,0.023 %S
20 0.036 % P, 0.036 % S
)- I 0.037 % P, 0.051 % S
w 10
5
0 -
-400 -300 -200 -100 0 100 200 300 400
TEMPERATURE, OF
FIGURE 33-3. EFFECT OF INCREASING (A) PHOSPHORUS AT NOMINAL 0.035%S,AND (B) SULFUR AT NOMINAL 0.035%P ON THE CHARPY IMPACTTOUGHNESS OF 1100OF TEMPERED 4340 CAST STEEL.
122

30 (A)25
0'4-.L~oa-~ 0.007 %P0.049%S
>: 15Z10 0.022%P10.051 %S
Liiz 10 0.037%P,0.051 %Sw 0.054% P, 0.052 %S
-400 -300 -200 -100 0 l00 200 300 400
30 (B) 0.050 %p, 0.012 %S
25 - 0 050%P 0.025 %S
0~200.053% P, 0.040 %S
cr 0.054 %P,0.052%SLiz 10
w 5
-00-300-200 -100 0 100 200 300 400
rEMPEFRAruRE, OF
FIGURE 33-4. EFFECT OF INCREASING (A) PHOSPHORUS AT NOMINAL 0.050%S,AND (B) SULFUR AT NOMINAL 0.050%P ON THE CHARPY IMPACTTOUGHNESS OF 1100OF TEMPERED 4340 CAST STEEL.
123

S (A) 0.012 %P,0.01I %S
0.025 %P, 0.011 %S
10 100.050 %PO.012 %S
wz 5
x 0.012%PO.OIl*S
100.011% P, 0.056 %S
-- 0.007 %P,0.049%Sw 5z /
0 O T I
-400 -300 -200 -100 0 100 200 300 400
TEMPERATURE, OF
FIGURE 34-1. EFFECT OF INCREASING (A) PHOSPHORUS AT NOMINAL 0.010%S,AND (B) SULFUR AT NOMINAL 0.010%P ON THE CHARPY IMPACTTOUGHNESS OF 400*F TEMPERED 4340 CAST STEEL.
124

15 (A)
v;." 0.009 % P, 0.027 %S7 to - 0.023 % P, 0.022 % S
0.037 % P, 0.023 % Scr 0 0 5 0 % P, 0.025 % S
LLIzo~ -
-400 -300 -200 -100 0 100 200 300 400
15 (B)
0.025 % P, 0.011 %S
0 ,0 0.023 %P, 0.022 %S>-
0 ,w,.025% 0 1).038 %S
L. 5 0.022 %P, 0.051 %Sz
00S0 , , I 1 i I
-400-300-200 -100 0 100 200 300 400
TEMPERATURE. OF
FIGURE 34-2. EFFECT OF INCREASING (A) PHOSPHORUS AT NOMINAL 0.025%S,AND (B) SULFUR AT NOMINAL 0.025%P ON THE CHARPY IMPACTTOUGHNESS OF 400 0F TEMPERED 4340 CAST STEEL.
125
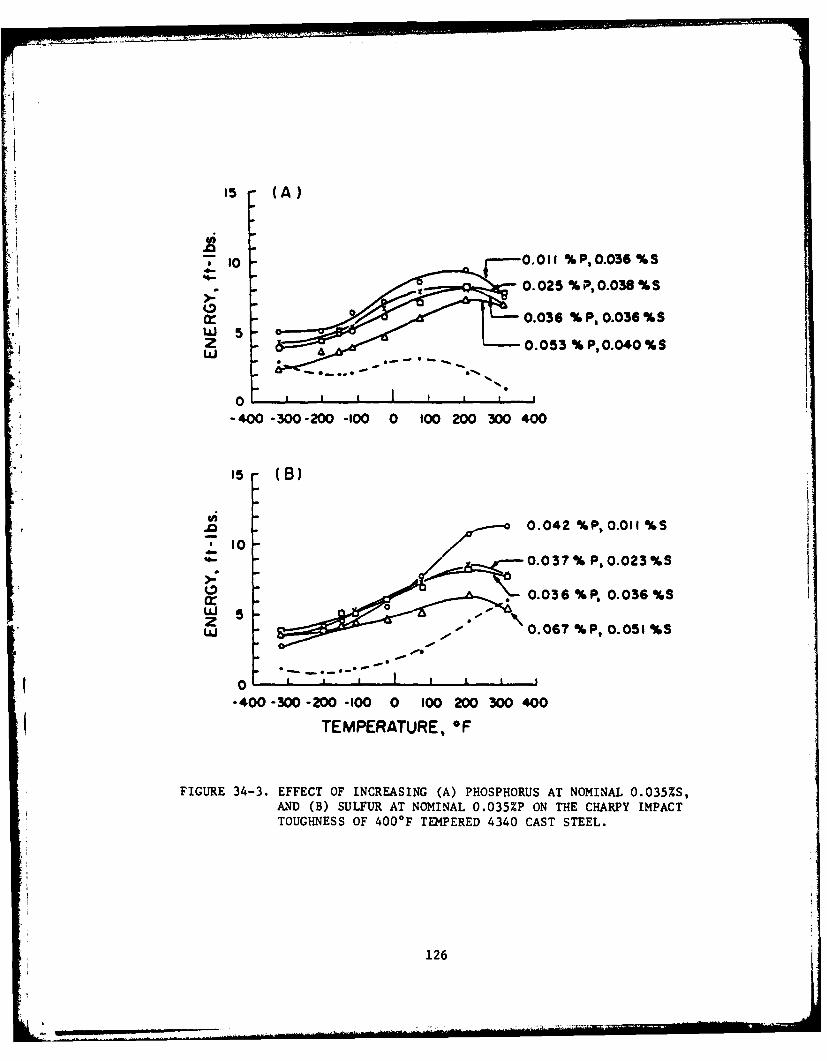
15 (A)
7 tO 0.011 %P,0.036%S
0
c1 0.036 % P. 0.036 %S
z 0.053 % Ps0.040 %S
-400 -300 -200 -100 0 100 200 300 400
15 ()
.0 0.042 %P0.011 %S710
4- 0.0 37 % P, 0.023 %S
0 ~0.03 6% P, 0. 036 %S
z- 0. 067 % Pf0. 051%Sw
0
-400 -300 -200 -100 0 100 200 300 400
TEMPERATURE, OF
FIGURE 34-3. EFFECT OF INCREASING (A) PHOSPHORUS AT NOMINAL 0.035%S,AND (B) SULFUR AT NOMINAL 0.035%P ON THE CHARPY IMPACTTOUGHNESS OF 400*F TEMPERED 4340 CAST STEEL.
126

'5 (A)
'*10
0.007 %P, 0.049 % S
cr ~0.022% Ps0.051 %S
z 0.03 % P, 0.051 %S
w .. 0.054 % P0.052 %S
-400 -300 -200 -100 0 100 20030 40
w5 (8
A7 i 0.054%P,0.02 %S
FIGURE ~ ~ ~ ~ ~ ~ ~ ,0.5 344%FETOPNCESN A HSPOU TNMN0.05%S,
AN 5B UFRA OIA 0.05 3% H CPYIMPACT
TOGNS OFM00RATRPED 430CSTSEL
127

30 A ) 110F 0.050%P, 0.012 %S
30 -2 o A 1100*Fa • • 400O• F25 -
. o AVE.-115F/ .. .0.010 % P,0.049 % S
o i-
Z 10 0.050 %P, 0.012 %SA .
5 0.007 % P, 0.049 %S
0-400-300-200 -100 0 100 200 300 400
35 (B)
300.037 %P,0.023 %S
U; 25
. 20 0.025 % P, 0.038 %S
0 15
Z 0 0.0 37 % P.0.023 %S
5 , 1' 0.025 % P, 0.038 %S
0 J - L I i
400 -300 -20 - 100 0 00 200 300 400
TEMPERATURE, OF
FIGURE 35-1. RELATIVE EFFECT OF PHOSPHORUS AND SULFUR FROM COUN-TERPART CASTINGS (A) P AND A, AND (B) K AND F ON THECHARPY IMPACT BEHAVIOR OF 1100OF AND 400OF TEMPERED4340 CAST STEEL.
128

35 (A)
30
025
0.050 %P90.025 %SS20
15 0.022 %P,0.051 % S
w
0030-20-00 02030
30 0.0502%pt.025 %S
"5 0. 022% P 0.06 % S
0
200
100.042% P0.011 % S$~3 0.1 P.3%
00
T0MERAU1E %'F.36%
212

35 -(A)
30
25 25
20 ~0.053 % P, 0.040 % S
(315 0.037 %P,0.051 %S
w 10Li 0.053 %P, 0.040 %S
0.037%P,0.051 %S0
-400 -300 -200 -100 0 100 200 300 400
0.025 %p,0.011 % S35 (B)
0.009 %P,0.027 %S
30
~25
S20
cr 0.025 % P, 0.011 %SZ 10
w 0.009 % P, 0.027 %S
5
-400-300 -200 -100 0 100 200 300 4-00
TEMPERATURE, OF
FIGURE 35-3. RELATIVE EFFECT OF PHOSPHORUS AND SULFUR FROM COUN-TERPART CASTINGS (A) H AND C, AND (B) N AND I ON THECHARPY IMPACT BEHAVIOR OF 1100OF AND 400OF TEMPERED4340 CAST STEEL.
130

40 (A)0.012 % P, 0.011 %S
11,300.050 % P,0-012 %S0
A25
>20-
w c-- 0.010 %P,0.049%Szw
10
5
0-400 -300 -200 -100 0 100 200 300 400
15 (80.012 % P,0.01II %S
10 ~0.050 %P, 0.012 %S
>:0 x ~0.007 % P, 0.0 49 %S
z
-400-300 -200 -100 0 100 200 300 400
TEMPERATURE, OF
FIGURE 35-4. RFLATIVE EFFECT OF PHOSPHORUS AND SULFUR ON THE IMPACTTRANSITION BEHAVIOR OF (A) 1100*F AND (B) 400-FTEMPERED 4340 CAST STEE.L.
131

o 0.010 % S NOMINAL o 0.010 %P NOMINAL
J 0.025 % 5 NOMINAL 0 0.025 %P NOMINAL* 0 0.035 %S NOMINAL 0 0.035 %P NOMINAL
_ 0.050 %S NOMINAL A 0.050 %P NOMINAL
30 0 30
2525 i,2
20 0 K "- 20 o
x 0 o: 1. 0- 15 1 OI
w w
z A
5 (A) 5 (6
0 I I 0 , . I0 0.02 0.04 0.06 0 0.02 0.04 0.06
P, % S. %
30 0
025
.0
20 00
0 00>:" 15 o 0oa
00 0t0 0W t0 0
zLUJ
5- (C)
0 I I I I I I I I I I
0 0.02 0.04 0.06 0.08 0.10 o. 12
p + S. %
FIGURE 36. EFFECT OF (A) PHOSPHORUS, (B) SULFUR AND (C) PHOSPHORUSPLUS SULFUR CONTENT ON THE -115 0 F CHARPY IMPACT TOUGH-NESS OF 4340 CAST STEEL TEMPERED AT 11000 F.
132
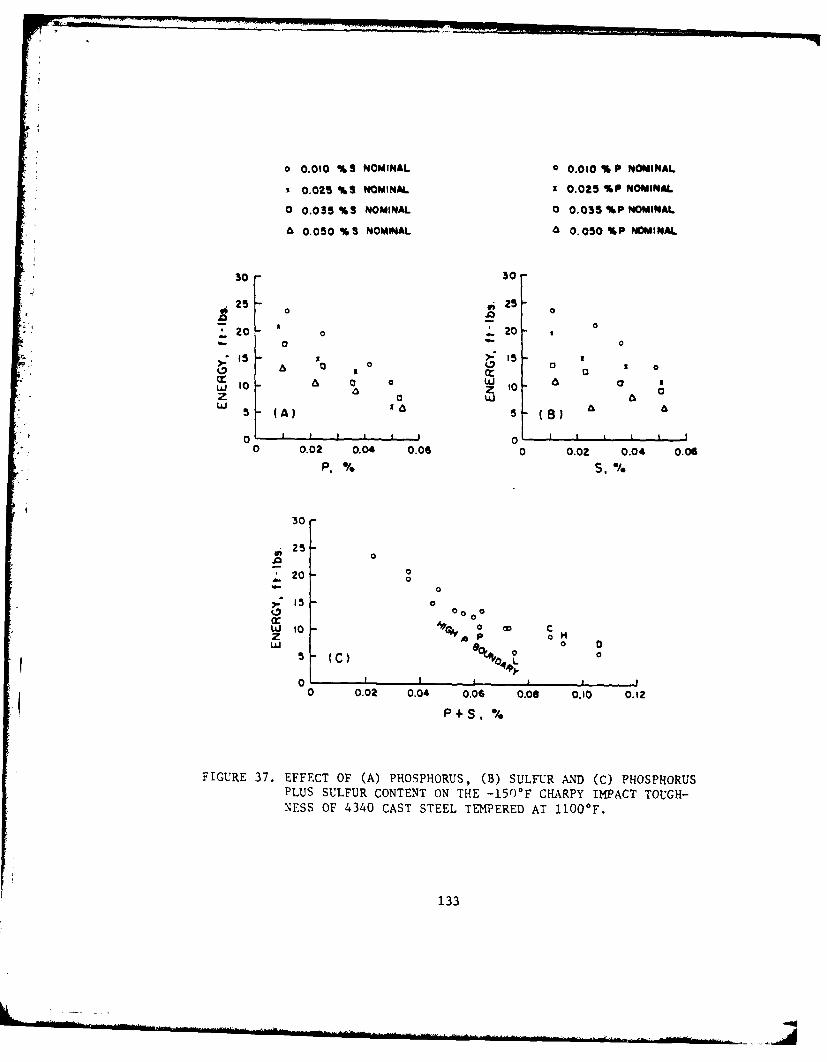
o 0.010 %9S NOMINAL 0 0.01 % P NOMINAL
3 0.025 %S NOMINAL 3 .025 %P NOMINAL
0 0.035 %S NOMINAL 0. 0035 % P NOMINAL
A 0.050 %S NOMINAL A 0.050 %P NOMINAL
30 30
25 , 25 o' 0 ~ o ..
e.0
>15 15 o.S o00 x 0 0r 00w1
z a uaZ o J 6
5 (A) 5 - (8)
0 I I I 0 I I I0 0.02 0.04 0.06 0 0.02 0.04 0.06
P, % S. %
30
25
.00
, IS o00 0
X 0
W10 0~ QD cON0 0
5 (C) 0
0 LI0 0.02 0.04 0.06 0.06 0.10 0.12
P+s ,%
FIGURE 37. EFFECT OF (A) PHOSPHORUS, (B) SULFUR AND (C) PHOSPHORUS
PLUS SULFUR CONTENT ON THE -150F CHARPY IMPACT TOUGH-
NESS OF 4340 CAST STEEL TEMPERED AT 11000 F.
133
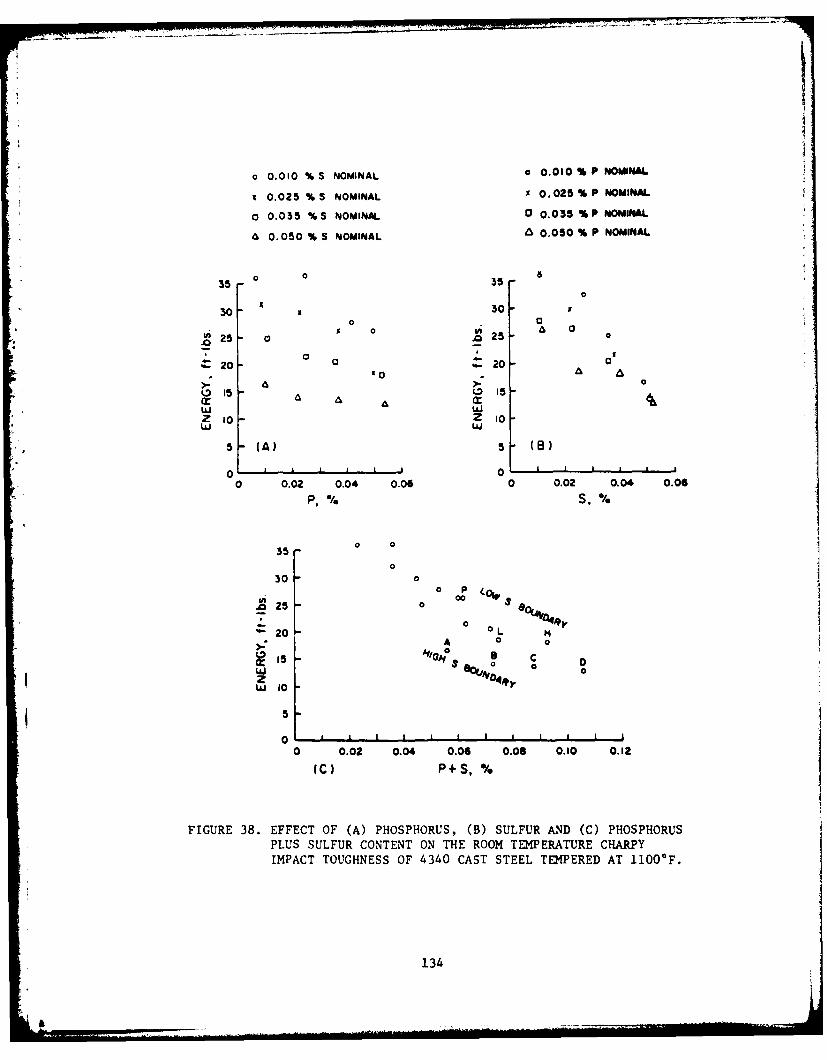
o 0.010 % S NOMINAL o 0.010 % P NOMINAL
I 0.025 %S NOMINAL 0. 025% P NOMINAL
o 0.035 %S NOMINAL 0 0.035 % P NOMINAL
A 0.050 % S NOMINAL 0.050 % P NOMINAL
35 0 35
0030 s30o a
g o A 025. 25 a
Z 20 - 20'a A * AA, )..0
15 X 1A w
Z: 1o Z lo0
L& uj
5 (A) 5 (B)
0 I0 p p
0 0.02 0.04 0.06 0 0.02 0.04 0.06
P. % S, %
0 035
0
30 P00
'o25 - 0
o L 449,20 oL p
A 0
0W 0t4J I0
5
00 0.02 0.04 0.06 0.08 0.10 0.12
(C) P+S, %
FIGURE 38. EFFECT OF (A) PHOSPHORUS, (B) SULFUR AND (C) PHOSPHORUSPLUS SULFUR CONTENT ON THE ROOM TEMPERATURE CHARPY
IMPACT TOUGHNESS OF 4340 CAST STEEL TEMPERED AT 1100*F.
134

ioo - (A) ",;,*
630 P. % S%
0.012 0.01600 .025 0.0 11
,.,.- Qof,, 0.0,,2 0.011
20 - 0.050 0.012
-400 -300 -200 -100 0TEMPERATURE, OF
too -( B )- ,-
>- 8o / P,% S,%
0l) 0.009 0.0270 60 -
cr 0.023 0.02240 -0 0.037 0.02)5
S20 - A 0.050 0.025
0-400 -300 -200 -100 0
TEMPERATURE, OF
FIGURE 39-1. EFFECT OF INCREASING PHOSPHORUS AT NOMINAL (A) 0.010%SAND (B) 0.025%S ON THE % FIBROSITY TRANSITION BEHAVIOROF 1100*F TEMPERED 4340 CAST STEEL.
135

100 - (A) x
so 0 0.011 0.036
1 0.025 0.038S40 a 0.036 0.036
20 a 0.053 0.040
0
-400 -300 -200 -100 0TEMPERATURE, F
oo (B)
>- 8o- P,% S,%
U) o 0.007 0.0490 60-x 0.022 0.051
040- 0.037 0.051
020 i z 0.054 0.052
0
-400 -300 -200 -100 0
TEMPERATURE, *F
FIGURE 39-2. EFFECT OF INCREASING PHOSPHORUS AT NOMINAL (A) 0.035%S
AND (B) 0.050%S ON THE % FIBROSITY TRANSITION BEHAVIOROF 1100OF TEMPERED 4340 CAST STEEL.
136

100 -(A)
8- 0 -P,/% S,%
~6 ~0.012 0.011Kr 0.009 0.02?
40LL. 0.011 0.036
o-20 - 0.007 0.049
0--400 -300 -200 -100 0
TEMPERATURE, F
100 -(B)
>- 80 p,, ,
0 60 - 0.025 0.01(
Kr 0.023 0.02240
U. ~0.025 0.038
~20 - 0.022 0.051I
0-400 -300 -200 .100 0
TEMPERATURE, OF
FIGURE 40-1. EFFECT OF INCREASING SULFUR AT NOMINAL (A) 0-010%P AND(B) 0.025%P ON THE % FIBROSITY TRANSITION BEHAVIOR OF1100OF TEMPERED 4340 CAST STEEL.
137

(A)BO0 0 LD
>-0 P,% S,%
60 0 0.042 0.011
0(Z: 0.037 0.023D 40 - 0.036 0.036
a0 0.037 0.051a20 '
0 oxomA I
-400 -300 -200 -100 0
TEMPERATURE, OF
oo (B)
>. o80 P,0% S,%
0 0.050 0.0120
=' 0.050 0.025TO 40-
,L 0.053 0.040
20 " 0.054 0.052
0-400 -300 -200 -100 0
TEMPERATURE, OF
FIGURE 40-2. EFFECT OF INCREASING SULFUR AT NOMINAL (A) 0.035%P AND(B) 0.050%P ON THE %FIBROSITY TRANSITION BEHAVIOR OF1100OF TEMPERED 4340 CAST STEEL.
138

.100 0 1000 0 0
120 o 00 IL-120 - a
0 0
-- e 0 0
-16O0 o- 016 0
o -180 - D (A - IS - 0 0
0 0.02 0.04 0.06 0 0.02 0.04 0.06P, %. S. %.
(A) (8)
*-1006.0 0
0 IS -0
00
0200 0
00
on -220 II
0 0.02 0.04 0.06 0.06 0.10 0.12
P + S, %'(c)
FIGURE 41. EFFECT OF (A) PHOSPHORUS, (B) SULFUR AND (C) PHOSPHORUSPLUS SULFUR CONTENT ON THE 50% FIBROSITY TRANSITIONTEMPERATURE OF 1100OF TEMPERED 4340 CAST STEEL.
139

:1 -6
-60 -600 0
-so h -sooIL 0 000
0 0 0
2-0 0 -10 0
Q) . 0o
0-Iso --Z-20 0 -120 o
000 0 0 0
-0
- -O 0. --s0 o
tOO 00
a-0 0 -0
0 0.02 0.04 0.06 0 0.02 0.04 0.06
P, % S. %(AC)
-60
L 0
a4 - 0foo .
12 -Iz0 0
-140 - 0
o0Z -!160I o
0 0.02 0.04 0.06 0.08 0.10 o.12
P +S. %
(C)
FIGURE 42. EFFECT OF (A) PHOSPHORUS, (B) SULFUR AND (C) PHOSPHORUSPLUS SULFUR CONTENT ON THE 50% ENERGY TRANSITION TEM-PERATURE OF 110OF T EMP ERED 4340 CAST STEEL.
140

150
Ko 0.010 %S NOMINAL
1 0 0.025 %S NOMINAL
C o 0.035 %S NOMINAL.A A 0.050 %S NOMINAL
wA
A 00 0.02 0.04 0.06 (A)
P, %
0
0/
o 0.010 % P NOMINAL74*- 10 5
10 0 0 f 0.025 %P NOMINAL
a 0 0.035 %P NOMINAL. A A 0.050 %P NOMINALzA
0 1
00 I I I (8)
0 0.02 0.04 0.06
S.%
150
U, B.0
*- 10 0oo o
0 0
00 0 o
z 50w
(C)
0 * I I l I I0 0.02 0.04 0.06 0.06 0.10 0.12
FIGURE 43. EFFECT OF (A) PHOSPHORUS, (B) SULFUR AND (C) PHOSPHORUSPLUS SULFUR CONTENT ON THE 1500F CHARPY IMPACT TOUGH-NESS OF 400*F TEMPERED 4340 CAST STEEL.
141

.15
.- 0 0.010 %S NOMINAL
• tO 0 0.025%S NOMINAL0
0 o a 0.035%S NOMINALQ: A
UJ A a. o 0.050%3 NOMINALW 52 & 0w Ra
(A)0
0 0.02 0.04 0.06
P, .
15
.0 0 0 0.010 %P NOMINAL7 10"- 1 0.025%P NOMINAL
)- 0 0.035 %P NOMINAL0
0 0 £ 0.050%P NOMINALw50 A A
WI A A
0 0.02 0.04 0.06
S, %15
SI0 0o o
%: 0
2 0 00w P
0 l I I 0 0 I p i
0 0.02 0.04 0.06 0.01 0.10 0.12
P+ S. % (C)
FIGURE 44. EFFECT OF (A) PHOSPHORUS, (B) SULFUR AND (C) PHOSPHORUSPLUS SULFUR CONTENT ON THE -20OF CHARPY IMPACT TOUGH-NESS OF 400°F TEMPERED 4340 CAST STEEL.
142

15
v;, o 0.010 % S NOMIN&A.00
. 10 x 0.025 %S NOMINAL
-d ( 00.035 %S NOMINAL
r" a 0.050 %S NOMINAL,,, 5
zw
0 I I (A)0 0.02 0.04 0.06P, %
150
A .0 0 0 0.010 %P NOMINAL1 0 o
A- K 0.025 % P NOMINALI
a 8 00.035 %P NOMINAL(3: A i
5 A 0.050 % P NOMINAL
zw
01-- (B)
0 0.02 0.04 0.06
S.%
15 M0 N
0 0
10 0.0 0
-* 0
>0 0 0(3 a 0 0
cr 0
w
0 0.02 0.04 0.06 0.06 0.10 0.12
P +S, % (c)
FIGURE 45. EFFECT OF (A) PHOSPHORUS, (B) SULFUR AND (C) PHOSPHORUSPLUS SULFUR CONTENT ON THE 320OF CHARPY IMPACT TOUGH-NESS OF 400OF TEMPERED 4340 CAST STEEL.
143

so .o* 60 0 60 0
2 40 0 40ww
'" 20 - 20z, 0 0 0 0 0I- 0 0
-20 . -20CC -40 0 -40 0 0
w 00 -4z 0 z 0w -60 0 w - 60 0at a0o 80 o o
-100 * Ig00 o I a I0 0.02 0.04 0.06 0 0.02 0.04 0.06
P', ,% S, %
(A) (B)
o 60 0
B 40 0 0
1.- 20
0 0 00 0
-20I-40 - 0~wz 0w -60 0
0 o01 -I00 I I I 1
0 0.02 0.04 0.06 0.08 0.10 0.12
(C,
FIGURE 46. EFFECT OF (A) PHOSPHORUS, (B) SULFUR AND (C) PHOSPHORUSPLUS SULFUR CONTENT ON THE 50% ENERGY TRANSITIONTEMPERATURE OF 400OF TEMPERED 4340 CAST STEEL.
144

130 0A
120 K 0
10 0x 0 0 0.010%S NOMINAL110 x
0 A 0.025 % S NOMINAL
1000 0 0.035 %S NOMINAL
090 A'A A 0.050 % S NOMINAL
' I (A)0 0.02 0.04 0.06
P.,%
130 -0
120 0 xa 0 0.010 %P NOMINAL
11 0.2 1 0x X 0.025 % P NOMINAL
A00 0.035 % P NOMINAL
90 - S"1 0 .050 % P NOMINAL
so
1 I (B)
0 0.02 0.04 0.06
S%,
130 0
120
110-z p
o o,I lO0 0
9 00
90
0 I I I I I I I I I
0 0.02 0.04 0.06 0.06 0.10 0.12
P+S, % (C)
FIGURE 47. EFFECT OF INDIVIDUAL (A) PHOSPHORUS, (B) SULFUR, ANDCOMBINED (C) PHOSPHORUS PLUS SULFUR CONTENT ON THEROOM TEMPERATURE PLANE STRAIN FRACTURE TOUGHNESS OF1100OF TEMPERED 4340 CAST STEEL.
145
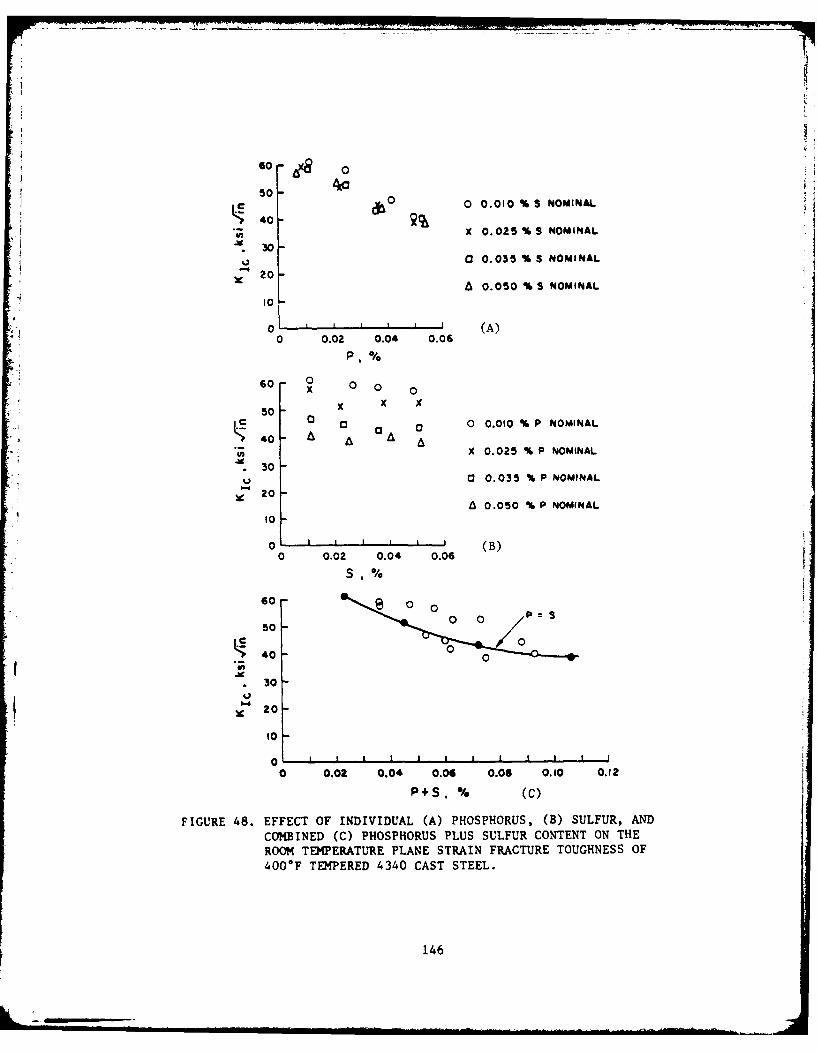
60 - 00
50-0) 0 0.010 % S NOMINAL
0•0.X 0 025 % s NOMINAL
60 040Q0 0.035 P3 NOMINAL
A 0.050 % S NOMINAL
30
0 (A)0 0.02 0.04 0.06
P,%
60- 0
0 0
50
40 0 0 0" X 0. 025 % P NOMINAL
30-,,j (0 0.035 %& P NOMINAL
A 0.050 %/ P NOMINAL
1-4 -
go
0 i I B I (B)0 0.02 0.04 0.06
S %
00 0 0 =
0 TEPEE 434 CAST STEL
146
30O
10 -
0 0.02 0.04 0.06 0.06 0. 1O 0.12
F,+S. % (C)
FIGURE 48. EFFECT OF INDIVIDUAL (A) PHOSPHORUS, (B) SULFUR, AND
COMBINED (C) PHOSPHORUS PLUS SULFUR CONTENT ON THE
ROOM TEIMPERATURE PLANE STRAIN FRACTURE TOUGHNESS OF
400°F TE-MPERED 4340 CAST STEEL.
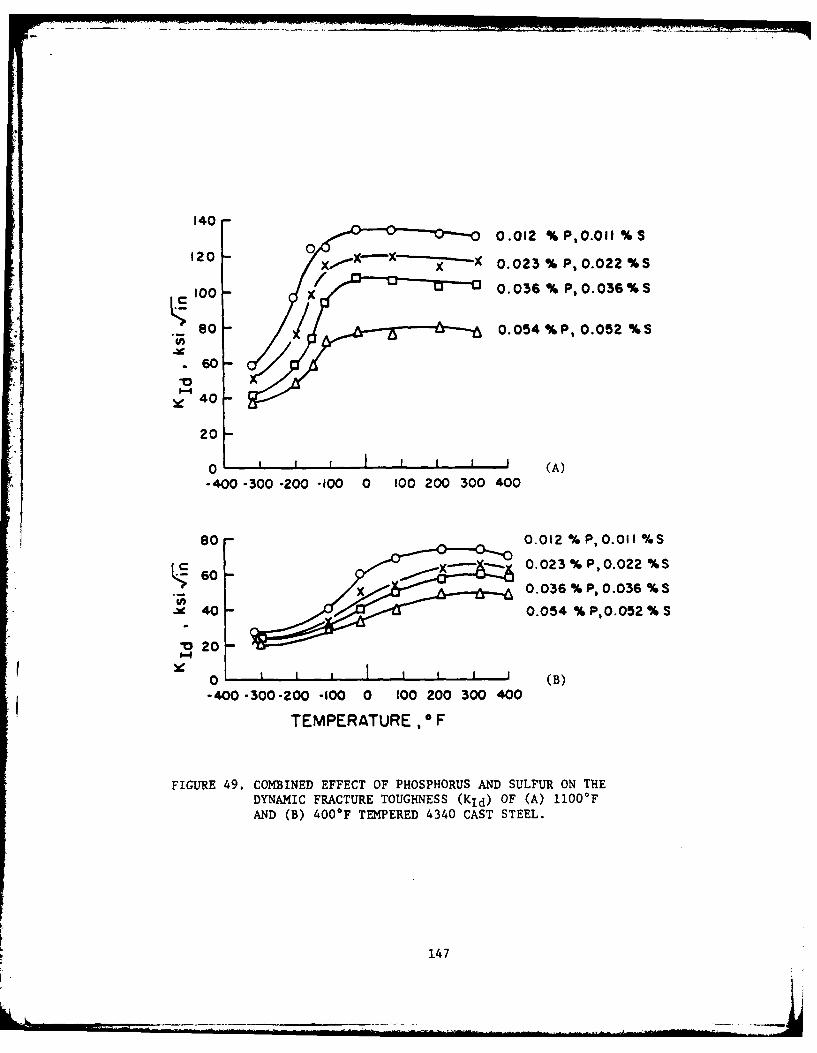
140 -0.012 % P,O.OII % S
120 X. - -x X -X 0.023% P, 0.022 %S
0 0. 036 % P,0.036%s
'0o- ox~ ~oo,%
8 0 0.054 % P, 0.052 % S
-60-
S40
20
0 1 I ' (A)
-400 -300 -200 -100 0 100 200 300 400
80 0.012 % P, 0.011 %S
60 - x 0. 023 % P, 0.022 %S
x ~0. 036 %P, 0.036% S.~40 0.054 % P,0.052 % S
20
*-400 -300-200 -100 0 100 200 300 400
TEMPERATURE ,F
FIGURE 49. COMBINED EFFECT OF PHOSPHORUS AND SULFUR ON THEDYNAMIC FRACTURE TOUGHNESS (KId) OF (A) 1100*F
AND (B) 400*F TEMPERED 4340 CAST STEEL.
147
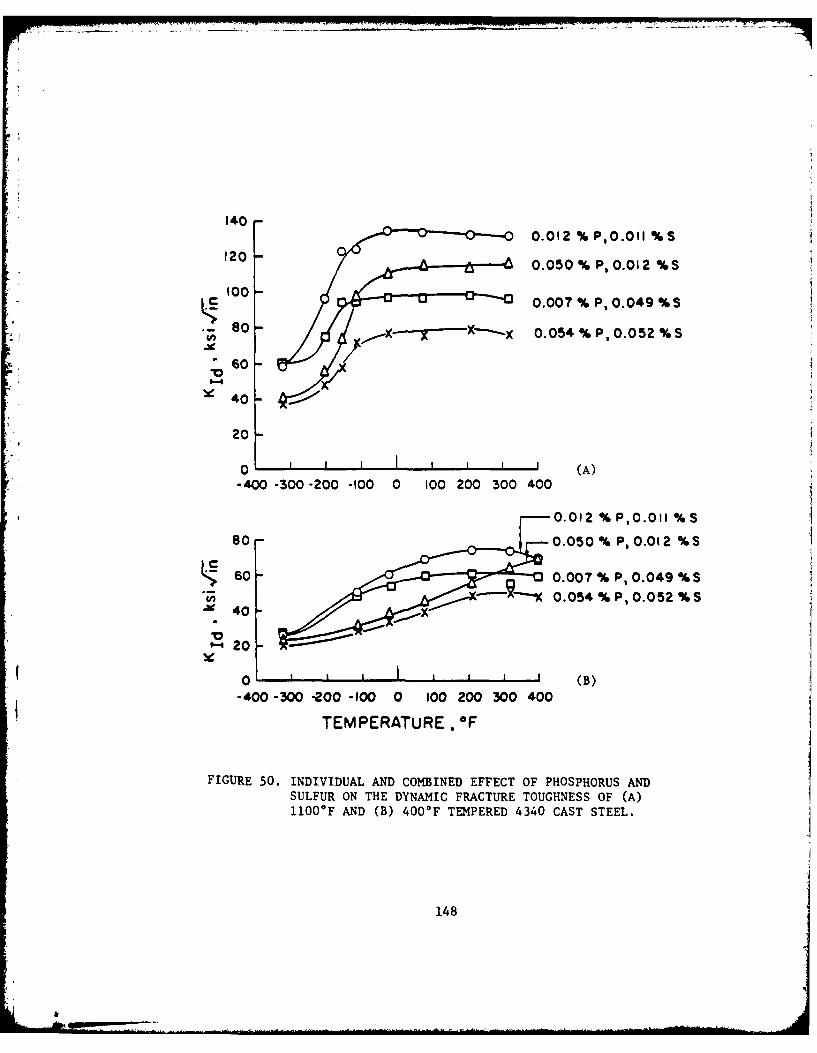
1400.012 %P,0.OI %S
120 0.050 % P, 0.012 %S
1000 0' 3 0 .007 % P, 0 .049 %S
80 ---- r- -- X 0.054 % P, 0.052 % S
60 /
40
20
0 ' I I I (A)-400 -300 -200 -100 0 100 200 300 400
0.012 %P,0.0II%S
80 0.050 % P, 0.012 %S
60 0.007 % P, 0.049 %S
- 0.054 % P, 0.052 % S40
0 20
0 , 1 L a I I I I I (B)-400 -300 -200 -100 0 100 200 300 400
TEMPERATURE, F
FIGURE 50. INDIVIDUAL AND COMBINED EFFECT OF PHOSPHORUS AND
SULFUR ON THE DYNAMIC FRACTURE TOUGHNESS OF (A)
11000 F AND (B) 400OF TEMPERED 4340 CAST STEEL.
148
&

0120-
110 9
1000 0
90 -150OF
0 00 0so o o1.80
04 0 0 070 0 0
SOUNOARY
0 0.02 0.04 0.06 0.06 0.10 0.12
P +S, % (A)0 0
120 - 0
0110 -
01°°0 0° o
90 0-IIOF
004 -010 0soo70
0 0.02 0.04 0.06 0.08 0.10 ( .B 2
P + S , % (B)0130 0
0
120 0
110 0 08 0
0 0" oo -0 80OF0 0
. 90 -/ 0
so 0
0 0.02 0.04 0.06 0.06 0.10 o.,Q
P+ S. % (C)
FIGURE 51. EFFECT OF PHOSPHORUS PLUS SULFUR CONTENT ON THE DYNAMICFRACTURE TOUGHNESS OF 1100*F TEMPERED 4340 CAST STEELBROKEN AT (A) -150°F (BELOW CROSS OVER TEMP.), (B)-110OF (CROSS OVER TEMP.), AND (C) 80OF (ABOVE CROSSOVER TEMP.).
149

80
70 0
60 0 00
00 o 00
50 00
40 80OF 0 0BOUNOARY
0 0.02 0.04 0.06 0.06 0.10 0.12
P+S, % (A)
so -
80
co0so °°c 000
0 0so 0 0 0 0
40 230OF
I I I I , I , I I
0 0.02 0.04 0.06 0.06 0.10 0.12
P+s, % (B)
so -
070 - 0 0 0 0
0 0 0060 - 0 0 00
0
50 00 0
-40 400°F S BOUNOARY
i I I I I I I *
0 0.02 0.04 0.06 0.06 0.10 0.12
P +S. % (C)
FIGURE 52. EFFECT OF PHOSPHORUS PLUS SULFUR CONTENT ON THE DYNAMICFRACTURE TOUGHNESS OF 400*F TEMPERED 4340 CAST STEELBROKEN AT (A) 80*F (BELOW CROSS OVER TEMP.), (B) 230OF(CROSS OVER TEMP.), AND (C) 400OF (ABOVE CROSS OVERTEMP.).
150

m-'o
0 2- 8
A A 0.012%P,0.011%S
6 R = K Imin/K imox:O .1
e 4 ay 150 ksi-
w do :( 8 O+ 131 p + 8 S ) xiO6( .5
2' a Oy :220 ksi in/cycle _
2do %K 235TT 0 4+ P +A 2 S)xLO'
tw
in cycles10-6 1 1 1 1 1 1 1 lo o 4 6 0 100 2 4
STRESS INTENSITY FACTOR RANGE,LIz,ksi /
FIGURE 53. VARIATION OF FATIGUE CRACK GROWTH RATE WITH STRESSINTENSITY FACTOR RANGE AS AFFECTED BY PHOSPHORUSAND SULFUR FOR MEDIUM AND HIGH STRENGTH 4340 CAST
STEEL.
151

140
o TEMPERED AT 4000 F
120 LINEAR ELASTIC FRACTURES
* TEMPERED AT 11000FGENERAL YIELD FRACTURES *
100
80 K0
60-
40
20
o0 I I I I
0 20 40 60 80 100 120 140
KIc, ksiVjin
FIGURE 54. DYNAMIC FRACTURE TOUGHNESS (KId) VS. PLANE STRAINFRACTURE TOUGHNESS (KIc) OF 400OF AND 1100*FTEMPERED 4340 CAST STEELS TESTED AT ROOM TEMPER-ATURE.
152

11020
25 60- 6
20- p .01inc - 40
Cr 15- -20
z l--0
5A A 0. 050 %P, 0.012 %S
01 0 NU 0.007 %P, 0.049 %S 80
.0I d4--
1027'F-4
7 :-5 2
zLu
-400 -300 -200 -100 0 100 200 300 400
TEMPERATURE, OF
FIGURE 55. RELATIVE NOTCH SENSITIVITY OF HIGH PHOSPHORUS VS.HIGH SULFUR 4340 CAST STEEL TEMPERED AT (A) 1100*FAND (B) 4000F. (P IS NOTCH RADIUS)
153
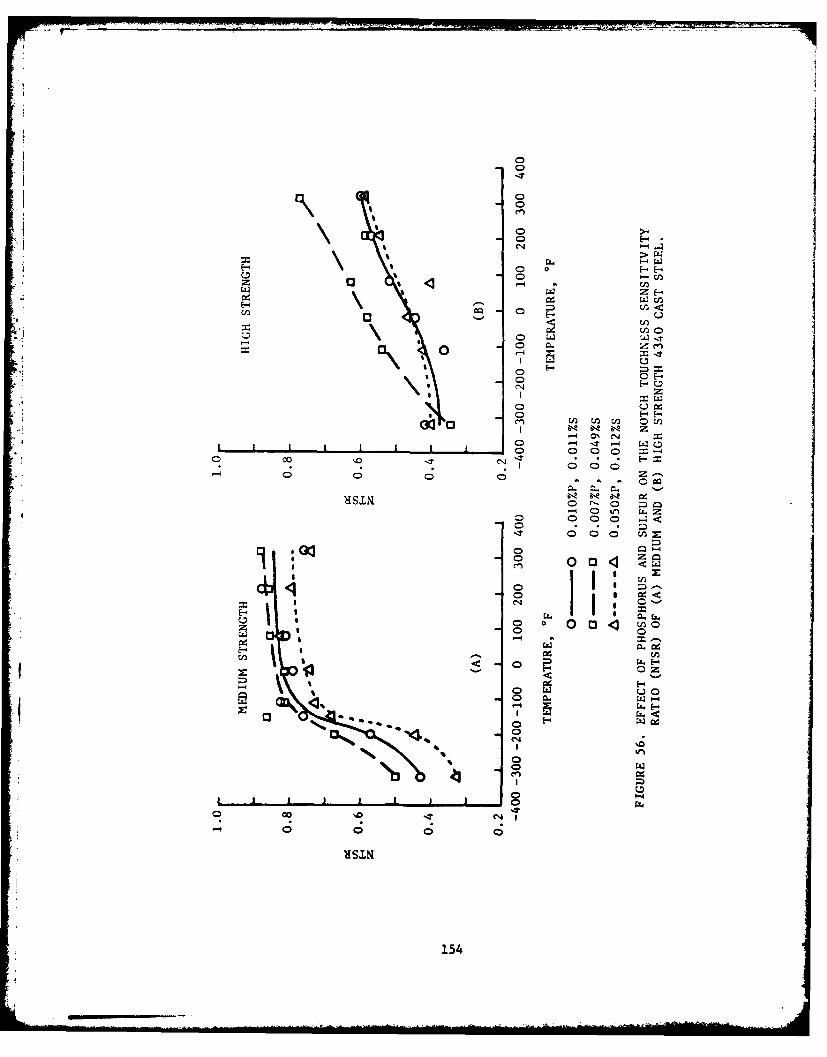
7--
44 En~z
00
C14 E- 0u
Uz
en Ln M- M -
0~ R m
C; C; c; t; n-
0 03 0< z -
00 z
.4 E-,
15

p]
m!
piI
GY
o I
dM
DEFLECTION
FIGURE 57. METHOD USED TO DEFINE THE GENERAL YIELD
LOAD (PGy) OF A ROUND HOUSE TYPE LOAD-
DEFLECTION CURVE.
155
.. .....
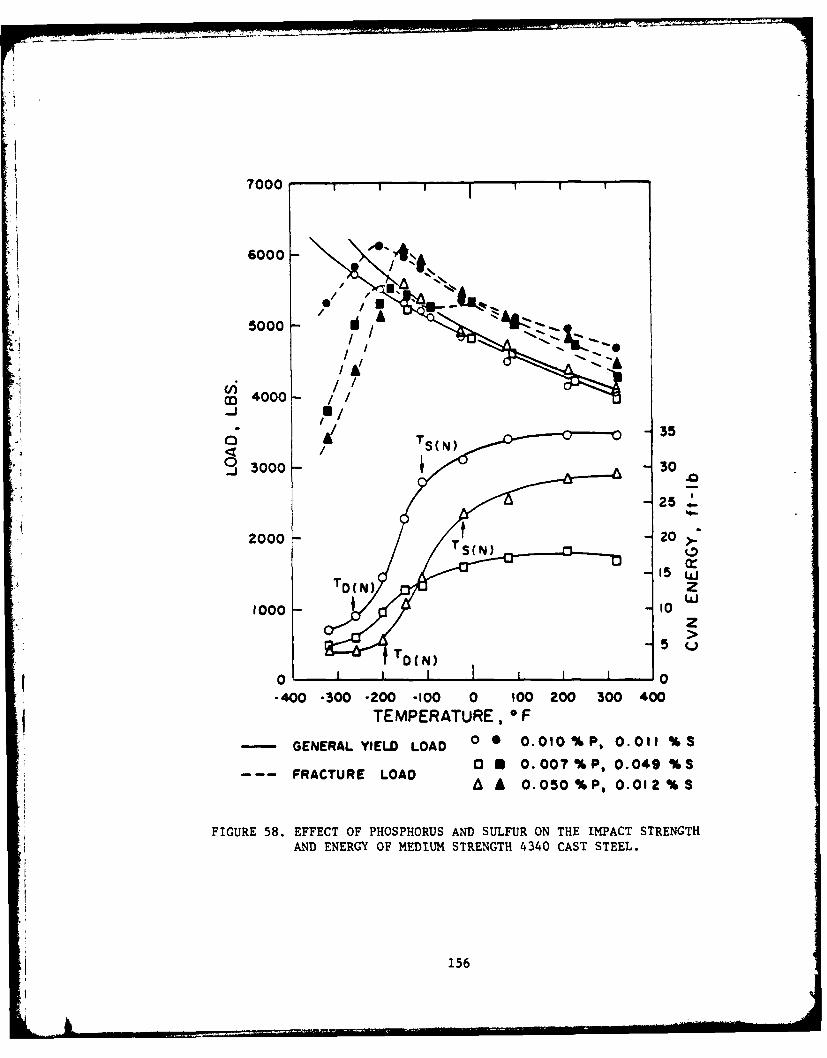
7000
6000-
'MA
-00
-A
2 000 2>
35Tz0 3000 30
D(N) z
-400 -300 -200 -100 0 100 200 300 400TEMPERATURE, OF
- GENERAL YIELD LOAD 0 0 0.010%P, 0.011 %S
0 U 0. 007 %P, 0. 049 %S--FRACTURE LOAD
A A 0.050%P, 0.012%S
FIGURE 58. EFFECT OF PHOSPHORUS AND SULFUR ON THE IMPACT STRENGTH* AND ENERGY OF MEDIUM STRENGTH 4340 CAST STEEL.
156

0*(Low P)
G*E (High P)
a (Low P)
D(N) D(N)
T EMP ERATURE
FIGURE 59. AN EXPLANATION OF THE EFFECT OF PHOSPHORUS ONRAISING THE BRITTLENESS TRANSITION TEMPERATUREOF CHARPY V-NOTCH SPECIMEN OF 4340 CAST STEEL.
157

7000
it ~-D(N)IT 86000 D DN)
00
5000
14000 ,-'
0j /
z
-400 -300 -200 -100 0 100 200 300 400
TEMPERATURE, 0FGENERAL YIELD LOAD 0 0 0.010 %p, 0.011 % S
FRACURE OAD DIl 0.007%P,0.049%S--- FRCTURELOADA A O.050%P,,O.O;2%S
FIGURE 60. EFFECT OF PHOSPHORUS AND SULFUR ON THE IMPACT STRENGTHAND ENERGY OF HIGH STRENGTH 4340 CAST STEEL.
158

50
40-
c
3000
-20-
0
010-
0
0.250
z 0.200
00.150
w 0.100
0 0.012 %P, 0.011% s0.050 0 1 0.007 % Pil0.049 %S
0 0.050 % P, 0.012 %S
-400 -300 -200 -100 0 100 200 300 400
TEMPERATURE OF
FIGURE 61. EFFECT OF PHOSPHORUS AND SULFUR ON THE (A) CRACK-OPENING DISPLACEMENT, AND (B) TRUE FRACTURE STRAININ CVN SPECIMEN OF 11000F TEMPERED 4340 CAST STEEL.
159

10
06
0 2 -0
0
0.250
z0.200
0.150
0.100
0.050
0 0.012 %P, 0.011 %S0 0 0.007 % P, 0.049 %S
A 0.050 % P, 0.012 % SI I I I I
-400 -300-200 -100 0 100 200 300 400
TEMPERATURE, OF
FIGURE 62. EFFECT OF PHOSPHORUS AND SULFUR ON THE (A) CRACK-OPENING DISPLACEMENT, AND (B) TRUE FRACTURE STRAININ CVN SPECIMEN OF 400OF TEMPERED 4340 CAST STEEL.
160

4340 CAST STEEL
o 0 0.012 %p,0.Oll% S
o0.007%P,O.049%S
a A 0.050 %P,O.12 % SA
2i 22
aly 150 ksi0 40
001 COD1.7 c 3CVN IN.SS
I.- 8
0 0
0
A2
CL0
My220 Iti
0.0001 COD :0. 17 c30CVN IN.
0.04 0.06 0.1 0.2 0.4
TRUE FRACTURE STRAIN ( f lCVN)
FIGURE 63. RELATION BETWEEN CRITICAL CRACK-OPENING DISPLACE-
MENT AND TRUE FRACTURE STRAIN IN CVN SPECIMEN FORMEDIUM AND HIGH STRENGTH 4340 CAST STEEL.
161

00
N Im z0o
m 0
at w
0
0~0 0
0
000
o:: ~
0 0
cc z
10 w
0 a.4*
0 0o-
00 o 6,o~S 9 d S Ad S 9 S A
mo-I~~~C 003 No'03001'A /HOH O'
162

a 219.? ksi-o-o
0
0
0
S -400-300-200 -100 0 100 200 300 400J0
TEMPERATURE, OF(A)
1.0
0 cf3 49.5 ksi
a0.0
**S 0.5
cry 221.6 ksi
0 A A 0.050 %P, 0.012%S
-400-300-200 -100 0 100 200 300 400
TEMPERATURE, 0 F(B)
FIGURE 65. EFFECT OF STRENGTH LEVEL ON THE NORMALIZED CODIdOF
(A) HIGH SULFUR AND (B) HIGH PHOSPHORUS 4340 CAST
STEELS WITH RESPECT TO CODId OF LOW PHOSPHORUS AND
LOW SULFUR 0.012%P, 0.011%S STEEL.
163
L-

APPENDIX A
A TYPICAL COMPUTER PROGRAM FOR REGRESSION ANALYSIS
1. RUN NAME MULTIPLE NON-LINEAR REGRESSION2. FILE NAME CORRELATION BETWEEN KIC AND P/3. CORRELATION BETWEEN KIC AND S/4. CORRELATION BETWEEN KIC AND P,S/5. CORRELATION BETWEEN KIC AND P+S/6. DATA FROM GROVES AND WALLACE7. VARIABLE LIST KIC,P,S8. VAR LABELS KIC FRACTURE TOUGHNESS/9. P PHOSPHORUS/
10. S SULFURii. COMPUTE LY=LN(KIC)12. COMPUTE PS=P+S
13. INPUT FORMATS FIXED (F5.1,2F7.3)14. N OF CASES 815. LIST CASES CASES=8/VARIABLES=KIC,P,S,PS16. PRINT FORMATS KIC(1), P(3),S(3),PS(3)17. REGRESSION VARIABLES=LY,P/
18. REGRESSION=LY WITH P(2)/19. VARIABLES=LY,S/20. REGRESSION-LY WITH S(2)/21. VARIABLES=LY,P,S/22. REGRESSION=LY WITH P,S(2)/23. VARIABLES=LY,PS/
24. REGRESSION=LY WITH PS(2)25. READ INPUT DATA
KIC P 5
1. 105.4 .012 .0192. 81.5 .013 .026
3. 96.0 .015 .0244. 84.1 .023 .0295. 66.9 .046 .0256. 60.6 .044 .0407. 55.5 .056 .0508. 47.7 .066 .066
164

I
APPENDIX B
DYNAMIC FRACTURE TOUGHNESS CALCULATION
B.1. Elastic Fr,.ture
When the fracture is linear elastic, the dynamic fracture
toughness can be determined from the standard linear elastic frac-
ture mechanics relationship:(42,Bl)
6MYa1
K= BW (Bl)
where M is applied moment, B is specimen thickness, W is specimen
depth, a is tGtal crack length, K is stress intensity factor, and
Y= 1.93- 3.07(a/W)+ 14.53(a/W)2 - 25.11(a/W) 3 + 25.8(a/W)4 (B2)
For the Charpy specimen (3 point bending):
M = PLI4 (B3)
where P is applied load and L is support span= 1.57". Thus, the
dynamic plane strain fracture toughness is:
l.5(Pmax)LYa 2Kid BW2 (B4)
where Pnmx is maximum load at fracture.
B.2. General Yield or Elastic-Plastic Fracture
The equivalent-energy method as developed by Witt enables the
calculation of a fracture toughness value based on data derived
from a specimen which fractures after general yielding.(55,56)
This method assumes that if a sufficiently large specimen had
been employed, fracture would have occurred before yielding but at
I6
* t 165
'I -. _ __ _

an energy corresponding to the initiation energy* measured for the
smaller specimen. The use of this method is illustrated in Figure
Bl. The linear portion of the load curve is extended to a value
P* such that the area under the linear portion of the curve is
equal to the measured initiation energy of the general yield frac-
ture. This P* value is then used to calculate KId:
I.5(P*)LYa'(KId (1B5)Kid = BW2
*Note: The initiation energy is taken as the energy to maximum
load. It would have been more reasonable to take this
value at the load of pop-in; however, this load of the
materials studied cannot be sensibly detected by the in-
strumented impact test.
166

APPENDIX C
CLEAVAGE FRACTURE STRENGTH CALCULATION
It has been indicated in Sec. B.l.-B.3., Chapter I that the
tensile stress distribution ahead of the notch reaches a maximum
amaX at elastic-plastic interface. The fracture criterion in* yy
region II is:max_=ma
0 yy O f ( f (Cl)
For Charpy V-notch specimen of mild steel, Wilshaw and Pratt show
that when the applied load (P) reaches 0.8 of the general yield
load'(PGH), Ko(p) reaches a maximum value of 2.18, namely:
K max = 2.18, at P/PGY = 0 .8 (C2)
0(p)
The relationship between Gy and PGY was found from this experiment
as:
cy = 31.6 PGY psi, for medium strength 4340 steel(c 3)
y = 35.0 PGY psi, for high strength 4340 steel
where PGY is in pounds and factors 31.6 and 35.0 were calculated
by dividing yield strength with general yield load at room tem-
perature, assuming the materials are strain rate insensitive as
justified previously. The values of these factors were found in
fair agreement with the theoretical value by Green and Hundy for
a rigid, perfectly plastic material of CVN specimen loaded in
three point bending.(Cl)
167

In the following it is assumed that Eq. (C2) for mild steel
can also be applied to 4340 steel, which of course is a rough
assumption. Combining Eqs. (C2) and (03), the cleavage fracture
strength (u*f) can be calculated.
For medium strength 4340 cast steel:
.4 (1) 0.012%P, 0.011%S steel
a =69.0 PGY 6 9 .Ox 6 3 8 0 psi -440.2 ksi
at T= -360*F, where PPY-.
(2) 0.050%P, 0.012%S steel
0j ~=6 9 .0 Pcy -69.0 x5940 psi -410.0 ksi
at T= - 235*F, where PPY .
For high strength 4340 cast steel:
(1) 0.012%P, 0.011%S steel
o* f= 7 6 .3 PGY -76 .3x 6 8 8 0 psi -524.9 ksi
at T- - 134*F, where PPY .
(2) 0.050%P, 0.012%S steel
0*f -7 6 .3 PGY =7 6 . 3 x 6 6 75 psi -509.3 ksi
at T- 180cF, where P/P - 0.8
168

REFERENCES (APPENDICES)
Bl. Brown, W.F., Jr. and Srawley, J.E., "Plane Strain CrackToughness Testing of High Strength Metallic Materials",ASTM STP 410, ASTM, 1966.
Cl. Green, A.P. and Hundy, B.B., "Initial Plastic Yielding1 in Notch Bend Tests", J. of the Mechanics and Physics ofSolids, Vol. 4, 1956, pp. 128-144.
169
.i9

EQUIVALENT ENERGYP . FOR FRACTURE
Pm ACTUAL FRACTURE
p' o P0GY . ."! _J
d° dmax
DEFLECTION
FIGURE BI. SCHEMATIC ILLUSTRATION OF THE DETERMINATION OFTHE EQUIVALENT ENERGY FRACTURE LOAD, P*. (42)
170
IJ

=771.. - .--. .
DISTRIBUTION LIST
No. ofCopies To
1 Office of the Under Secretary of Defense for Research and Engineering,
The Pentagon, Washington, DC 20301
12 Commander, Defense Technical Information Center, Cameron Station,Building 5, 5010 Duke Street, Alexandria, VA 22314
Metals and Ceramics Information Center, Battelle Columbus Laboratories,
505 King Avenue, Columbus, OH 432011 ATTN: J. H. Brown, Jr.
Deputy Chief of Staff, Research, Development, and Acquisition,Headquarters, Department of the Army, Washington, DC 20310
1 ATTN: DAMA-ARZ
Commander, Army Research Office, P.O. Box 12211, ResearchTriangle Park, NC 27709
1 ATTN: Information Processing Office
Commander, U.S. Army Materiel Development and Readiness Command,5001 Eisenhower Avenue, Alexandria, VA 22333
1 ATTN: DRCLDC
Commander, U.S. Army Materiel Systems Analysis Activity,Aberdeen Proving Ground, MD 21005
1 ATTN: DRXSY-MP, Director
Commander, U.S. Army Missile Command, Redstone Arsenal, AL 358091 ATTN: Technical LibraryI DRSMI-CS, R. B. Clem
Commander, U.S. Army Armament Research and Development Command, Dover,NJ 07801
2 ATTN: Technical Library
1 DRDAR-SCM, J. D. Corrie1 Dr. J. Waldman
Commander, U.S. Army Tank-Automotive Research and Development Command,Warren, MI 48090
1 ATTN: DRDTA-RKA
2 DRDTA-UL, Technical Library
1 DRDTA-RCK, Dr. J. Chevalier
Commander, U.S. Army Foreign Science and Technology Center,220 7th Street, N.E., Charlottesville, VA 22901
I ATTN: Military Tech, Mr. Marley
Director, Eustis Directorate, U.S. Army Air Mobility Research andDevelopment Laboratory, Fort Eustis, VA 23604
1 ATTN: DAVDL-E-MOS
I DAVDL-EU-TAP
171

No. ofCopies To
Commander, U.S. Army Aviation Research and Development Command,
4300 Goodfellow Boulevard, St. Louis, MO 63120
1 ATTN: DRDAV-EGX1 DRDAV-EX, Mr. R. LewisI DRDAV-EQ, Mr. CrawfordI DRCPM-AAH-TM, Mr. R. Hubbard
Naval Research Laboratory, Washington, DC 20375
I ATTN: Dr. J. M. Krafft - Code 5830I Code 2627
Chief of Naval Research, Arlington, VA 222171 ATTN: Code 471
Commander, U.S. Air Force Wright Aeronautical Laboratories,Wright-Patterson Air Force Base, OH 45433
2 ATTN: AFWAL/MLSE, E. Morrissey1 AFWAL/MLC1 AFWAL/MLLP, D. M. Forney, Jr.1 AFWAL/MLBC, Mr. Stanley Schulman1 AFWAL/MLXE, A. Olevitch
National Aeronautics and Space Administration, Washington, DC 20546I ATTN: Mr. B. G. AchhammerI Mr. G. C. Deutsch - Code RW
Chief of Naval Operations, Washington, DC 20350I ATTN: OP-987, Director
NASA - Ames Research Center, Mail Stop 223-6, Moffett Field, CA 94035I ATTN: SC, J. Parker
Naval Material Command, Washington, DC 20360I ATTN: MAT-0331
Commander, Rock Island Arsenal, Rock Island, IL 612991 ATTN: DRSAR-PPV
Armament Systems, Inc., 712-F North Valley, Anaheim, CA 92801I ATTN: J. Musch
Calspan Corporation, P.O. Box 235, Buffalo, NY 142211 ATTN: Library
lIT Research Institute, 10 West 35th Street, Chicago, IL 60616I ATTN: K. McKee
Sikorsky Aircraft, A Division of United Aircraft Corporation, Main Street,Stratford, CT 06602
I ATTN: W. G. Degnan
172

No. ofCopies To
Teledyne CAE, 1330 Laskey Road, Toledo, OH 43697I ATTN: Librarian, M. Dowdell
Simonds Steel Division, Guterl Special Steel Corporation, Lockport, NY 140941 ATTN: Mr. R. Farrington
FMC Corporation, Ordnance Engineering Division, 1105 Coleman Avenue,San Jose, CA 95108
1 ATTN: Mr. D. R. Fylling1 Mr. R. Musante
Lukens Steel Company, Coatesville, PA 193201 ATTN: Dr. R. S. Swift
Republic Steel Corporation, 410 Oberlin Avenue SW, Massillon, OH 44646I ATTN: Mr. R. Sweeney1 Mr. W. H. BrechtelI Mr. B. G. Hughes
United States Steel Corporation, Research Laboratory, Monroeville, PA 151461 ATTN: Dr. Hsun Hu
METTEC, 1805 E. Carnegie Avenue, Santa Ana, CA 927051 ATTN: Dr. L. Raymond
SRI International, 333 Ravenswood Avenue, Menlo Park, CA 940251 ATTN: Dr. D. Shockey
Director, Army Materials and Mechanics Research Center, Watertown, MA 02172
2 ATTN: DRXMR-PL1 DRXMR-PR1 DRXMR-FD1 DRXMR-K
10 DRXMR-MM, Mr. C. Hickey
173