iii. money, finance, and prices - adb.org · 119 re r ables money, finance, and prices in 2017, the...
TRANSCRIPT

118118
III. Money, Finance, and Prices
Snapshot
• Inflation, as measured by the consumer price index (CPI), exceeded 5.0% in 13 of 47 regional economies in 2017.
• In 2017, the money supply expanded on an annual basis in 38 of 41 economies in Asia and the Pacific.
• The ratio of nonperforming loans (NPLs) to total gross loans decreased in 16 of 29 regional economies from 2016 to 2017.
Key Trends
Inflation, as measured by the CPI, exceeded 5.0% in 13 of 47 regional economies in 2017. Consumer price inflation in 2017 increased most rapidly in three economies of Central and West Asia: Azerbaijan (12.9%), Uzbekistan (9.5%), and Turkmenistan (8.0%) as shown in Figure 2.3.1. In Azerbaijan, inflation accelerated as a result of the lagged effect of currency devaluation and increased fuel and electricity tariffs. In Turkmenistan, the government cut subsidies for utilities and raised prices for public transportation, and the manat depreciated steeply against the US dollar on the parallel market, driving inflation higher (ADB 2018a). In Uzbekistan, inflation was driven higher by the impact on import prices and production costs of the devaluation of the national currency by nearly 50% in September. In addition, an expanded list of goods and services used to monitor prices impacted the calculation of the CPI (ADB 2018b).
Deflation was recorded in the Cook Islands (–0.1%) and Brunei Darussalam (–0.2%). In both cases, nonfood inflation of –0.3% drove the CPI into negative territory.
The rise in the food CPI in 2017 outpaced growth in the total CPI in 26 of 45 regional economies in 2017, while growth in the nonfood CPI exceeded the growth in the total CPI in 15 of the region’s 40 economies (Tables 2.3.1, 2.3.2, and 2.3.3).
Figure 2.3.1: Inflation Rate (% annual change)
-5 0 5 10 15
Brunei DarussalamCook Islands
Marshall IslandsKiribati
JapanSolomon Islands
Timor-LesteSingapore
Taipei,ChinaThailandLao PDRArmenia
PalauHong Kong, China
PRCSamoa
AustraliaNew Zealand
Republic of KoreaMaldives
PhilippinesCambodia
VanuatuKyrgyz Republic
FijiViet Nam
IndiaMalaysia
IndonesiaTuvalu
PakistanNepal
MyanmarBhutan
Papua New GuineaBangladesh
NauruGeorgia
MongoliaSri Lanka
TajikistanAfghanistanKazakhstan
TongaTurkmenistan
UzbekistanAzerbaijan
2016 2017
Lao PDR = Lao People’s Democratic Republic, PRC = People’s Republic of China.Note: This chart includes economies with available data for both 2016
and 2017.Source: Table 2.3.1, Key Indicators for Asia and the Pacific 2018.
Click here for figure data
119Regional Trends and Tables
Money, Finance, and Prices 119
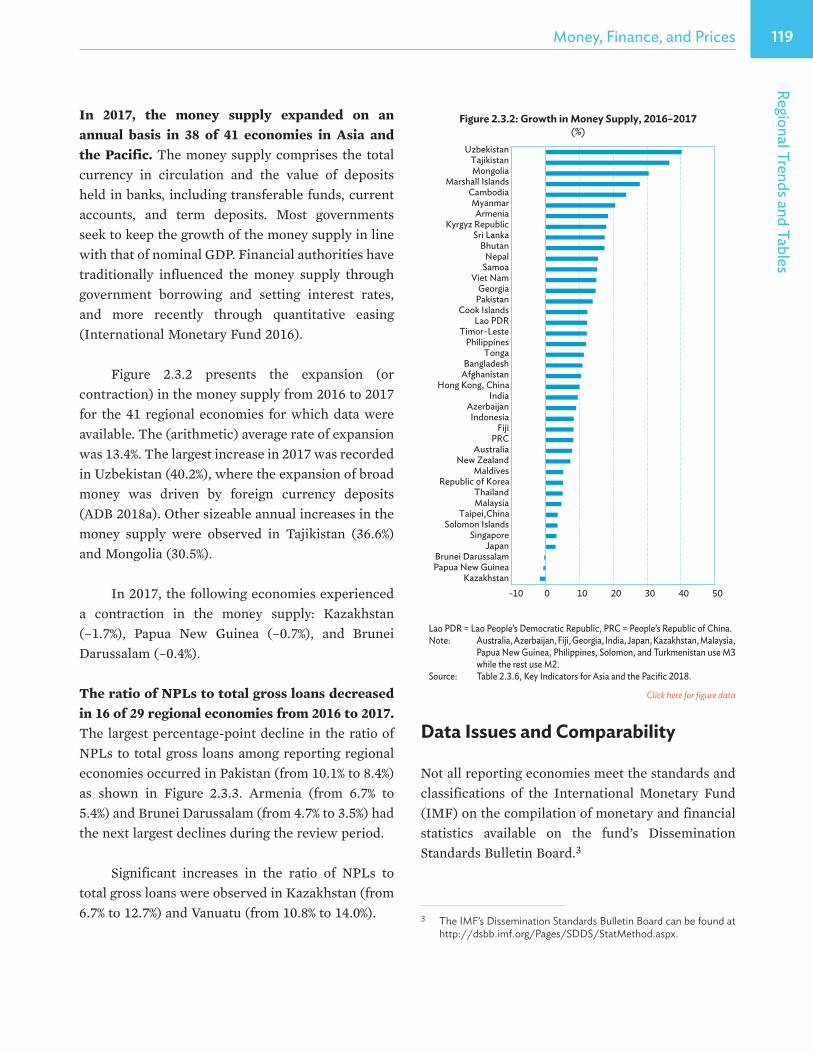
In 2017, the money supply expanded on an annual basis in 38 of 41 economies in Asia and the Pacific. The money supply comprises the total currency in circulation and the value of deposits held in banks, including transferable funds, current accounts, and term deposits. Most governments seek to keep the growth of the money supply in line with that of nominal GDP. Financial authorities have traditionally influenced the money supply through government borrowing and setting interest rates, and more recently through quantitative easing (International Monetary Fund 2016).
Figure 2.3.2 presents the expansion (or contraction) in the money supply from 2016 to 2017 for the 41 regional economies for which data were available. The (arithmetic) average rate of expansion was 13.4%. The largest increase in 2017 was recorded in Uzbekistan (40.2%), where the expansion of broad money was driven by foreign currency deposits (ADB 2018a). Other sizeable annual increases in the money supply were observed in Tajikistan (36.6%) and Mongolia (30.5%).
In 2017, the following economies experienced a contraction in the money supply: Kazakhstan (–1.7%), Papua New Guinea (–0.7%), and Brunei Darussalam (–0.4%).
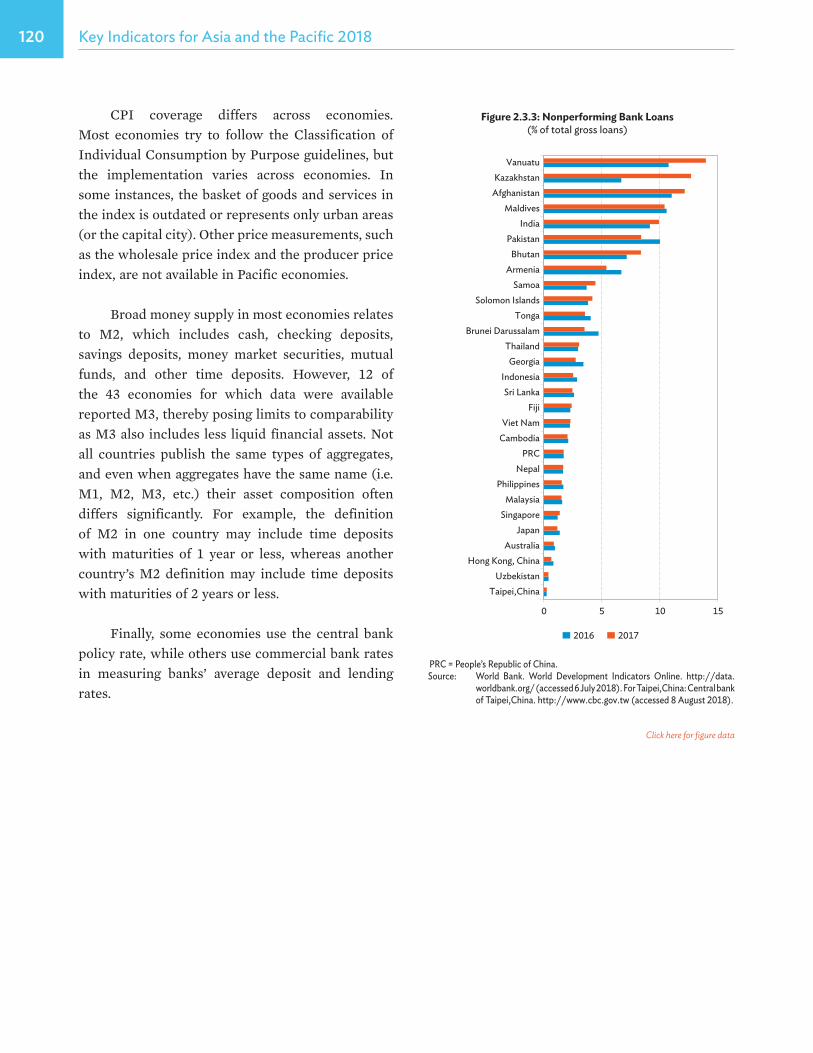
The ratio of NPLs to total gross loans decreased in 16 of 29 regional economies from 2016 to 2017. The largest percentage-point decline in the ratio of NPLs to total gross loans among reporting regional economies occurred in Pakistan (from 10.1% to 8.4%) as shown in Figure 2.3.3. Armenia (from 6.7% to 5.4%) and Brunei Darussalam (from 4.7% to 3.5%) had the next largest declines during the review period.
Significant increases in the ratio of NPLs to total gross loans were observed in Kazakhstan (from 6.7% to 12.7%) and Vanuatu (from 10.8% to 14.0%).
Figure 2.3.2: Growth in Money Supply, 2016–2017 (%)
-10 0 10 20 30 40 50Kazakhstan
Papua New GuineaBrunei Darussalam
JapanSingapore
Solomon IslandsTaipei,China
MalaysiaThailand
Republic of KoreaMaldives
New ZealandAustralia
PRCFiji
IndonesiaAzerbaijan
IndiaHong Kong, China
AfghanistanBangladesh
TongaPhilippines
Timor-LesteLao PDR
Cook IslandsPakistanGeorgia
Viet NamSamoaNepal
BhutanSri Lanka
Kyrgyz RepublicArmenia
MyanmarCambodia
Marshall IslandsMongoliaTajikistan
Uzbekistan
Lao PDR = Lao People’s Democratic Republic, PRC = People’s Republic of China.Note: Australia, Azerbaijan, Fiji, Georgia, India, Japan, Kazakhstan, Malaysia,
Papua New Guinea, Philippines, Solomon, and Turkmenistan use M3 while the rest use M2.
Source: Table 2.3.6, Key Indicators for Asia and the Pacific 2018.
Data Issues and Comparability
Not all reporting economies meet the standards and classifications of the International Monetary Fund (IMF) on the compilation of monetary and financial statistics available on the fund’s Dissemination Standards Bulletin Board.3
3 The IMF’s Dissemination Standards Bulletin Board can be found at http://dsbb.imf.org/Pages/SDDS/StatMethod.aspx.
Click here for figure data
120 Key Indicators for Asia and the Pacific 2018120
CPI coverage differs across economies. Most economies try to follow the Classification of Individual Consumption by Purpose guidelines, but the implementation varies across economies. In some instances, the basket of goods and services in the index is outdated or represents only urban areas (or the capital city). Other price measurements, such as the wholesale price index and the producer price index, are not available in Pacific economies.
Broad money supply in most economies relates to M2, which includes cash, checking deposits, savings deposits, money market securities, mutual funds, and other time deposits. However, 12 of the 43 economies for which data were available reported M3, thereby posing limits to comparability as M3 also includes less liquid financial assets. Not all countries publish the same types of aggregates, and even when aggregates have the same name (i.e. M1, M2, M3, etc.) their asset composition often differs significantly. For example, the definition of M2 in one country may include time deposits with maturities of 1 year or less, whereas another country’s M2 definition may include time deposits with maturities of 2 years or less.
Finally, some economies use the central bank policy rate, while others use commercial bank rates in measuring banks’ average deposit and lending rates.
Figure 2.3.3: Nonperforming Bank Loans (% of total gross loans)
0 5 10 15
Taipei,ChinaUzbekistan
Hong Kong, ChinaAustralia
JapanSingapore
MalaysiaPhilippines
NepalPRC
CambodiaViet Nam
FijiSri Lanka
IndonesiaGeorgia
ThailandBrunei Darussalam
TongaSolomon Islands
SamoaArmenia
BhutanPakistan
IndiaMaldives
AfghanistanKazakhstan
Vanuatu
2016 2017
PRC = People’s Republic of China.Source: World Bank. World Development Indicators Online. http://data.
worldbank.org/ (accessed 6 July 2018). For Taipei,China: Central bank of Taipei,China. http://www.cbc.gov.tw (accessed 8 August 2018).
Click here for figure data

121Regional Trends and Tables
Money, Finance, and PricesPrices
Table 2.3.1: Growth Rates of Consumer Price Indexa
(%)
ADB Regional Member 2000 2005 2010 2012 2013 2014 2015 2016 2017Developing ADB Member Economies Central and West Asia
Afghanistan ... 11.9 -4.5 8.4 6.4 5.6 -0.6 4.0 7.2Armenia -0.8 0.6 8.2 2.6 5.8 3.0 3.7 -1.4 1.0Azerbaijan 1.8 9.6 5.7 1.1 2.4 1.4 4.0 12.4 12.9Georgia 4.6 8.2 7.1 -0.9 -0.5 3.1 4.0 2.1 6.0Kazakhstan 13.2 7.6 7.1 5.1 5.8 6.7 6.6 14.6 7.4Kyrgyz Republic 18.7 4.3 8.0 2.8 6.6 7.5 6.5 0.4 3.2Pakistan 3.6 9.3 10.1 11.0 7.4 8.6 4.5 2.9 4.2Tajikistan 60.6 7.1 9.8 6.4 3.7 7.4 5.1 6.1 6.7Turkmenistan 8.0 10.7 4.4 5.3 6.8 6.0 7.4 3.6 8.0Uzbekistan 24.9 6.4 7.6 7.2 7.0 6.4 5.5 5.6 9.5
East AsiaChina, People’s Republic of 0.4 1.8 3.3 2.6 2.6 2.0 1.4 2.0 1.6Hong Kong, China -3.7 0.8 2.3 4.1 4.3 4.4 3.0 2.4 1.5Korea, Republic ofb 2.3 2.8 2.9 2.2 1.3 1.3 0.7 1.0 1.9Mongolia 8.0 (2001) 9.5 13.0 14.0 12.5 10.5 1.9 1.1 6.4Taipei,China 1.3 2.3 1.0 1.9 0.8 1.2 -0.3 1.4 0.6
South AsiaBangladesh 2.8 6.5 6.8 8.7 6.8 7.3 6.4 5.9 5.4Bhutan 4.0 5.3 7.0 10.9 8.8 8.3 4.5 3.2 5.0India 3.7 4.2 10.4 9.9 12.2 5.8 4.9 4.6 3.7Maldives -1.2 1.3 6.1 10.9 3.8 2.1 1.0 0.5 2.8Nepal 3.4 4.6 9.5 8.3 9.9 9.1 7.2 9.9 4.5Sri Lankac 6.2 11.0 6.2 7.5 6.9 5.1 2.2 4.0 6.5
Southeast AsiaBrunei Darussalam 1.2 1.1 0.4 0.1 0.4 -0.2 -0.4 -0.7 -0.2Cambodiac -0.8 5.8 4.0 2.9 2.9 3.9 1.2 3.0 2.9Indonesiad 3.8 10.5 5.1 4.3 7.0 6.4 6.4 3.5 3.8Lao People’s Democratic Republic 23.2 7.2 6.0 4.3 6.4 4.1 1.3 1.6 0.8Malaysia 1.5 2.9 1.7 1.6 2.1 3.2 2.1 2.1 3.7Myanmar -0.2 9.4 7.7 1.5 8.9 5.0 9.5 6.9 4.6Philippines 6.7 6.5 3.8 3.2 2.6 3.6 0.7 1.3 2.9Singapore 1.3 0.5 2.8 4.6 2.4 1.0 -0.5 -0.5 0.6Thailand 1.6 4.4 3.3 3.0 2.2 1.9 -0.9 0.2 0.7Viet Nam -0.3 (2001) 8.3 9.2 9.2 6.6 4.1 0.6 2.7 3.5
The PacificCook Islands 3.2 2.5 -0.3 3.0 1.9 2.1 1.9 -0.3 -0.1Fiji 1.1 2.5 (2006) 3.7 3.4 2.9 0.6 1.4 3.9 3.3Kiribatic 0.4 -0.3 -3.0 -3.0 -1.5 2.1 0.6 1.9 0.4Marshall Islandsc 0.9 3.5 1.8 4.3 1.9 1.1 -2.2 -1.5 0.0*Micronesia, Federated States of 1.8 4.1 3.6 6.3 2.1 0.7 0.0 -1.0 ...Nauru 2.3 9.8 -4.6 -0.8 -1.1 0.3 9.8 8.2 6.0Palau -1.8 (2001) 3.9 1.4 3.6 3.4 4.2 0.9 -1.0 1.2Papua New Guinea 15.6 1.8 6.0 4.6 5.0 5.2 6.0 6.7 5.4Samoa 0.9 1.9 0.8 2.1 0.6 -0.4 0.7 1.3 1.6Solomon Islandsc 7.1 7.2 0.9 5.9 5.4 5.2 -0.6 0.5 0.5Timor-Leste ... 1.6 5.2 10.9 9.5 0.7 0.6 -1.3 0.6Tonga 6.3 8.7 3.5 1.1 0.8 2.5 -1.1 2.6 7.4Tuvalu 3.9 3.2 -1.9 1.4 2.0 1.1 3.1 3.5 4.1Vanuatu 2.5 0.8 2.8 1.4 1.5 0.8 2.5 0.8 3.1
Developed ADB Member EconomiesAustralia 2.4 2.4 2.3 2.3 2.3 2.7 1.7 1.4 1.7Japan -0.7 -0.3 -0.7 -0.1 0.3 2.8 0.8 -0.1 0.5New Zealand 2.6 3.0 2.3 1.1 1.1 1.2 0.3 0.6 1.9
... = data not available, 0.0 = magnitude is less than half of unit employed, * = preliminary, ADB = Asian Development Bank.
a Data refer to the whole economy, unless otherwise indicated.b Data refer to all cities.c Data refer to capital city.d Consumer price index data for Indonesia for 2000–2002 refer to the consumer price indexes for 43 cities; for 2003–2007, 45 cities; for 2008–2013, 66 cities; and for
2014–2017, 82 cities.
Source: Economy sources.Click here for table data

122 Key Indicators for Asia and the Pacific 2018Prices
Table 2.3.2: Growth Rates of Food Consumer Price Indexa (%)
ADB Regional Member 2000 2005 2010 2012 2013 2014 2015 2016 2017Developing ADB Member Economies Central and West Asia
Afghanistan ... 9.1 -9.1 7.0 5.2 10.0 -0.6 4.9 10.0Armenia -2.2 0.7 8.6 2.3 5.8 2.2 3.0 -3.0 4.0Azerbaijan 2.3 10.9 7.2 0.8 2.2 1.0 6.1 14.7 16.4Georgia 7.5 8.3 22.2 -2.8 6.0 2.6 4.8 3.5 9.1Kazakhstan 16.0 8.1 6.2 4.5 4.3 6.6 6.4 12.7 8.6Kyrgyz Republic 18.5 7.0 6.5 -4.1 5.3 8.2 3.7 -6.5 2.5Pakistan 2.2 12.5 12.9 11.0 7.1 9.0 3.5 2.1 3.8Tajikistan 66.3 8.3 13.4 5.6 3.2 9.7 4.3 6.8 7.5Turkmenistan ... ... ... ... ... ... ... ... ...Uzbekistan 18.9 4.2 4.8 5.1 4.9 3.9 2.8 -0.4 7.8
East AsiaChina, People’s Republic of -2.6 2.9 7.2 4.8 4.7 3.1 2.3 3.8 -0.4Hong Kong, China -2.2 1.7 3.4 6.2 4.3 3.7 3.2 3.5 1.1Korea, Republic ofb 1.1 3.1 5.9 3.8 0.9 0.3 5.5 2.1 3.2Mongolia ... 26.3 (2007) 17.0 20.9 13.3 7.0 -5.1 1.4 6.8Taipei,China 0.4 8.4 1.7 5.0 1.2 3.8 3.6 7.3 -1.1
South AsiaBangladesh 2.6 7.9 6.3 7.7 5.2 8.6 6.7 4.9 6.0Bhutan 1.0 5.7 8.8 13.9 8.7 10.4 3.2 3.9 7.1India 1.6 4.2 10.0 11.2 15.8 6.2 4.6 4.4 1.9Maldives -4.8 7.8 7.5 17.6 7.2 0.7 0.5 0.6 5.6Nepal 0.6 3.8 15.3 7.7 9.6 11.6 9.6 10.9 1.9Sri Lankac 4.5 11.4 6.9 4.7 7.9 4.3 5.5 6.1 9.2
Southeast AsiaBrunei Darussalam – 0.5 1.0 -0.0 0.1 -0.2 0.8 -0.9 0.3Cambodiac -3.4 8.4 4.4 3.3 3.9 4.9 4.1 5.7 3.4Indonesiad -4.8 10.0 9.4 5.9 12.0 ... 7.2 7.2 2.1Lao People’s Democratic Republic 18.0 7.7 7.7 5.9 12.1 6.9 4.4 3.9 0.1Malaysia 2.1 3.7 2.5 2.7 3.6 3.4 3.6 3.9 4.5Myanmar -2.6 9.3 7.2 -1.5 5.4 6.9 13.1 9.2 4.4Philippines 3.0 6.4 4.0 2.4 2.5 5.9 1.8 1.6 3.0Singapore 0.5 1.3 1.4 2.3 2.1 2.9 1.9 2.1 1.4Thailand -1.1 4.8 5.4 4.8 3.4 3.9 1.1 1.6 –Viet Nam ... 8.7 (2006) 10.7 8.1 2.7 4.0 1.5 2.5 -1.5
The PacificCook Islands 3.4 1.1 2.9 3.1 2.6 3.3 -0.1 1.3 0.3Fiji -3.2 1.8 (2006) 4.1 4.3 3.5 1.9 4.7 6.0 -2.1Kiribatic 0.7 -4.8 -11.1 -2.4 -0.6 0.0 -0.5 1.2 -0.2Marshall Islandsc -0.8 1.1 -1.4 4.7 2.5 1.9 2.2 -1.3 -0.5*Micronesia, Federated States of 1.1 3.4 2.2 4.5 2.6 0.8 0.8 -1.3 ...Nauru ... ... -0.4 -0.0 0.8 ... ... ... ...Palau -4.6 (2001) 0.8 0.8 4.0 2.9 5.1 6.7 -2.0 1.1Papua New Guinea 13.6 3.5 5.4 -1.4 -0.9 4.8 4.9 5.1 2.8Samoa -0.1 0.3 -6.6 1.9 0.7 -3.4 3.3 5.9 1.1Solomon Islandsc 6.6 5.6 -1.4 4.4 3.6 5.3 -2.3 2.0 0.7Timor-Leste ... 0.4 6.0 12.4 12.0 0.8 0.6 -1.8 0.8Tonga 0.4 6.0 3.0 1.5 1.8 3.7 1.9 1.3 8.6Tuvalu 1.1 5.5 -5.9 0.2 0.1 0.6 4.0 3.4 4.5Vanuatu 2.0 0.5 4.5 2.1 1.5 1.7 3.6 2.3 6.8
Developed ADB Member EconomiesAustralia 2.1 1.6 1.6 0.7 0.5 1.3 2.1 0.1 1.8Japan -2.0 -0.9 -0.2 0.1 -0.2 3.9 3.1 1.7 0.7New Zealand 3.3 2.0 2.4 1.1 1.6 1.1 1.5 0.6 2.9
... = data not available, – = magnitude equals zero, -0.0 or 0.0 = magnitude is less than half of unit employed, * = preliminary, ADB = Asian Development Bank.
a Coverage of food varies by economy. Data refer to the whole economy, unless otherwise indicated.b Refers to all cities. c Refers to capital city.d Consumer price index data for Indonesia for 2000–2002 refer to the consumer price indexes for 43 cities; for 2003–2007, 45 cities; for 2008–2013, 66 cities; and for
2014–2017, 82 cities.
Source: Economy sources. Click here for table data

123Regional Trends and Tables
Money, Finance, and PricesPrices
Table 2.3.3: Growth Rates of Nonfood Consumer Price Indexa (%)
ADB Regional Member 2000 2005 2010 2012 2013 2014 2015 2016 2017Developing ADB Member Economies Central and West Asia
Afghanistan ... 16.3 3.9 10.4 7.7 1.1 -0.5 3.2 4.5Armenia 3.0 0.5 9.6 4.6 4.6 1.7 5.6 -2.5 -1.8Azerbaijan 1.9 5.4 2.3 1.0 0.8 3.2 3.8 16.7 11.6Georgia 0.4 3.7 2.9 -0.6 0.3 1.6 4.9 0.8 5.4Kazakhstan 11.5 6.3 6.4 4.3 3.1 6.9 8.1 22.4 8.4Kyrgyz Republic 18.1 3.7 11.4 10.1 7.4 6.9 10.1 5.9 1.8Pakistan 4.3 7.1 8.3 11.0 7.5 8.3 5.3 3.4 4.4Tajikistan 44.2 2.7 5.5 6.7 6.1 2.9 7.8 5.7 4.4Turkmenistan ... ... ... ... ... ... ... ... ...Uzbekistan 36.6 4.9 5.3 4.9 5.5 7.6 6.3 10.2 11.7
East AsiaChina, People’s Republic of ... ... ... ... ... ... ... 1.3 2.4Hong Kong, China -4.1 0.5 2.1 3.7 4.4 4.5 3.0 2.4 1.5Korea, Republic ofb 2.4 2.7 2.4 1.9 1.4 1.5 -0.1 0.8 1.7Mongolia ... 10.3 (2007) 8.4 10.8 12.1 12.2 5.4 1.0 6.2Taipei,China 1.6 0.7 0.8 1.1 0.7 0.7 -1.1 0.1 1.0
South AsiaBangladesh 3.0 4.3 7.7 10.2 9.2 5.5 6.0 7.4 4.6Bhutan 9.2 5.1 6.1 9.3 8.7 6.9 5.4 2.8 3.6India ... ... ... ... ... ... ... ... ...Maldives ... ... ... ... 1.4 2.7 1.1 0.5 1.7Nepal 7.1 5.0 4.8 9.0 10.0 6.8 5.2 9.2 6.5Sri Lankac 10.1 10.7 5.4 13.2 6.1 5.4 1.0 3.1 5.5
Southeast AsiaBrunei Darussalam ... ... ... 0.3 0.4 -0.2 -0.7 -0.7 -0.3Cambodiac 1.2 3.9 3.8 2.7 2.0 2.7 -2.7 -3.0 4.1Indonesia ... ... ... ... ... ... ... ... ...Lao People’s Democratic Republic 30.4 6.7 4.2 3.1 2.0 1.8 -1.4 -0.7 1.6Malaysia 1.3 2.7 1.4 1.3 1.6 3.0 1.2 1.4 3.7Myanmar ... 9.4 8.8 7.4 12.9 2.1 3.8 3.1 4.9Philippines 9.3 6.8 3.8 3.7 2.0 2.2 -0.3 1.0 2.6Singapore 1.7 0.2 3.2 5.2 2.4 0.5 -1.2 -1.3 0.3Thailand 3.2 4.3 2.1 1.8 1.5 0.8 -2.0 -0.6 1.2Viet Nam ... 6.4 (2006) 9.1 8.4 4.6 2.9 -2.2 -1.3 3.5
The PacificCook Islands 3.1 3.0 -1.6 2.9 1.5 1.6 2.8 -0.9 -0.3Fiji 3.7 3.4 (2006) 3.5 3.0 2.7 -0.3 0.3 3.4 6.4Kiribatic -7.7 -1.9 4.5 -3.6 -2.2 3.7 1.4 2.4 0.8Marshall Islandsc 3.1 5.0 3.8 4.1 1.5 0.6 -5.0 -1.6 0.4*Micronesia, Federated States of 2.5 4.7 4.6 7.5 1.8 0.7 -0.5 -0.8 ...Nauru ... ... -9.5 -0.4 1.0 ... ... ... ...Palau 0.3 (2001) 6.3 1.8 3.2 3.8 3.4 -4.0 -0.1 1.3Papua New Guinea 17.0 0.6 6.5 8.0 8.0 5.4 6.5 7.4 ...Samoa 1.6 3.3 3.4 2.1 0.6 2.9 -2.8 -3.2 2.1Solomon Islandsc 8.1 8.4 3.4 7.4 7.1 5.1 1.0 -0.8 0.5Timor-Leste ... 2.5 2.7 7.1 2.8 1.0 1.1 -0.5 -0.3Tonga 11.5 10.9 4.0 0.9 -0.1 1.6 -3.7 3.7 6.4Tuvalu 5.4 2.1 1.8 2.3 3.4 1.4 2.5 3.6 3.9Vanuatu ... ... ... ... ... ... ... ... ...
Developed ADB Member EconomiesAustralia 2.5 2.6 2.5 2.6 2.6 3.0 1.6 1.6 1.7Japan ... ... ... ... ... ... ... ... ...New Zealand 2.3 3.4 2.3 1.1 0.9 1.3 -0.1 0.7 1.6
... = data not available, * = preliminary, ADB = Asian Development Bank.
a Coverage of nonfood varies by economy. Data refer to the whole economy, unless otherwise indicated.b Refers to all cities.c Refers to capital city.
Sources: Economy sources; and Asian Development Bank estimates based on consumer price index weights from economy sources. Click here for table data

124 Key Indicators for Asia and the Pacific 2018Prices
Table 2.3.4: Growth Rates of Wholesale and/or Producer Price Indexes (%)
ADB Regional Member 2000 2005 2010 2012 2013 2014 2015 2016 2017Developing ADB Member Economies Central and West Asia
Afghanistan ... ... ... ... ... ... ... ... ...Armenia 0.8 7.7 22.6 7.0 4.7 8.5 -0.8 1.5 3.9Azerbaijan 3.3 (2001) 17.3 30.5 4.5 -3.9 -5.1 -30.6 27.5 36.8Georgia 5.8 7.5 11.3 1.6 -2.0 2.9 7.5 -0.1 11.0Kazakhstan 38.0 23.7 25.2 3.5 -0.3 9.5 -20.5 16.8 15.3Kyrgyz Republic 29.6 2.8 22.8 5.3 -2.1 1.5 8.8 6.4 1.7Pakistan 1.8 6.8 13.8 10.4 7.4 8.2 -0.3 -1.0 4.0Tajikistan 39.2 10.4 27.2 6.1 2.1 4.7 3.0 14.7 ...Turkmenistan ... ... ... ... ... ... ... ... ...Uzbekistan 60.9 25.6 15.6 14.5 11.7 13.6 13.5 14.8 17.5
East AsiaChina, People’s Republic of 2.8 4.9 5.5 -1.7 -1.9 -1.9 -5.2 -2.0 ...Hong Kong, China 0.2 0.8 6.0 0.1 -3.1 -1.7 -2.7 1.3 3.8Korea, Republic of 2.1 2.1 3.8 0.7 -1.6 -0.5 -4.0 -1.8 3.5Mongolia ... ... ... ... ... ... ... ... ...Taipei,China 1.8 0.6 5.5 -1.2 -2.4 -0.6 -8.9 -3.0 0.9
South AsiaBangladesha -0.4 3.4 ... ... ... ... ... ... ...Bhutan ... ... ... ... ... ... ... ... ...India 7.2 4.5 9.6 6.9 5.2 1.3 -3.7 1.7 ...Maldives -2.4 (2002) 4.6 3.9 ... 0.3 2.1 -2.4 ... ...Nepal 1.4 (2001) 7.3 12.6 6.4 9.0 8.3 6.1 6.3 2.7Sri Lanka 1.7 11.5 2.6 3.5 9.2 3.2 1.0 4.2 ...
Southeast AsiaBrunei Darussalam ... ... ... ... ... ... ... ... ...Cambodia ... ... ... ... ... ... ... ... ...Indonesiab 12.5 15.3 4.9 5.1 -1.6 5.4 4.4 7.9 4.6Lao People’s Democratic Republic ... ... ... ... ... ... ... ... ...Malaysia -1.8 (2001) 3.8 (2006) 12.3 (2011) -0.4 -2.7 1.5 -7.4 -1.1 6.7Myanmar ... ... ... ... ... ... ... ... ...Philippines 5.8 11.4 5.9 1.1 1.6 2.7 -3.9 1.2 4.4Singapore 10.0 9.6 4.7 0.5 -2.7 -3.3 -15.3 -6.9 7.0Thailand 3.9 9.1 9.4 1.0 0.3 0.1 -4.1 -1.2 0.7Viet Nam -0.2 4.4 12.6 3.4 5.3 3.3 -0.6 -0.6 2.8
The PacificCook Islands ... ... ... ... ... ... ... ... ...Fiji ... ... ... ... ... ... ... ... ...Kiribati ... ... ... ... ... ... ... ... ...Marshall Islands ... ... ... ... ... ... ... ... ...Micronesia, Federated States of ... ... ... ... ... ... ... ... ...Nauru ... ... ... ... ... ... ... ... ...Palau ... ... ... ... ... ... ... ... ...Papua New Guinea ... ... ... ... ... ... ... ... ...Samoa ... ... ... ... ... ... ... ... ...Solomon Islands ... ... ... ... ... ... ... ... ...Timor-Leste ... ... ... ... ... ... ... ... ...Tonga ... ... ... ... ... ... ... ... ...Tuvalu ... ... ... ... ... ... ... ... ...Vanuatu ... ... ... ... ... ... ... ... ...
Developed ADB Member EconomiesAustralia 2.6 3.6 -0.1 2.0 1.2 2.1 1.0 1.5 1.0Japan 0.0 1.6 -0.1 -0.9 1.3 1.1 -3.0 -3.5 2.3New Zealand 5.2 3.4 2.3 0.2 2.2 1.1 -1.3 0.8 4.8
... = data not available, 0.0 = magnitude is less than half of unit employed, ADB = Asian Development Bank.
a For agricultural and industrial products only.b Change of the wholesale price index for 2013 was estimated by rebasing January–October 2013 and 2012 data to 2005.
Source: Economy sources.Click here for table data

125Regional Trends and Tables
Money, Finance, and PricesPrices
Table 2.3.5: Growth Rates of Gross Domestic Product Deflator (%)
ADB Regional Member 2000 2005 2010 2012 2013 2014 2015 2016 2017Developing ADB Member Economies Central and West Asia
Afghanistan ... 11.6 14.3 9.3 3.5 -1.0 5.1 5.2 -0.5Armenia -1.4 3.2 7.8 -1.2 3.4 2.3 1.2 0.3 2.2Azerbaijan 12.5 16.1 13.6 2.9 0.4 -1.3 -8.9 14.7 16.0Georgia 4.7 7.9 8.5 1.1 -0.8 3.8 5.9 4.2 6.5Kazakhstan 17.4 17.9 19.6 4.8 9.5 5.8 1.9 13.6 5.6Kyrgyz Republic 27.2 7.1 10.0 8.7 3.2 8.4 3.4 6.1 4.6*Pakistan 5.3 (2001) 7.8 10.9 6.0 7.0 7.4 4.1 0.4 4.0Tajikistan 22.7 9.5 12.4 11.8 4.3 5.5 0.2 5.2 ...Turkmenistan 21.3 7.0 2.3 8.3 1.2 0.6 -4.9 -5.0 -1.6Uzbekistan 47.1 21.4 16.5 14.9 14.2 11.7 9.2 9.6 20.8
East AsiaChina, People’s Republic of 2.0 3.8 6.7 2.4 2.2 0.8 0.1 ... ...Hong Kong, China -3.4 -0.2 0.3 3.5 1.8 2.9 3.6 1.7 2.9Korea, Republic of 1.1 1.0 3.2 1.0 0.9 0.6 2.4 2.0 2.3Mongolia 12.0 20.1 ... 12.8 2.9 7.4 1.7 2.2 8.0Taipei,China 7.6 -1.5 -1.5 0.5 1.5 1.7 3.3 0.9 -1.2
South AsiaBangladesh 1.9 5.1 7.1 8.2 7.2 5.7 5.9 6.7 6.3Bhutan 3.7 5.9 6.0 9.2 5.9 7.6 3.4 7.9 ...India 3.6 4.2 9.0 7.9 6.2 3.3 2.1 3.5 3.1Maldives ... 9.2 2.9 6.8 6.4 4.6 5.9 -0.7 ...Nepal 4.6 5.8 14.4 6.6 6.1 9.0 5.1 5.0 8.0Sri Lanka 6.7 10.4 7.3 10.8 6.2 2.9 0.6 4.1 8.3
Southeast AsiaBrunei Darussalam 29.0 18.8 5.3 1.2 -2.8 -1.8 -17.6 -9.2 5.0Cambodia -3.1 6.1 3.1 1.3 1.0 3.1 1.2 3.5 3.1Indonesia 9.6 14.3 8.2 3.8 5.0 5.4 4.0 2.4 4.2Lao People’s Democratic Republic 21.8 7.8 3.1 ... 6.5 5.7 2.3 3.0 1.5Malaysia -1.6 (2001) 4.0 (2006) 5.4 (2011) 1.0 0.2 2.5 -0.4 2.0 3.8Myanmar 2.5 19.2 7.0 3.1 4.4 4.2 4.1 3.6 7.2Philippines 5.7 5.8 4.2 2.0 2.0 3.2 -0.6 1.7 2.3Singapore 3.7 2.2 0.0 0.6 -0.2 -0.3 3.6 0.0 0.9Thailand 1.3 5.1 4.1 1.9 1.8 1.4 0.9 2.4 2.3Viet Nam 3.4 9.0 12.1 10.9 4.8 3.7 -0.2 1.1 4.1
The PacificCook Islands 2.2 -2.6 6.2 -1.7 0.0 -2.4 3.3 -4.4 3.2Fiji -2.4 3.1 (2006) 2.5 3.3 2.3 4.1 3.7 4.9 ...Kiribati 3.2 -0.3 (2006) 1.2 -0.4 0.1 4.1 2.9 7.3 ...Marshall Islands -3.0 2.0 1.5 3.2 0.2 -3.2 -1.5 6.1 9.3*Micronesia, Federated States of 1.1 2.1 3.8 7.2 0.8 2.8 -5.5 4.7 0.5*Nauru ... 1.6 -18.4 16.4 -32.8 -11.8 -8.4 5.7 3.6Palau 1.7 (2001) 6.0 1.0 6.8 6.6 6.1 8.4 3.2 0.0Papua New Guinea 13.1 7.9 9.9 -0.6 3.6 5.8 5.0 6.6 5.8*Samoa 1.1 5.1 2.0 2.9 0.8 1.5 0.2 -0.1 3.0Solomon Islands 6.9 8.8 1.8 4.2 6.8 1.9 4.0 2.9 ...Timor-Leste 7.9 (2001) 23.8 26.5 11.9 -4.8 -3.2 -36.5 -19.5 ...Tonga 7.4 6.7 3.7 2.3 0.6 1.1 2.7 0.4 3.0Tuvalu 6.1 (2001) 0.7 2.5 0.8 2.0 4.9 4.6 7.7 1.7Vanuatu 2.4 0.4 2.6 0.4 2.7 2.0 4.5 1.8 ...
Developed ADB Member EconomiesAustralia 2.6 3.7 1.2 1.8 -0.1 1.4 -0.7 -0.5 3.8Japan -1.4 -1.0 -1.9 -0.8 -0.3 1.7 2.1 0.3 -0.2New Zealand 2.3 2.5 2.9 -0.3 3.3 2.3 0.2 1.8 3.4
... = data not available, 0.0 = magnitude is less than half of unit employed, * = preliminary, ADB = Asian Development Bank.
Source: Economy sources.Click here for table data

126 Key Indicators for Asia and the Pacific 2018Money and Finance
Table 2.3.6: Growth Rates of Money Supplya (%)
ADB Regional Member 2000 2005 2010 2012 2013 2014 2015 2016 2017Developing ADB Member Economies Central and West Asia
Afghanistan ... 38.3 (2006) 39.3 14.3 7.1 6.0 3.7 5.5 10.4Armenia 38.6 27.8 11.8 19.5 14.8 8.3 10.8 17.5 18.5Azerbaijanb 21.8 22.3 24.3 20.7 15.0 11.8 -1.3 -1.9 9.0Georgiab 39.2 27.9 30.1 11.4 24.5 13.8 19.3 20.2 14.8Kazakhstanb 45.0 25.2 13.3 7.9 10.2 10.4 33.8 15.6 -1.7Kyrgyz Republic 12.1 9.9 21.1 23.8 22.8 3.0 14.9 14.6 17.9Pakistan 9.4 19.8 13.0 13.4 16.9 12.6 12.8 14.5 13.9Tajikistan 43.3 62.9 17.6 22.8 18.6 3.5 12.2 56.7 36.6Turkmenistanb 94.6 5.6 74.2 37.4 26.0 10.0 18.0 ... ...Uzbekistan 37.1 54.4 52.4 29.2 23.0 14.9 25.2 23.5 40.2
East AsiaChina, People’s Republic of 12.3 16.5 19.7 14.4 13.6 11.0 13.3 11.3 8.2Hong Kong, China 7.8 5.1 8.1 11.1 12.4 9.5 5.5 7.7 10.0Korea, Republic of 5.2 7.0 6.0 4.8 4.6 8.1 8.2 7.1 5.1Mongolia 17.6 34.6 62.5 18.7 24.2 12.5 -5.5 21.0 30.5Taipei,China 6.5 6.6 5.5 3.5 5.8 6.1 5.8 3.6 3.6
South AsiaBangladesh 18.6 16.7 22.4 17.4 16.7 16.1 12.4 16.3 10.9Bhutan 16.1 13.2 16.5 5.9 3.3 26.0 3.8 23.0 17.4Indiab 16.8 21.1 16.1 13.6 13.4 10.9 13.4 6.9 9.5Maldives 4.2 10.6 14.6 4.9 18.4 14.9 12.1 -0.2 5.2Nepal 21.8 8.3 14.1 22.7 16.4 19.1 19.9 19.5 15.5Sri Lanka 12.9 19.1 18.0 18.3 18.0 13.1 17.2 18.9 17.5
Southeast AsiaBrunei Darussalam 1.9 (2002) -4.5 4.8 0.9 1.5 3.2 -1.8 1.5 -0.4Cambodia 26.9 16.1 20.0 20.9 14.6 29.9 14.7 17.9 23.8Indonesia 15.6 16.3 15.4 15.0 12.8 11.9 9.0 10.0 8.3Lao People’s Democratic Republic 45.9 8.2 39.5 31.0 17.0 25.2 14.7 10.9 12.2Malaysiab 5.1 8.3 6.8 9.0 7.3 7.0 2.7 3.1 4.7Myanmar 42.2 27.3 42.5 32.6 31.4 21.0 30.7 17.4 20.5Philippinesb 4.6 16.8 10.0 9.4 31.8 11.2 9.4 12.8 11.9Singapore -2.0 6.2 8.6 7.2 4.3 3.3 1.5 8.0 3.2Thailand 4.0 6.1 10.9 10.4 7.3 4.7 4.4 4.2 5.0Viet Nam 56.2 29.7 33.3 18.5 18.8 17.7 16.2 18.4 15.0
The PacificCook Islands 4.8 -5.2 -2.8 19.2 -25.6 3.0 9.6 -2.7 12.3Fijib -2.1 15.2 3.5 6.3 19.0 10.1 14.3 4.8 8.2Kiribati ... ... ... ... ... ... ... ... ...Marshall Islands 16.6 -0.8 9.4 -13.4 6.8 31.0 28.6 19.9 27.8Micronesia, Federated States of ... ... ... ... ... ... ... ... ...Nauru ... ... ... ... ... ... ... ... ...Palau ... ... ... ... ... ... ... ... ...Papua New Guineab 5.4 29.5 11.4 11.0 6.7 3.4 8.0 10.9 -0.7Samoa 16.4 15.6 6.4 -1.6 6.4 9.6 6.0 9.2 15.2Solomon Islandsb 0.4 46.1 13.3 17.4 12.4 5.1 15.5 13.4 3.5Timor-Leste 155.5 (2001) 17.6 18.2 26.2 22.9 19.9 7.1 14.2 12.1Tonga 8.3 12.1 5.1 -1.6 7.0 8.0 2.4 12.6 11.3Tuvalu ... ... ... ... ... ... ... ... ...Vanuatu 5.5 11.6 -6.0 -0.6 -5.6 8.6 11.4 10.6 ...
Developed ADB Member EconomiesAustraliab 7.3 8.9 4.5 9.1 6.5 7.0 6.7 5.8 7.8Japanc 1.9 0.4 1.9 2.2 3.4 2.8 2.5 3.2 2.9New Zealandd 6.6 7.8 3.2 6.0 5.0 6.3 8.1 6.4 7.3
... = data not available, ADB = Asian Development Bank.
a Data are based on M2 unless otherwise stated. b Refers to M3.c Refers to M3, except for 2000 (M2).d Refers to M3, except for 2017 (M2).
Source: Economy sources.Click here for table data

127Regional Trends and Tables
Money, Finance, and PricesMoney and Finance
Table 2.3.7: Money Supplya (% of GDP)
ADB Regional Member 2000 2005 2010 2012 2013 2014 2015 2016 2017Developing ADB Member Economies Central and West Asia
Afghanistan 11.0 (2002) 17.9 30.3 29.3 28.5 29.6 29.7 28.8 29.8Armenia 14.7 16.3 26.3 33.7 33.9 34.7 36.8 43.0 46.4Azerbaijanb 10.8 14.7 24.8 30.6 33.2 36.5 39.1 34.6 32.5Georgiab 10.1 16.9 29.9 30.2 36.6 38.4 42.0 47.2 48.4Kazakhstanb 15.3 27.2 38.9 33.9 32.2 32.3 41.9 42.2 37.7Kyrgyz Republic 11.3 21.1 31.4 31.7 34.0 31.1 33.3 34.4 37.1Pakistan 33.0 41.6 37.7 37.0 38.8 38.9 40.2 43.5 45.0Tajikistan 5.8 11.2 12.0 13.1 13.9 12.8 13.5 18.8 22.9Turkmenistanb 19.4 10.5 17.3 36.9 41.7 41.4 48.2 ... ...Uzbekistan 12.2 14.4 22.4 24.4 24.3 23.2 24.6 26.1 28.8
East AsiaChina, People’s Republic of 134.2 158.0 175.7 180.3 185.9 190.7 202.1 208.5 202.7Hong Kong, China 272.9 310.1 401.7 439.4 470.3 487.2 484.4 502.2 516.9Korea, Republic of 111.4 111.1 131.2 133.3 134.4 139.8 143.7 146.6 146.2Mongolia 21.1 37.5 48.0 45.6 49.3 47.8 43.4 50.8 58.4Taipei,China 182.6 201.9 219.2 228.6 233.2 234.0 237.8 240.8 245.4
South AsiaBangladesh 31.5 40.9 45.5 49.0 50.3 52.1 52.0 52.9 51.4Bhutan 50.8 57.8 70.5 57.8 55.2 61.4 57.7 63.0 65.6Indiab 60.3 73.6 83.6 84.3 84.7 84.6 86.9 83.9 83.6Maldives 41.1 45.2 47.9 45.1 46.8 47.8 49.5 46.9 44.7Nepal 49.0 51.0 60.3 74.0 77.6 79.7 88.2 99.9 99.7Sri Lanka 37.6 41.7 28.3 29.7 31.9 33.4 37.1 40.5 42.6
Southeast AsiaBrunei Darussalam 77.8 (2001) 57.8 67.3 58.7 62.6 67.5 80.8 92.6 86.7Cambodia 13.0 19.5 41.4 50.5 53.3 62.7 66.5 70.9 79.5Indonesia 53.8 43.4 36.0 38.4 39.1 39.5 39.4 40.3 39.9Lao People’s Democratic Republic 17.4 18.7 38.0 43.8 44.5 49.0 51.2 51.5 53.1Malaysiab 128.6 123.8 132.2 139.3 142.6 140.4 137.7 133.6 127.2Myanmar 32.7 21.6 23.6 31.7 36.8 39.5 46.4 49.7 52.3Philippinesb 39.9 41.8 49.8 49.7 60.0 61.0 63.3 65.6 67.3Singapore 103.4 103.6 125.0 130.9 130.2 129.8 124.4 131.3 129.7Thailand 122.4 104.1 109.0 121.1 124.4 127.0 127.7 125.9 124.3Viet Nam 50.5 75.6 129.3 114.1 122.8 131.5 143.6 158.3 163.7
The PacificCook Islands 42.0 44.0 62.6 61.4 46.3 46.1 47.0 45.3 48.3Fijib 42.4 58.9 67.6 67.7 74.2 74.7 78.7 77.1 76.7Kiribati ... ... ... ... ... ... ... ... ...Marshall Islands 54.6 52.9 60.7 45.6 47.2 64.2 84.3 93.4 105.4Micronesia, Federated States of ... ... ... ... ... ... ... ... ...Nauru ... ... ... ... ... ... ... ... ...Palau ... ... ... ... ... ... ... ... ...Papua New Guineab 31.2 33.6 34.0 38.2 37.9 33.1 32.5 33.1 30.1Samoa 38.2 41.1 45.0 38.3 40.2 42.6 43.8 45.0 50.5Solomon Islandsb 31.7 40.5 44.0 50.1 46.5 46.9 51.4 54.6 52.3Timor-Leste 4.6 4.2 7.4 6.1 8.9 14.8 20.7 29.1 ...Tonga 29.2 39.0 40.9 36.8 40.4 42.3 41.1 44.0 46.3Tuvalu ... ... ... ... ... ... ... ... ...Vanuatu 89.7 98.6 83.3 78.6 70.9 73.7 78.5 82.5 ...
Developed ADB Member EconomiesAustraliab 65.4 73.6 94.7 97.8 101.7 104.5 109.8 113.5 115.5Japanc 123.4 198.7 218.8 232.1 236.0 237.4 235.2 239.7 243.2New Zealandd 86.3 98.7 110.5 116.6 114.5 116.9 120.1 100.8 ...
... = data not available, ADB = Asian Development Bank, GDP = gross domestic product.
a Refers to M2, unless otherwise stated.b Refers to M3.c Refers to M3, except for 2000 (M2).d Refers to M3 until 2015.
Source: Economy sources.
Click here for table data

128 Key Indicators for Asia and the Pacific 2018Money and Finance
Table 2.3.8: Interest Rates on Savings and Time Deposits (% per annum, period averages)
ADB Regional Member
Savings Deposits Time Depositsa
2000 2005 2010 2017 2000 2005 2010 2017Developing ADB Member Economies Central and West Asia
Afghanistan ... 4.26 (2006) 5.10 1.56 ... 4.72 (2006) 8.94 2.11Armenia ... ... ... ... 20.72 6.66 10.70 9.64Azerbaijan ... ... ... ... 10.40 9.38 10.96 12.13Georgiab 10.98 6.79 8.71 4.02 9.85 10.23 11.60 6.06Kazakhstanb ... ... ... ... 7.53 10.29 9.84 11.21Kyrgyz Republicc ... ... ... ... 28.07 9.78 11.47 10.84Pakistanb 5.75 1.24 5.02 3.50 7.37 4.21 7.21 4.30Tajikistand 5.28 (2002) 3.63 3.83 1.40 14.84 (2002) 20.16 17.78 14.60Turkmenistan ... ... ... ... ... ... ... ...Uzbekistan ... ... ... ... ... ... ... 17.95
East AsiaChina, People’s Republic of 0.99 0.72 0.36 0.35 2.25 2.25 2.33 1.50Hong Kong, China 4.50 0.97 0.01 0.01 5.40 1.73 0.16 0.15Korea, Republic of 7.08 3.57 3.18 1.52 7.94 3.72 3.86 1.67Mongolia 13.80 12.60 10.70 13.00 ... ... ... ...Taipei,China 3.50 0.55 0.24 0.23 4.98 1.77 1.03 0.77
South AsiaBangladesh 5.81 4.19 4.88 3.16 8.97 8.31 9.00 6.43Bhutane 6.00 4.50 4.75 5.50 9.50 6.50 6.75 7.00India 4.00 3.50 3.50 4.00 (2016) 7.10 5.32 7.50 5.49 (2016)Maldivesf 5.50 2.25 2.25 1.48 6.50 4.50 3.75 2.66Nepal 5.25 3.38 7.00 4.01 6.88 3.63 8.13 10.39Sri Lanka 8.40 5.00 5.00 4.00 15.00 9.00 8.50 11.00
Southeast AsiaBrunei Darussalam ... 1.01 0.47 0.29 ... 1.61 0.75 0.70Cambodia 6.13 2.08 1.18 1.39 7.20 6.83 6.58 5.90Indonesia 8.86 4.32 3.92 1.47 12.17 10.95 7.88 6.79Lao People’s Democratic Republic ... ... ... ... ... ... ... ...Malaysia 2.72 1.41 0.94 0.96 4.24 3.70 2.81 3.09Myanmar ... ... ... ... ... ... ... ...Philippinesg 7.40 3.80 1.60 0.69 10.50 6.00 2.07 2.82Singapore 1.30 0.24 0.14 0.16 2.45 0.76 0.48 0.33Thailand 2.50 1.88 0.50 0.47 3.50 3.00 1.55 1.40Viet Nam 0.20 3.00 3.00 0.67 (2015) 6.24 8.40 11.50 6.32 (2015)
The PacificCook Islands ... ... ... ... ... ... ... ...Fiji ... ... ... ... ... ... ... ...Kiribati ... ... ... ... ... ... ... ...Marshall Islands ... ... ... ... ... ... ... ...Micronesia, Federated States of ... ... ... ... ... ... ... ...Nauru ... ... ... ... ... ... ... ...Palau ... ... ... ... ... ... ... ...Papua New Guinea 3.88 1.80 1.00 ... 9.38 1.30 4.80 ...Samoa 3.00 2.75 0.88 1.00 7.35 6.38 2.25 2.90Solomon Islands ... ... ... ... ... ... ... ...Timor-Leste 0.20 (2002) 0.75 0.75 0.27 – 1.28 1.33 0.71Tonga 3.15 3.36 1.51 2.35 5.13 5.93 3.45 5.36Tuvalu ... ... ... ... ... ... ... ...Vanuatu ... ... ... ... ... ... ... ...
Developed ADB Member EconomiesAustralia ... 5.40 4.50 1.65 5.90 4.55 6.00 2.25Japanh 0.09 0.01 0.04 0.00 0.24 0.03 0.10 0.03New Zealandi ... ... ... ... 6.49 6.90 4.72 3.30
... = data not available, – = magnitude equals zero, 0.00 = magnitude is less than half of unit employed, ADB = Asian Development Bank.
a Refers to interest rate on time deposits of 12 months, unless otherwise indicated.b Refers to interest rate on time deposits of over 12 months.c Rates for time deposits refer to interest rates of commercial banks in national currency for 6–12 months.d Refers to savings and time deposits as of end of period.e Rates for time deposits refer to rates for fixed deposits of 1 year to less than 3 years.f Refers to interest rate on time deposits of 2–3 years.g Rates for time deposits refer to rates charged on interest-bearing deposits with maturities of over 1 year.h Refers to time deposits from 12 months to less than 2 years, calculated as the arithmetic average of the monthly figures.i Refers to interest rate on time deposits of 6 months.
Sources: Economy sources. For the People’s Republic of China: CEIC database (accessed 30 July 2018).
Click here for table data

129Regional Trends and Tables
Money, Finance, and PricesMoney and Finance
Table 2.3.9: Yields on Short-Term Treasury Bills and Lending Interest Rates (% per annum, period averages)
ADB Regional Member
Yields on Short-Term Treasury Billsa Lending Interest Rates2000 2005 2010 2017 2000 2005 2010 2017
Developing ADB Member Economies Central and West Asia
Afghanistan ... ... ... ... ... 18.0 (2006) 15.6 14.8Armeniab 20.6 (2001) 4.1 10.6 6.7 31.6 18.0 19.2 14.4Azerbaijan 16.7 7.5 1.8 14.3 19.7 17.0 20.7 16.5Georgia 29.9 (2001) 12.6 9.6 7.3 ... 17.6 15.8 11.5Kazakhstan 11.6 3.3 ... ... ... ... ... ...Kyrgyz Republic 32.3 4.4 10.4 5.0 57.0 21.7 23.7 19.8Pakistanc 8.4 7.2 12.5 6.0 ... 9.1 14.0 8.2Tajikistand ... ... 6.7 1.0 1.6 23.3 23.4 29.6Turkmenistan ... ... ... ... ... ... ... ...Uzbekistan ... ... ... ... ... ... ... ...
East AsiaChina, People’s Republic ofe 2.6 1.9 2.6 ... 5.9 5.6 5.8 4.4Hong Kong, China 5.7 3.7 0.3 0.7 9.5 7.8 5.0 5.0Korea, Republic off 7.1 3.6 2.7 1.4 8.5 5.6 5.5 3.5Mongoliag ... 13.7 12.9 (2012) 15.0 37.0 30.6 20.1 20.0Taipei,Chinah ... 1.3 0.3 0.3 7.7 3.8 2.7 2.6
South AsiaBangladeshd 6.3 6.7 2.2 3.8 12.8 10.6 12.2 9.5Bhutand 7.3 3.5 2.0 0.7 16.0 14.5 13.9 14.3Indiad,i 9.0 5.7 6.2 6.2 12.3 10.8 8.3 9.5Maldivesj ... 5.0 (2006) 4.9 3.5 13.0 13.0 10.4 10.2Nepald 5.3 3.0 6.9 1.6 9.5 8.1 8.0 ...Sri Lankak 13.7 (2001) 9.0 8.6 10.1 14.3 (2001) 10.8 10.2 11.6
Southeast AsiaBrunei Darussalam ... ... ... ... 5.5 5.5 5.5 5.5Cambodia ... ... ... ... ... ... ... ...Indonesia ... ... ... ... 18.5 14.1 13.3 11.1Lao People’s Democratic Republicl 29.9 18.6 8.0 ... 32.0 26.8 22.6 ...Malaysia 2.9 2.5 2.6 2.8 (2016) 7.7 6.0 5.0 4.6Myanmar ... ... ... ... 15.3 15.0 17.0 13.0Philippinesd 9.9 6.1 3.5 2.1 10.9 10.2 7.7 5.6Singapore 2.2 2.1 0.3 ... 5.8 5.3 5.4 5.3Thailandd 2.3 (2001) 2.7 1.4 1.3 7.8 4.7 4.3 4.4Viet Namm 5.4 6.1 11.1 ... 10.6 11.0 13.1 7.4
The PacificCook Islands ... ... ... ... ... ... ... ...Fiji 3.5 1.9 3.4 1.4 8.4 6.8 7.5 5.7Kiribati ... ... ... ... ... ... ... ...Marshall Islands ... ... ... ... ... ... ... ...Micronesia, Federated States of ... ... ... ... 15.3 16.4 15.1 16.1Nauru ... ... ... ... ... ... ... ...Palau ... ... ... ... ... ... ... ...Papua New Guinean 17.0 3.8 4.6 4.7 17.5 11.5 10.4 8.4Samoa ... ... ... ... 11.6 (2001) 11.4 10.7 8.8Solomon Islands 7.0 4.5 3.7 0.5 10.3 9.3 14.4 10.7Timor-Leste ... ... ... ... 17.4 (2002) 16.7 11.0 13.3Tonga ... ... ... ... 11.3 11.4 11.5 7.9Tuvalu ... ... ... ... ... ... ... ...Vanuatu ... ... ... ... 9.9 7.5 5.5 3.2
Developed ADB Member EconomiesAustraliao 6.0 ... 4.4 ... 7.7 7.3 7.3 5.2Japan 0.2 0.0 0.1 -0.2 2.1 1.7 1.6 1.0New Zealand 6.4 6.5 2.8 1.8 7.8 7.8 6.3 5.0 (2016)
... = data not available, 0.0 = magnitude is less than half of unit employed, ADB = Asian Development Bank.a Refers to 3-month Treasury bills, unless otherwise indicated.b Refers to average yield on 9-month to 12-month Treasury bills since March 2001.c Refers to weighted average yield on 6-month Treasury securities.d Refers to 91-day Treasury bills.e Refers to 3-month Treasury bonds trading rate.f Refers to 91-day certificates of deposit.g Refers to weighted average rate on Treasury bills of all maturities. From December 2012 onward, refers to yield on 12-week Treasury bills.h Refers to prime lending rates.i Figures are for fiscal year ending March.j Refers to rate on 28-day Treasury bills.k Refers to weighted average rate on the last monthly issuance of 364-day Treasury bills since December 2001.l Refers to weighted average auction rate for 12-month Treasury bills.m Refers to average monthly yield on 360-day Treasury bills sold at auction.n Refers to rate on 182-day Treasury bills.o Refers to estimated closing yield in the secondary market on 13-week Treasury notes.Sources: International Monetary Fund. International Financial Statistics. http://data.imf.org/ (accessed 27 July 2018); and Organisation for Economic Co-operation and Development.
Main Economic Indicators. http://dx.doi.org/10.1787/data-00043-en (accessed 31 July 2018). For Taipei,China; Bangladesh; Bhutan; and India: Economy sources.
Click here for table data
130 Key Indicators for Asia and the Pacific 2018Money and Finance
Table 2.3.10: Domestic Credit Provided by the Banking Sector and Bank Nonperforming Loans
ADB Regional MemberDomestic Credit Provided by the Banking Sectora
(% of GDP)Bank Nonperforming Loansb
(% of total gross loans)2000 2005 2010 2017 2010 2017
Developing ADB Member Economies Central and West Asia
Afghanistan ... -4.8 (2006) 4.8 -2.4 49.9 12.2Armenia 11.5 8.8 27.8 58.2 3.0 5.4Azerbaijan 9.6 11.2 23.0 29.5 ... ...Georgia 21.5 21.6 35.5 61.6 5.9 2.8Kazakhstan 12.3 39.0 45.4 41.9 20.9 12.7Kyrgyz Republic 12.2 13.8 12.5 20.5 14.8 ...Pakistan 41.6 46.5 46.2 53.9 14.7 8.4Tajikistan 17.9 13.0 7.6 15.8 7.4 19.1 (2015)Turkmenistan ... ... ... ... ... ...Uzbekistan ... ... ... ... 1.0 0.4
East AsiaChina, People’s Republic of 118.4 132.6 142.2 215.2 1.1 1.7 (2015)Hong Kong, China 134.0 139.8 195.4 210.6 (2016) 0.8 0.7Korea, Republic of 70.9 125.5 151.0 170.1 0.6 0.5 (2014)Mongolia 9.0 26.6 25.7 65.3 ... ...Taipei,China 1.8 1.9 0.9 ... 0.6 0.3
South AsiaBangladesh 30.2 47.7 57.4 63.7 5.8 (2011) 8.4 (2015)Bhutan 2.9 21.8 45.6 53.5 (2016) 5.2 8.4India 52.8 60.2 74.3 75.0 (2016) 2.4 10.0Maldives 34.8 47.0 76.9 68.5 20.9 (2012) 10.5Nepal 40.8 42.2 67.4 87.1 ... 1.7Sri Lanka 43.7 43.5 35.5 71.9 (2016) 3.8 (2011) 2.5
Southeast AsiaBrunei Darussalam 38.6 10.4 22.7 28.6 6.9 3.5Cambodia 6.4 7.2 22.7 74.4 3.1 2.1Indonesia 60.7 46.2 34.2 47.0 2.5 2.6Lao People’s Democratic Republic 9.0 8.1 26.7 ... ... ...Malaysia 138.4 117.7 123.3 145.3 (2016) 3.4 1.5Myanmar 31.2 23.1 25.2 41.1 ... ...Philippines 58.3 47.2 49.2 66.3 3.4 1.6Singapore 76.7 61.2 80.8 140.8 1.4 1.4Thailand 134.3 111.0 133.4 164.7 3.9 3.1Viet Nam 35.1 65.4 124.7 141.8 2.1 2.3
The PacificCook Islands ... ... ... ... ... ...Fiji 37.9 111.6 132.3 120.9 4.4 2.4Kiribati ... ... ... ... ... ...Marshall Islands ... ... ... ... ... ...Micronesia, Federated States of -42.3 -24.5 -14.7 ... ... ...Nauru ... ... ... ... ... ...Palau ... ... ... ... ... ...Papua New Guinea 28.2 22.2 23.7 44.3 1.9 3.1 (2015)Samoa 18.3 31.8 63.4 78.7 ... 4.5Solomon Islands 26.5 29.4 26.8 28.5 9.3 4.2Timor-Leste -7.6 (2002) -2.5 -5.5 -7.2 ... ...Tonga 38.8 48.3 39.9 32.6 14.4 (2012) 3.6Tuvalu ... ... ... ... ... ...Vanuatu 35.6 44.5 63.7 58.0 4.8 14.0
Developed ADB Member EconomiesAustralia 93.4 113.4 154.0 177.1 2.1 0.9Japan 295.0 296.8 313.8 345.1 (2016) 2.5 1.2New Zealand 108.0 126.4 150.7 ... ... ...
... = data not available, ADB = Asian Development Bank, GDP = gross domestic product.
a Domestic credit provided by the financial sector includes all credit to various sectors on a gross basis, with the exception of credit to the central government, which is net. The financial sector includes monetary authorities and deposit money banks, as well as other financial corporations where data are available (including corporations that do not accept transferable deposits, but do incur such liabilities as time and savings deposits). Examples of other financial corporations are finance and leasing companies, money lenders, insurance corporations, pension funds, and foreign exchange companies.
b Bank nonperforming loans to total gross loans are the value of nonperforming loans divided by the total value of the loan portfolio (including nonperforming loans before the deduction of specific loan-loss provisions). The loan amount recorded as nonperforming should be the gross value of the loan as recorded on the balance sheet, not just the amount that is overdue.
Sources: World Bank. World Development Indicators Online. http://data.worldbank.org/ (accessed 6 July 2018). For Taipei,China: Central bank of Taipei,China. http://www.cbc.gov.tw (accessed 8 August 2018).
Click here for table data

131Regional Trends and Tables
Money, Finance, and PricesMoney and Finance
Table 2.3.11: Growth Rates of Stock Market Price Indexa (%)
ADB Regional Member 2000 2005 2010 2012 2013 2014 2015 2016 2017Developing ADB Member Economies Central and West Asia
Afghanistan ... ... ... ... ... ... ... ... ...Armenia ... ... ... ... ... ... ... ... ...Azerbaijan ... ... ... ... ... ... ... ... ...Georgia ... ... ... ... ... ... ... ... ...Kazakhstan ... ... ... ... ... ... ... ... ...Kyrgyz Republic ... ... ... ... ... ... ... ... ...Pakistanb 7.0 53.7 28.2 49.0 49.4 27.2 2.1 45.7 ...Tajikistan ... ... ... ... ... ... ... ... ...Turkmenistan ... ... ... ... ... ... ... ... ...Uzbekistan ... ... ... ... ... ... ... ... ...
East AsiaChina, People’s Republic of 37.3 -22.1 3.4 -16.8 -1.1 1.5 66.0 -19.0 6.7Hong Kong, China 26.5 11.1 19.3 -4.4 10.4 2.7 4.8 -12.0 22.3Korea, Republic of -8.7 28.5 23.6 -2.6 1.5 1.1 1.4 -1.2 16.5Mongolia ... 18.7 88.7 -11.0 -21.0 4.2 -14.6 -14.0 33.5Taipei,China 5.7 1.0 23.1 -8.3 8.2 11.1 -0.4 -2.2 16.5
South AsiaBangladeshb 31.8 -14.9 82.8 -19.7 1.1 14.0 -4.8 8.8 24.0Bhutan ... ... ... ... ... ... ... ... ...India 11.2 32.6 29.8 -2.5 11.4 25.2 10.9 -3.6 8.6Maldives ... 51.8 -20.4 -6.9 -5.3 -4.8 8.9 4.8 7.4Nepal ... ... ... ... ... ... ... ... ...Sri Lankab ... 27.6 96.0 -7.1 4.8 23.4 -5.5 -9.7 ...
Southeast AsiaBrunei Darussalam ... ... ... ... ... ... ... ... ...Cambodia ... ... ... ... ... ... ... ... ...Indonesiab -38.5 16.2 46.1 12.9 -1.0 22.3 -12.1 15.3 20.0Lao People’s Democratic Republic ... ... ... ... ... ... ... ... ...Malaysia 21.4 6.4 27.1 6.5 8.7 5.5 -6.1 -3.8 ...Myanmar ... ... ... ... ... ... ... ... ...Philippines -6.3 17.5 43.1 14.7 16.0 1.8 5.5 0.9 8.0Singapore 8.6 16.7 30.3 0.7 7.6 1.2 -2.5 -11.6 10.3Thailand -18.7 4.2 45.6 17.3 21.3 -0.2 0.2 -2.1 12.7Viet Namb ... 8.3 12.2 -4.2 22.1 8.1 6.1 14.8 ...
The PacificCook Islands ... ... ... ... ... ... ... ... ...Fiji ... 13.5 -11.1 -0.0 2.6 0.5 20.8 27.6 22.4Kiribati ... ... ... ... ... ... ... ... ...Marshall Islands ... ... ... ... ... ... ... ... ...Micronesia, Federated States of ... ... ... ... ... ... ... ... ...Nauru ... ... ... ... ... ... ... ... ...Palau ... ... ... ... ... ... ... ... ...Papua New Guinea ... 52.5 26.2 -28.0 -15.3 -12.3 -6.3 ... ...Samoa ... ... ... ... ... ... ... ... ...Solomon Islands ... ... ... ... ... ... ... ... ...Timor-Leste ... ... ... ... ... ... ... ... ...Tonga ... ... ... ... ... ... ... ... ...Tuvalu ... ... ... ... ... ... ... ... ...Vanuatu ... ... ... ... ... ... ... ... ...
Developed ADB Member EconomiesAustraliab 1.7 17.6 -2.6 14.6 15.1 1.1 -2.1 7.0 7.0Japan 11.6 13.5 2.0 -6.5 46.0 12.6 22.7 -12.6 ...New Zealand 2.3 19.4 9.7 6.9 25.5 14.1 12.7 17.4 11.1
... = data not available, -0.0 = magnitude is less than half of unit employed, ADB = Asian Development Bank.
a Refers to growth rates of stock market prices (period average), unless otherwise indicated.b Refers to growth rates of end-of-period stock market prices.
Sources: International Monetary Fund. 2018. International Financial Statistics. http://data.imf.org/IFS (accessed 8 August 2018). For Taipei,China: Annual statistics from the stock exchange corporation in Taipei,China. http://www.twse.com.tw/en/statistics/statisticsList?type=07&subType=240 (accessed 9 July 2018).
Click here for table data

132 Key Indicators for Asia and the Pacific 2018Money and Finance
Table 2.3.12: Stock Market Capitalization
ADB Regional MemberStock Market Capitalization
($ million)Stock Market Capitalization
(% of GDP)2000 2005 2010 2017 2000 2005 2010 2017
Developing ADB Member Economies Central and West Asia
Afghanistan ... ... ... ... ... ... ... ...Armenia ... ... ... ... ... ... ... ...Azerbaijan ... ... ... ... ... ... ... ...Georgia ... ... ... ... ... ... ... ...Kazakhstan 802 10,529 26,673 45,558 4.4 18.4 18.0 28.6Kyrgyz Republic ... ... ... ... ... ... ... ...Pakistan 6,625 45,317 38,007 91,864 (2016) 9.0 41.4 21.4 33.0 (2016)Tajikistan ... ... ... ... ... ... ... ...Turkmenistan ... ... ... ... ... ... ... ...Uzbekistan ... ... ... ... ... ... ... ...
East AsiaChina, People’s Republic of ... 401,852 4,027,840 8,711,267 ... 17.6 66.0 71.2Hong Kong, China 623,398 1,054,999 2,711,316 4,350,515 363.1 581.0 1,185.9 1,274.1Korea, Republic of 171,262 718,011 1,091,911 1,771,768 30.5 79.9 99.8 115.7Mongolia ... ... ... ... ... ... ... ...Taipei,China 262,295 485,825 752,335 1,045,727 79.1 129.3 168.6 182.6
South AsiaBangladesh 2,192 3,300 41,617 86,179 4.1 4.8 36.1 34.5Bhutan 53 101 219 338 (2016) 12.0 12.4 13.8 15.3 (2016)India ... 553,074 1,631,830 2,331,567 ... 68.4 98.5 89.8Maldives ... ... ... ... ... ... ... ...Nepal ... ... ... ... ... ... ... ...Sri Lanka 1,074 5,720 19,924 18,960 6.5 23.4 35.1 21.7
Southeast AsiaBrunei Darussalam ... ... ... ... ... ... ... ...Cambodia ... ... ... ... ... ... ... ...Indonesia 26,813 81,428 360,388 520,687 16.2 28.5 47.7 51.3Lao People’s Democratic Republic ... ... ... ... ... ... ... ...Malaysia 113,156 180,518 408,689 455,772 120.6 125.8 160.3 144.9Myanmar ... ... ... ... ... ... ... ...Philippines 25,981 39,799 157,321 290,401 32.1 38.6 78.8 92.6Singapore 152,826 257,340 647,226 787,255 159.5 202.0 273.8 243.0Thailand 29,217 123,885 277,732 548,795 23.1 65.4 81.4 120.6Viet Nam ... ... 30,115 116,657 ... ... 26.0 52.1
The PacificCook Islands ... ... ... ... ... ... ... ...Fiji ... ... ... ... ... ... ... ...Kiribati ... ... ... ... ... ... ... ...Marshall Islands ... ... ... ... ... ... ... ...Micronesia, Federated States of ... ... ... ... ... ... ... ...Nauru ... ... ... ... ... ... ... ...Palau ... ... ... ... ... ... ... ...Papua New Guinea ... 6,138 11,027 ... ... 126.2 77.4 ...Samoa ... ... ... ... ... ... ... ...Solomon Islands ... ... ... ... ... ... ... ...Timor-Leste ... ... ... ... ... ... ... ...Tonga ... ... ... ... ... ... ... ...Tuvalu ... ... ... ... ... ... ... ...Vanuatu ... ... ... ... ... ... ... ...
Developed ADB Member EconomiesAustralia 372,794 804,015 1,454,491 1,508,463 89.8 116.1 127.1 114.0Japan 3,157,222 4,572,901 3,827,774 6,222,825 64.6 96.2 67.2 127.7New Zealand 18,613 40,592 43,516 94,691 35.4 35.4 29.7 46.0
... = data not available, $ = United States dollars, ADB = Asian Development Bank, GDP = gross domestic product.
Sources: World Bank. World Development Indicators Online. http://databank.worldbank.org/data (accessed 1 July 2018). For Bhutan and Taipei,China: Asian Development Bank estimates using data from economy sources.
Click here for table data

133Regional Trends and Tables
Money, Finance, and PricesExchange Rates
Table 2.3.13: Official Exchange Rates (local currency units per $, period averages)
ADB Regional Member 2000 2005 2010 2012 2013 2014 2015 2016 2017Developing ADB Member Economies Central and West Asia
Afghanistan 47.36 49.49 46.45 50.92 55.38 57.25 61.14 67.87 68.03Armenia 539.53 457.69 373.66 401.76 409.63 415.92 477.92 480.49 482.72Azerbaijan 0.89 0.95 0.80 0.79 0.78 0.78 1.02 1.60 1.72Georgia 1.98 1.81 1.78 1.65 1.66 1.77 2.27 2.37 2.51Kazakhstan 142.13 132.88 147.36 149.11 152.13 179.19 221.73 342.16 326.00Kyrgyz Republic 47.70 41.01 45.96 47.00 48.44 53.65 64.46 69.91 68.87Pakistan 53.65 59.51 85.19 93.40 101.63 101.10 102.77 104.77 105.46Tajikistan 2.08 3.12 4.38 4.74 4.76 4.94 6.16 7.84 8.55Turkmenistan 1.04 1.04 2.85 2.85 2.85 2.85 3.50 3.50 3.50Uzbekistana 236.61 1,106.10 1,578.42 1,897.56 2,094.99 2,310.95 2,567.99 2,965.25 5,113.88
East AsiaChina, People’s Republic of 8.28 8.19 6.77 6.31 6.20 6.14 6.23 6.64 6.76Hong Kong, China 7.79 7.78 7.77 7.76 7.76 7.75 7.75 7.76 7.79Korea, Republic of 1,130.96 1,024.12 1,156.06 1,126.47 1,094.85 1,052.96 1,131.16 1,160.43 1,130.42Mongolia 1,076.67 1,205.25 1,357.06 1,357.58 1,523.93 1,817.94 1,970.31 2,140.29 2,439.78Taipei,China 31.23 32.17 31.64 29.61 29.77 30.37 31.90 32.32 30.44
South AsiaBangladesh 52.14 64.33 69.65 81.86 78.10 77.64 77.95 78.65 80.44Bhutan 44.94 44.10 45.73 53.44 58.60 61.03 64.15 67.20 65.12India 44.94 44.10 45.73 53.44 58.60 61.03 64.15 67.20 65.12Maldives 11.77 12.80 12.80 15.36 15.37 15.38 15.37 15.37 15.39Nepal 71.09 71.37 73.26 85.20 92.99 97.55 102.41 107.38 104.51Sri Lanka 77.01 100.50 113.06 127.60 129.07 130.56 135.86 145.58 152.45
Southeast AsiaBrunei Darussalam 1.72 1.66 1.36 1.25 1.25 1.27 1.37 1.38 1.38Cambodia 3,840.75 4,092.50 4,184.92 4,033.00 4,027.25 4,037.50 4,067.75 4,058.69 4,050.58Indonesia 8,421.78 9,704.74 9,090.43 9,386.63 10,461.24 11,865.21 13,389.41 13,308.33 13,380.87Lao People’s Democratic Republic 7,887.64 10,655.17 8,258.77 8,007.76 7,860.14 8,048.96 8,147.91 8,179.27 8,351.53Malaysia 3.80 3.79 3.22 3.09 3.15 3.27 3.91 4.15 4.30Myanmarb 6.52 5.82 5.63 640.65 933.57 984.35 1,162.62 1,234.87 1,360.36Philippines 44.19 55.09 45.11 42.23 42.45 44.40 45.50 47.49 50.40Singapore 1.72 1.66 1.36 1.25 1.25 1.27 1.37 1.38 1.38Thailand 40.11 40.22 31.69 31.08 30.73 32.48 34.25 35.30 33.94Viet Nam 14,167.75 15,858.92 18,612.92 20,828.00 20,933.42 21,148.00 21,697.57 21,935.00 22,370.09
The PacificCook Islands 2.20 1.42 1.39 1.23 1.22 1.21 1.43 1.44 1.41Fiji 2.13 1.69 1.92 1.79 1.84 1.89 2.10 2.09 2.07Kiribati 1.72 1.31 1.09 0.97 1.04 1.11 1.33 1.35 1.30Marshall Islandsc 1.00 1.00 1.00 1.00 1.00 1.00 1.00 1.00 1.00Micronesia, Federated States ofc 1.00 1.00 1.00 1.00 1.00 1.00 1.00 1.00 1.00Nauru 1.72 1.31 1.09 0.97 1.04 1.11 1.33 1.35 1.30Palauc 1.00 1.00 1.00 1.00 1.00 1.00 1.00 1.00 1.00Papua New Guinea 2.78 3.10 2.72 2.08 2.24 2.46 2.77 3.13 3.19Samoa 3.29 2.71 2.48 2.29 2.31 2.33 2.56 2.56 2.53Solomon Islands 5.09 7.53 8.06 7.36 7.30 7.38 7.91 7.95 7.89Timor-Lestec 1.00 1.00 1.00 1.00 1.00 1.00 1.00 1.00 1.00Tonga 1.76 1.94 1.91 1.72 1.77 1.85 2.11 2.22 2.21Tuvalu 1.72 1.31 1.09 0.97 1.04 1.11 1.33 1.35 1.30Vanuatu 137.64 109.25 96.91 92.64 94.54 97.07 108.99 108.48 106.18
Developed ADB Member EconomiesAustralia 1.72 1.31 1.09 0.97 1.04 1.11 1.33 1.35 1.30Japan 107.77 110.22 87.78 79.79 97.60 105.94 121.04 108.79 112.17New Zealand 2.20 1.42 1.39 1.23 1.22 1.21 1.43 1.44 1.41
$ = United States (US) dollars, ADB = Asian Development Bank.
a Data show weighted averages of the official, bank, and parallel market rates.b Beginning 1 April 2012, the Central Bank of Myanmar adopted the managed float exchange rate regime for kyat vis-à-vis the US dollar.c Unit of currency is the US dollar.
Sources: International Monetary Fund. International Financial Statistics. http://data.imf.org/ (accessed 18 May 2018). For Turkmenistan: United Nations National Accounts Main Aggregates Database and Interstate Statistical Committee of the Commonwealth of Independent States. For Uzbekistan: Economy source; United Nations National Accounts Main Aggregates Database, and Interstate Statistical Committee of the Commonwealth of Independent States. For Taipei,China: Central bank of Taipei,China. http://www.cbc.gov.tw (accessed 2 July 2018).
Click here for table data

134 Key Indicators for Asia and the Pacific 2018Exchange Rates
Table 2.3.14: Purchasing Power Parity Conversion Factora (local currency units per $, period averages)
ADB Regional Member 2000 2005 2010 2012 2013 2014 2015 2016 2017Developing ADB Member Economies Central and West Asia
Afghanistan 9.64 (2002) 12.28 16.02 18.46 18.87 18.65 18.89 19.61 20.21Armenia 144.93 157.74 183.12 193.53 196.87 197.86 198.12 196.15 196.98Azerbaijan 0.17 0.21 0.30 0.36 0.36 0.35 0.32 0.36 0.41Georgia 0.53 0.64 0.80 0.85 0.83 0.85 0.89 0.91 0.96Kazakhstan 22.15 35.14 67.88 82.49 88.89 92.36 93.04 104.39 109.09Kyrgyz Republic 8.11 9.26 14.80 18.94 19.24 20.49 20.96 21.95 22.55Pakistan 9.97 11.82 20.77 25.33 26.67 28.14 28.98 28.73 29.35Tajikistan 0.31 0.69 1.57 1.91 1.96 2.03 2.01 2.09 2.15Turkmenistan 0.27 0.65 1.30 1.53 1.52 1.50 1.41 1.33 1.43Uzbekistan 66.55 222.68 525.83 677.64 762.07 838.08 904.33 958.81 1,120.53
East AsiaChina, People’s Republic of 2.71 2.82 3.31 3.52 3.55 3.51 3.48 3.47 3.55Hong Kong, China 7.44 5.69 5.37 5.55 5.56 5.62 5.76 5.79 5.85Korea, Republic of 747.23 788.92 840.57 854.89 869.08 871.88 870.93 874.63 878.77Mongolia 138.38 223.58 476.22 594.84 602.41 635.87 639.95 645.30 701.02Taipei,China 21.52 18.36 15.79 14.92 14.90 14.88 15.20 15.14 14.69
South AsiaBangladesh 15.68 17.33 21.90 24.58 25.93 26.91 28.19 29.71 31.01Bhutan 12.27 13.66 15.84 18.07 18.83 19.84 20.34 20.94 22.12India 10.14 11.06 14.21 16.01 16.73 16.99 17.15 17.52 17.73Maldives 3.38 5.66 7.73 8.94 9.36 9.63 10.08 9.88 9.71Nepal 13.10 15.33 22.68 25.79 27.05 29.05 30.16 31.29 33.07Sri Lanka 15.24 21.79 38.00 42.06 43.98 44.46 44.27 45.49 48.37
Southeast AsiaBrunei Darussalam 0.48 0.59 0.61 0.71 0.68 0.66 0.54 0.48 0.50Cambodia 1,062.54 1,106.83 1,330.18 1,341.80 1,330.80 1,341.74 1,350.17 1,379.24 1,401.31Indonesia 1,427.63 2,013.80 3,425.30 3,674.27 3,795.44 3,931.47 4,044.10 4,092.20 4,190.49Lao People’s Democratic Republic 1,299.25 1,826.40 2,280.01 2,605.55 2,730.14 2,835.59 2,871.06 2,920.57 2,922.08Malaysia 1.19 1.28 1.41 1.45 1.43 1.44 1.42 1.42 1.45Myanmar 53.48 125.12 217.52 237.95 244.42 250.13 257.68 263.48 285.35Philippines 13.71 15.47 17.52 17.88 17.95 18.19 17.89 17.97 18.06Singapore 1.00 0.90 0.90 0.88 0.86 0.85 0.87 0.86 0.85Thailand 11.06 11.34 12.17 12.38 12.40 12.36 12.33 12.46 12.52Viet Nam 2,708.76 3,575.10 5,647.10 7,307.63 7,533.85 7,672.08 7,575.29 7,562.94 7,735.71
The PacificCook Islands ... ... ... ... ... ... ... ... ...Fiji 0.84 0.94 0.97 1.06 1.08 1.10 1.14 1.20 1.21Kiribati 0.86 0.90 0.96 0.95 0.94 0.94 0.96 1.01 1.01Marshall Islands 0.93 0.92 0.92 0.95 0.94 0.89 0.87 0.91 0.90Micronesia, Federated States of 0.88 0.81 0.89 0.93 0.92 0.93 0.87 0.90 0.88Nauru ... ... 0.86 1.22 0.94 0.81 0.74 0.77 0.78Palau 0.77 0.73 0.77 0.79 0.82 0.86 0.92 0.94 0.92Papua New Guinea 0.80 1.00 1.74 1.82 1.85 1.87 1.77 1.87 1.94Samoa 1.43 1.48 1.66 1.70 1.70 1.67 1.70 1.65 1.64Solomon Islands 3.73 4.43 5.68 6.57 6.62 6.67 6.80 6.95 6.94Timor-Leste 0.19 0.32 0.42 0.57 0.53 0.51 0.32 0.25 0.32Tonga 0.93 1.14 1.40 1.46 1.45 1.43 1.44 1.45 1.46Tuvalu 1.04 1.11 1.13 1.10 1.10 1.14 1.18 1.18 1.17Vanuatu 90.42 88.70 99.50 99.10 100.12 100.30 101.69 102.61 103.39
Developed ADB Member EconomiesAustralia 1.31 1.39 1.50 1.54 1.45 1.45 1.47 1.49 1.52Japan 154.72 129.55 111.62 104.27 101.30 103.05 102.76 100.28 98.24New Zealand 1.44 1.54 1.50 1.50 1.45 1.44 1.46 1.47 1.48
... = data not available, $ = United States dollars, ADB = Asian Development Bank.
a Purchasing power parity figures are extrapolated from the 2011 International Comparison Program (ICP) benchmark estimates or imputed using a statistical model based on the 2011 ICP.
Sources: World Bank. World Development Indicators. http://databank.worldbank.org/data/home.aspx (accessed 2 July 2018). For Taipei,China: Asian Development Bank estimates using data from economy sources and World Bank data.
Click here for table data

135Regional Trends and Tables
Money, Finance, and PricesExchange Rates
Table 2.3.15: Price Level Indexes (PPPs to official exchange rates, period averages, United States = 100)
ADB Regional Member 2000 2005 2010 2012 2013 2014 2015 2016 2017Developing ADB Member Economies Central and West Asia
Afghanistan 20.39 (2002) 24.81 34.49 36.25 34.07 32.57 30.90 28.90 29.70Armenia 26.86 34.46 49.01 48.17 48.06 47.57 41.45 40.82 40.81Azerbaijan 18.54 22.02 37.39 46.32 45.86 44.81 30.93 22.49 23.75Georgia 26.75 35.05 44.93 51.62 50.04 48.06 39.17 38.64 38.12Kazakhstan 15.58 26.45 46.07 55.32 58.43 51.54 41.96 30.51 33.46Kyrgyz Republic 17.01 22.58 32.19 40.30 39.71 38.18 32.52 31.40 32.74Pakistan 18.59 19.86 24.38 27.12 26.24 27.83 28.20 27.42 27.83Tajikistan 14.80 22.20 35.78 40.33 41.19 41.17 32.67 26.71 25.18Turkmenistan 26.31 62.46 45.57 53.57 53.33 52.74 40.29 37.86 40.88Uzbekistan 28.13 20.13 33.31 35.71 36.38 36.27 35.22 32.33 21.91
East AsiaChina, People’s Republic of 32.71 34.43 48.86 55.83 57.23 57.17 55.84 52.27 52.52Hong Kong, China 95.53 73.14 69.06 71.59 71.73 72.50 74.35 74.53 75.06Korea, Republic of 66.07 77.03 72.71 75.89 79.38 82.80 76.99 75.37 77.74Mongolia 12.85 18.55 35.09 43.82 39.53 34.98 32.48 30.15 28.73Taipei,China 68.91 57.09 49.91 50.37 50.04 49.00 47.66 46.84 48.25
South AsiaBangladesh 30.07 26.94 31.45 30.03 33.20 34.66 36.16 37.77 38.56Bhutan 27.30 30.97 34.64 33.82 32.13 32.51 31.71 31.16 33.97India 22.56 25.08 31.07 29.97 28.56 27.83 26.74 26.08 27.22Maldives 28.76 44.19 60.36 58.18 60.93 62.58 65.61 64.31 63.12Nepal 18.42 21.48 30.96 30.27 29.08 29.78 29.46 29.14 31.64Sri Lanka 19.80 21.68 33.61 32.97 34.07 34.05 32.59 31.25 31.73
Southeast AsiaBrunei Darussalam 27.69 35.33 44.69 57.07 54.50 51.81 38.98 34.79 35.89Cambodia 27.66 27.05 31.79 33.27 33.04 33.23 33.19 33.98 34.60Indonesia 16.95 20.75 37.68 39.14 36.28 33.13 30.20 30.75 31.32Lao People’s Democratic Republic 16.47 17.14 27.61 32.54 34.73 35.23 35.24 35.71 34.99Malaysia 31.29 33.82 43.86 46.85 45.28 43.88 36.24 34.35 33.79Myanmara 7.70 20.17 36.20 37.14 26.18 25.41 22.16 21.34 20.98Philippines 31.03 28.08 38.83 42.33 42.29 40.98 39.32 37.83 35.83Singapore 58.05 54.13 65.91 70.43 69.06 66.83 63.12 62.00 61.46Thailand 27.56 28.20 38.41 39.82 40.35 38.04 36.00 35.30 36.90Viet Nam 19.12 22.54 30.34 35.09 35.99 36.28 34.91 34.48 34.58
The PacificCook Islands ... ... ... ... ... ... ... ... ...Fiji 39.24 55.33 50.70 59.23 58.71 58.44 54.16 57.05 58.50Kiribati 50.08 69.03 88.02 98.29 91.00 84.69 71.83 75.27 77.48Marshall Islands 92.73 91.97 92.31 95.23 93.86 89.17 86.88 91.11 89.51Micronesia, Federated States of 87.81 81.27 88.57 92.53 91.78 92.72 86.64 89.60 88.00Nauru ... ... 79.19 125.99 90.57 73.25 55.38 57.19 59.89Palau 76.87 73.42 76.96 78.60 82.44 85.97 92.16 93.93 92.30Papua New Guinea 28.86 32.11 64.11 87.11 82.43 76.10 63.98 59.79 60.89Samoa 43.43 54.47 66.67 73.95 73.43 71.70 66.36 64.38 64.96Solomon Islands 73.23 58.87 70.39 89.37 90.66 90.37 85.88 87.50 88.04Timor-Leste 19.23 31.53 41.51 56.76 53.15 50.56 31.75 25.25 31.60Tonga 52.72 58.77 73.53 84.94 81.64 77.69 68.35 65.23 66.35Tuvalu 60.47 85.04 103.28 113.76 106.58 102.72 88.61 87.44 89.80Vanuatu 65.69 81.19 102.68 106.98 105.90 103.33 93.31 94.59 97.37
Developed ADB Member EconomiesAustralia 76.01 106.02 137.72 159.47 139.70 130.93 110.50 110.43 116.21Japan 143.57 117.54 127.16 130.68 103.80 97.27 84.90 92.17 87.58New Zealand 65.61 108.08 107.76 121.17 118.58 119.52 102.07 102.20 104.95
... = data not available, PPP = purchasing power parity, ADB = Asian Development Bank.
a The Central Bank of Myanmar devalued the local currency effective 1 April 2012. To achieve a consistent price series, the exchange rate used for estimating the price level index in prior years was extrapolated using the pre-devaluation exchange rate series.
Source: Asian Development Bank estimates using economy sources and World Bank data.
Click here for table data