studentsrepo.um.edu.mystudentsrepo.um.edu.my/8109/4/chew_bee_teng_phd... · iii abstract this...
TRANSCRIPT

ADAPTIVE THERMAL COMFORT MODEL STUDY
FOR PUBLIC BUILDINGS IN URBAN AREA
CHEW BEE TENG
THESIS SUBMITTED IN FULFILMENT
OF THE REQUIREMENTS FOR
THE DEGREE OF DOCTOR OF PHILOSOPHY
FACULTY OF ENGINEERING
UNIVERSITY OF MALAYA
KUALA LUMPUR
2012
Univers
ity of
Mala
ya

ii
UNIVERSITI MALAYA ORIGINAL LITERARY WORK DECLARATION
Name of Candidate: CHEW BEE TENG
Registration/Matric No: KHA 090008
Name of Degree: DEGREE OF DOCTOR OF PHILOSOPHY
Title of Project Paper/Research Report/Dissertation/Thesis (“this Work”):
ADAPTIVE THERMAL COMFORT MODEL STUDY FOR PUBLIC BUILDINGS IN URBAN AREA
Field of Study: HEATING, VENTILATING & AIR-CONDITIONING
I do solemnly and sincerely declare that: (1) I am the sole author/writer of this Work; (2) This Work is original; (3) Any use of any work in which copyright exists was done by way of fair dealing and
for permitted purposes and any excerpt or extract from, or reference to or reproduction of any copyright work has been disclosed expressly and sufficiently and the title of the Work and its authorship have been acknowledged in this Work;
(4) I do not have any actual knowledge nor do I ought reasonably to know that the making of this work constitutes an infringement of any copyright work;
(5) I hereby assign all and every rights in the copyright to this Work to the University of Malaya (“UM”), who henceforth shall be owner of the copyright in this Work and that any reproduction or use in any form or by any means whatsoever is prohibited without the written consent of UM having been first had and obtained;
(6) I am fully aware that if in the course of making this Work I have infringed any copyright whether intentionally or otherwise, I may be subject to legal action or any other action as may be determined by UM.
Candidate’s Signature: Date:
Subscribed and solemnly declared before,
Witness’s Signature: Date:
Name:
Designation:
Univers
ity of
Mala
ya

iii
Abstract
This thesis presents a comprehensive review of the literature of the Fanger’s PMV and
adaptive thermal comfort models which were developed in different buildings and climates.
Basically, the adaptive thermal comfort model is the correlation between the indoor neutral
temperature and the outdoor temperature. An important premise of this thesis is the fact that
the Fanger’s model underestimates the thermal impression in the actual case and thus the
model is no longer valid for use in certain climates. As a consequence, many researchers
have developed adaptive models from field studies for different climates and countries.
However, there is still no adaptive model that can be applied in designing the air-
conditioning systems for different buildings in all countries with the tropical climates
including Malaysia. Based on this comprehensive review, internationally recognized
adaptive models are needed to achieve better thermal conditions in a variety of buildings
such as hospitals, offices and lecture halls in the tropics. For hot and humid climates, the
adaptive thermal comfort models were developed as part of this research by using the
collected results from a large field study in the hospitals, office buildings and lecture halls.
Field measurements were conducted in nine hospitals with feedbacks from 293 workers.
The relationships between the operative temperature and the behavioural adaptations were
determined in this research. In the developed adaptive model for hospitals, the acceptable
indoor neutral temperatures lay within the range of 23.3 - 26.5oC, with the outdoor
temperatures ranging between 25.4 - 35.0oC. The neutral temperature, which is the most
comfortable temperature for the hospital workers, was 26.4oC. On the other hand, from the
survey of the seven air-conditioned office buildings with 322 occupants, the acceptable
indoor neutral temperatures found were within the range of 23.3 – 25.2oC, with the outdoor
temperatures ranging between 21.1 - 35.4oC. The most comfortable temperature for office
Univers
ity of
Mala
ya

iv
occupants was 24.1oC. Furthermore, based on the field measurement in six lecture halls
with 178 students, the acceptable indoor neutral temperatures lay within the range of 23.9 -
26.0oC, with the outdoor temperatures ranging between 27.0 – 34.6oC. The neutral
temperature found for students in the lecture hall was 25.7oC. Finally, the potential energy
savings in the air-conditioning system was found to be 14.4 % for the hospitals, 0.6 % for
the office buildings and 10.2 % for the lecture halls when increasing the temperature set
point to the neutral temperature determined in the present research study.
Univers
ity of
Mala
ya

v
Abstrak
Tesis ini membentangkan kajian literatur mengenai Fanger PMV dan model penyesuaian
keselesaan terma yang dibina dari bangunan dan iklim yang berbeza. Pada asasnya, model
penyesuaian keselesaan terma adalah hubungan antara suhu neutral dalaman dan suhu luar.
Salah satu premis penting dalam kertas kerja ini adalah hakikat bahawa model Fanger
meremehkan tanggapan terma dalam kes sebenar dan oleh itu tidak lagi sah untuk
digunakan dalam iklim tertentu. Akibatnya, ramai penyelidik telah membina model
penyesuaian daripada kajian lapangan untuk iklim dan negara-negara yang berbeza. Walau
bagaimanapun, masih tiada model penyesuaian yang boleh digunakan dalam mereka bentuk
sistem penyaman udara untuk bangunan yang berbeza di semua negara beriklim tropika
termasuk Malaysia. Berdasarkan kajian semula yang komprehensif ini, model penyesuaian
yang diiktiraf di peringkat antarabangsa adalah diperlukan untuk mencapai keadaan terma
yang lebih baik dalam pelbagai bangunan seperti hospital, pejabat dan dewan kuliah di
kawasan tropika. Untuk kegunaan sebagai model keselesaan terma yang lebih sesuai
kepada iklim panas dan lembap, model penyesuaian keselesaan terma ini telah dibina
sebagai sebahagian daripada kajian ini dengan menggunakan keputusan yang diperolehi
daripada kajian lapangan yang menyeluruh di hospital-hospital, bangunan pejabat dan
dewan kuliah. Ukuran lapangan telah dijalankan di sembilan buah hospital yang
mempunyai 293 orang pekerja. Hubungan di antara suhu operatif dan penyesuaian tingkah
laku juga telah ditentukan. Dalam model penyesuaian yang dibina untuk hospital, suhu
neutral dalaman terletak dalam julat sebanyak 23.3 - 26.5oC, dengan suhu luar antara 25.4 -
35.0oC. Suhu neutral, yang merupakan suhu yang paling selesa untuk pekerja hospital
adalah sebanyak 26.4oC. Sebaliknya, daripada kajian di tujuh bangunan pejabat berhawa
dingin dengan 322 orang penghuni, suhu neutral dalaman adalah dalam julat sebanyak 23.3
Univers
ity of
Mala
ya

vi
– 25.2oC, dengan suhu luar antara 21.1 - 35.4oC. Suhu yang paling selesa untuk penghuni
pejabat adalah sebanyak 24.1oC. Selain itu, berdasarkan kajian dalam enam dewan kuliah
dengan 178 orang pelajar, suhu neutral dalaman adalah terletak dalam julat sebanyak 23.9 -
26.0oC, dengan suhu luar antara 27.0 – 34.6oC. Suhu neutral untuk pelajar dalam dewan
kuliah adalah sebanyak 25.7oC. Akhirnya, keupayaan penjimatan tenaga dalam sistem
penghawa dingin yang didapati adalah 14.4% untuk hospital, 0.6% untuk bangunan pejabat
dan 10.2% untuk dewan kuliah apabila meningkatkan titik suhu sistem penghawa dingin
kepada suhu neutral yang didapati daripada kajian ini.
Univers
ity of
Mala
ya

vii
Acknowledgements
First of all, I would like to express my deepest appreciation to my supervisor, Associate
Professor Ir. Dr. Yau Yat Huang for giving me a golden opportunity to conduct an
interesting research study under his supervision. He was very helpful, tolerant and generous,
by sacrificing his valuable time, to provide all the comprehensive guidance, inspiration, and
continues assistance throughout the difficulty faced in this study.
I have gained invaluable experiences and knowledge that would benefit me a lot in the
future. Besides, I would like to express my gratitude to numerous people whose names are
not mentioned for their assistance in realizing this study.
Last but not least, my deepest gratitude to my beloved parents, parents-in-law, husband and
family members for their understanding, love, moral support and also continued
encouragement during this project.
Univers
ity of
Mala
ya

viii
Table of Contents
Abstract ................................................................................................................................. iii
Abstrak ................................................................................................................................... v
Acknowledgements .............................................................................................................. vii
List of Figures ...................................................................................................................... xii
List of Tables ...................................................................................................................... xiv
List of Symbols and Abbreviations ...................................................................................... xv
List of Appendices .............................................................................................................. xvi
Chapter 1 Introduction ...................................................................................................... 1
1.1 Objectives of study .................................................................................................. 3
1.2 Significance of study ............................................................................................... 4
Chapter 2 Literature Review ............................................................................................. 5
2.1 Thermal comfort ...................................................................................................... 5
2.2 PMV model ............................................................................................................. 6
2.3 Adaptive approach ................................................................................................... 8
2.3.1 Physiological Adaptation ................................................................................. 9
2.3.2 Psychological Adaptation ................................................................................ 9
2.3.3 Behavioural Adjustment................................................................................. 10
2.4 Studies on the adaptive thermal comfort model .................................................... 12
2.4.1 Study in sub-tropical Hong Kong .................................................................. 12
2.4.2 Studies in five cities in Pakistan .................................................................... 14
2.4.3 Study on two climatic zones of Tunisian ....................................................... 15
Univers
ity of
Mala
ya

ix
2.4.4 Other studies related to an adaptive thermal comfort model ......................... 16
2.5 Discussion ............................................................................................................. 18
2.5.1 Relation between PMV and AMV ................................................................. 18
2.5.2 Variables in PMV ........................................................................................... 19
2.5.3 Uncertainty in PMV ....................................................................................... 21
2.5.4 The importance of an adaptive model ............................................................ 23
2.6 Summary ............................................................................................................... 24
Chapter 3 Methodology .................................................................................................. 25
3.1 Location of Measurement ...................................................................................... 26
3.2 Field measurements ............................................................................................... 27
3.2.1 Calculation of operative temperature and mean radiant temperature ............ 29
3.3 Subjective measurements ........................................................................................ 29
3.3.1 Calculation of Clothing Value ....................................................................... 30
3.3.2 Calculation of Metabolic Rate ....................................................................... 30
3.3.3 Calculation of PMV and PPD ........................................................................ 30
3.4 Verification of the adaptive model ........................................................................ 31
3.5 Summary ............................................................................................................... 33
Chapter 4 Results and Discussion – Field Work Study in Hospitals .............................. 34
4.1 Behavioural adaptations ........................................................................................ 37
4.1.1 Clothing insulation ......................................................................................... 37
4.1.2 Activity level .................................................................................................. 39
Univers
ity of
Mala
ya

x
4.1.3 Air velocity .................................................................................................... 40
4.2 Thermal acceptability ............................................................................................ 42
4.3 Thermal neutrality ................................................................................................. 43
4.4 Adaptive Thermal Comfort Model ........................................................................ 44
4.4.1 Upper and lower limits of the adaptive model ............................................... 48
4.4.2 Verification of the proposed adaptive model ................................................. 50
4.5 Summary ............................................................................................................... 51
Chapter 5 Results and Discussion– Field Work Study in Office Buildings ................... 53
5.1 Behavioural adaptations ........................................................................................ 54
5.1.1 Clothing insulation ......................................................................................... 54
5.1.2 Activity level .................................................................................................. 57
5.1.3 Air velocity .................................................................................................... 58
5.2 Thermal acceptability ............................................................................................ 59
5.3 Thermal neutrality ................................................................................................. 61
5.4 Adaptive Thermal Comfort Model ........................................................................ 61
5.4.1 Upper and lower limits of the adaptive model ............................................... 64
5.4.2 Verification of the proposed adaptive model ................................................. 65
5.5 Summary ............................................................................................................... 66
Chapter 6 Results and Discussion – Field Work Study in Lecture Halls ....................... 68
6.1 Behavioural adaptations ........................................................................................ 70
6.1.1 Clothing insulation ......................................................................................... 70
Univers
ity of
Mala
ya

xi
6.1.2 Activity level .................................................................................................. 72
6.1.3 Air velocity .................................................................................................... 73
6.2 Thermal acceptability ............................................................................................ 74
6.3 Thermal neutrality ................................................................................................. 75
6.4 Adaptive Thermal Comfort Model ........................................................................ 76
6.4.1 Upper and lower limits of the adaptive model ............................................... 79
6.4.2 Verification of the proposed adaptive model ................................................. 80
6.5 Summary ............................................................................................................... 81
Chapter 7 Results Comparisons ...................................................................................... 82
Chapter 8 Potential Energy Savings ............................................................................... 88
Chapter 9 Conclusions and Recommendations .............................................................. 91
9.1 Recommendations for future work ........................................................................ 92
List of Publications .............................................................................................................. 94
Appendices ........................................................................................................................... 96
Bibliography ....................................................................................................................... 329
Univers
ity of
Mala
ya

xii
List of Figures
Figure 2.1 : Calibration of adaptive model for Hong Kong. ................................................ 14
Figure 3.1 : ASHRAE Thermal Comfort Program. ............................................................. 31
Figure 4.1 : Relationship between clothing insulation and indoor operative temperature... 37
Figure 4.2 : Relationship between clothing insulation and outdoor temperature. ............... 38
Figure 4.3 : Relationship between activity level and operative temperature. ...................... 40
Figure 4.4 : Relationship between indoor air velocity and operative temperature. ............. 41
Figure 4.5 : Graph of percentage dissatisfied versus operative temperature. ...................... 42
Figure 4.6 : Graph of mean thermal sensation vote versus operative temperature. ............. 43
Figure 4.7 : Adaptive thermal comfort model for hospital buildings in hot and humid
Malaysia. ...................................................................................................................... 45
Figure 4.8 : Residual plots. .................................................................................................. 46
Figure 4.9 : Graph of APD versus indoor neutral temperature. ........................................... 49
Figure 4.10 : Upper and lower limits of adaptive thermal comfort model. ......................... 49
Figure 4.11 : Actual mean vote versus indoor operative temperature in a chamber. ........... 51
Figure 5.1 : Relationship between clothing insulation and indoor operative temperature... 55
Figure 5.2 : Relationship between clothing insulation and outdoor temperature. ............... 55
Figure 5.3 : New relationships between clothing insulation and indoor operative
temperature. .................................................................................................................. 57
Figure 5.4 : New relationships between clothing insulation and outdoor temperature. ....... 57
Figure 5.5 : Relationship between activity level and operative temperature. ...................... 58
Figure 5.6 : Relationship between indoor air velocity and operative temperature. ............. 59
Figure 5.7 : Graph of percentage dissatisfied versus operative temperature. ...................... 60
Figure 5.8 : Graph of mean thermal sensation vote versus operative temperature. ............. 61
Univers
ity of
Mala
ya

xiii
Figure 5.9 : Adaptive thermal comfort model for office building in hot and humid Malaysia.
...................................................................................................................................... 62
Figure 5.10 : Residual plots. ................................................................................................ 63
Figure 5.11 : Upper and lower limits of adaptive thermal comfort model. ......................... 65
Figure 6.1 : Relationship between clothing insulation and indoor operative temperature... 71
Figure 6.2 : Relationship between clothing insulation and outdoor temperature. ............... 71
Figure 6.3 : Relationship between activity level and operative temperature. ...................... 73
Figure 6.4 : Relationship between indoor air velocity and operative temperature. ............. 74
Figure 6.5 : Graph of percentage dissatisfied versus operative temperature. ...................... 75
Figure 6.6 : Graph of mean thermal sensation vote versus operative temperature. ............. 76
Figure 6.7 : Adaptive thermal comfort model for lecture halls in hot and humid Malaysia. 77
Figure 6.8 : Residual plots. .................................................................................................. 78
Figure 6.9 : Upper and lower limits of adaptive thermal comfort model. ........................... 80
Univ
ersity
of M
alaya

xiv
List of Tables
Table 2.1 : Thermal requirement of the three classes of indoor environment. ...................... 6
Table 2.2 : A list of neutral temperature of subjects in hot-humid climates. ......................... 8
Table 2.3 : Climate of the five cities in Pakistan. ................................................................ 14
Table 3.1 : Instruments description. ..................................................................................... 28
Table 3.2 : Details of the 10 occupants participated in the verification experiment. ........... 32
Table 4.1 : Physical parameters measured and calculated in nine hospitals. ....................... 35
Table 4.2 : Subjective measurements of occupants in nine hospitals. ................................. 36
Table 4.3 : Neutral temperature and outdoor temperature of nine hospitals. ....................... 44
Table 4.4 : Results of Paired T-test by SPSS Statistics 20. ................................................. 47
Table 4.5 : Measurements during experiment in a chamber. ............................................... 51
Table 5.1 : Physical parameters measured and calculated in seven office buildings. .......... 53
Table 5.2 : Subjective measurements of occupants in seven office buildings. .................... 54
Table 5.3 : Neutral temperature and outdoor temperature of seven office buildings. ......... 62
Table 6.1 : Physical parameters measured and calculated in lecture halls. .......................... 68
Table 6.2 : Subjective measurements of occupants in lecture halls. .................................... 69
Table 6.3 : Neutral temperature and outdoor temperature of lecture halls. ......................... 77
Table 7.1 : Comparisons of results obtained from hospitals, offices and lecture halls. ....... 82
Table 8.1 : Potential energy saving for buildings in Malaysia. ............................................ 89
Univers
ity of
Mala
ya

xv
List of Symbols and Abbreviations
B.U. – Bias Uncertainty
clo – Clothing insulation
met – Metabolic rate
Tout – Mean outdoor temperature
Top – Operative temperature
Tn – Neutral temperature
Tglobe – Globe temperature
AMV – Actual Mean Vote
ANSI – American National Standard Institute
APD – Actual Percentage Dissatisfied
ASHRAE – American Society of Heating, Refrigerating and Air-Conditioning
Engineering
CAV – Constant Air Volume
HVAC – Heating, Ventilation and Air-Conditioning
IAQ – Indoor Air Quality
IEQ – Indoor Environmental Quality
ISO – International Organization for Standardization
M&E – Mechanical and Electrical
MRT – Mean Radiant Temperature
NV – Natural Ventilated
PMV – Predicted Mean Vote
PPD – Predicted Percentage of Dissatisfied
VAV – Variable Air Volume
Univers
ity of
Mala
ya

xvi
List of Appendices
Appendix A : Sample Questionnaire.................................................................................... 96
Appendix B : Table of Clothing Value ................................................................................ 97
Appendix C : Table of Metabolic Rate ................................................................................ 98
Appendix D : Detail measurements for hospitals ................................................................ 99
Appendix E : Graphs of actual mean vote versus operative temperature for hospitals ..... 193
Appendix F : Residual analysis for hospitals ..................................................................... 198
Appendix G : Bias uncertainty analysis for hospitals ........................................................ 199
Appendix H : Detail measurements for offices. ................................................................. 215
Appendix I : Graphs of actual mean vote versus operative temperature for offices .......... 264
Appendix J : Residual analysis for offices ......................................................................... 268
Appendix K : Bias uncertainty analysis for offices ........................................................... 269
Appendix L : Detail measurements for lecture halls .......................................................... 279
Appendix M : Graphs of actual mean vote versus operative temperature for lecture halls 322
Appendix N : Residual analysis for lecture halls ............................................................... 325
Appendix O : Bias uncertainty analysis for lecture halls ................................................... 326
Univers
ity of
Mala
ya

1
Chapter 1 Introduction
Nowadays, a more comfortable and healthy environment in the buildings are expected, with
a higher standard of living (Yu et al., 2009). Hence, indoor air quality (IAQ) and thermal
comfort of a building have become the main aims for HVAC engineers, because they are of
great importance for high quality buildings (Kavgic et al., 2008). For instance, better indoor
air quality can be achieved with an increase of the ventilation rate, so that air pollutants can
be diluted (Wargocki et al., 2002). The way buildings are designed and operated means that
the amount of energy used in the HVAC system and the impacts are important in
constituting a ‘comfortable’ thermal environment (Brager & de Dear, 1998). Comfort
problems will always occur after a period of operation due to reasons such as unsuitable
temperature set points and improper fresh air intake.
As defined by the ANSI/ASHRAE Standard 55 (2004), thermal comfort is a
situation where a person feels satisfied with the temperature of the surrounding
environment. In designing a building involving people occupying it, the most significant
aspect to be considered is the thermal comfort (van Hoof & Hensen, 2007). It is believed
that the thermal comfort in a working space will affect workers’ productivity (Mohamed &
Srinavin, 2005).
The predicted mean vote (PMV) model developed by Fanger in the late 1960s and
the current ISO 7730 Standard which are based on the PMV model were regularly used to
determine thermal comfort of occupants in offices and residential buildings (van Hoof,
2008). Since the PMV model is used globally, the wide range of climates, variety of
building types and the broad measurement of the thermal environment causes discrepancies
between the actual and predicted thermal sensation. It is argued that the PMV model, which
Univers
ity of
Mala
ya

2
was developed from laboratory studies, has restrictions with regard to environmental
parameters, since they are quite different from those in real buildings (Yao et al., 2009).
Nowadays, most air-conditioned buildings with a centralized system face the same
problem, which is either that the space is too cold or too warm (Wong et al., 2007). A field
experiment conducted in Singapore found that most of the air-conditioned office buildings
were overcooled and approximately 33% of the occupants votes a cool thermal sensation
(de Dear et al., 1991). This is frequently encountered in tropical countries, because the
PMV model is not suitable for a hot and humid climate. Thus, the adaptive model is
important for establishing thermal comfort for occupants and at the same time conserving
energy. The adaptive thermal comfort model is basically the correlation between the indoor
neutral temperature and the outdoor temperature.
Until now, there has not been a study on an adaptive thermal comfort model for hot
and humid climates in Malaysia. Thus, there is a need for researchers to conduct a
comprehensive study on an adaptive thermal comfort model in Malaysia for the use of
building service engineers from hot and humid countries. A comprehensive study should be
performed for different kinds of buildings, such as hospitals, offices and lecture halls in
order to determine the adaptive model for each of these specific buildings.
A hospital is a special building that has different requirements in Indoor
Environmental Quality (IEQ) compared to other commercial buildings. For this study, the
questionnaire survey was conducted among the hospital staff only, without considering the
patients, because patients’ thermal perception may vary depending on their health
conditions. According to ASHRAE Applications (2007), recommendation for design
temperature for inpatient areas should be 24°C or less.
The situation in hospitals is different to the situation in offices and lecture halls.
Most office buildings are occupied from 8 am to 6 pm, and the recommended design
Univers
ity of
Mala
ya

3
temperature is from 23 to 26°C for the summer season (ASHRAE Applications, 2007). On
the other hand, lecture halls are occupied by many students for a few hours for several
times a day. The design of the lecture hall requires the air-conditioning system to run
silently because students seated at the back of the lecture hall are nearer to the ceiling. The
recommended design temperature for lecture halls is between 22.8 – 25.8°C. In specific
terms, the lecture hall’s temperature should be maintained at 24°C, without the existence of
drafts as described in ASHRAE Applications (2007).
1.1 Objectives of study
The objectives of this research are:
a) To find out the relationship between the operative temperature and the clothing
insulation, the activity level and the air velocity for hospitals, office buildings and
lecture halls in Malaysia.
b) To determine the thermal acceptability and neutral temperature (which is the
acceptable temperature range and the comfort temperature of the hospital personnel,
office workers and tertiary students).
c) To develop the adaptive thermal comfort models with its upper and lower limits for
the hospitals, offices and lecture halls based on the field study in Malaysia.
d) To verify the developed adaptive thermal comfort models by conducting an
experiment in a chamber.
e) To compare the field survey results between the hospitals, offices and lecture halls.
f) To calculate the potential energy savings and the cost savings from the outcome of
this research study.
Univers
ity of
Mala
ya

4
1.2 Significance of study
In designing air-conditioning systems, it is believed that the conventional fixed temperature
set point concept is inappropriate because the indoor comfort temperature actually depends
on the outdoor air temperature. To have a thermal comfort model, which better fits hot and
humid climates in Malaysia, the adaptive thermal comfort models proposed in this research
were developed from the collected results from fieldwork study in hospitals, offices and
lecture halls located in Kuala Lumpur, Malaysia.
The new conclusions from the adaptive thermal comfort models in this study could
be used as an important guide for building services engineers and researchers in the tropics.
Their intentions are to minimize energy usage in HVAC systems in hospitals, offices and
lecture halls operating in the tropics while maintaining an acceptable thermal comfort level
and thus improving the performance and well-being of the occupants.
Univers
ity of
Mala
ya

5
Chapter 2 Literature Review
2.1 Thermal comfort
Fanger’s model is a prediction of a numerical index by combining four physical
variables and two personal variables to measure the perception of occupants on the thermal
condition in a building (Charles, 2003; Deng et al., 2009). The physical variables are air
temperature, air velocity, mean radiant temperature and relative humidity. The two personal
variables, meanwhile, are clothing insulation and activity level. Hence, a person’s thermal
sensation does not depend on the ambient air temperature alone. Thermal comfort is
achieved when the heat produced by the metabolism is dissipated and is in thermal
equilibrium with the surroundings.
In addition, thermal acceptability or the predicted percentage dissatisfied (PPD) can
be determined from the PMV value. PPD is associated with three PMV ranges as shown in
Table 2.1 (Arens et al., 2010). Besides thermal comfort, energy consumption is another
essential element that needs to be considered in HVAC systems because it determines the
operating cost of the system as well as its effect on the environment. For this reason, a new
method to determine indoor temperature and relative humidity to achieve minimum energy
usage while considering human thermal comfort was developed (Wan et al., 2009).
Another study showed that in hot and humid areas, air velocity is the main factor for saving
energy by reducing the cooling load of a building, because indoor temperature and
humidity often do not guarantee indoor comfort (Yang & Su, 1997).
Univers
ity of
Mala
ya

6
Table 2.1 : Thermal requirement of the three classes of indoor environment.
Class (category) A (I) B (II) C (III)PMV -0.2 < PMV < +0.2 -0.5 < PMV < +0.5 -0.7 < PMV < +0.7Temperature range for typical clo and met (K) 2 4 6
PPD (%) <6 <10 <15Source: (Arens et al., 2010)
2.2 PMV model
The PMV was defined by Fanger as the index to forecast the mean thermal sensation vote
for a big group of occupants based on a standard scale by taking into account the four
physical variables and two personal variables aforementioned (van Hoof, 2008). The PMV
model is a flexible tool, which can be utilized in different indoor environments with
different HVAC systems, clothing values and activity levels. Besides, the PMV model is
represented by a 7-point thermal sensation scale consisting of the following:
+3 Hot
+2 Warm
+1 Slightly warm
0 Neutral
-1 Slightly cool
-2 Cool
-3 Cold
Fanger related PMV to the imbalance between the actual heat flow from the body in
a given environment and the heat flow required for optimum comfort at the specified
activity by Equation (2.1) (ASHRAE Fundamentals Handbook, 2005).
PMV = [0.303exp(– 0.036M ) + 0.028] L (2.1)
Univers
ity of
Mala
ya
7
M = metabolic rate
L = thermal load defined as the difference between the internal heat production and the heat
loss to the actual environment for a person hypothetically kept at comfort values of skin
temperature and evaporative heat loss by sweating at the actual activity level.
The PMV model can be called as a heat balance model because the thermal
sensation in the PMV is interrelated with the thermal load from the mechanisms of the
human thermoregulatory system (Fanger & Toftum, 2002). According to Fanger, thermal
comfort can be accomplished when the body is in a heat balance, the average skin
temperature and sweat rate are within certain limits, and no local discomfort occurs in the
environment. Local discomforts are basically draughts or temperature gradients of the
environment. Thus, high fluctuations in temperature should be avoided to achieve thermal
comfort (van Hoof, 2008).
Field studies in tropical climates have found that Fanger’s predicted mean vote
equations do not effectively express comfortable conditions, especially in buildings which
are not heated or cooled mechanically (Nicol, 2004). However, Nicol and Humphreys have
demonstrated that errors in the PMV also exist in air-conditioned buildings (Nicol &
Humphreys, 2002). The reasons for this occurrence of errors in predicting the mean vote
include the constraints of the applicability of the PMV, wrong predictions of thermal
sensation given by the steady-state heat balance approach (Nicol, 2004), occupants’
adaptive behaviours (Humphreys & Nicol, 2002) and the limitations of the Fanger equation.
One reason is that in the heat balance formula, the effect of air velocity should not only
consider the convective heat exchange but also needs to take into account the evaporation
of sweat (Heidari & Sharples, 2002).
Furthermore, it was also suggested that people might prefer not to feel ‘neutral’ on
the thermal sensation scale, because occupants in hot climates might prefer a sensation of
Univers
ity of
Mala
ya

8
slightly cooler than neutral, while occupants in cold climates might prefer a sensation of
slightly warmer than neutral (Humphreys, 1976). In other words, a majority of people
would prefer a sensation on the warm side of neutral if it was cool outdoors and vice versa
(Humphreys & Hancock, 2007). Therefore, the correlations between experimental data and
mathematical models were studied (Buratti & Ricciardi, 2009). Few studies have been
conducted in tropical countries to discover the acceptable temperature range, neutral
temperature and preferred temperature in hot-humid climates. The results shown in Table
2.2 support the argument that the PMV model is not applicable worldwide because people’s
thermal sensation differs from place to place (Hwang et al., 2006).
Table 2.2 : A list of neutral temperature of subjects in hot-humid climates.
Year 1990 1991 1994 1998 1998 1998 2003Researcher J.E. Bush R.J. De
Dear, K.G. Leow, et al.
R.J. De Dear, M.E. Fountain
T.H. Karyono
W.T. Chan et al.
A.G. Kwok N.H. Wong et al.
Building Office Residential and office
AC office Office Office Classrooms Classrooms
Location Bangkok, Thailand
Singapore Townsville, Australia
Jakarta, Indonesia
Hong Kong
Hawaii, USA
Singapore
Neutral temperature of subjects
24.5˚C (ET) for AC buildings 28.5˚C (ET) for NV buildings
24.2˚C (to) for AC buildings 28.5˚C (to) for NV buildings
24.2˚C (to) in the dry season 24.6˚C (to) in the wet season
26.7˚C (to) for AC buildings
23.5˚C (to) for AC buildings
26.8˚C (to) for AC classrooms 27.4˚C (to) for NV classrooms
28.8˚C (to) for NV classrooms
Source: (Hwang et al., 2006)
2.3 Adaptive approach
The adaptive approach states that if a variation occurs that leads to discomfort, people react
in different ways to restore their comfort. The adaptive approach suggests that people’s
satisfaction with an indoor climate is attained by matching the actual thermal environmental
Univers
ity of
Mala
ya

9
conditions at the existing time and space with their individual thermal expectations (de
Dear & Brager, 2002).
In Auliciems’s research, there is a statistical relationship states that indoor air
temperature is influenced by outdoor temperature (Auliciems, 1981). In the perception of
the adaptive model, it can be said that thermal comfort temperature is a function of
outdoors temperatures. Field studies show that in a naturally ventilated building, PMV
predicts thermal sensations warmer than those that the occupants actually feel (Brager & de
Dear, 1998). The adaptive process consists of three categories, which are physiological
adaptation, psychological adaptation and behavioural adjustment.
2.3.1 Physiological Adaptation
Physiological adaptation is important in maintaining human body temperature at a
comfortable level. This adaptation includes perspiration, vasoconstriction and
vasodilatation (Yao et al., 2009). Basically, physiological adaptation consists of genetic
adaptation and acclimatization. Genetic adaptation is the genetic heritage of a person or a
group of people, which has evolved over a long time, even before the individual’s life
began. In contrast, acclimatization is a change in a human’s thermoregulation system in
response to the thermal environment (Brager & de Dear, 1998). However, physiological
acclimatization is not taken into account in the heat balance models as shown in Equation
(2.1), and hence this variable is fixed.
2.3.2 Psychological Adaptation
Psychological adaptation is immeasurable, it describes a feeling of thermal perception
based on past experiences (de Dear & Brager, 2002). The human body sensitivity will be
reduced if exposed to a certain thermal level over a period of time. The static thermal heat
Univers
ity of
Mala
ya

10
balance models are not able to account for these psychological effects, and it is assumed
that the relationship between psychological strain and thermal sensation is fixed.
2.3.3 Behavioural Adjustment
A behavioural adaptation is an action a person might take to achieve thermal comfort by
changing their body’s heat balance. Behavioural adaptation indicates that individual
humans themselves can maintain their own thermal comfort. A person tends to take
corrective actions if he/she is in a thermally uncomfortable condition. Behavioural
adaptations are commonly represented by clothing insulation, activity level and air velocity
as suggested by ASHRAE RP-884 (de Dear et al., 1997). Air velocity is a parameter by
which people apply some behavioural adjustments, either by opening/closing windows or
turning on/off fans.
a) Clothing insulation
Clothing insulation, which is measured in the ‘clo’ unit, is basically an estimation of the
insulating properties of clothing using tables from the ASHRAE Fundamentals Handbook
(2009). In order to achieve thermal comfort, clothing plays an important role as one of the
behavioural adaptations of humans.
According to some researchers, the linear regression between clothing insulation
and operative temperatures was developed and shown in Equations (2.2) to (2.4).
Clo = -0.04 Top + 1.73 by (de Dear & Brager, 1998) (2.2)
Clo = -0.04 Top + 1.76 by (Mui & Chan, 2003) (2.3)
Clo = -0.0352 Tglobe + 1.3875 by (Bouden & Ghrab, 2005) (2.4)
Univers
ity of
Mala
ya

11
Note that Equations (2.2) to (2.4) were developed from HVAC buildings, air-
conditioned offices and free running buildings respectively. Researchers (Mui & Chan,
2003) also have found the correlation between clothing insulation and outdoor temperature
for offices in Hong Kong as in Equation (2.5).
Clo = -0.0075 Tout + 0.9898 (2.5)
b) Activity level
Activity level of occupants is measured in metabolic rate with the unit of ‘met’. Most of the
researchers found that the average metabolic rate for both centralized HVAC and naturally
ventilated buildings is 1.2 met (Bouden & Ghrab, 2005; Mui & Chan, 2003). Also, the
horizontal regression line between indoor operative temperature and metabolic rate found
by the aforementioned researchers shows that the activity level of occupants is independent
of the indoor operative temperature. The activity level for all office occupants is more or
less the same where most of them are doing sedentary work no matter what their ambient
temperature may indicate.
c) Air velocity
Another common behavioural adaptation is air velocity. People’s adaptation to air velocity
is different from air-conditioned buildings to naturally ventilated buildings. In air-
conditioned buildings, people react to thermal comfort by adjusting temperature set-point,
while in naturally ventilated buildings, people adapt by closing or opening windows.
However, there is a condition where occupants do not have the individual adaptation
opportunity. A centralized air-conditioned building does not give occupants an opportunity
Univers
ity of
Mala
ya

12
to have local control on their surrounding air velocity. In this case, the air velocity is
governed by the air flow from the air-conditioning duct.
There are researchers that have found the relationship between air velocity and
operative temperature in their studies. The correlation found by de Dear & Brager (1998)
for air velocity and indoor operative temperature is as shown in Equation (2.6).
V = 0.03 Top – 0.56 (2.6)
The correlation found by Mui & Chan (2003) is as Equation (2.7).
V = 0.02 Top – 0.35 (2.7)
2.4 Studies on the adaptive thermal comfort model
A comprehensive review on the adaptive thermal comfort model, which is the relationship
between indoor neutral temperature and outdoor temperature proposed by other researchers,
is discussed further in this section. The research papers studied are on commercial and
residential buildings. The study comprises both air-conditioned and naturally ventilated
buildings. Also, the research papers chosen to be reviewed are from different kinds of
climates such as seasonal, sub-tropical and tropical climates.
2.4.1 Study in sub-tropical Hong Kong
Many researchers from different countries have been interested in developing an adaptive
thermal comfort model for the past two decades. A study on an adaptive model of air-
conditioned building was carried out in sub-tropical Hong Kong by Mui & Chan (2003).
Field measurements were taken in offices to measure air temperature, globe temperature,
Univers
ity of
Mala
ya
13
air velocity and relative humidity. Besides, questionnaires were distributed to occupants to
collect the data on their thermal sensation vote, activity level and the clothing value of
occupants. The adaptive model was developed based on the measurements from 29 offices
in summer and 26 offices in the winter.
The result shows that the range of acceptable operative temperatures for summer
and winter are 20.8–25.0oC and 19.5–21.5oC respectively. The neutral temperature, which
is the operative temperature at mean thermal sensation vote of zero found from the study is
23.7oC in summer and 21.2oC in winter.
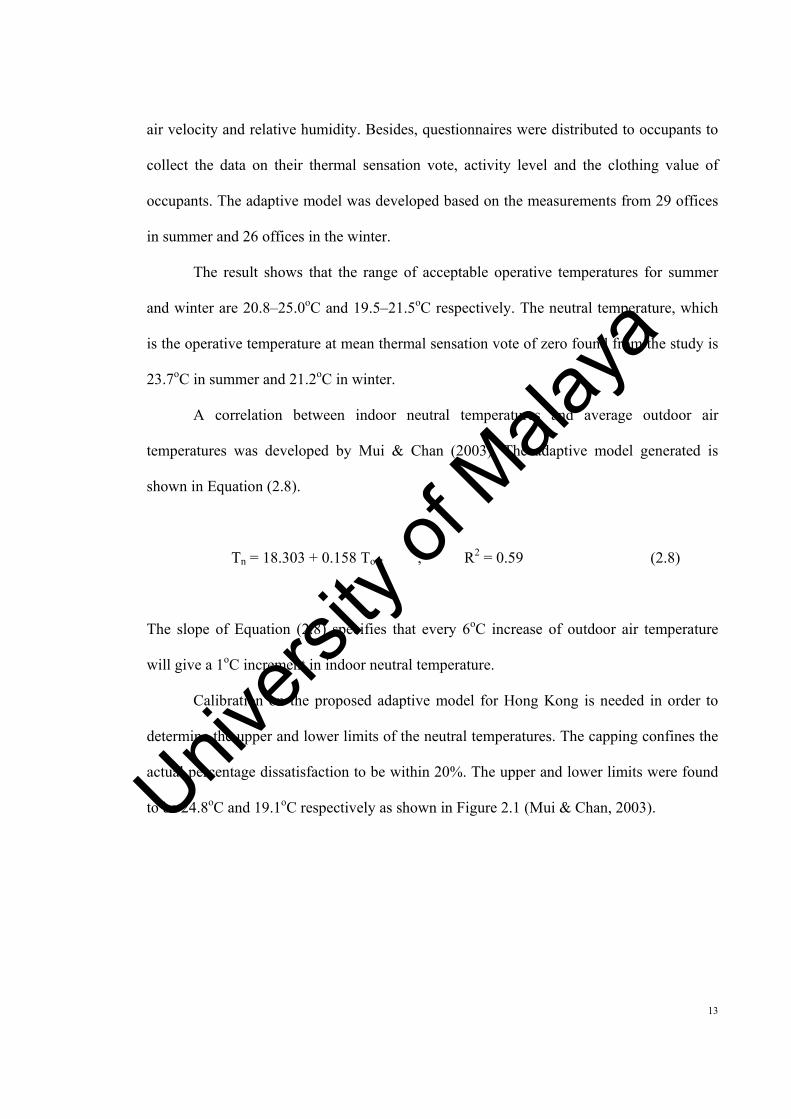
A correlation between indoor neutral temperatures and average outdoor air
temperatures was developed by Mui & Chan (2003). The adaptive model generated is
shown in Equation (2.8).
Tn = 18.303 + 0.158 Tout , R2 = 0.59 (2.8)
The slope of Equation (2.8) specifies that every 6oC increase of outdoor air temperature
will give a 1oC increment in indoor neutral temperature.
Calibration on the proposed adaptive model for Hong Kong is needed in order to
determine the upper and lower limits of the neutral temperatures. The capping confines the
actual percentage dissatisfaction to be within 20%. The upper and lower limits were found
to be 24.8oC and 19.1oC respectively as shown in Figure 2.1 (Mui & Chan, 2003).
Univers
ity of
Mala
ya

14
Figure 2.1 : Calibration of adaptive model for Hong Kong.
Source: (Mui & Chan, 2003)
2.4.2 Studies in five cities in Pakistan
A study was conducted to propose an indoor comfort temperature setting for commercial
buildings in Pakistan (Nicol et al., 1999). The study was conducted during both the summer
and winter seasons in five cities. The details of the climates of each city are shown in Table
2.3. Five to seven buildings were chosen in each city and 10 to 30 occupants participated in
the questionnaire survey in each building.
Table 2.3 : Climate of the five cities in Pakistan.
City Climate Monthly mean outdoor temperature (oC)
Karachi Tropical Coastland 18.1 - 31.4
Multan Sub-tropical Continental, Lowlands Arid 12.8 - 35.5
Quetta Sub-tropical Continental,Highlands Semiarid/Sub-humid 4.9 - 27.8
Islamabad Sub-tropical Continental,Lowlands Sub-humid 10.1 - 31.2
Saidu Sharif Sub-tropical Continental,Highlands Humid 8.2 - 28.7
Source: (Nicol et al., 1999)
y = 0.158x + 18.303
18
19
20
21
22
23
24
25
26
0 10 20 30 40 50
Indoor neutral temperature (oC)
Outdoor temperature (oC)
19.1 < x < 24.8
20% PPD
20% PPD
Univers
ity of
Mala
ya

15
Measurements for air temperature, globe temperature, relative humidity and air
velocity were taken when the questionnaire survey on thermal comfort were distributed to
occupants. The average metabolic rate of the occupants for each city ranged from 1.11 to
1.25 met. Out of 34 studied buildings, only one building had a centralized air-conditioning
system. Most of the buildings were free-running buildings while a minority of them were
mixed mode buildings with cooling systems.
The correlation between indoor neutral temperatures and monthly mean outdoor
temperatures obtained for air-conditioned buildings in Pakistan is as shown in Equation
(2.9) (Nicol et al., 1999).
Tn = 18.5 + 0.36 Tout , R2 = 0.73 (2.9)
The use of Equation (2.9) in determining neutral temperature could save energy in air-
conditioning systems and reduce the maximum cooling load and thus its capital cost.
2.4.3 Study on two climatic zones of Tunisian
Besides the study in Hong Kong and Pakistan, there was another thermal comfort study
carried out in Tunisia, in Africa. In summer, outdoor temperatures can rise to more than
40°C in the south, whereas during winter, the temperature can drop to around 0°C in the
mountains in the North. The study was conducted in five towns with two climatic zones
(Bouden & Ghrab, 2005).
The methods used for collecting data in this study were parameter monitoring and
questionnaire survey. A total number of 200 occupants took part in the questionnaire survey
with a range of metabolic rates from 1.2 to 1.3 met. There were four environmental
Univers
ity of
Mala
ya

16
variables taken during the survey. These variables were air and globe temperature, relative
humidity and the cooling time of the Kata thermometer. The environmental parameters near
the occupants were measured and recorded while the occupants were filling out the
questionnaires (Bouden & Ghrab, 2005).
From the data analysis in the study, it was found that occupants in southern Tunisia
were more satisfied with low temperatures than the occupants in northern Tunisia. Hence, it
was concluded from the study that for all the five towns, there is a strong relationship
between neutral temperatures and outdoor temperatures. The relationships are shown in
Equations (2.10) and (2.11) (Bouden & Ghrab, 2005) where Tn-Griffiths and Tn-Brager is the
neutral temperature calculated via Griffiths’ and Brager’s method respectively. The
correlation is important in designing a comfortable indoor temperature.
Tn-Griffiths = 0.518 Tout + 10.35 , R2 = 0.96 (2.10)
Tn-Brager = 0.680 Tout + 6.88, R2 = 0.99 (2.11)
2.4.4 Other studies related to an adaptive thermal comfort model
Besides the finding discussed above, there are also some other researchers who have
proposed adaptive thermal comfort models in their own studies. According to Humphreys
(Milne, 1995), the relationship between indoor neutral temperatures and monthly mean
outdoor temperatures for air-conditioned buildings is given by Equation (2.12).
Tn = 18.6 + 0.16 Tout (2.12)
Univers
ity of
Mala
ya

17
Auliciems also developed a correlation for both naturally and mechanically ventilated
buildings using daily mean outdoor temperature as shown in Equation (2.13) (Auliciems &
de Dear, 1986).
Tn = 17.6 + 0.31 Tout (2.13)
Nicol proposed the adaptive model as shown in Equation (2.14) (Nicol, 1995) for Pakistan
and Equation (2.15) (Nicol, 2004) for free-running buildings in tropical climates worldwide
with Tout as the mean outdoor temperature.
Tn = 17.0 + 0.38 Tout (2.14)
Tn = 12.9 + 0.534 Tout (2.15)
Humphreys (1978) has determined a correlation for free-running buildings using daily
mean outdoor temperature as shown in Equation (2.16).
Tn = 11.9 + 0.534 Tout (2.16)
In another study, the relationship obtained by Humphreys & Nicol (2000) for free-running
buildings with Tout as the monthly mean outdoor temperature is shown in Equation (2.17).
Tn = 13.5 + 0.54 Tout (2.17)
In summary, based on all the findings above, it is noted that at the current stage, there is no
study on an adaptive thermal comfort model conducted in buildings in hot and humid
Univers
ity of
Mala
ya

18
Malaysia. Thus, a field work study in buildings in Malaysia is needed in order to develop
an adaptive thermal comfort model for local use.
2.5 Discussion
2.5.1 Relation between PMV and AMV
As mentioned in the previous chapter, thermal comfort is a situation where the occupant
feels satisfied with the indoor environment. The PMV model, which is based on a thermo-
neutrality concept, was developed to determine the thermal comfort level for occupants
inside a room or a building (van Hoof, 2008).
However, studies show that the PMV model underestimates thermal impressions
because of the steady-state assumptions in the laboratory during the model derivation.
Other than that, the metabolic rate and the clothing value derived from only a sampling
study based on laboratory investigation may also lead to the inaccuracy of the PMV model.
Thus, the PMV model is unsuitable for use in real buildings due to the unstable physical
environment and metabolic rates (Chun et al., 2004).
On top of this, the PMV model can only be used when occupants are exposed to a
constant environment with a constant metabolic value for a long period of time. The reason
for this is because the PMV model does not take into account the psychological and
behavioural adaptations in the actual situation. Hence, the PMV model might be inaccurate
for global applications since some of the model’s parameters are not precisely specified
(Brager & de Dear, 1998).
Field measurements were conducted by Buratti and Ricciardi by distributing
questionnaires to occupants and using a special microclimatic acquisition system in the
Univers
ity of
Mala
ya

19
measurements. These researchers compared the PMV values obtained from both field
measurements and questionnaires data. The findings showed that questionnaires data tends
to give more discomfort conditions compared to the measurement data (Buratti & Ricciardi,
2009).
In addition to these results, Becker and Paciuk also found that the actual thermal
sensation votes were reported higher than the predicted mean votes from the Fanger model
(Becker & Paciuk, 2009). Since the PMV model was not accurate for application, an
adaptive model is created according to different conditions. According to van Hoof, the
PMV model can be improved by modifying the model itself or by increasing the precision
of the input parameters of the model (van Hoof, 2008). Meanwhile, Humphreys and Nicol
stated that the cause of the difference between the predicted mean vote and the actual mean
vote are the variables in the PMV calculation (Humphreys & Nicol, 2002).
In order to overcome these discrepancies between PMV and AMV in warm climates,
Fanger and Toftum recommended an expectancy factor, e, to be added to the PMV model.
This factor could reveal why the PMV model does not comply with the occupants’ actual
mean votes in non-air-conditioned buildings. Thus, the expectancy factor could expand the
usage of the PMV model, which was developed at a specific laboratory based on
conventional heat-balance theory (Fanger & Toftum, 2002).
2.5.2 Variables in PMV
Fanger’s PMV model was developed based on six variables, which include air temperature,
mean radiant temperature, relative humidity, air velocity, metabolic rate and clothing
insulation. If each of these variables introduces a minor error, this will eventually lead to a
major error in the whole PMV model. The PMV model becomes more complex in heated or
Univers
ity of
Mala
ya

20
cooled buildings because an indoor temperature is dependent on the outdoor temperature
(Nicol, 2004).
There are some suggestions from researchers all around the world on the matter of
the PMV variables. Firstly, Mui and Chan suggested that indoor temperature should be set
based on different occupations in a country with different climates (Mui & Chan, 2003).
Then, Nicol showed that in a hot and dry climate, air temperature could be reduced by as
much as 4°C with the presence of air movement. Humidity and air movement are important
factors in reducing air temperature by heat lost through evaporation (Nicol, 2004). Wong et
al also made a suggestion regarding the building facade, especially at the window opening
area. By having a higher air movement from the window area, occupants’ thermal comfort
could be improved (Wong et al., 2002).
In contrast, another research study showed that in order to achieve thermal comfort
in a moist environment, the air temperature should be at a low level. This is because
occupants might feel thermal discomfort even from small changes in temperature in a moist
environment compared to a dry environment. Generally, loss of metabolic heat by
convection and radiation will be reduced in hot conditions and most of the body heat losses
are through evaporation. In this condition, it is necessary to note that the higher the
humidity, the higher the discomfort level (Nicol, 2004).
Other than that, there are also studies that found that metabolic rate is related to
one’s activity level rather than the environmental temperature (Bouden & Ghrab, 2005).
Goto et al stated that metabolic rate is controlled by a human’s body mass, fitness and
blood flow (Goto et al., 2002). Finally, there is a study showing that heat transfer through
multiple layers of clothing should be taken into account in determining thermal comfort
(van Hoof & Hensen, 2006).
Univers
ity of
Mala
ya

21
2.5.3 Uncertainty in PMV
The fundamental principle of an adaptive model is that people will take any action to
achieve thermal comfort if there are any changes that generate discomfort (Nicol &
Humphreys, 2002). Hence, the adaptive actions are of significant importance in order to
attain a better thermal comfort environment (Feriadi & Wong, 2004). These actions are
called behavioural adjustments, which were not considered in a PMV model. Occupants
will make behavioural adjustments, such as take off clothing, open windows, turn on a fan
or take cold drinks when they feel thermal discomfort. These actions are performed to
achieve the individual’s own thermal comfort (Yao et al., 2009). Thus, to a certain extent,
the static heat balance model could be partially adaptive from the behavioural aspect
because it considers the clothing value, activity rate and indoor air parameters, which can
be modified by the occupants (Brager & de Dear, 1998).
Besides, before making any prediction, it is important to make sure the input data,
which includes the four environmental parameters, activity rate and clothing insulation are
measured properly and carefully. In contrast, researchers Sekhar and Ching found a strong
relationship between air velocity, relative humidity, temperature, PMV and PPD (Sekhar &
Ching, 2002). Hence, set points of variables should be examined because a change in one of
the variables will affect the value of the other variables. Moreover, most of the predicted
values overestimated both air velocity and air temperature (Cheong et al., 2003).
During fieldwork measurements, it was difficult to measure clothing values
precisely. The error of the calculated clothing value can reach up to 20%, depending on
which algorithms and tables or charts are being used (Brager et al., 1993). For activity level,
the measurement of metabolic rate should be as accurate as possible in order to achieve
precise thermal comfort evaluation. This is because for a person who is either walking or
Univers
ity of
Mala
ya

22
seated quietly, both activities will affect different heat and energy dissipation (Wang et al.,
2006). Thus, incorrect measurement of activity rate and clothing value might lead to PMV
inaccuracy (van Hoof, 2008).
In another example, Nicol & Raja (1996) conducted a two-day survey in Oxford
Brookes University, in which they found that the body effective surface area can be
reduced by 2% with every degree increment in temperature when a person changes his/her
posture with regard to temperature. It was also noted that a person’s thermal sensation votes
are different between indoor and outdoor settings. Thus, the indoor thermal comfort model
is not appropriate to be used for outdoor environments (Peter, 2002). Moreover, in air-
conditioned buildings, occupants have higher expectations on the thermal environment.
They prefer a uniform and cool environment and are very sensitive to any small changes in
the thermal environment (de Dear et al., 1997).
Besides the factors described above, there are other minor factors affecting the
PMV model. Individuals in every country in the world have different perceptions on the
thermal comfort level (Humphreys, 2005). Thus, the thermal comfort standard should be
adjusted for people from different countries (Wang, 2006). Some studies found that elderly
have similar comfort perceptions as younger ones. Nevertheless, the elderly might prefer
higher ambient temperatures, since they have a lower basal metabolism and activity level
(Havenith, 2001; van Hoof & Hensen, 2006). Furthermore, people could express different
views when answering the questionnaires, even if they share the same culture and stay in
the same area with the same climate (Kuchen & Fisch, 2009).
Univers
ity of
Mala
ya

23
2.5.4 The importance of an adaptive model
Since the 1990s, researchers have been suggesting a better thermal adaptation and
occupants’ thermal comfort to future service engineers and architects. The building service
engineers should focus more on the indoor climate and ‘human aspects’ in order to include
adaptive models in their building design work (Barlow & Fiala, 2007). By having this
functional design, a building can achieve the thermal comfort level expected by occupants
while at the same time reducing energy usage (Karyono, 2000).
Other than that, Al-Homoud et al has stated that with low energy consumption,
thermal comfort can still be accomplished when air-conditioning in an intermittent process
is combined with a proper operational zoning strategy (Al-Homoud et al., 2009). A special
tool exists, where a computer-aided design for architectural and environmental purposes is
able to calculate and enhance thermal comfort and optimize energy consumption in a
building (Kumar & Mahdavi, 2001).
Wagner et al stated that adaptive thermal comfort models can predict the thermal
sensation of occupants better than those with a predetermined indoor temperature setting
(Wagner et al., 2007). A passively cooled and naturally ventilated building can achieve a
high level of thermal comfort during summer if it is designed appropriately, based on
indoor climate. However, in an air-conditioned building, occupants’ actual thermal comfort
range might not lie within the temperature range recommended in the standards. In this
situation, the adaptive model plays an important role in ensuring thermal comfort for
occupants.
Univers
ity of
Mala
ya

24
2.6 Summary
In summary, even though many amendments have been made to the Fanger PMV model,
there is still no comfort model that can be applied globally. The reason for this is that every
individual’s expectation of the comfort temperature is different, and it is difficult to design
a thermal comfort model that is preferred by a large group of people around the world.
Furthermore, standard thermal neutrality is not necessarily the perfect thermal environment,
since many occupants prefer a non-neutral environment.
According to ASHRAE RP-884 (de Dear et al., 1997), amendments were made to
the PMV model based on 21,000 sets of raw data from 160 buildings around the world.
Nevertheless, all the data were collected up to the year 1997 only. Hence, a new set of
thermal comfort data is required in determining adaptive models because of the significant
climate change after a decade. The local adaptive thermal comfort models are needed for
M&E services engineers and architects in designing their building HVAC systems to
achieve a high thermal comfort level and optimizing energy usage for different types of
buildings.
The methodology will be described in the next chapter.
Univers
ity of
Mala
ya

25
Chapter 3 Methodology
The development of an adaptive thermal comfort model consists of several stages. These
stages were described as below:
Stage 1: Literature Review
Relevant journal papers, conference papers, standards, reports, thesis and books related to
this research topic were searched and studied to understand the scope of research.
Stage 2: Application to conduct fieldwork
Application letters were sent to the management department of the hospitals, offices and
lecture halls in order to get the permission to conduct fieldwork to measure data required
for this research project.
Stage 3: Fieldwork Study
After obtaining approval from the respective management departments, fieldwork was
carried out in different hospitals, office buildings and lecture halls. Physical variables on
indoor and outdoor air temperature, globe temperature, air velocity, relative humidity were
measured and recorded. At the same time, subjective measurements were conducted by
distributing questionnaires to the occupants to survey on their thermal comfort sensation,
activity level and clothing insulation. The details of the questionnaires are as shown in
Appendix A.
Univers
ity of
Mala
ya

26
Stage 4: Development of the adaptive model
Data collected from the physical and subjective measurements were analyzed and plotted in
graphs. The adaptive thermal comfort model, which is the linear regression between neutral
temperature and outdoor temperature for hospitals, offices and lecture halls were developed.
Stage 5: Verification of the adaptive model
The proposed adaptive thermal comfort model for hot and humid Malaysia was verified by
conducting an experiment in a chamber with 10 occupants sitting and working inside.
Stage 6: Calculation of potential energy savings
The amount of energy and cost saving that could be achieved when implementing the
results obtained in this field study was calculated.
Final stage: Thesis report
Thesis report was written at the final stage of this research study.
3.1 Location of Measurement
This research was conducted at hospitals, offices and lecture halls in hot and humid, Kuala
Lumpur, Malaysia. The nine hospital buildings surveyed were the
1) University of Malaya Medical Centre (UMMC)
2) Hospital Putrajaya
3) Hospital Sungai Buloh
4) Hospital Selayang
5) Hospital Klang
Univers
ity of
Mala
ya

27
6) Hospital Kajang
7) Hospital Kuala Kubu
8) Hospital Banting
9) a private hospital (Private Hospital), the actual name is kept anonymous as
requested by the management.
All the hospital buildings use the centralized air-conditioning system. Measurements were
conducted at the staff rooms, nurse counters and the working space of the hospital
personnel, depending on the department visited.
A survey was also conducted in seven office buildings and six lecture halls in
Malaysia. The actual names of the offices are kept anonymous as requested by the
management. The lecture halls are Lecture Hall A to Lecture Hall F, which are Dewan
Kuliah 1 to 6, located in the Faculty of Engineering, University of Malaya. All the offices
and lecture halls surveyed used a centralized air-conditioning system. Measurements were
conducted at the occupied space in both the office buildings and lecture halls. For the
offices, the occupied space is the open-plan shared offices instead of individual offices.
Since all the buildings studied were using the centralized air-conditioning system, the
individual occupants do not have control on the set-point temperature.
3.2 Field measurements
According to the ANSI/ASHRAE Standard 55 (2004), the air temperature, globe
temperature and air velocity has to be measured at the ankle, waist and head levels. These
levels are 0.1 m, 0.6 m and 1.1 m, respectively, above the floor for sitting occupants, and
0.1 m, 1.1 m and 1.7 m for standing occupants. However, relative humidity was measured
at 0.6 m above the floor for sitting occupants and 1.1 m for standing occupants. These
Univers
ity of
Mala
ya

28
thermal comfort parameters together with the outdoor temperatures were measured by
using TSI Alnor Thermo Anemometer, KIMO Thermocouple thermometers and KIMO
Temperature and Humidity data logger as shown in Table 3.1.
Table 3.1 : Instruments description.
Type of instruments Measurement parameter
Accuracy
TSI Alnor thermo Anemometer (Model 440-A)
Temperature
Relative Humidity
Air velocity
Operating range Temperature:-10 to 60oC RH: 0 to 90% Velocity: 0 to 30 m/s Accuracy Temperature: ± 0.3 oC RH: ± 3% Velocity: ± 3% of reading or ± 0.015 m/s, whichever is greater Resolution Temperature: ± 0.1 oC RH: 0.1% Velocity: 0.01 m/s
KIMO Thermocouple thermometers (TK100)
Globe temperature
Operating range From -200 to 1300 Accuracy ± 1.1 oC or ± 0.4% of reading, whichever is greater Resolution 0.1oC
KIMO Temperature and Humidity Datalogger (KH-100-AO)
Temperature
Relative Humidity
Operating range Temperature:-20 to 70 RH: 5 to 95% Accuracy Temperature : ± 1% of reading or ±0.4oC, whichever is greater RH: ± 2.95%
Univers
ity of
Mala
ya

29
3.2.1 Calculation of operative temperature and mean radiant temperature
Operative temperature is used in defining comfort conditions throughout this thesis.
Operative temperature is the average of the mean radiant temperature (MRT) and the
ambient air temperature, weighted by their heat transfer coefficients. However, in usual
practical applications as described in McQuiston et al. (2005), the operative temperature is
calculated as the average of MRT and the ambient air temperature without considering the
heat transfer coefficient as shown in Equation (3.1). The MRT is calculated using Equation
(3.2) (McQuiston et al., 2005).
( )
2mrt a
op
T TT
(3.1)
1/ 24 4 ( )mrt g g aT T CV T T (3.2)
where,
mrtT = mean radiant temperature, K
gT = globe temperature, K
aT = ambient air temperature, K
V = air velocity, m/s
C = 0.247 x 10⁹
3.3 Subjective measurements
In parallel with the field measurements, occupants were requested to fill in the
questionnaires as shown in Appendix A. The questionnaires included the survey on
occupants’ personal particulars, comfort votes, activity levels and clothing insulation. The
details in the questionnaires were explained before the occupants answered the questions.
Univers
ity of
Mala
ya

30
3.3.1 Calculation of Clothing Value
Clothing insulation which is measured in the ‘clo’ unit, is basically an estimation of the
insulating properties of clothing using table from the ASHRAE Fundamentals Handbook
(2009) as shown in Appendix B. The clothing value is determined from the aforementioned
table based on occupants’ garment checklist in the questionnaires. The clo value of a person
is calculated by adding together all the clo value of each garment that the person was
wearing. Note that the clothing value of occupants in this research study is without taking
consideration of the chair insulation.
3.3.2 Calculation of Metabolic Rate
Activity level of occupants is measured in metabolic rate. The metabolic rate is determined
based on the questionnaires filled by occupants and the table in ASHRAE Fundamentals
Handbook (2009) as shown in Appendix C. Both the metabolic rate and clothing insulation
were calculated as the average value over a period of half an hour to one hour after the
physical measurements, as recommended by the ANSI/ASHRAE Standard 55 (2004).
3.3.3 Calculation of PMV and PPD
In this study, the actual mean vote (AMV), which is the comfort votes collected from the
questionnaires is compared with the predicted mean vote (PMV), which is calculated based
on Fanger’s thermal comfort model. The ASHRAE Thermal Comfort Program (1995) is
used to calculate the value of PMV and the predicted percentage of dissatisfied occupants
(PPD). This program was developed by Marc Fountain, Environmental Analytics at UC
Berkeley.
The sample of the program is shown in Figure 2.1. The program inputs are the air
temperature, MRT, air velocity, relative humidity, activity level and clothing insulation of
Univers
ity of
Mala
ya

31
the occupants. The desired outputs are PMV and PPD. From Figure 2.1, the parameters to
be entered are on the left column and the results generated are on the right column.
Figure 3.1 : ASHRAE Thermal Comfort Program.
3.4 Verification of the adaptive model
The adaptive thermal comfort model proposed in this thesis was verified by conducting an
experiment in a centralized air-conditioned chamber in the Faculty of Engineering,
University of Malaya with 10 occupants sitting and working inside. The details of the 10
occupants are shown in Table 3.2. They performed sedentary work and wore clothing of an
average of 0.41 clo. During the experiment, the room temperature was adjusted at a range
of 23 - 27oC. The experiment took about four hours for every 1oC temperature increment.
The subjects were asked to fill in the questionnaires on their thermal sensation and personal
Univers
ity of
Mala
ya

32
variables such as clothing value and activity level after every two hours during the
experiment period.
Table 3.2 : Details of the 10 occupants participated in the verification experiment.
No. Name Staff / Student Gender Age
1. Yau Yat Huang Staff Male 40-50
2. Kazi Md. Salim Newaz Staff Male 40-50
3. Mahidzal bin Dahari Staff Male 30-40
4. Ahmad Badarudin bin
Mohamad Badry Staff Male 30-40
5. Phuah Kok Sun Staff Male 20-30
6. Ding Lai Chet Staff Male 20-30
7. Lian Yee Cheng Staff Male 20-30
8. Chan Hon Ki Student Male 20-30
9. Tommy Chang Student Male 20-30
10. Shafawati Shahneel Student Female 20-30
The aforementioned experiment was used to verify the adaptive models developed
for hospitals, office buildings and lecture halls, respectively. The experiment was
conducted in the chamber at University of Malaya instead of real buildings because it is
difficult to get approval from the buildings’ managements. The verification required the
building’s indoor air temperature adjusted from 23 - 27oC and feedback from the occupants
for every increment of the temperature. Such verification will influence their daily
operation and therefore the managements do not allow the experiment to be conducted at
their place. Hence, the verification has to be conducted at the chamber. However, since the
adaptive models for hospitals, offices and lecture halls share the same verification purpose,
which is to determine the occupant’s thermal comfort vote in different combinations of
Univers
ity of
Mala
ya

33
indoor and outdoor temperatures, hence the same experiment could be applied for all these
three types of buildings.
In parallel to the subjective measurements, the physical measurements on indoor air
temperature, globe temperature, air velocity, relative humidity and outdoor temperature
were taken simultaneously. Indoor air temperature, relative humidity and outdoor
temperature were measured using the KIMO Temperature and Humidity Data Logger as
shown in Table 3.1. The sampling times were set to 1 minute for the data logger.
On the other hand, the globe temperature and the air velocity were measured using
TSI Alnor thermo Anemometer and KIMO Thermocouple thermometers after every one
hour during the experiment period. At least 40 samples with sampling time of 30 seconds
were taken during each measurement.
3.5 Summary
The details of the research method in the present work have been described in this chapter.
The results and discussion for hospital field work will be elaborated in the next chapter.
Univers
ity of
Mala
ya

34
Chapter 4 Results and Discussion – Field Work Study in Hospitals
Surveys were done in the nine hospitals with 41 departments in Kuala Lumpur, Malaysia in
the years 2009 and 2010. A total number of 293 workers who took part in this survey were
the workers on duty during the field measurement’s period of about four hours for each
department. On an average of 7 persons for each department, the questionnaires survey is
sufficient for analysis. This is because in the real situation, the number of workers located
in each department is less than 10 persons.
Besides that, the space or room size does not matter since most of the hospitals have
a constant air volume (CAV) system in their air handling unit (AHU). In the CAV system,
the supply air flow rate is constant and serves only a single thermal zone. Hence, no matter
what is the room size, as long as the rooms share the same AHU, they will have the same
supply air flow rate and air temperature.
The questionnaires have been distributed to the personnel on duty stay in the
department for at least one hour. This is to ensure that they have an actual thermal
perception on the current environment rather than mixing with the previous environment
where he or she comes. The response rate was 100%, the ratio of respondents between
male-female was 1:2.5 and the age groups was between 23 - 45 years old. The physical
parameters and the results from the subjective measurement are shown in Tables 4.1 and
4.2, respectively. The details of all the measurements are shown in Appendix D.
Univers
ity of
Mala
ya

35
Table 4.1 : Physical parameters measured and calculated in nine hospitals.
Hospital Department Tair
(oC)Tglobe
(oC)V
(m/s)RH (%)
MRT (oC)
Top
(oC)
UMMC Pharmacy 22.2 23.2 0.13 74.2 24.1 23.1
Otorinolaringologi 22.7 22.7 0.07 76.2 22.7 22.7
Oftalmologi 22.7 22.4 0.10 73.8 22.2 22.4
Emergency Consultation Hall 21.0 22.5 0.11 73.1 23.7 22.3
Observation ward 20.3 21.4 0.11 75.4 22.3 21.3
Putrajaya Pediatric ward 24.1 24.1 0.06 64.4 24.1 24.1
Orthopedic ward 23.3 23.2 0.11 56.7 23.1 23.2
Female medical ward 23.3 25.6 0.07 53.7 27.0 25.1
Pharmacy 22.5 22.5 0.15 65.3 22.5 22.5
X-ray & radiography 21.3 21.3 0.20 68.4 21.3 21.3
Out-patient pharmacy 22.2 22.2 0.16 53.1 22.2 22.2
Day care unit 21.8 21.8 0.19 56.9 21.8 21.8
Sungai Outpatient pharmacy 21.5 21.4 0.12 67.5 21.2 21.4
Buloh Pathodology unit 21.6 21.8 0.12 70.4 22.0 21.8
X-Ray workstation 22.6 21.9 0.11 68.9 21.3 22.0
Pediatric ward 23.0 23.3 0.11 68.3 23.5 23.2
Maternity ward 21.8 21.7 0.10 64.0 21.6 21.7
Selayang Outpatient pharmacy 20.2 20.4 0.11 63.7 20.5 20.3
Pediatric ward 23.5 23.7 0.13 61.1 23.9 23.7
Maternity ward 25.4 25.6 0.20 56.3 25.8 25.6
Pathodology unit 23.2 23.5 0.12 64.6 23.7 23.4
X-ray workstation 21.5 21.7 0.12 67.8 21.8 21.6
Klang Picture Archiving Communication 24.4 24.4 0.23 50.6 24.4 24.4
Pathology 23.1 23.1 0.28 46.3 23.1 23.1
X-ray & radiography 25.2 25.2 0.16 70.3 25.2 25.2
Cytology laboratory 20.9 20.9 0.49 47.8 20.9 20.9
Endoscopy 20.7 20.7 0.05 74.7 20.7 20.7
Medical day care 22.2 22.2 0.06 71.3 22.2 22.2
Kajang Clinic 25.4 25.4 0.17 52.4 25.4 25.4
Haemodialisis 25.8 25.8 0.16 59.2 25.8 25.8
Pharmacy 25.2 25.2 0.17 57.8 25.2 25.2
X-ray & radiography 23.4 23.4 0.21 53.2 23.4 23.4
Private Accident & Emergency ward 21.7 21.7 0.57 61.5 21.7 21.7
Labor ward 22.4 22.4 0.44 67.2 22.4 22.4
Delivery Suite 21.8 21.8 0.53 65.2 21.8 21.8
Intensive Care Unit 22.7 22.7 0.41 72.8 22.7 22.7Kuala Hematologi lab 26.0 26.0 0.18 54.1 26.0 26.0 Kubu Pharmacy 24.5 24.5 0.12 53.8 24.5 24.5
Univers
ity of
Mala
ya

36
X-Ray workstation 26.9 26.9 0.08 54.1 26.9 26.9
Banting Pathology Unit 22.5 24.9 0.29 62.3 27.9 25.2
Pharmacy 23.0 24.8 0.09 57.3 26.1 24.5
Table 4.2 : Subjective measurements of occupants in nine hospitals.
Hospital Department met clo AMV APD (%) PMV PPD
(%)
UMMC Pharmacy 1.33 0.69 -0.75 25.0 0.12 5.0
Otorinolaringologi ward 1.20 0.48 -0.65 30.0 -0.48 10.0
Oftalmologi ward 1.08 0.52 -1.00 30.0 -0.75 17.0
Emergency Consultation Hall 1.32 0.48 -0.90 10.0 -0.53 11.0
Observation ward 1.26 0.42 -1.00 25.0 -0.89 22.0
Putrajaya Pediatric ward 1.34 0.42 0.60 0.0 -0.04 5.0
Orthopedic ward 1.25 0.44 -0.67 20.0 -0.33 7.0
Female medical ward 1.23 0.43 -0.35 15.0 -0.01 5.0
Pharmacy 1.30 0.61 -1.60 40.0 -0.25 6.0
X-ray & radiography 1.28 0.79 -1.20 40.0 -0.29 7.0
Out-patient pharmacy 1.36 0.67 -0.80 20.0 -0.11 5.0
Day care unit 1.40 0.62 -1.50 25.0 -0.34 7.0
Sungai Outpatient pharmacy 1.15 0.77 -0.10 45.0 -0.61 13.0
Buloh Pathodology unit 1.70 0.80 0.10 10.0 0.55 11.0
X-Ray workstation 1.40 1.34 0.10 5.0 0.79 18.0
Pediatric ward 1.43 0.48 0.30 30.0 0.00 5.0
Maternity ward 1.50 0.70 -0.20 25.0 0.17 6.0
Selayang Outpatient pharmacy 1.40 1.37 -2.40 21.0 0.51 10.0
Pediatric ward 1.43 0.48 -0.80 16.0 0.02 5.0
Maternity ward 1.50 0.70 -0.40 28.8 0.80 19.0
Pathodology unit 1.20 0.85 -1.20 14.0 0.27 7.0
X-ray workstation 1.20 1.17 -1.70 11.0 0.29 7.0
Klang Picture Archiving Communication 1.40 0.38 1.00 0.0 -0.27 6.0
Pathology 1.40 0.62 -1.00 50.0 -0.20 6.0
X-ray & radiography 1.50 0.54 0.33 33.3 0.65 14.0
Cytology laboratory 1.50 0.75 -1.67 66.7 -0.47 10.0
Endoscopy 1.60 0.42 1.50 75.0 -0.35 8.0
Medical day care 1.36 0.51 0.77 33.0 -0.16 6.0
Kajang Clinic 1.13 0.44 -1.33 33.3 -0.33 7.0
Haemodialisis 1.40 0.60 0.00 0.0 0.70 15.0
Pharmacy 1.55 0.44 1.00 0.0 0.41 8.0
X-ray & radiography 1.40 0.66 -1.25 25.0 0.06 5.0
Private Accident & Emergency ward 1.40 0.59 -2.00 50.0 -0.89 22.0
Univers
ity of
Mala
ya

37
Labor ward 1.70 0.38 -2.00 50.0 -0.53 11.0
Delivery Suite 1.70 0.38 -1.00 33.3 -0.82 19.0
Intensive Care Unit 1.40 0.40 -1.00 25.0 -0.94 24.0
Kuala Kubu Hematologi lab 1.26 0.54 -1.40 40.0 0.47 10.0
Pharmacy 1.18 0.52 0.08 15.4 -0.06 5.0
X-Ray workstation 1.14 0.58 1.00 0.0 0.66 14.0
Banting Pathology Unit 1.30 0.48 -0.71 28.6 -0.26 6.0
Pharmacy 1.15 0.59 -1.00 0.0 -0.08 5.0
4.1 Behavioural adaptations
Behavioural adaptations are commonly represented by clothing insulation, activity level
and air velocity as suggested by ASHRAE RP-884 (de Dear et al., 1997).
4.1.1 Clothing insulation
The relationship between the clo value and both indoor operative temperature and outdoor
temperature for the nine studied hospitals is shown in Figures 4.1 and 4.2 respectively.
Figure 4.1 : Relationship between clothing insulation and indoor operative temperature.
y = ‐0.0523x + 1.8198R² = 0.1371
0
0.2
0.4
0.6
0.8
1
1.2
1.4
1.6
20.00 21.00 22.00 23.00 24.00 25.00 26.00 27.00 28.00
Average
clothing value (clo)
Operative temperature (oC)
Univers
ity of
Mala
ya

38
Figure 4.2 : Relationship between clothing insulation and outdoor temperature.
By referring to Figure 4.1, the correlation between the clothing insulation and the operative
temperature for the hospitals in Malaysia is given by Equation (4.1).
Clo = -0.0523 Top + 1.8198 (4.1)
Other researchers have done a similar analysis, and their results are shown in Equations
(2.2) to (2.4).
Note that Equations (2.2) to (2.4) has been developed for the HVAC buildings, air-
conditioned offices and free running buildings respectively. These equations are used to
compare the correlation found in the hospitals in hot and humid Malaysia, although there is
a difference in the building type and climate context. This is because so far, there is no
other similar study on the behavioural adaptations conducted in hospitals in hot and humid
climates that can be used as a reference.
The difference between Equation (4.1) and both Equations (2.2) and (2.3) can be
explained by the uniforms worn by the hospital workers in Malaysia. Generally, the
y = ‐0.0504x + 2.2007R² = 0.1581
0
0.2
0.4
0.6
0.8
1
1.2
1.4
1.6
27 28 29 30 31 32 33 34 35
Average
clothing value (clo)
Outdoor temperature (oC)
Univers
ity of
Mala
ya

39
hospital workers, mostly female nurses in Malaysia, wore a scarf on the head (the scarf is
called tudung), which is one of the religion practices for the Malay females. The ‘tudung’
adds to the thermal insulation of the clothing, hence they will feel warmer compared to
others without tudung. When the indoor operative temperature is increased by 1oC, the
hospital workers in Malaysia will adjust their clothing by decreasing 0.052 clo compared to
0.04 clo in other countries.
Figure 4.2 shows the linear regression between the clothing value and the outdoor
temperature for the hospitals in Malaysia. The correlation is given in Equation (4.2).
Clo = -0.0504 Tout + 2.2007 (4.2)
Researchers (Mui & Chan, 2003) have found the correlation for offices in Hong Kong as in
Equation (2.5). The discrepancy between Equations (4.2) and (2.5) indicates that the people
in Hong Kong and Malaysia show different thermal adaptations to the changes of weather
in their countries.
4.1.2 Activity level
In Figure 4.3, it has been found that the regression line is almost horizontal with a
maximum of 1.70 met, a minimum of 1.08 met and an average of 1.36 met. In this case, the
average met is higher than 1.2 met found by other researchers such as (Bouden & Ghrab,
2005; de Dear & Brager, 1998; Mui & Chan, 2003) because the staffs are required to move
around compared to the office workers, who are just doing sedentary work. Activities such
as pushing patients’ beds, trolleys and checking the blood pressure or other conditions of
each patient in different rooms requires a higher metabolic rate. Figure 4.3 indicates clearly
that the activity level is almost independent of the indoor operative temperature. The
Univers
ity of
Mala
ya

40
activity level should be the function of work performed by staff, especially in the hospitals,
rather than depending on the operative temperature. In other words, a person’s activity level
should depend on his or her job requirement itself rather than the ambient temperature.
Figure 4.3 : Relationship between activity level and operative temperature.
4.1.3 Air velocity
Figure 4.4 shows the linear regression between the indoor air velocity and the operative
temperature in the hospitals and is depicted in Equation (4.3).
V = -0.0127 Top + 0.4747 (4.3)
y = ‐0.0239x + 1.9127R² = 0.0635
0.8
0.9
1
1.1
1.2
1.3
1.4
1.5
1.6
1.7
1.8
20.00 21.00 22.00 23.00 24.00 25.00 26.00 27.00 28.00
Average
activity level (met)
Operative temperature (oC)
Univers
ity of
Mala
ya

41
Figure 4.4 : Relationship between indoor air velocity and operative temperature.
Note that the slope found in this study was a negative slope, but the slope found by
de Dear & Brager (1998) and Mui & Chan (2003) in Equations (2.6) and (2.7) are a
positive slope. According to the ASHRAE Standard 55 (2004), occupants will prefer a
higher air speed at a higher operative temperature. However, from the results obtained in
Figure 4.4, it shows that the air speed is decreasing with an increasing operative
temperature. This contrary condition is due to the centralized air-conditioning system in the
hospitals where the air speed is not locally controlled by the workers. In this case, the air
speed is dependent on the air flow from the diffusers. A higher indoor air temperature
comes from a lower air flow from the diffuser. From the theory (Flow Rate = Cross
Sectional Area x Velocity), a lower flow rate will give a lower air velocity. Hence, as
depicted in Figure 4.4, the higher the indoor operative temperature, the lower the air
velocity will be attained. This condition indicates that the workers in hospitals do not
achieve thermal comfort without a local control on the air velocity.
y = ‐0.0127x + 0.4747R² = 0.0264
0
0.1
0.2
0.3
0.4
0.5
0.6
20.00 21.00 22.00 23.00 24.00 25.00 26.00 27.00 28.00
Average
indoor air velocity (m/s)
Operative temperature (oC)
Univers
ity of
Mala
ya

42
4.2 Thermal acceptability
The correlation between the percentage dissatisfied and the operative temperature is shown
in Figure 4.5. In order to obtain an actual percentage dissatisfied (APD) below 20% as
recommended by the ASHRAE Fundamentals Handbook (2009), the operative temperature
range set to be 23.7-27.7oC. The temperature range to keep the predicted percentage
dissatisfied (PPD) below 20% is 19.2-28.5oC. From Figure 4.5, the wide temperature range
for 20% PPD shows that the Fanger’s model has a higher prediction for the human
adaptation ability to the changes in the surrounding temperature.
In contrast, the occupants in Malaysia showed a narrower thermal acceptance of
23.7-27.7oC compared to the predicted value of 19.2-28.5oC when using the Fanger’s
model. The temperature range determined from the 20% PPD was not suitable to be applied
locally. This is because Malaysians are used to the hot and humid climate all year round,
thus they will find 19.2oC to be a cold environment. Hence, the temperature range of 23.7-
27.7oC found from the 20% APD is acceptable and applicable to the hospitals in Malaysia.
Figure 4.5 : Graph of percentage dissatisfied versus operative temperature.
y = 1.0931x2 ‐ 56.092x + 735.22
y = 0.5544x2 ‐ 26.447x + 323.60
10
20
30
40
50
60
70
80
20.00 21.00 22.00 23.00 24.00 25.00 26.00 27.00 28.00
Peercentage
Dissatisfied (%)
Operative temperature (oC)
APD PPD Poly. (APD) Poly. (PPD)
Univers
ity of
Mala
ya

43
4.3 Thermal neutrality
Thermal neutrality is the operative temperature at the mean thermal sensation vote of zero.
From Figure 4.6, the neutral temperature for the predicted mean vote and the actual mean
vote were 23.8oC and 26.4oC, respectively. The difference of 2.6oC between the PMV and
AMV was a significant value, and this implies that in the actual case, the hospital workers
in Malaysia prefer a warmer indoor environment compared to the predicted environment
from the Fanger’s model. This finding is important for the local HVAC design engineers,
since increasing the setting of people’s comfort temperatures in an air-conditioning system
by 2.6°C could save a significant amount of energy consumed in a building.
In the hospitals, the field study has been conducted at the staff working area such as
nurse counter or personnel room. Thus, the recommended neutral temperature is
specifically for the staff working area instead of patient’s bed area. In practical, it is
suggested to install a Variable Air Volume (VAV) system to serve multiple thermal zones
to patients and workers area. The VAV system is important to ensure that both workers and
patients can achieve their own thermal comfort level.
Figure 4.6 : Graph of mean thermal sensation vote versus operative temperature.
y = 0.1844x ‐ 4.8738
y = 0.1333x ‐ 3.1725
‐3
‐2.5
‐2
‐1.5
‐1
‐0.5
0
0.5
1
1.5
2
20.00 22.00 24.00 26.00 28.00 30.00
Mean
Vote
Operative temperature (oC)
AMV PMV Linear (AMV) Linear (PMV)
Univers
ity of
Mala
ya

44
4.4 Adaptive Thermal Comfort Model
In the last decades, many researchers have developed adaptive thermal comfort models for
different countries with different climates. In order to develop an adaptive thermal comfort
model, the relationship between the indoor neutral temperature and the outdoor temperature
must be determined. Table 4.3 shows the neutral temperature and the outdoor temperature
collected from the survey in nine hospital buildings.
Note that the neutral temperature in Table 4.3 is determined from the vote of zero in
the correlation between the actual mean vote and the operative temperature for each
hospital. The details are shown in Appendix E. In the correlation analysis, the neutral
temperature obtained is based on a group preference instead of individual preferences. This
is because according to ASHRAE Fundamentals Handbook (2009), a space or room is
considered comfortable when there are 80% of the occupants feel satisfied with the
environment. Hence, in this condition, a group preference is more practical than individual
preferences.
On the other hand, the outdoor temperature is the mean value collected during the
field measurement for each hospital. The outdoor temperature was recorded every 15
minutes during the field measurement.
Table 4.3 : Neutral temperature and outdoor temperature of nine hospitals.
Hospital Tn (oC) Tout (
oC)
UMMC 27.8 32.1
Putrajaya 24.9 29.3
Sungai Buloh 21.8 29.4
Selayang 26.4 31.0
Klang 21.2 33.3
Kajang 25.8 33.7
Private 27.4 33.5
Kuala Kubu 26.2 31.3
Banting 26.8 31.8
Univers
ity of
Mala
ya
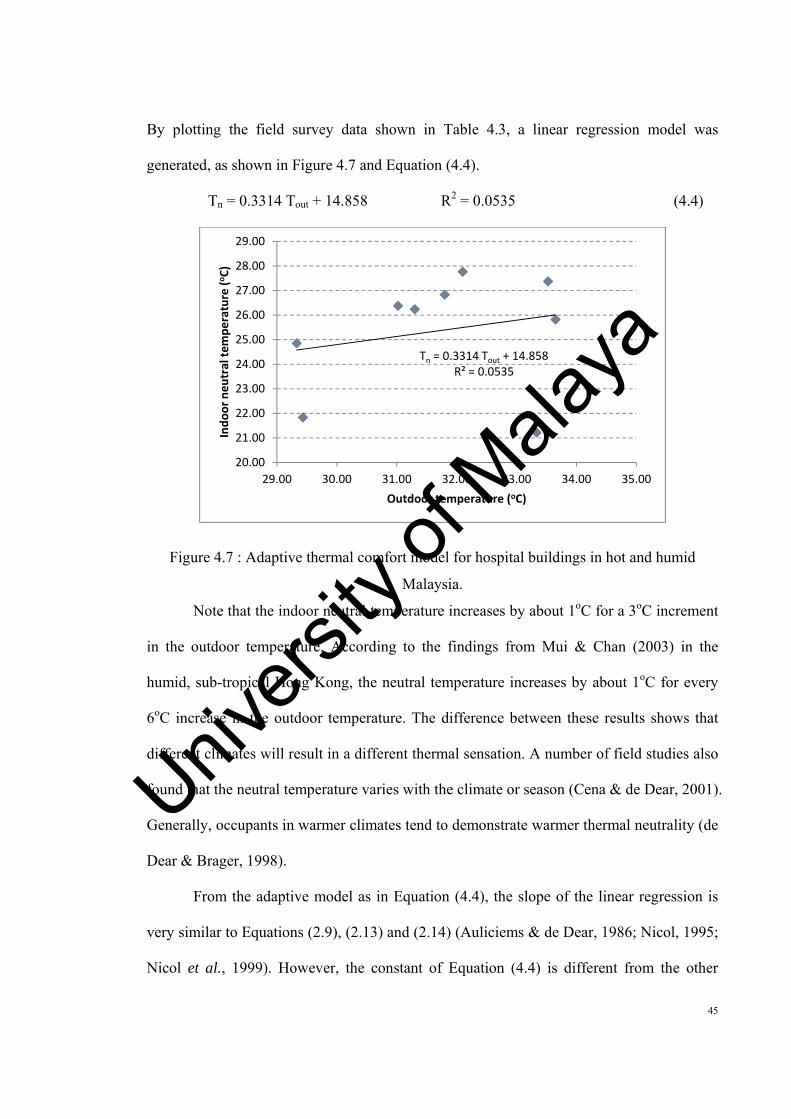
45
By plotting the field survey data shown in Table 4.3, a linear regression model was
generated, as shown in Figure 4.7 and Equation (4.4).
Tn = 0.3314 Tout + 14.858 R2 = 0.0535 (4.4)
Figure 4.7 : Adaptive thermal comfort model for hospital buildings in hot and humid
Malaysia.
Note that the indoor neutral temperature increases by about 1oC for a 3oC increment
in the outdoor temperature. According to the findings from Mui & Chan (2003) in the
humid, sub-tropical Hong Kong, the neutral temperature increases by about 1oC for every
6oC increase in the outdoor temperature. The difference between these results shows that
different climates will result in a different thermal sensation. A number of field studies also
found that the neutral temperature varies with the climate or season (Cena & de Dear, 2001).
Generally, occupants in warmer climates tend to demonstrate warmer thermal neutrality (de
Dear & Brager, 1998).
From the adaptive model as in Equation (4.4), the slope of the linear regression is
very similar to Equations (2.9), (2.13) and (2.14) (Auliciems & de Dear, 1986; Nicol, 1995;
Nicol et al., 1999). However, the constant of Equation (4.4) is different from the other
Tn = 0.3314 Tout + 14.858R² = 0.0535
20.00
21.00
22.00
23.00
24.00
25.00
26.00
27.00
28.00
29.00
29.00 30.00 31.00 32.00 33.00 34.00 35.00
Indoor neu
tral tem
perature (oC)
Outdoor temperature (oC)
Univers
ity of
Mala
ya

46
researchers as shown in Equations (2.8) to (2.17). Furthermore, the R-squared value of
Equation (4.4) is very small compared to the unity, and this questions the appropriateness
of the model. Residual analysis is carried out to check the appropriateness of the adaptive
thermal comfort model. The calculation of the residual analysis is shown in Appendix F. In
Figure 4.8, the residual plots behave randomly and this shows that the adaptive model in
Equation (4.4) provides a decent fit to the data. Hence, a linear regression model is
appropriate for the data.
Figure 4.8 : Residual plots.
To further investigate the reliability of the adaptive model, a T-test was carried out,
comparing the response variable and the fitted value in Appendix F. The Paired T-test
statistical analysis was performed using the mathematics software program SPSS Statistics
20. The results of the Paired T-test are shown in Table 4.4. The results show that the mean
of the response variable minus the fitted value equals -0.00111, and it fell within the 95%
confidence interval between -1.75031 to 1.74809. Besides that, the significance value is
0.999. If the significance value is smaller than 0.05, there is a significant difference. If the
‐5.00
‐4.00
‐3.00
‐2.00
‐1.00
0.00
1.00
2.00
3.00
29.00 30.00 31.00 32.00 33.00 34.00
Residual, e
Outdoor Temperature (oC)
Univers
ity of
Mala
ya

47
significance value is larger than 0.05, there is no significant difference. Note that the
significance value calculated in Table 4.4 is larger than 0.05, thus there is no significant
difference between the response variable and the fitted value from a statistical point of view.
Therefore, the null hypothesis is true and cannot be rejected. It indicates that the adaptive
model proposed is reliable and applicable for hospitals in hot and humid Malaysia.
Table 4.4 : Results of Paired T-test by SPSS Statistics 20.
Paired Differences
t df Sig. (2-tailed)Mean
Std. Deviation
Std. Error Mean
95% Confidence Interval of the
DifferenceLower Upper
Pair Response variable- Fitted value
-0.00111 2.27563 0.75854 -1.75031 1.74809 -0.001 8 0.999
On the other hand, in order to check the validity of the field measurement data, the
bias uncertainty analysis is applied here. According to Yau (2004), in error analysis, the
bias uncertainty (B.U.) for the measurement parameters can be approximately represented
by Equation (4.5).
B.U = (Xmax – Xmin) / n (4.5)
where
X = measurement parameters such as air velocity, air temperature, globe temperature,
relative humidity and outdoor temperature.
n = number of readings
Xmax, Xmin = maximum and minimum value of the measured parameters.
Univers
ity of
Mala
ya

48
A set of data is considered valid for use if the error for the bias uncertainty is less
than 10% (Yau, 2004). After calculation, the five basic parameters in this study, which are
V, Tair, Tglobe, RH and Tout, are all below 10% error bias uncertainty (as shown in Appendix
G). Thus, the measured parameters are all valid to be used in determining the adaptive
thermal comfort model.
Note that the error analysis for the air velocity is much higher compared to that of
the other parameters. The highest value recorded is 9.84% uncertainty for the air velocity.
This is because an accurate measurement of a low air velocity is difficult (Melikov et al.,
2007). Also, a more reliable sensor reading is possible only if the air velocity is more than 2
m/s (Thomas et al., 1998). Nevertheless, the bias uncertainty error for the air velocity is
still less than 10% and thus at an acceptable level.
4.4.1 Upper and lower limits of the adaptive model
In order to obtain an adaptive thermal comfort model that is suitable for application in the
hospitals in Malaysia, a calibration to determine the upper and lower limits of the model is
needed. According to the ASHRAE Fundamentals Handbook (2009), a comfort zone is
when 80% of the occupants find the environment are thermally acceptable. In other words,
a comfort or neutral zone is a zone of maximum allowable of 20% occupants’
dissatisfaction.
In Figure 4.9, for a maximum of 20% actual percentage dissatisfied (APD), the
range for the indoor neutral temperature is 23.3 - 26.5oC. The outdoor temperature range is
25.4 - 35.0oC as shown in Figure 4.10. If the outdoor temperature is lower than 25.4oC, the
recommended indoor neutral temperature will be constant at 23.3oC. In turn, when the
outdoor temperature is higher than 35.0oC, the recommended indoor neutral temperature
will be constant at 26.5oC.
Univers
ity of
Mala
ya

49
The adaptive thermal comfort model in combination with the upper and lower limits
is important as a good guide to the local mechanical engineers, especially in the consulting
firms. In designing HVAC system, this model can help to reduce the energy consumption
as well as to achieve a high level of thermal comfort for the hospital workers in the tropics.
Figure 4.9 : Graph of APD versus indoor neutral temperature.
Figure 4.10 : Upper and lower limits of adaptive thermal comfort model.
y = 1.6486x2 ‐ 81.962x + 1034.5R² = 0.5031
0.00
5.00
10.00
15.00
20.00
25.00
30.00
35.00
40.00
45.00
50.00
20.00 21.00 22.00 23.00 24.00 25.00 26.00 27.00 28.00 29.00
Average
APD (%)
Indoor neutral temperature (oC)
y = 0.3314x + 14.858
23
23.5
24
24.5
25
25.5
26
26.5
27
24 26 28 30 32 34 36 38
Indoor neu
tral tem
perature (oC)
Outdoor Temperature (oC)
20% APD
20% APD
25.4 < T,out < 35.0
23.3 < T,neutral < 26.5
Univers
ity of
Mala
ya

50
4.4.2 Verification of the proposed adaptive model
The methodology for the verification of the adaptive model is shown in Chapter 3.4. The
measurements collected during the experiment in a chamber are shown in Table 4.5. From
the results in Table 4.5, a graph of actual mean votes versus indoor operative temperature
was plotted in Figure 4.11. Figure 4.11 shows that the indoor neutral temperature collected
during the experiment was 24.73oC.
In contrast, by using the adaptive model proposed in Equation (4.4), the neutral
temperature calculated was 25.07oC at an average outdoor temperature of 30.83oC. The
difference between the neutral temperature calculated using the adaptive model and the
neutral temperature measured during the experiment was 0.34oC or 1.36 %. This
discrepancy is due to the difference of clothing values and activity levels between the
hospitals and the experimental chamber.
For the hospitals, the average clothing value and activity level were 0.61 clo and
1.36 met, respectively. For the chamber, the average value was 0.41 clo and 1.14 met. The
hospital workers had a higher clothing value and metabolic rate because they use lab coats
and are moving around the ward to monitor the patients or carry out their nursing work.
This implies that people with different clothing insulation and activity level will have a
different feeling on their thermal comfort level. Since the discrepancy is only 1.36 % as
mentioned above, the adaptive model proposed in this thesis is valid for use in Malaysian
hospitals.
Univers
ity of
Mala
ya

51
Table 4.5 : Measurements during experiment in a chamber.
Tair (oC)
Tglobe
(oC) V (m/s) RH (%)MRT (oC) Top (
oC) AMV Tout (oC)
22.74 23.00 0.08 68.32 23.17 22.96 -1.70 30.4622.90 22.90 0.11 69.07 22.90 22.90 -0.40 32.3224.18 24.50 0.05 70.29 24.67 24.42 0 29.0924.25 24.40 0.06 71.44 24.49 24.37 -0.30 30.9924.66 24.50 0.07 70.58 24.40 24.53 -0.10 32.4324.96 24.90 0.11 70.28 24.86 24.91 -0.10 31.2726.28 26.20 0.06 75.34 26.16 26.22 0.50 31.0026.37 27.50 0.09 72.55 28.27 27.32 1.55 32.0026.42 26.50 0.14 79.99 26.57 26.49 1.10 29.5227.27 26.20 0.10 69.84 25.42 26.34 1.30 29.23
Figure 4.11 : Actual mean vote versus indoor operative temperature in a chamber.
4.5 Summary
In this study, the relationship between the operative temperature and the clothing insulation,
the metabolic rate and the air velocity was successfully established. The adaptive thermal
comfort model for hot and humid climates such as Malaysia was also successfully
developed based on the linear relation between the indoor and outdoor air temperatures.
y = 0.591x ‐ 14.617R² = 0.852
‐2
‐1.5
‐1
‐0.5
0
0.5
1
1.5
2
22.00 23.00 24.00 25.00 26.00 27.00 28.00
Actual M
ean
Vote
Indoor operative temperature (oC)
Univers
ity of
Mala
ya

52
The adaptive model that has been developed in this research is Tn = 0.3314 Tout + 14.858,
with its upper and lower limits of 23.3 - 26.5oC for the indoor neutral temperature and 25.4
- 35.0oC for the outdoor temperature, respectively. This model is suitable for use in the
hospitals in Malaysia since the error is only 1.36 % between the neutral temperatures
calculated using the aforementioned equation and the neutral temperature measured from
the experimental study in a chamber.
The most comfortable or neutral temperature found from the field study in the
hospitals was 26.4oC. In comparison to the recommended temperature of 24.0oC by the
ASHRAE Applications (2007), the proposed neutral temperature for the hospitals in this
study is 2.4oC higher. This difference of 2.4oC has a significant impact on the energy saving
potential of a building, because by increasing the room temperature setting from 24.0oC to
26.4oC, one could decrease the cooling load and thus save a significant amount of energy.
The next chapter will elaborate the results and discussion for the field work study in
office buildings.
Univers
ity of
Mala
ya

53
Chapter 5 Results and Discussion– Field Work Study in Office Buildings
Surveys were done in seven office buildings with 19 departments in Kuala Lumpur,
Malaysia in the years 2009 and 2010. The total number of occupants who took part in the
subjective measurements was 322 people. The field measurements took about four hours
for each office level or department. The questionnaires were given to all the staffs on duty
during the field measurements and the response rate was 100%. The ratio of respondents
between the male-female was 1:1.16 and the age groups were between 19 - 55 years old.
The physical parameters and the results from the subjective measurements are shown in
Tables 5.1 and 5.2, respectively. The detail measurements are shown in Appendix H.
Table 5.1 : Physical parameters measured and calculated in seven office buildings.
Office Level/Department Tair (oC) Tglobe
(oC)V (m/s) RH (%) MRT
(oC) Top (oC)
A Level 1 26.0 23.9 0.02 58.1 23.2 24.6Level 2 26.4 24.3 0.03 60.5 23.4 24.9
B Level 8 21.7 22.8 0.10 52.0 23.6 22.7Level 14 20.8 22.7 0.09 53.3 24.0 22.4Level 17 22.0 22.7 0.08 62.1 23.2 22.6Level 21 22.7 23.7 0.07 60.2 24.3 23.5
C Ground Floor 24.4 25.8 0.09 48.9 26.7 25.6Level 1 23.2 25.6 0.09 44.2 27.2 25.2
D Level 2 24.2 24.2 0.04 53.0 24.2 24.2Level 4 23.9 23.9 0.03 52.9 23.9 23.9
E Human Resource Department 22.9 24.1 0.05 61.9 24.8 23.9Corporate Department 22.7 23.4 0.03 60.7 23.6 23.2
F Level 1 20.2 21.4 0.09 55.8 22.3 21.3Ground Floor 23.4 23.4 0.09 62.0 23.4 23.4
G Level 19, Tower 1 23.9 24.0 0.15 57.8 24.0 23.9Level 20, Tower 1 23.1 23.6 0.18 60.0 24.1 23.6Level 10, Tower 2 23.2 23.7 0.09 59.2 24.0 23.6
Level 15, Tower 2 23.3 23.0 0.08 59.0 22.8 23.1 Level 26, Tower 2 21.2 21.5 0.11 62.3 21.7 21.5
Univers
ity of
Mala
ya

54
Table 5.2 : Subjective measurements of occupants in seven office buildings.
Office Level/Department met clo AMV APD (%) PMV PPD
(%)
A Level 1 1.10 0.48 0.70 40.0 -0.19 6.0
Level 2 1.06 0.46 1.00 35.7 -0.13 5.0
B Level 8 1.12 0.43 -0.68 16.0 -1.14 32.0
Level 14 1.06 0.51 -0.91 54.5 -1.02 27.0
Level 17 1.09 0.55 -0.57 17.4 -0.75 17.0
Level 21 1.13 0.41 -0.17 0.0 -0.82 19.0
C Ground Floor 1.11 0.80 0.45 18.2 0.51 10.0
Level 1 1.17 0.72 0.30 3.0 0.42 9.0
D Level 2 1.42 0.43 -0.17 16.7 0.12 5.0
Level 4 1.21 0.60 -0.20 10.0 0.01 5.0
E Human Resource Department 1.38 0.43 -0.42 16.7 0.05 5.0
Corporate Department 1.21 0.52 -0.56 25.0 -0.34 7.0
F Level 1 1.31 0.54 -1.71 64.7 -0.68 15.0
Ground Floor 1.25 0.51 -0.81 27.8 -0.08 5.0
G Level 19, Tower 1 1.65 0.47 0.83 16.7 0.31 7.0
Level 20, Tower 1 1.21 0.52 -1.30 39.1 -0.49 10.0
Level 10, Tower 2 1.55 0.39 0.25 0.0 0.08 5.0
Level 15, Tower 2 1.08 0.48 -0.32 10.5 -0.75 17.0
Level 26, Tower 2 1.25 0.39 -1.25 41.7 -0.93 23.0
5.1 Behavioural adaptations
The following sub-sections describe the behavioural adaptations. Note that the behavioural
adaptations are commonly represented by the clothing insulation, activity level and air
velocity.
5.1.1 Clothing insulation
The relationship between the clo value and both the indoor operative temperature and
outdoor temperature are shown in Figures 5.1 and 5.2, respectively.
Univers
ity of
Mala
ya

55
Figure 5.1 : Relationship between clothing insulation and indoor operative temperature.
Figure 5.2 : Relationship between clothing insulation and outdoor temperature.
The correlation between the clothing insulation and the operative temperature for office
buildings in Malaysia is given by Equation (5.1).
Clo = 0.0419 Top – 0.4799 (5.1)
y = 0.0419x ‐ 0.4799R² = 0.2023
0.00
0.10
0.20
0.30
0.40
0.50
0.60
0.70
0.80
0.90
21.00 22.00 23.00 24.00 25.00 26.00
Average
clothing value (clo)
Operative temperature (oC)
y = 0.0177x ‐ 0.0562R² = 0.1545
0.00
0.10
0.20
0.30
0.40
0.50
0.60
0.70
0.80
0.90
26.00 28.00 30.00 32.00 34.00 36.00
Average
clothing value (clo)
Outdoor temperature (oC)
Univers
ity of
Mala
ya

56
Other researchers had carried out similar analyses, and their results are shown in Equations
(2.2) to (2.4). The slope of Equation (5.1) is opposite to those in Equations (2.2) to (2.4).
From Figure 5.1, it can be seen that the positive slope of the linear regression is due to the
high clo value of 0.80 and 0.72 clo from the Office C. The management of the Office C
requires its entire staff to wear a company jacket during their working hours. This is the
reason for the high clo value in this building.
Since the Office C has a special requirement on the occupants’ attire, thus the clo
value of the Office C should be eliminated from the other buildings’ clo values. Note that
the other office buildings possess a very similar range of clothing values. The new linear
regression after ignoring the clo value of Office C is shown in Figure 5.3. The linear
correlation in Figure 5.3 is almost horizontal with a small negative slope. Hence, it can be
concluded that for the office buildings in Malaysia, the clothing value of occupants is
almost independent of the indoor operative temperature.
Figure 5.2 shows the linear regression between the clothing value and the outdoor
temperature. The correlation is given in Equation (5.2).
Clo = 0.0177 Tout – 0.0562 (5.2)
By performing the same elimination of the clo value from Office C as mentioned above, the
new linear regression is as shown in Figure 5.4. The horizontal line shows that the
occupants’ clothing insulation is also independent of the outdoor temperatures in Malaysia.
This indicates that the office workers choose their daily attire without considering either the
indoor or outdoor temperatures during their working days.
Univers
ity of
Mala
ya

57
Figure 5.3 : New relationships between clothing insulation and indoor operative
temperature.
Figure 5.4 : New relationships between clothing insulation and outdoor temperature.
5.1.2 Activity level
The activity level of the occupants is measured in metabolic rate. In Figure 5.5, it is found
that the regression line is horizontal with a maximum of 1.65 met, a minimum of 1.06 met
y = ‐0.0051x + 0.5962R² = 0.0071
0
0.1
0.2
0.3
0.4
0.5
0.6
0.7
21.00 22.00 23.00 24.00 25.00 26.00
Average
clothing value (clo)
Operative temperature (oC)
y = 0.0015x + 0.4306R² = 0.0029
0
0.1
0.2
0.3
0.4
0.5
0.6
0.7
26.00 28.00 30.00 32.00 34.00 36.00
Average clothing value (clo)
Outdoor temperature (oC)Univers
ity of
Mala
ya

58
and an average of 1.23 met. In this case, the average met is approximately the same as the
1.2 met found by different researchers (Bouden & Ghrab, 2005; de Dear & Brager, 1998;
Mui & Chan, 2003). Also, the horizontal line in Figure 5.5 shows that the activity level of
the occupants in office buildings is independent of the indoor operative temperature. The
activity level for all the office occupants is more or less the same, where most of them are
doing sedentary work no matter what the ambient temperature is.
Figure 5.5 : Relationship between activity level and operative temperature.
5.1.3 Air velocity
Figure 5.6 shows the linear regression between indoor air velocity and operative
temperature by the equation as shown in Equation (5.3).
V = -0.0088 Top + 0.2872 (5.3)
y = ‐0.004x + 1.3235R² = 0.0007
0.80
0.90
1.00
1.10
1.20
1.30
1.40
1.50
1.60
1.70
21.00 22.00 23.00 24.00 25.00 26.00
Average
activity level (met)
Operative temperature (oC)
Univers
ity of
Mala
ya

59
Note that the slope found in this study is negative, but the slope found by de Dear & Brager
(1998) and Mui & Chan (2003) in Equations (2.6) and (2.7) are positive. This result is
similar to the results obtained in the hospitals in Chapter 4. Since the office buildings were
also using the centralized air-conditioning system, where the air velocity was not under the
occupants’ local control, thus, as depicted in Figure 5.6, the higher the indoor operative
temperature, the lower the air velocity attained. Notes that the air velocity values measured
in this study are all within the limits of 0.2 m/s, as prescribed in the ASHRAE Standard 55
(2004).
Figure 5.6 : Relationship between indoor air velocity and operative temperature.
5.2 Thermal acceptability
The correlation between the percentage dissatisfied and the operative temperature is shown
in Figure 5.7. In order to obtain an actual percentage dissatisfied (APD) below 20% as
recommended by the ASHRAE Fundamentals Handbook (2009), the operative temperature
y = ‐0.0088x + 0.2872R² = 0.06
0.00
0.02
0.04
0.06
0.08
0.10
0.12
0.14
0.16
0.18
0.20
21.00 22.00 23.00 24.00 25.00 26.00
Average indoor air velocity (m/s)
Operative temperature (oC)
Univers
ity of
Mala
ya

60
range must be within 23.3-25.2oC as shown in Figure 5.7. The temperature range to keep
the predicted percentage dissatisfied (PPD) below 20% is 21.9-32.0oC. The wide
temperature range for 20% PPD shows that the Fanger’s model has a higher prediction for
the human adaptation ability to change depending on the surrounding temperature.
The occupants in Malaysia showed a narrower thermal acceptance range of 23.3-
25.2oC compared to the predicted value of 21.9-32.0oC when using Fanger’s model. The
temperature range from a maximum of 20% APD was acceptable because in the present
thesis, the study focused on the air-conditioned office buildings. In contrast, for a maximum
of 20% PPD, the temperature range is too wide and is not practically relevant because it is
impossible to have an operative temperature of 32.0oC in an air-conditioned space in
Malaysia. Occupants will find 32 oC to be too hot an environment and thermally discomfort
for an air-conditioned space. Generally, the outdoor temperature in Malaysia ranges from
27 to 36 oC during a sunny day.
Figure 5.7 : Graph of percentage dissatisfied versus operative temperature.
y = 4.554x2 ‐ 220.58x + 2687.1
y = 0.6348x2 ‐ 34.202x + 464.540.0
10.0
20.0
30.0
40.0
50.0
60.0
70.0
21.00 22.00 23.00 24.00 25.00 26.00
Peercentage Dissatisfied (%)
Operative temperature (oC)
APD PPD Poly. (APD) Poly. (PPD)
Univers
ity of
Mala
ya

61
5.3 Thermal neutrality
Thermal neutrality is the operative temperature at the mean thermal sensation vote of zero.
From Figure 5.8, the neutral temperature for the predicted mean vote and the actual mean
vote were 24.4oC and 24.1oC, respectively. This implies that in the real environment, the
office occupants in Malaysia prefer a slightly cooler indoor temperature compared to the
predicted temperature by the Fanger’s model. This finding is important for the local HVAC
design engineers, since adjusting the setting for people’s comfort temperature in an air-
conditioning system by 0.3°C will have an impact on the energy consumption of a building.
Figure 5.8 : Graph of mean thermal sensation vote versus operative temperature.
5.4 Adaptive Thermal Comfort Model
The relationship between the indoor neutral temperature and the outdoor temperature must
be determined in developing an adaptive thermal comfort model. Table 5.3 shows the
neutral temperature and the outdoor temperature collected from the survey in seven office
y = 0.532x ‐ 12.806
y = 0.3539x ‐ 8.6312
‐2.00
‐1.50
‐1.00
‐0.50
0.00
0.50
1.00
1.50
2.00
21.00 22.00 23.00 24.00 25.00 26.00 27.00Mean
Vote
Operative temperature (oC)
AMV PMV Linear (AMV) Linear (PMV)
Univers
ity of
Mala
ya

62
buildings. Note that the neutral temperature in Table 5.3 is determined from the vote of
zero in the correlation between the actual mean vote and the operative temperature for each
office building as shown in Appendix I.
Table 5.3 : Neutral temperature and outdoor temperature of seven office buildings.
Office Tn (oC) Tout (
oC)
A 24.0 29.4
B 23.8 28.6
C 24.6 34.5
D 25.8 33.4
E 25.9 30.8
F 25.3 32.5
G 23.8 33.3
By plotting the data shown in Table 5.3, a linear regression model was generated, as shown
in Figure 5.9 and Equation (5.4).
Tn = 0.1331 Tout + 20.492 R2 = 0.1002 (5.4)
Figure 5.9 : Adaptive thermal comfort model for office building in hot and humid Malaysia.
y = 0.1331x + 20.492R² = 0.1002
20.00
21.00
22.00
23.00
24.00
25.00
26.00
27.00
28.00 29.00 30.00 31.00 32.00 33.00 34.00 35.00
Indoor neutral temperature (oC)
Outdoor temperature (oC)
Univers
ity of
Mala
ya

63
Note that the indoor neutral temperature increases by about 1oC for a 7.5oC increment in the
outdoor temperature. According to the findings by Mui & Chan (2003) from humid, sub-
tropical Hong Kong, the neutral temperature increases by about 1oC for every 6oC increase
in the outdoor temperature. The difference between these results shows that different
climates will result in a different thermal sensation. A number of field studies have also
found that the neutral temperature varies with the climate or season (Cena & de Dear, 2001).
The slope in Equation (5.4) is almost identical to that proposed by Mui & Chan
(2003) and Milne (1995) as shown in Equations (2.8) and (2.12), respectively. However,
the constant of Equation (5.4) is different from the other researchers as shown in Equations
(2.8) to (2.17). Furthermore, the R-squared value of Equation (5.4) is small compared to the
unity, and this questions the suitability of the model. Residual analysis was carried out to
check the suitability of the adaptive thermal comfort model. The calculation of the residual
analysis is shown in Appendix J. The residual plots in Figure 5.10 behave randomly and
this indicates that the adaptive model in Equation (5.4) provides a decent fit to the data. In
other words, a linear regression model is suitable for the data.
Figure 5.10 : Residual plots.
‐2.00
‐1.50
‐1.00
‐0.50
0.00
0.50
1.00
1.50
28.00 29.00 30.00 31.00 32.00 33.00 34.00 35.00 36.00
Residual, e
Outdoor Temperature (oC)
Univers
ity of
Mala
ya

64
Besides that, the bias uncertainty analysis is used to check the validity of the field
measurement data. A set of data is considered valid for use if the error for the bias
uncertainty is less than 10% (Yau, 2004). After calculation, the four basic parameters in
this study, which are the Tair, Tglobe, RH and Tout, are all below 10% error bias uncertainty
(as shown in Appendix K). Thus, these measured parameters are valid to be used in
developing the adaptive thermal comfort model as shown in Equation (5.4).
However, the error analysis for air velocity is much higher compared to that of the
other parameters. The highest value recorded is 10.53% uncertainty for the air velocity.
This is because an accurate measurement of a low air velocity is difficult (Melikov et al.,
2007). Furthermore, a more reliable sensor reading is possible only if the air velocity is
more than 2 m/s (Thomas et al., 1998). In the present research, the air velocity measured
was in the range of 0.02-0.18 m/s. This shows that the air velocity was very low and
difficult to measure accurately. Nevertheless, the bias uncertainty error for the air velocity
is still at an acceptable level since it is just slightly above 10%.
5.4.1 Upper and lower limits of the adaptive model
In order to obtain an adaptive thermal comfort model that is suitable for application in the
office buildings in Malaysia, a calibration to determine the upper and lower limits of the
model is needed. According to the ASHRAE Fundamentals Handbook (2009), a comfort
zone is a zone of 20% maximum allowable occupants’ dissatisfaction.
From Figure 5.7, for a maximum 20% actual percentage dissatisfied (APD), the
range for indoor temperature is 23.3-25.2oC. The outdoor temperature range is 21.1 -
35.4oC as shown in Figure 5.11. If the outdoor temperature is lower than 21.1oC, the
recommended indoor neutral temperature will be constant at 23.3oC. In turn, when the
outdoor temperature is higher than 35.4oC, the recommended indoor neutral temperature
Univers
ity of
Mala
ya
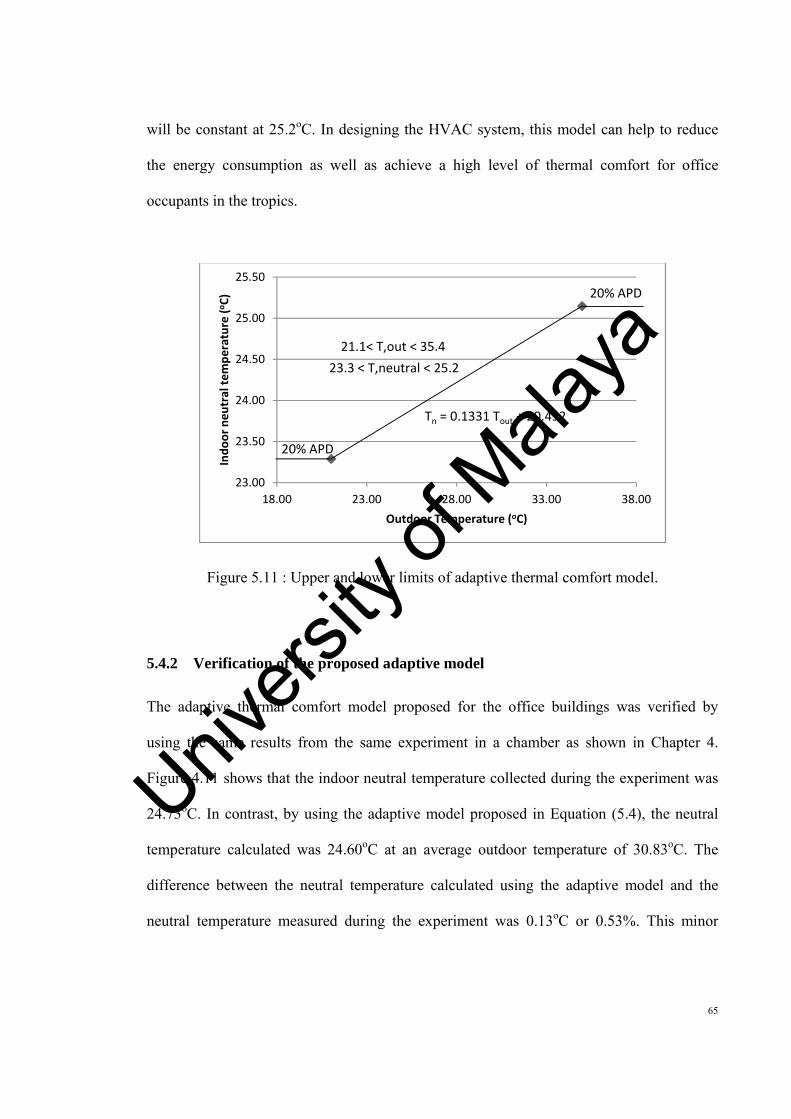
65
will be constant at 25.2oC. In designing the HVAC system, this model can help to reduce
the energy consumption as well as achieve a high level of thermal comfort for office
occupants in the tropics.
Figure 5.11 : Upper and lower limits of adaptive thermal comfort model.
5.4.2 Verification of the proposed adaptive model
The adaptive thermal comfort model proposed for the office buildings was verified by
using the same results from the same experiment in a chamber as shown in Chapter 4.
Figure 4.11 shows that the indoor neutral temperature collected during the experiment was
24.73oC. In contrast, by using the adaptive model proposed in Equation (5.4), the neutral
temperature calculated was 24.60oC at an average outdoor temperature of 30.83oC. The
difference between the neutral temperature calculated using the adaptive model and the
neutral temperature measured during the experiment was 0.13oC or 0.53%. This minor
Tn = 0.1331 Tout + 20.492
23.00
23.50
24.00
24.50
25.00
25.50
18.00 23.00 28.00 33.00 38.00
Indoor neutral temperature (oC)
Outdoor Temperature (oC)
20% APD
20% APD
21.1< T,out < 35.4
23.3 < T,neutral < 25.2
Univers
ity of
Mala
ya

66
discrepancy was due to the slight difference of the clothing values and activity levels
between the offices and the experimental chamber.
For the office buildings, the average clothing value and activity level are 0.51 clo
and 1.23 met, respectively. For the chamber, the average value was 0.41 clo and 1.14 met.
This implies that people with a different clothing insulation and activity level will have a
different feeling on their thermal comfort level. Since the discrepancy was only 0.53% as
mentioned above, the adaptive model proposed in this study is therefore valid to be used in
Malaysia’s office buildings.
5.5 Summary
In this chapter, the relationship between the operative temperature and clothing insulation,
metabolic rate and air velocity was successfully established. The adaptive model that has
been developed in this study is Tn = 0.1331 Tout + 20.492, with its upper and lower limits of
23.3 – 25.2oC for the indoor neutral temperature and 21.1 - 35.4oC for the outdoor
temperature, respectively. This model is suitable for use in the office buildings in Malaysia
since the error is only 0.53 % between the neutral temperatures calculated using the
proposed adaptive model and the neutral temperature measured during an experimental
study in a chamber.
The most comfortable or neutral temperature found from the field study in the office
buildings was 24.1oC. In comparison with the neutral temperature of 24.0oC recommended
by the ASHRAE Applications (2007), the proposed neutral temperature for the office
buildings in this study is only 0.1oC higher. Although the difference is only 0.1oC, this still
has a significant impact on the energy saving potential of a building. Various studies have
been conducted to determine the potential energy reduction when increasing the set point
Univers
ity of
Mala
ya

67
temperature of the air-conditioners (Kongkiatumpai, 1999; Saidur, 2009). It was found that
a 1°C increase in the temperature of the air conditioner accounts for about 6% savings in
the energy consumption (Atthajariyakul & Leephakpreeda, 2004; Atthajariyakul &
Lertsatittanakorn, 2008). Hence, an increment of 0.1°C room temperature setting could give
0.6% energy savings in an air-conditioner system.
The next chapter will explain the results and discussion for the field work study in
lecture halls.
Univers
ity of
Mala
ya

68
Chapter 6 Results and Discussion – Field Work Study in Lecture Halls
Surveys were done in the six lecture halls in University of Malaya, Kuala Lumpur in the
years 2009 and 2010. The total number of students who took part in the subjective
measurement was 178 people. The field measurements took about three hours for each of
the lecture hall. The questionnaires were given to all students in the lecture hall during the
field measurements and the response rate was 100%. The ratio of respondents between
male-female was 1:0.09 and the age groups was between 18 - 25 years old. The physical
parameters and the results from the subjective measurements are shown in Tables 6.1 and
6.2, respectively. The detail measurements are shown in Appendix L.
Table 6.1 : Physical parameters measured and calculated in lecture halls.
Lecture Hall Point Tair (oC)
Tglobe
(oC)V (m/s) RH (%)
MRT (oC) Top (
oC)
A 1 24.0 24.0 0.14 51.2 24.0 24.0
2 22.1 24.3 0.24 48.5 26.8 24.5
3 21.2 23.6 0.21 47.4 26.1 23.7
4 19.7 23.3 0.23 46.0 27.3 23.5
5 19.1 22.7 0.21 46.5 26.6 22.8
6 19.1 22.5 0.16 46.4 25.7 22.4
B 1 21.3 22.4 0.22 61.8 23.7 22.5
2 21.4 22.5 0.12 62.5 23.4 22.4
3 21.0 22.6 0.17 62.6 24.2 22.6
4 20.9 22.6 0.10 63.1 23.9 22.4
5 21.0 22.7 0.16 62.4 24.3 22.6
6 21.0 22.7 0.10 63.0 23.9 22.5
C 1 21.9 22.7 0.18 69.8 23.5 22.7
2 22.2 22.7 0.10 68.0 23.1 22.6
3 22.8 22.7 0.10 68.8 22.7 22.7
4 22.7 22.7 0.12 67.1 22.7 22.7
5 22.1 22.7 0.12 69.6 23.2 22.6
6 22.0 22.6 0.21 69.7 23.3 22.6
D 1 22.9 22.1 0.11 49.1 21.4 22.2
2 22.1 22.1 0.12 47.4 22.1 22.1
Univers
ity of
Mala
ya

69
3 22.2 22.2 0.12 48.2 22.2 22.2
4 23.2 22.1 0.10 48.5 21.3 22.2
5 22.0 22.2 0.21 49.9 22.5 22.2
6 21.8 22.2 0.15 48.5 22.6 22.2
E 1 21.4 22.4 0.16 48.1 23.4 22.4
2 21.6 22.3 0.19 48.2 23.0 22.3
3 21.8 22.3 0.18 47.7 22.8 22.3
4 21.4 22.3 0.17 48.5 23.2 22.3
5 21.6 22.4 0.17 49.0 23.2 22.4
6 21.0 22.3 0.11 50.7 23.3 22.2
F 1 24.6 25.8 0.10 61.4 26.6 25.6
2 24.6 25.6 0.09 61.8 26.3 25.4
3 25.0 25.2 0.14 63.4 25.4 25.2
4 25.3 25.2 0.10 63.8 25.2 25.2
5 25.3 25.3 0.09 62.1 25.3 25.3
6 25.3 25.2 0.09 61.5 25.1 25.2
Table 6.2 : Subjective measurements of occupants in lecture halls.
Lecture Hall Point met clo AMVAPD (%) PMV
PPD (%)
A 1 1.15 0.75 -0.25 25.0 -0.07 5.0 2 1.00 0.54 -1.50 25.0 -1.15 33.0 3 1.00 0.76 -1.17 16.7 -0.77 17.0 4 1.08 0.54 -1.00 0.0 -1.23 37.0 5 1.00 0.63 -2.50 100.0 -1.49 51.0 6 1.00 0.36 -2.00 100.0 -2.39 91.0 B 1 1.08 0.60 -0.20 40.0 -1.08 30.0 2 1.00 0.58 -1.60 80.0 -1.14 32.0 3 1.12 0.72 -1.40 20.0 -0.62 13.0 4 1.00 0.50 -2.00 100.0 -1.36 43.0 5 1.00 0.72 -1.40 20.0 -0.89 22.0 6 1.00 0.72 0.20 20.0 -0.71 16.0 C 1 1.00 0.72 -1.50 25.0 -0.83 20.0 2 1.10 0.65 -1.25 25.0 -0.43 9.0 3 1.00 0.63 -1.50 25.0 -0.73 16.0 4 1.20 0.72 -1.50 25.0 -0.12 5.0 5 1.16 0.37 -1.40 40.0 -0.94 23.0 6 1.00 0.72 -2.00 100.0 -0.92 23.0 D 1 1.00 0.61 -0.80 40.0 -1.16 33.0 2 1.00 0.63 -1.75 75.0 -1.19 35.0 3 1.00 0.72 -1.50 25.0 -0.92 23.0
Univers
ity of
Mala
ya

70
4 1.00 0.63 -1.50 25.0 -1.04 28.0 5 1.00 0.72 -1.40 20.0 -1.17 34.0 6 1.13 0.54 -0.50 50.0 -1.17 34.0 E 1 1.04 0.72 -1.40 20.0 -1.04 28.0 2 1.00 0.72 -1.50 25.0 -1.14 33.0 3 1.00 0.72 -1.40 40.0 -1.10 31.0 4 1.00 0.66 -1.40 40.0 -1.25 38.0 5 1.24 0.67 -1.40 20.0 -0.56 12.0 6 1.00 0.63 -1.50 50.0 -1.13 32.0 F 1 1.06 0.72 1.57 57.1 0.51 10.0 2 1.03 0.73 1.00 0.0 0.30 7.0 3 1.06 0.57 -1.29 28.6 0.05 5.0 4 1.06 0.52 -1.00 0.0 0.10 5.0 5 1.06 0.72 0.00 0.0 0.44 9.0 6 1.06 0.49 -0.57 0.0 0.00 5.0
6.1 Behavioural adaptations
The following sub-sections describe the behavioural adaptations, which are commonly
represented by the clothing insulation, activity level and air velocity.
6.1.1 Clothing insulation
The relationship between the clo value and both the indoor operative temperature and the
outdoor temperature are shown in Figures 6.1 and 6.2 respectively.
Univers
ity of
Mala
ya

71
Figure 6.1 : Relationship between clothing insulation and indoor operative temperature.
Figure 6.2 : Relationship between clothing insulation and outdoor temperature.
By referring to Figures 6.1 and 6.2, the correlation between the clothing insulation and both
the indoor operative and the outdoor temperature for the lecture halls in Malaysia are given
by Equations (6.1) and (6.2).
y = ‐0.0021x + 0.6866R² = 0.0006
0.00
0.10
0.20
0.30
0.40
0.50
0.60
0.70
0.80
22.00 22.50 23.00 23.50 24.00 24.50 25.00 25.50 26.00
Average
clothing value (clo)
Operative temperature (oC)
y = 0.0004x + 0.6244R² = 0.0028
0.59
0.60
0.61
0.62
0.63
0.64
0.65
0.66
0.67
0.68
0.69
0.70
26.00 28.00 30.00 32.00 34.00
Average
clothing value (clo)
Outdoor temperature (oC)
Univers
ity of
Mala
ya
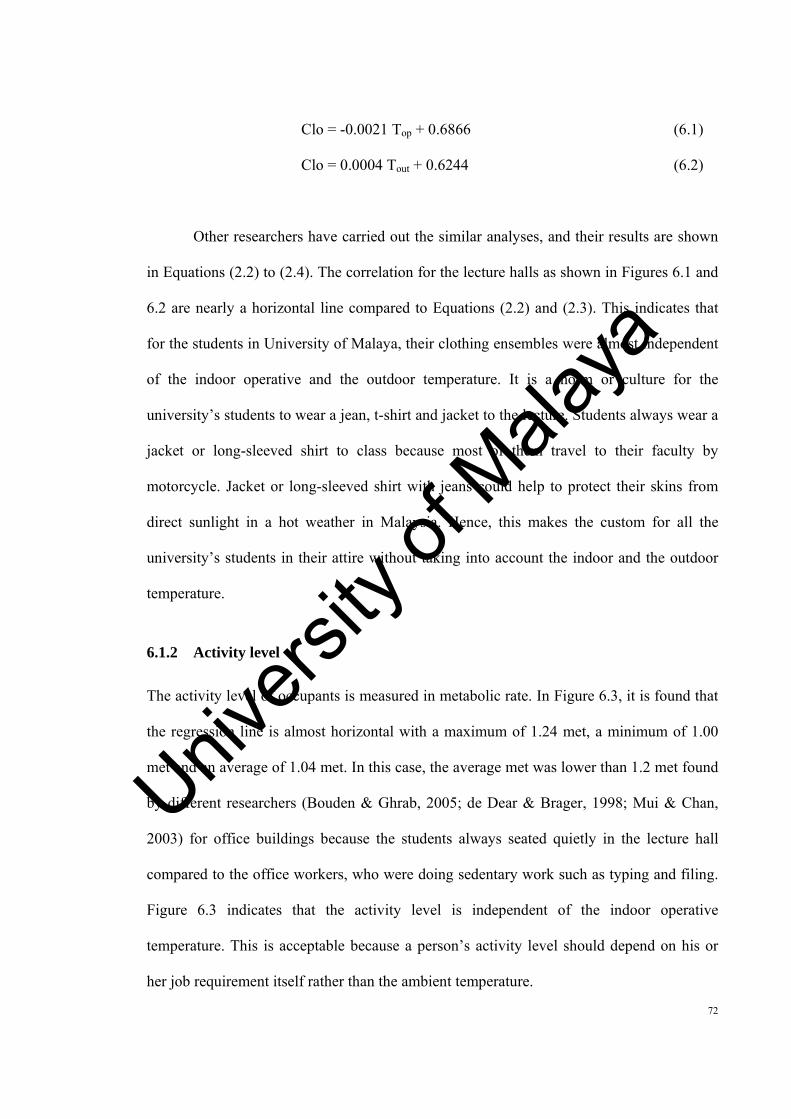
72
Clo = -0.0021 Top + 0.6866 (6.1)
Clo = 0.0004 Tout + 0.6244 (6.2)
Other researchers have carried out the similar analyses, and their results are shown
in Equations (2.2) to (2.4). The correlation for the lecture halls as shown in Figures 6.1 and
6.2 are nearly a horizontal line compared to Equations (2.2) and (2.3). This indicates that
for the students in University of Malaya, their clothing ensembles were almost independent
of the indoor operative and the outdoor temperature. It is a norm or culture for the
university’s students to wear a jean, t-shirt and jacket to the lecture. Students always wear a
jacket or long-sleeved shirt to class because most of them travel to their faculty by
motorcycle. Jacket or long-sleeved shirt with jeans could help to protect their skins from
direct sunlight in a hot weather in Malaysia. Hence, this makes the custom for all the
university’s students in their attire without taking into account the indoor and the outdoor
temperature.
6.1.2 Activity level
The activity level of occupants is measured in metabolic rate. In Figure 6.3, it is found that
the regression line is almost horizontal with a maximum of 1.24 met, a minimum of 1.00
met and an average of 1.04 met. In this case, the average met was lower than 1.2 met found
by different researchers (Bouden & Ghrab, 2005; de Dear & Brager, 1998; Mui & Chan,
2003) for office buildings because the students always seated quietly in the lecture hall
compared to the office workers, who were doing sedentary work such as typing and filing.
Figure 6.3 indicates that the activity level is independent of the indoor operative
temperature. This is acceptable because a person’s activity level should depend on his or
her job requirement itself rather than the ambient temperature.
Univers
ity of
Mala
ya
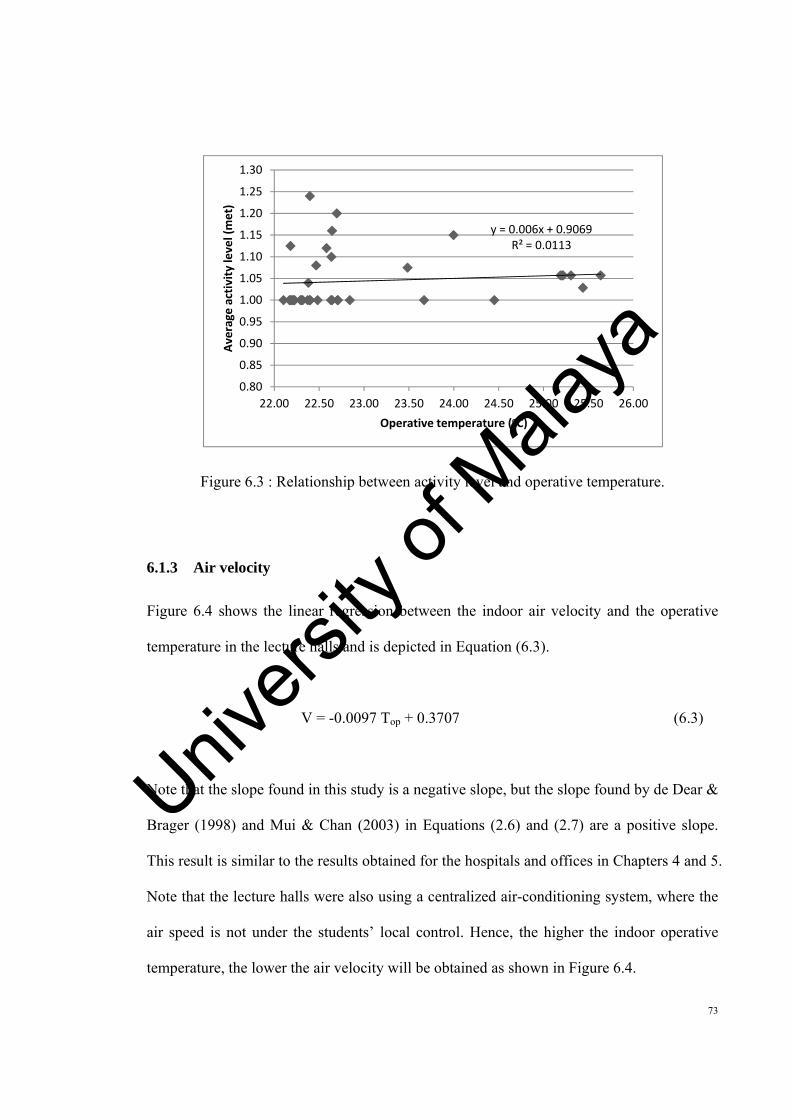
73
Figure 6.3 : Relationship between activity level and operative temperature.
6.1.3 Air velocity
Figure 6.4 shows the linear regression between the indoor air velocity and the operative
temperature in the lecture halls and is depicted in Equation (6.3).
V = -0.0097 Top + 0.3707 (6.3)
Note that the slope found in this study is a negative slope, but the slope found by de Dear &
Brager (1998) and Mui & Chan (2003) in Equations (2.6) and (2.7) are a positive slope.
This result is similar to the results obtained for the hospitals and offices in Chapters 4 and 5.
Note that the lecture halls were also using a centralized air-conditioning system, where the
air speed is not under the students’ local control. Hence, the higher the indoor operative
temperature, the lower the air velocity will be obtained as shown in Figure 6.4.
y = 0.006x + 0.9069R² = 0.0113
0.80
0.85
0.90
0.95
1.00
1.05
1.10
1.15
1.20
1.25
1.30
22.00 22.50 23.00 23.50 24.00 24.50 25.00 25.50 26.00
Average
activity level (met)
Operative temperature (oC)
Univers
ity of
Mala
ya

74
Figure 6.4 : Relationship between indoor air velocity and operative temperature.
6.2 Thermal acceptability
The relationship between the percentage dissatisfied and the operative temperature is
shown in Figure 6.5. In order to get an actual percentage dissatisfied (APD) below 20% as
suggested by the ASHRAE Fundamentals Handbook (2009), the operative temperature
range must be 23.9-26.0oC. The temperature range to keep the predicted percentage
dissatisfied (PPD) below 20% is 23.5-30.8oC. The broad temperature range for 20% PPD
indicates that the Fanger’s model has a higher prediction for the human adaptation ability to
the changes in the surrounding temperature.
Students in the lecture halls showed a narrower thermal acceptance range of 23.9-
26.0oC compared to the predicted value of 23.5-30.8oC when using Fanger’s model. The
temperature range from a maximum of 20% APD is acceptable because in the present
research, the study focused on the air-conditioned lecture halls. On the other hand, for a
maximum of 20% PPD, the temperature range is too broad because it is impracticable to
y = ‐0.0097x + 0.3707R² = 0.0582
0.00
0.05
0.10
0.15
0.20
0.25
0.30
22.00 22.50 23.00 23.50 24.00 24.50 25.00 25.50 26.00
Average
indoor air velocity (m/s)
Operative temperature (oC)
Univers
ity of
Mala
ya

75
have an operative temperature of 30.8oC in an air-conditioned lecture hall in Malaysia. The
students will find 30.8oC to be a hot environment and thermally uncomfortable for an air-
conditioned space. Normally, the outdoor temperature in Malaysia ranges between 27 to 36
oC during a sunny day.
Figure 6.5 : Graph of percentage dissatisfied versus operative temperature.
6.3 Thermal neutrality
Thermal neutrality is the operative temperature at the mean thermal sensation vote of zero.
From Figure 6.6, the neutral temperature for the predicted mean vote and the actual mean
vote were 25.0oC and 25.7oC, respectively. The discrepancy of 0.7oC between the PMV and
AMV is an important value, and this means that in the actual case, students in the lecture
halls prefer a warmer indoor environment compared to the predicted environment from the
Fanger’s model. This result is important for the local HVAC design engineers, since raising
y = 4.3415x2 ‐ 216.62x + 2717.4
y = 1.1263x2 ‐ 61.052x + 832.330.0
20.0
40.0
60.0
80.0
100.0
120.0
22.00 22.50 23.00 23.50 24.00 24.50 25.00 25.50 26.00
Peercentage Dissatisfied (%)
Operative temperature (oC)
APD PPD Poly. (APD) Poly. (PPD)
Univers
ity of
Mala
ya

76
the setting of people’s comfort temperature in an air-conditioning system by 0.7°C could
save a significant amount of energy consumed in a building.
Figure 6.6 : Graph of mean thermal sensation vote versus operative temperature.
6.4 Adaptive Thermal Comfort Model
The correlation between the indoor neutral temperature and the outdoor temperature has to
be determined in developing an adaptive thermal comfort model. Table 6.3 shows the
neutral temperature and the outdoor temperature collected from the study in six lecture
halls. The neutral temperature in Table 6.3 is determined from the vote of zero in the
relationship between the actual mean vote and the operative temperature for each lecture
hall as shown in Appendix M.
y = 0.4286x ‐ 11.009
y = 0.4056x ‐ 10.147
‐3.00
‐2.50
‐2.00
‐1.50
‐1.00
‐0.50
0.00
0.50
1.00
1.50
2.00
22.00 23.00 24.00 25.00 26.00 27.00
Mean
Vote
Operative temperature (oC)
AMV PMV Linear (AMV) Linear (PMV)
Univers
ity of
Mala
ya

77
Table 6.3 : Neutral temperature and outdoor temperature of lecture halls.
Lecture Hall Tn (oC) Tout (
oC)
A 25.6 33.0
B 24.6 26.3
C 23.9 26.7
D 22.8 26.7
E 25.8 33.9
F 25.3 32.1
By plotting the data shown in Table 6.3, a linear regression model was generated, as shown
in Figure 6.7 and Equation (6.4).
Tn = 0.275 Tout + 16.487 R2 = 0.7204 (6.4)
Figure 6.7 : Adaptive thermal comfort model for lecture halls in hot and humid Malaysia.
The indoor neutral temperature increases by about 1oC for a 3.6oC increment in the outdoor
temperature. Based on the study by Mui & Chan (2003) in the humid, sub-tropical Hong
y = 0.275x + 16.487R² = 0.7204
20.00
21.00
22.00
23.00
24.00
25.00
26.00
27.00
26.00 28.00 30.00 32.00 34.00
Indoor neu
tral tem
perature (oC)
Outdoor temperature (oC)Univers
ity of
Mala
ya
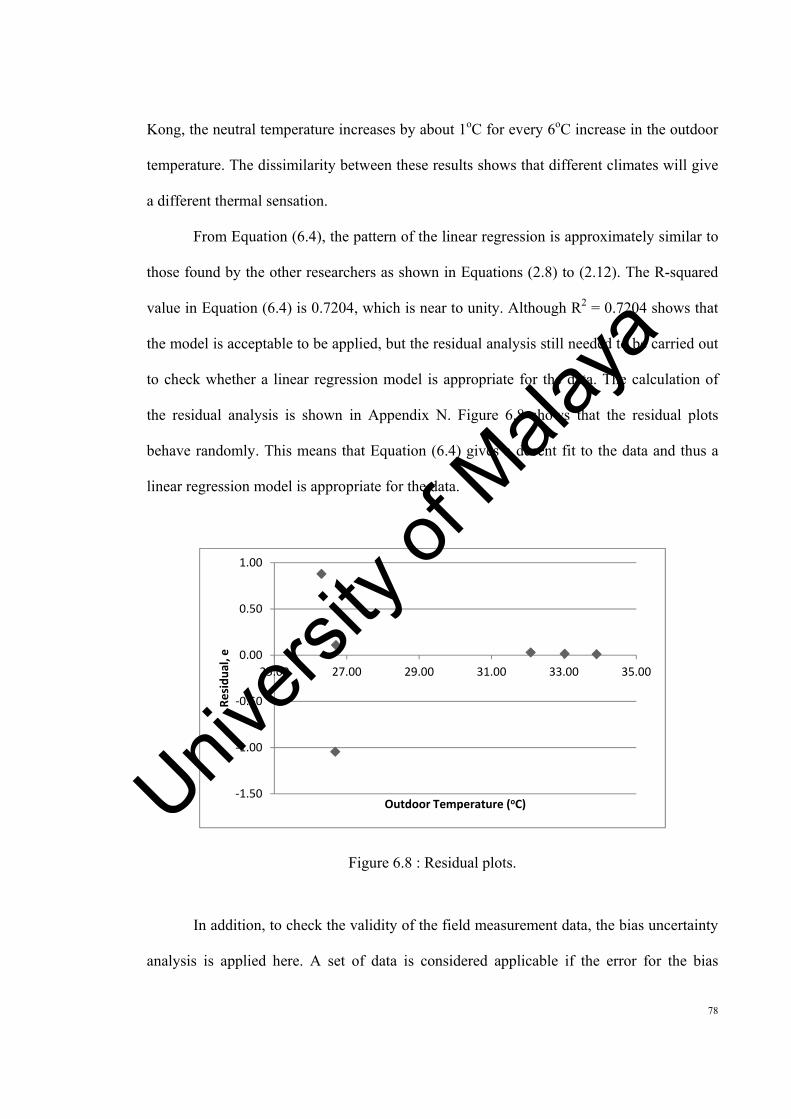
78
Kong, the neutral temperature increases by about 1oC for every 6oC increase in the outdoor
temperature. The dissimilarity between these results shows that different climates will give
a different thermal sensation.
From Equation (6.4), the pattern of the linear regression is approximately similar to
those found by the other researchers as shown in Equations (2.8) to (2.12). The R-squared
value in Equation (6.4) is 0.7204, which is near to unity. Although R2 = 0.7204 shows that
the model is acceptable to be applied, but the residual analysis still needed to be carried out
to check whether a linear regression model is appropriate for the data. The calculation of
the residual analysis is shown in Appendix N. Figure 6.8 shows that the residual plots
behave randomly. This means that Equation (6.4) gives a decent fit to the data and thus a
linear regression model is appropriate for the data.
Figure 6.8 : Residual plots.
In addition, to check the validity of the field measurement data, the bias uncertainty
analysis is applied here. A set of data is considered applicable if the error for the bias
‐1.50
‐1.00
‐0.50
0.00
0.50
1.00
25.00 27.00 29.00 31.00 33.00 35.00
Residual, e
Outdoor Temperature (oC)Univers
ity of
Mala
ya

79
uncertainty is less than 10% (Yau, 2004). From the analysis, the four basic parameters in
this study, which are Tair, Tglobe, RH and Tout, are all below 10% error bias uncertainty (as
shown in Appendix O). Hence, these parameters measured during the field work are
applicable in determining the adaptive thermal comfort model as shown in Equation (6.4).
Nevertheless, the error analysis for the air velocity is much higher compared to that
of the other parameters. The highest value recorded is 13.79% uncertainty for the air
velocity. This is because a precise measurement of a low air velocity is hard (Melikov et al.,
2007). Moreover, a reliable sensor reading is achievable only if the air velocity is more than
2 m/s (Thomas et al., 1998). In this study in the lecture halls, the air velocity measured was
in the range of 0.09-0.24 m/s. This low air velocity was difficult to measure precisely.
However, the bias uncertainty error for the air velocity is still at an acceptable level since it
is slightly above 10%.
6.4.1 Upper and lower limits of the adaptive model
A calibration to determine the upper and lower limits of the adaptive thermal comfort
model is necessary. Based on the ASHRAE Fundamentals Handbook (2009), a comfort
zone is where 80% of the occupants find the environment thermally acceptable or a zone of
20% maximum allowable occupants’ dissatisfaction.
In Figure 6.9, for a maximum of 20% actual percentage dissatisfied (APD), the
range for the indoor neutral temperature is 23.9 - 26.0oC. The outdoor temperature range is
27.0 – 34.6oC. If the outdoor temperature is lower than 27.0oC, the recommended indoor
neutral temperature will be constant at 23.9oC. In turn, when the outdoor temperature is
higher than 34.6oC, the recommended indoor neutral temperature will be constant at 26.0oC.
In designing the HVAC system, this model can help to reduce the energy consumption as
Univers
ity of
Mala
ya

80
well as achieve a high level of thermal comfort for the students in tertiary institutions in the
tropics.
Figure 6.9 : Upper and lower limits of adaptive thermal comfort model.
6.4.2 Verification of the proposed adaptive model
The proposed adaptive thermal comfort model for the lecture halls was verified by using
the similar experiment and results from Chapters 4 and 5. From Figure 4.11, the indoor
neutral temperature collected during the experiment in a chamber was 24.73oC. On the
other hand, the neutral temperature calculated was 24.97oC when using the adaptive model
proposed in Equation (6.4). The average outdoor temperature of 30.83oC measured during
the experiment was used in the calculation.
The discrepancy between the neutral temperature calculated using the adaptive
model and the neutral temperature measured during the experiment was 0.24oC or 0.96 %.
This discrepancy is due to the difference of the clothing values and the activity levels
y = 0.275x + 16.487
23.50
24.00
24.50
25.00
25.50
26.00
26.50
25.00 27.00 29.00 31.00 33.00 35.00
Indoor neu
tral tem
perature (oC)
Outdoor Temperature (oC)
20% APD
20% APD
27.0< T,out < 34.6
23.9 < T,neutral < 26.0
Univers
ity of
Mala
ya

81
between the lecture halls and the experimental chamber. For the lecture halls, the average
clothing value and activity level are 0.64 clo and 1.04 met, respectively. For the chamber,
the average value was 0.41 clo and 1.14 met. This means that people’s thermal comfort
level may vary when they have different activity level and clothing insulation. Since the
difference is only 0.96 %, thus the adaptive model developed in this chapter is applicable to
the lecture halls in Malaysia.
6.5 Summary
In this chapter, the relationship between the operative temperature and the clothing
insulation, the metabolic rate and the air velocity was successfully established. The
adaptive model proposed in this chapter is Tn = 0.275 Tout + 16.487, with its upper and
lower limits of 23.9 - 26.0oC for the indoor neutral temperature and 27.0 – 34.6oC for the
outdoor temperature, respectively. This model is applicable to the lecture halls in Malaysia
since the error is only 0.96 % between the neutral temperatures calculated using the
adaptive model and the neutral temperature measured during an experiment in a chamber.
The most comfortable or neutral temperature found from the field study in the
lecture halls was 25.7oC. In comparison to the recommended temperature of 24.0oC by the
ASHRAE Applications (2007), the proposed neutral temperature for the lecture halls in this
study is 1.7oC higher. This difference of 1.7oC has a significant impact on the energy saving
potential of a building, because by increasing the room temperature setting from 24.0oC to
25.7oC, one could decrease the cooling load and thus save a significant amount of energy.
The next chapter will describe the comparison of results attained from field work
study in the hospitals, office buildings and lecture halls.
Univers
ity of
Mala
ya

82
Chapter 7 Results Comparisons
The results obtained for the hospitals, office buildings and lecture halls in Chapters 4 to 6
are compared and discussed in this chapter. Note that the occupants in different kind of
buildings will have different thermal requirements and perceptions (as discussed in Chapter
1). Thus, the results found from the the fieldwork study in the three different buildings are
shown in Table 7.1.
Table 7.1 : Comparisons of results obtained from hospitals, offices and lecture halls.
Item
No. Results Hospitals Offices Lecture Halls
1
Clothing value vs
Operative
temperature
Clo = -0.0523 Top +
1.8198
Clo = -0.0051 Top +
0.5962
Clo = -0.0021 Top +
0.6866
2
Clothing value vs
Outdoor
temperature
Clo = -0.0504 Tout +
2.2007
Clo = 0.0015 Tout +
0.4306
Clo = 0.0004 Tout +
0.6244
3 Clothing value
Max = 1.37 clo
Min = 0.38 clo
Average = 0.61 clo
Max = 0.80 clo
Min = 0.39 clo
Average = 0.51 clo
Max = 0.76 clo
Min = 0.36 clo
Average = 0.64 clo
4 Metabolic rate
Max = 1.70 met
Min = 1.08 met
Average = 1.36 met
Max = 1.65 met
Min = 1.06 met
Average = 1.23 met
Max = 1.24 met
Min = 1.00 met
Average = 1.04 met
5
Air velocity
vs
Operative
temperature
V = -0.0127 Top +
0.4747
V = -0.0088 Top +
0.2872
V = -0.0097 Top +
0.3707
Univers
ity of
Mala
ya

83
6 Thermal
acceptability
APD < 20% :
Top = 23.7-27.7oC
PPD < 20% :
Top = 19.2-28.5oC
APD < 20% :
Top = 23.3-25.2oC
PPD < 20% :
Top = 21.9-32.0oC
APD < 20% :
Top = 23.9-26.0oC
PPD < 20% :
Top = 23.5-30.8oC
7 Thermal
neutrality
AMV : Tn = 26.4oC
PMV : Tn = 23.8oC
AMV : Tn = 24.1oC
PMV : Tn = 24.4oC
AMV : Tn = 25.7oC
PMV : Tn = 25.0oC
8
Adaptive
thermal comfort
model
Tn = 0.3314 Tout +
14.858
(R2 = 0.0535)
Tn = 0.1331 Tout +
20.492
(R2 = 0.1002)
Tn = 0.275 Tout +
16.487
(R2 = 0.7204)
9
Residual
Plots
Behave randomly Behave randomly Behave randomly
10 Bias
uncertainty
Parameters V, Tair,
Tglobe, RH and Tout :
Error < 10%
Parameter V :
Error = 9.84%
Parameters Tair,
Tglobe, RH and Tout :
Error < 10%
Parameter V :
Error = 10.53%
Parameters Tair,
Tglobe, RH and Tout :
Error < 10%
Parameter V :
Error = 13.79%
11
Upper and lower
limits of
adaptive model
25.4 < Tout < 35.0 oC
21.1 < Tout < 35.4 oC
27.0 < Tout < 34.6 oC
Univers
ity of
Mala
ya

84
12
Verification
of the
adaptive thermal
comfort model
Adaptive model:
Tn = 25.07oC
Verification:
Tn = 24.73oC
Error :
0.34oC or 1.36 %
Adaptive model:
Tn = 24.60oC
Verification:
Tn = 24.73oC
Error :
0.13oC or 0.53 %
Adaptive model:
Tn = 24.97oC
Verification:
Tn = 24.73oC
Error :
0.24oC or 0.96 %
Comments on Item No. :
1 & 2. In hospitals, the staffs were having a minor change in their clothing when indoor
and outdoor temperature increases. This is shown by the gentle slopes of the
equations shown in Item Nos. 1 and 2.
On the other hand, in the office buildings and lecture halls, the occupants almost did
not make any changes in their clothing since the slopes of the equations shown are
close to zero. This indicates that office workers and students in lecture halls were
having their clothing ensembles without taking into consideration neither the indoor
nor outdoor temperature.
3. Hospitals record the highest maximum clothing value, followed by the offices and
lecture halls. Since some of the hospital personnel were wearing lab coat, so they
will have higher maximum clothing value compared to the office workers and
students in lecture halls.
However, the lecture halls record the highest average clothing value, followed by
the hospitals and offices. This is because most of the students in the lecture halls
were wearing jacket during the survey was conducted.
Univers
ity of
Mala
ya

85
4. Hospitals record the highest maximum, minimum and average metabolic rate,
followed by the offices and lecture halls. The hospital staffs had higher metabolic
rate because they always walking about to check the patients, pushing a trolley and
so on. In contrast, the office occupants always perform sedentary works such as
filing, typing or writing. The lowest metabolic rate recorded by the students in the
lecture halls was due to their intellectual work, seated quietly or writing in the class.
5. Since all the buildings surveyed were using the centralized air-conditioning system,
with no local control on the air speed, thus they have a similar trend of linear
regression. The details were explained in Chapter 4.1.3.
6. The acceptable temperature range predicted by PPD is wider than the actual APD
for all the hospitals, office and lecture halls. Generally, people in Malaysia accept a
narrower indoor operative temperature from 23.3 to 27.7oC.
7. The neutral temperatures or comfort temperatures found based on AMV are higher
than those found by PMV for both the hospitals and lecture halls. This means that in
the actual case, occupants prefer a higher neutral temperature than the predicted
temperature by PMV.
In contrast, the office workers were found to prefer a lower neutral temperature of
24.1oC than the predicted temperature of 24.4oC by PMV. Field studies by Hwang
et al. (2007) also show that in the actual cases, occupants in offices prefer a cooler
ambience rather than a predicted neutral environment. Note that the practical
engineers in Malaysia usually apply the rule of thumb of 24.0oC in designing the
set-point temperature for an air-conditioning system. Hence, the neutral temperature
Univers
ity of
Mala
ya
86
of 24.1oC found for the office workers in this study is still beyond the typical set-
point temperature practiced by local engineers. Although the difference is only
0.1oC, but it could save a certain amount of energy on a long term basis.
8. All the adaptive thermal comfort models developed for hospitals, offices and lecture
halls have a similar pattern of linear regression.
9. In the residual analysis, the residual plots behave randomly for all the three types of
buildings. Thus, the linear regression models are suitable for the relationship
between neutral and outdoor temperatures.
10. The bias uncertainty errors for all the basic parameters are below 10%. However,
the offices and lecture halls record a higher error in air velocity compared to the
hospitals. This is because the air velocity measured in the offices and lecture halls
were lower in the range of 0.02-0.18 m/s and 0.09-0.24 m/s, respectively. The
hospitals record a higher air velocity range of 0.05-0.57 m/s. Note that the lower the
air velocity, the more difficult to measure an accurate measurement. Hence, the
error occurred will be higher.
11. The outdoor temperature upper limits are around 35oC for the hospitals, offices and
lecture halls. However, the lower limits are found to be different among the
buildings. Again, this indicates that the occupants in different type of buildings will
give different thermal sensation and requirement.
Univers
ity of
Mala
ya

87
12. The neutral temperature found during the experiment in a chamber was 24.73oC
with an average outdoor temperature of 30.83oC. The same outdoor temperature of
30.83oC was used to calculate the neutral temperature from the developed adaptive
models for the hospitals, offices and lecture halls. After calculation, it was found
that the maximum error was 1.36 % only. Hence, it can be concluded that the
developed adaptive thermal comfort models are practically applicable in Malaysia.
Univers
ity of
Mala
ya

88
Chapter 8 Potential Energy Savings
Nowadays, global climate change has become a big concern throughout the world. At the
same time, people are trying to go ‘green’ in every aspect in their life. Energy saving is one
of the ways to go ‘green’ and stop climate change. Air-conditioning systems are typically
used by many people in hot and humid, Malaysia. People in Malaysia could help to save
energy and money by simply increasing the temperature setting in their air-conditioning
systems.
In order to save energy and at the same time achieve an optimum thermal comfort
level, people in Malaysia could refer to the results obtained from this research study. The
results in the previous chapters showed that the comfort or neutral temperature found for
the hospitals, offices and lecture halls are 26.4oC, 24.1oC and 25.7oC, respectively. Note
that the mechanical building service engineers in Malaysia always design the centralized
air-conditioning system with a temperature set point of 24.0oC. Thus, energy could be
saved if the set point is to be increased accordingly for the hospitals, office buildings and
lecture halls.
According to the study presented by Masjuki et al. (2001), the estimated electricity
usage in Malaysia in the year 2011 is 120,287 GWh. In addition, the air conditioners are
found to be the major energy users, accounting for 57% of the total electricity consumption
(0.57 x 120,287 GWh = 68,563.59 GWh) (Saidur, 2009). Various studies have been
conducted to determine the potential energy reduction when increasing the set point
temperature of air-conditioners (Atthajariyakul & Leephakpreeda, 2004; Kongkiatumpai,
1999; Saidur, 2009). It was found that a 1°C increase in the temperature of the air-
conditioner accounts for about 6% savings in the energy consumption (Atthajariyakul &
Leephakpreeda, 2004; Atthajariyakul & Lertsatittanakorn, 2008).
Univers
ity of
Mala
ya

89
A simple calculation on the potential energy saving for hospitals, offices and lecture
halls based on the energy consumption in year 2011 in Malaysia is shown in Table 8.1.
Assuming the price of electricity in Malaysia is RM0.312/kWh (≈USD0.103/kWh at an
exchange rate of 0.33), the potential cost saving for the commercial building in Malaysia is
also shown in Table 8.1 (Tenaga Nasional Berhad, 2012).
Table 8.1 : Potential energy saving for buildings in Malaysia.
Hospitals Offices Lecture Halls
Neutral
temperature 26.4oC 24.1oC 25.7oC
Typical design
temperature by
local engineers
24.0oC 24.0oC 24.0oC
Temperature
difference
26.4oC - 24.0oC
= 2.4oC
24.1oC - 24.0oC
= 0.1oC
25.7oC - 24.0oC
= 1.7oC
Percentage of
energy saved
2.4oC x 6% = 14.4% 0.1oC x 6% = 0.6% 1.7oC x 6% = 10.2%
Potential energy
saving
14.4% x 68,563.59 GWh
= 9873.16 GWh/year
0.6% x 68,563.59 GWh
= 411.38 GWh/year
10.2% x 68,563.59 GWh
= 6993.49 GWh/year
Potential cost
saving
9873.16 x 106 kWh/year
x RM 0.312/kWh =
RM 3080 million/year
≈USD 1016 million/year
411.38 x 10⁶ kWh/year
x RM 0.312/kWh =
RM 128.4 million/year
≈USD 42.4 million/year
6993.49 x 106 kWh/year
x RM 0.312/kWh =
RM 2182 million/year
≈USD720.1 million/year
Univers
ity of
Mala
ya

90
By implementing the new temperature setting in an air-conditioning system, the energy that
could be saved is 14.4% for the hospitals, 0.6% for the offices and 10.2% for the lecture
halls. Even though the office buildings record the lowest percentage of energy saving, it
still accounts for a significant amount of money on a long term basis. From Table 8.1, it is
estimated that a minimum of 128.4 million Ringgit Malaysia (≈USD 42.4 million) can be
saved annually if the temperature set point is increased to the minimum recommended
neutral temperature found in the offices. Besides the cost savings, the greenhouse gas
emissions can also be reduced if the energy consumption is reduced.
The conclusions and recommendations will be described in the next chapter.
Univers
ity of
Mala
ya

91
Chapter 9 Conclusions and Recommendations
The previous chapters have presented the development of the adaptive thermal comfort
models from field work study in the hospitals, office buildings and lecture halls. It should
be noted again that in this research, the proposed adaptive thermal comfort models give
significant contributions to the air-conditioning systems in the tropics, especially in
Malaysia. The key benefits from the proposed adaptive models are the optimization of both
the energy savings and the thermal comfort levels of occupants.
In conclusions, the objectives of this research study have been achieved and are
shown as below:
a) The correlations between the operative temperature and the clothing insulation, the
activity level and the air velocity have been successfully developed for hospitals,
offices and lecture halls in Kuala Lumpur and Selangor.
b) The acceptable operative temperature for an actual percentage dissatisfied below
20% for the hospitals, offices and lecture halls are 23.7-27.7oC, 23.3-25.2 oC and
23.9-26.0 oC, respectively.
c) The neutral temperature found based on the actual mean vote for the hospital
personnel, office workers and tertiary students are 26.4oC, 24.1oC and 25.7 oC,
respectively.
d) The adaptive thermal comfort models have been successfully established for the
buildings in Malaysia. The adaptive models together with their upper and lower
limits of the outdoor temperatures are:
Tn = 0.3314 Tout + 14.858 , 25.4 < Tout < 35.0 oC for hospitals,
Tn = 0.1331 Tout + 20.492 , 21.1 < Tout < 35.4 oC for offices,
Tn = 0.275 Tout + 16.487 , 27.0 < Tout < 34.6 oC for lecture halls.
Univers
ity of
Mala
ya
92
These adaptive models are the linear regression models since the residual analysis
has proven that the residual plots behave randomly.
e) The errors between the neutral temperature found from the developed adaptive
models and the experimental chamber are 1.36 %, 0.53 % and 0.96 % for the
hospitals, office buildings and lecture halls, respectively.
f) The results obtained in this study has been compared and discussed in Chapter 7.
g) The estimated energy savings and the cost savings by increasing the air-
conditioning temperature set point to the recommended neutral temperature are:
14.4 % and RM 3080 million/year for hospitals,
0.6 % and RM 128.4 million/year for office buildings,
10.2 % and RM 2182 million/year for lecture halls.
Based on all the results mentioned above, it can be concluded that the adaptive thermal
comfort models are different for different types of buildings in different climates.
Furthermore, the neutral temperature found from this research study are important as it
could save energy and money used in the air-conditioning systems. Finally, it is a great step
to stop climate change by saving the earth, especially in the tropics.
9.1 Recommendations for future work
There are some recommendations that could be carried out in the future in order to enhance
the adaptive thermal comfort models in Malaysia. The suggestions are:
a) The field survey can be conducted in other types of buildings such as museums,
libraries, factories, shopping malls, cinemas, indoor stadiums, airport’s arrival and
departure halls. Different kind of buildings with different thermal requirements will
give different adaptive thermal comfort models and comfort temperatures.
Univers
ity of
Mala
ya

93
b) Verifications should be done in the real buildings instead of a chamber. This is
because thermal adaptation is studying people in their natural environment and
observe them in their everyday life. Thus, the adaptive thermal comfort models
developed from the real building’s data should also be verified in real buildings.
c) In the present research, the study was only conducted in the Federal Territory of
Kuala Lumpur and Selangor state. Note that Malaysia consists of three federal
territories and thirteen states. In order to have a substantial field survey data,
research should be conducted in all the federal territories and states in Malaysia.
d) The ASHRAE Thermal Comfort Tool was used to calculate PMV and PPD in this
research. The tool is Version 1 software which was launched in year 1995. The most
recent ASHRAE Thermal Comfort Tool, Version 2 was launched in September
2011. This newly launched software is based on the ANSI/ASHRAE Standard 55-
2010, Thermal Environmental Conditions for Human Occupancy. It is
recommended for future researchers to buy and utilize the Version 2 software in
order to get a more reliable calculation of PMV and PPD.
e) Generally, the main occupants in hospitals are patients and staff. In this thesis, study
has been focused on staff only. Since patient’s thermal requirement is different from
staff, it is important to have a balance condition so that all occupants are satisfied
with their surrounding environment. In order to achieve this condition, a VAV
system is recommended to be installed in the air-conditioning ducting structure to
diffuse different supply air temperatures to the patient and staff allocation areas.
Hence, it is suggested for future researchers to conduct a study on patients in
hospitals to obtain their neutral temperature according to their health conditions.
Univers
ity of
Mala
ya

94
List of Publications
Journal
1. Yau, Y. H., & Chew, B. T. A review on PMV and adaptive thermal comfort models.
Building Services Engineering Research & Technology (BSERT). The revised
manuscript has been sent to the Journal Editor for the final review and approval to be
accepted for publication in BSERT.
(ISI/SCOPUS Cited Publication)
2. Yau, Y. H., & Chew, B. T. Adaptive thermal comfort model for air-conditioned
hospitals in Malaysia. Building Services Engineering Research & Technology (BSERT).
The revised manuscript has been sent to the Journal Editor for the final review and
approval to be accepted for publication in BSERT.
(ISI/SCOPUS Cited Publication)
3. Yau, Y. H., & Chew, B. T. (2009). Thermal comfort study of hospital workers in
Malaysia. International Journal of Indoor Air, 19(6), 500-510.
(ISI/SCOPUS Cited Publication)
Univers
ity of
Mala
ya

95
Proceedings
1. Yau, Y. H., & Chew, B. T. (2011). A field study on thermal comfort in lecture halls in
Malaysia. In Institute of Heating, Ventilating & Air Conditioning Engineering
Conference (ISHVAC2011). Shanghai, China.
(ISI/SCOPUS Cited Publication)
2. Yau, Y. H., & Chew, B. T. (2010). The study of activity rates and thermal comfort of
office occupants in the tropics. In UK-Malaysian-Ireland Symposium 2010 (UMIES
2010). Queen’s University, Belfast, Ireland.
(ISI/SCOPUS Cited Publication)
3. Yau, Y. H., Chew, B. T., & Yau, C. S. (2009). Adaptive thermal comfort model study
in the tropics. In Proceedings of World Renewable Energy Congress 2009 Asia (pp.
1386-1391). Bangkok, Thailand.
(ISI Indexed).
Univers
ity of
Mala
ya

96
Appendices
Appendix A : Sample Questionnaire
THERMAL ENVIRONMENT SURVEY
This survey is part of a study to evaluate the current thermal conditions of the selected building. We appreciate your feedback in this evaluation. Please tick at the square box where applicable. 1. Gender: Male Female 2. Age : 3. Occupant location: 4. Occupant’s Clothing Please refer to the attached Table 1. Place a check mark next to the articles of clothing that you are currently wearing as you fill out this sheet. If you are wearing articles of clothing not listed in the table, please enter them into the space provided below. Clothing: 5. Occupant Activity Level (Tick the one that is most suitable) Seated quite/writing, 1.0met Walking about, 1.7met Typing, 1.1met Lifting/packing, 2.1met Standing relaxed/Filing(seated), 1.2met Light machine work, 2.2met Filing(standing), 1.4met Heavy machine work, 4.0met 6. How would you describe your typical level of thermal sensation? +3 Hot -1 Slightly Cool +2 Warm -2 Cool +1 Slightly Warm -3 Cold 0 Neutral Clothing Ensembles
Description Trousers, short-sleeve shirt Trousers, long-sleeve shirt Trousers, long-sleeve shirt plus suit jacket Trousers, long-sleeve shirt plus suit jacket, vest, T-shirt Trousers, long-sleeve shirt plus long sleeve sweater, T-shirt Trousers, long-sleeve shirt plus long sleeve sweater, T-shirt plus suit jacket, long underwear bottoms
Knee-length skirt, short sleeve-shirt (sandals) Knee-length skirt, long sleeve-shirt, full slip Knee-length skirt, long sleeve-shirt, half slip, long-sleeve sweater Angle-length skirt, long-sleeve shirt, suit jacket Walking-shorts, short-sleeve shirt Long-sleeve coveralls, T-shirt Overalls, long-sleeve shirt, T-shirt Insulated coveralls, long-sleeve thermal underwear tops and bottoms Sweat pants, sweat shirt
Univers
ity of
Mala
ya

97
Appendix B : Table of Clothing Value
Univers
ity of
Mala
ya

98
Appendix C : Table of Metabolic Rate
Univers
ity of
Mala
ya

99
Appendix D : Detail measurements for hospitals
Table D1 : Measurements of air temperature at Pharmacy, UMMC.
Hospital - Department
Sampling Point
Tair (oC)
0.1 m 0.6 m 1.1 m 1.7 m Average
UMMC 1 22.5 22.1 22.3 22.3 22.3- Pharmacy 2 22.4 22.5 22.4 22.3 22.4
3 22.8 22.6 22.9 22.5 22.7 4 22.4 22.1 21.5 21.9 22.0 5 21.8 21.6 21.9 21.9 21.8 6 21.8 21.9 22.1 22.0 21.9 7 22.3 21.9 22.1 22.6 22.2 8 22.9 22.0 22.1 22.1 22.3 9 22.1 22.2 22.0 22.0 22.1 Total average 22.2
Table D2 : Measurements of air temperature at Otorinolaringologi, UMMC.
Hospital - Department
Sampling Point
Tair (oC)
0.1 m 0.6 m 1.1 m 1.7 m Average
UMMC 1 22.9 22.5 22.4 22.2 22.5- Otorinolaringologi 2 23.0 23.0 22.7 22.9 22.9
3 22.6 23.1 23.0 23.0 22.9 4 22.6 22.8 22.9 23.0 22.8 5 22.6 22.6 22.3 22.3 22.5 6 22.7 22.8 22.9 22.9 22.8 7 23.0 22.6 22.5 22.3 22.6 8 22.5 22.5 22.2 22.4 22.4 Total average 22.7
Table D3 : Measurements of air temperature at Oftalmologi, UMMC.
Hospital - Department
Sampling Point
Tair (oC)
0.1 m 0.6 m 1.1 m 1.7 m Average
UMMC 1 22.7 21.8 21.9 21.9 22.1- Oftalmologi 2 22.3 22.4 22.3 22.2 22.3
3 22.1 21.9 22.2 21.8 22.0 4 22.5 22.2 21.6 22.0 22.1 5 23.0 22.9 23.2 23.2 23.1 6 23.2 23.3 23.5 23.5 23.3 7 23.5 23.1 23.2 23.8 23.4 8 23.9 23.0 23.1 23.1 23.3 9 22.8 22.9 22.8 22.6 22.8 Total average 22.7
Univers
ity of
Mala
ya

100
Table D4 : Measurements of air temperature at Emergency Consultation Hall, UMMC.
Hospital - Department
Sampling Point
Tair (oC)
0.1 m 0.6 m 1.1 m 1.7 m Average
UMMC 1 23.5 23.1 23.0 22.8 23.1- Emergency 2 21.7 21.7 21.5 21.6 21.6
Consultation Hall 3 21.1 21.5 21.4 21.4 21.3 4 20.6 20.8 20.9 21.0 20.8 5 20.9 20.9 20.7 20.6 20.8 6 20.4 20.5 20.6 20.6 20.5 7 20.7 20.5 20.4 20.3 20.5 8 20.6 20.6 20.4 20.5 20.5 9 20.1 20.4 20.3 20.3 20.3 Total average 21.0
Table D5 : Measurements of air temperature at Observation ward, UMMC.
Hospital - Department
Sampling Point
Tair (oC)
0.1 m 0.6 m 1.1 m 1.7 m Average
UMMC 1 21.1 20.2 20.3 20.3 20.5- Observation ward 2 20.4 20.5 20.3 20.2 20.4
3 20.6 20.4 20.7 20.3 20.5 4 20.7 20.5 19.9 20.3 20.4 5 20.3 20.1 20.4 20.4 20.3 6 20.1 20.2 20.4 20.3 20.2 7 20.3 20.0 20.1 20.6 20.2 8 20.9 20.0 20.1 20.1 20.3 9 20.1 20.2 20.0 19.9 20.1 Total average 20.3
Table D6 : Measurements of globe temperature at Pharmacy, UMMC.
Hospital - Department
Sampling Point
Tglobe (oC)
0.1 m 0.6 m 1.1 m 1.7 m Average
UMMC 1 23.4 22.7 23.0 23.0 23.0- Pharmacy 2 22.8 23.1 22.9 23.1 23.0
3 23.0 22.9 23.3 23.3 23.1 4 23.4 23.4 22.9 23.3 23.2 5 22.9 22.9 23.3 23.6 23.2 6 22.9 22.9 23.4 23.7 23.2 7 23.2 23.0 23.2 23.8 23.3 8 23.6 22.9 23.2 23.2 23.2 9 23.1 23.4 23.2 23.4 23.3 Total average 23.2
Univers
ity of
Mala
ya

101
Table D7 : Measurements of globe temperature at Otorinolaringologi, UMMC.
Hospital - Department
Sampling Point
Tglobe (oC)
0.1 m 0.6 m 1.1 m 1.7 m Average
UMMC 1 22.0 22.4 22.7 22.9 22.5- Otorinolaringologi 2 22.2 22.5 22.6 22.7 22.5
3 22.2 22.4 22.6 23.0 22.6 4 22.7 22.7 22.6 22.9 22.7 5 22.3 22.5 22.9 23.1 22.7 6 22.5 22.8 22.8 22.8 22.8 7 22.3 22.7 23.0 23.2 22.8 8 22.6 22.9 23.0 23.1 22.9 Total average 22.7
Table D8 : Measurements of globe temperature at Oftalmologi, UMMC.
Hospital - Department
Sampling Point
Tglobe (oC)
0.1 m 0.6 m 1.1 m 1.7 m Average
UMMC 1 22.6 21.9 22.2 22.2 22.2- Oftalmologi 2 22.1 22.4 22.2 22.4 22.3
3 22.3 22.2 22.6 22.6 22.4 4 22.5 22.5 22.0 22.4 22.3 5 22.1 22.1 22.5 22.8 22.4 6 22.1 22.1 22.6 22.9 22.4 7 22.4 22.2 22.4 23.0 22.5 8 22.9 22.2 22.5 22.5 22.5 9 22.4 22.7 22.5 22.7 22.6 Total average 22.4
Table D9 : Measurements of globe temperature at Emergency Consultation Hall, UMMC.
Hospital - Department
Sampling Point
Tglobe (oC)
0.1 m 0.6 m 1.1 m 1.7 m Average
UMMC 1 22.4 22.8 23.1 23.3 22.9- Emergency 2 22.5 22.8 22.9 23.0 22.8
Consultation Hall 3 22.3 22.5 22.7 23.1 22.7 4 22.5 22.5 22.4 22.7 22.5 5 22.0 22.2 22.6 22.8 22.4 6 22.0 22.3 22.4 22.3 22.3 7 21.8 22.2 22.5 22.7 22.3 8 22.1 22.4 22.5 22.6 22.4 9 21.9 22.1 22.3 22.7 22.3 Total average 22.5
Univers
ity of
Mala
ya

102
Table D10 : Measurements of globe temperature at Observation ward, UMMC.
Hospital - Department
Sampling Point
Tglobe (oC)
0.1 m 0.6 m 1.1 m 1.7 m Average
UMMC 1 21.8 21.1 21.4 21.4 21.4- Observation ward 2 21.2 21.5 21.3 21.5 21.4
3 21.3 21.2 21.6 21.6 21.4 4 21.6 21.6 21.1 21.5 21.4 5 21.2 21.2 21.6 21.9 21.5 6 21.1 21.1 21.6 21.9 21.4 7 21.4 21.2 21.4 21.9 21.4 8 21.8 21.1 21.4 21.4 21.4 9 21.1 21.4 21.2 21.4 21.3 Total average 21.4
Table D11 : Measurements of air velocity at Pharmacy, UMMC.
Hospital - Department
Sampling Point
V (m/s) 0.1 m 0.6 m 1.1 m 1.7 m Average
UMMC 1 0.04 0.15 0.10 0.11 0.10- Pharmacy 2 0.14 0.09 0.07 0.09 0.10
3 0.04 0.07 0.15 0.14 0.10 4 0.13 0.18 0.16 0.26 0.18 5 0.16 0.19 0.20 0.18 0.18 6 0.10 0.10 0.14 0.21 0.14 7 0.13 0.09 0.11 0.08 0.10 8 0.09 0.13 0.11 0.18 0.13 9 0.16 0.19 0.20 0.18 0.18 Total average 0.13
Table D12 : Measurements of air velocity at Otorinolaringologi, UMMC.
Hospital - Department
Sampling Point
V (m/s) 0.1 m 0.6 m 1.1 m 1.7 m Average
UMMC 1 0.03 0.09 0.05 0.06 0.06- Otorinolaringologi 2 0.09 0.11 0.10 0.11 0.10
3 0.06 0.06 0.06 0.06 0.06 4 0.05 0.07 0.07 0.08 0.07 5 0.05 0.06 0.07 0.06 0.06 6 0.06 0.07 0.07 0.11 0.08 7 0.13 0.10 0.11 0.09 0.11 8 0.05 0.06 0.06 0.06 0.06 Total average 0.07
Univers
ity of
Mala
ya
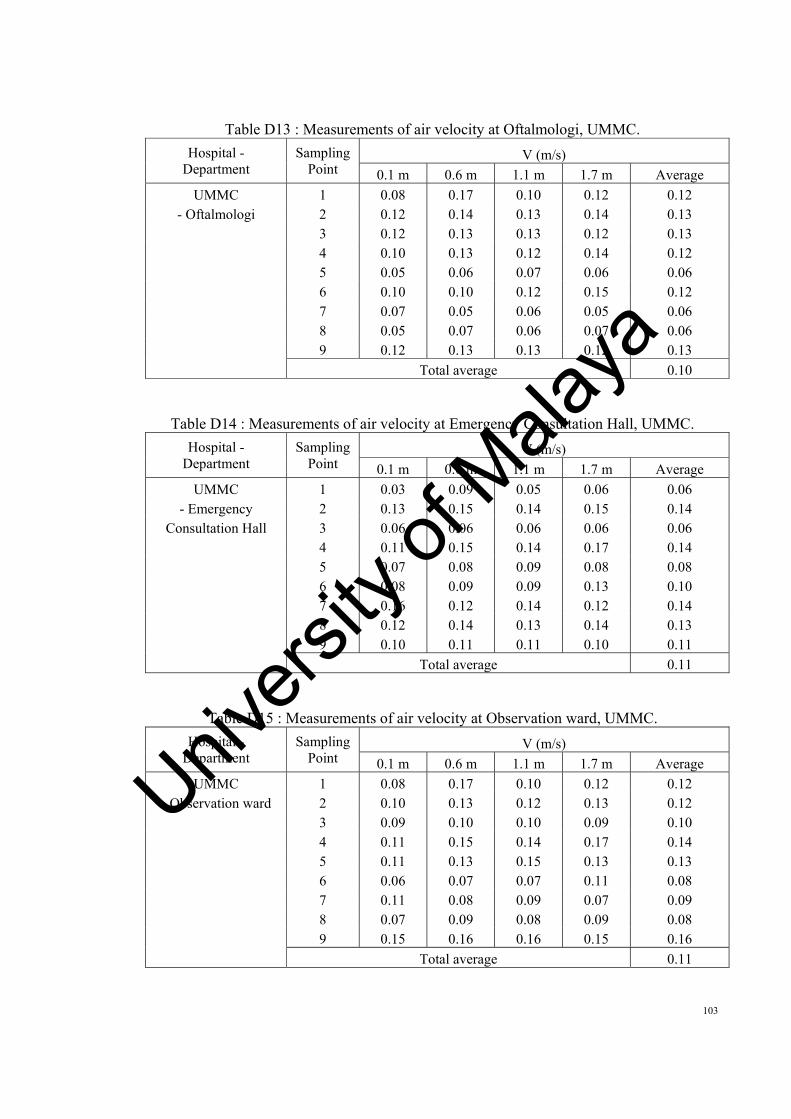
103
Table D13 : Measurements of air velocity at Oftalmologi, UMMC.
Hospital - Department
Sampling Point
V (m/s) 0.1 m 0.6 m 1.1 m 1.7 m Average
UMMC 1 0.08 0.17 0.10 0.12 0.12- Oftalmologi 2 0.12 0.14 0.13 0.14 0.13
3 0.12 0.13 0.13 0.12 0.13 4 0.10 0.13 0.12 0.14 0.12 5 0.05 0.06 0.07 0.06 0.06 6 0.10 0.10 0.12 0.15 0.12 7 0.07 0.05 0.06 0.05 0.06 8 0.05 0.07 0.06 0.07 0.06 9 0.12 0.13 0.13 0.12 0.13 Total average 0.10
Table D14 : Measurements of air velocity at Emergency Consultation Hall, UMMC.
Hospital - Department
Sampling Point
V (m/s) 0.1 m 0.6 m 1.1 m 1.7 m Average
UMMC 1 0.03 0.09 0.05 0.06 0.06- Emergency 2 0.13 0.15 0.14 0.15 0.14
Consultation Hall 3 0.06 0.06 0.06 0.06 0.06 4 0.11 0.15 0.14 0.17 0.14 5 0.07 0.08 0.09 0.08 0.08 6 0.08 0.09 0.09 0.13 0.10 7 0.16 0.12 0.14 0.12 0.14 8 0.12 0.14 0.13 0.14 0.13 9 0.10 0.11 0.11 0.10 0.11 Total average 0.11
Table D15 : Measurements of air velocity at Observation ward, UMMC.
Hospital - Department
Sampling Point
V (m/s) 0.1 m 0.6 m 1.1 m 1.7 m Average
UMMC 1 0.08 0.17 0.10 0.12 0.12- Observation ward 2 0.10 0.13 0.12 0.13 0.12
3 0.09 0.10 0.10 0.09 0.10 4 0.11 0.15 0.14 0.17 0.14 5 0.11 0.13 0.15 0.13 0.13 6 0.06 0.07 0.07 0.11 0.08 7 0.11 0.08 0.09 0.07 0.09 8 0.07 0.09 0.08 0.09 0.08 9 0.15 0.16 0.16 0.15 0.16 Total average 0.11
Univers
ity of
Mala
ya

104
Table D16 : Measurements of relative humidity at Pharmacy, UMMC. Hospital -
Department Sampling
Point RH (%)
0.1 m 0.6 m 1.1 m 1.7 m Average
UMMC 1 65.5 69.8 70.7 71.3 69.3- Pharmacy 2 69.9 69.3 69.3 68.6 69.3
3 70.5 69.9 70.2 70.2 70.2 4 69.9 70.0 70.2 71.9 70.5 5 70.0 68.8 72.7 72.8 71.1 6 74.2 73.3 73.0 72.7 73.3 7 84.1 80.4 72.1 79.8 79.1 8 81.6 80.6 80.3 80.0 80.6 9 89.6 85.7 76.9 85.1 84.3 Total average 74.2
Table D17 : Measurements of relative humidity at Otorinolaringologi, UMMC. Hospital -
Department Sampling
Point RH (%)
0.1 m 0.6 m 1.1 m 1.7 m Average
UMMC 1 85.8 85.6 85.8 85.7 85.7- Otorinolaringologi 2 80.0 79.8 76.3 72.8 77.2
3 73.8 73.4 73.9 73.8 73.7 4 73.7 74.3 73.9 73.6 73.9 5 74.0 74.9 75.3 75.1 74.8 6 76.3 76.1 75.9 75.3 75.9 7 75.6 75.7 75.7 75.7 75.7 8 71.8 72.7 73.1 72.9 72.6 Total average 76.2
Table D18 : Measurements of relative humidity at Oftalmologi, UMMC. Hospital -
Department Sampling
Point RH (%)
0.1 m 0.6 m 1.1 m 1.7 m Average
UMMC 1 74.5 74.3 74.5 74.4 74.4- Oftalmologi 2 76.2 76.0 72.7 69.3 73.5
3 73.8 73.4 73.9 73.8 73.7 4 75.2 75.8 75.4 75.1 75.4 5 78.4 79.3 79.7 79.6 79.2 6 72.3 72.1 71.9 71.3 71.9 7 72.8 72.9 72.9 72.9 72.9 8 70.9 71.7 72.1 71.9 71.6 9 71.9 71.7 71.5 70.9 71.5 Total average 73.8
Univers
ity of
Mala
ya

105
Table D19 : Measurements of relative humidity at Emergency Consultation Hall, UMMC. Hospital -
Department Sampling
Point RH (%)
0.1 m 0.6 m 1.1 m 1.7 m Average
UMMC 1 62.8 66.9 67.8 68.4 66.5- Emergency 2 70.3 69.7 69.7 69.0 69.7
Consultation Hall 3 71.9 71.3 71.6 71.6 71.6 4 73.5 73.6 73.8 75.6 74.1 5 72.6 71.4 75.5 75.6 73.8 6 76.4 75.4 75.1 74.8 75.4 7 80.5 76.9 69.0 76.4 75.7 8 76.5 75.5 75.2 74.9 75.5 9 80.0 76.5 68.7 76.0 75.3 Total average 73.1
Table D20 : Measurements of relative humidity at Observation ward, UMMC. Hospital -
Department Sampling
Point RH (%)
0.1 m 0.6 m 1.1 m 1.7 m Average
UMMC 1 70.8 75.4 76.4 77.0 74.9- Observation ward 2 76.4 75.7 75.7 75.0 75.7
3 75.4 74.8 75.1 75.1 75.1 4 74.7 74.9 75.1 76.9 75.4 5 74.1 72.9 77.0 77.1 75.3 6 76.4 75.4 75.1 74.8 75.4 7 80.5 76.9 69.0 76.4 75.7 8 76.5 75.5 75.2 74.9 75.5 9 80.5 76.9 69.0 76.4 75.7 Total average 75.4
Table D21 : Measurements of metabolic rate at Pharmacy, UMMC. Hospital -
Department Activity Level Metabolic rate met No. of people met*people Average
UMMC Seated quiet 1.0 2 2.0 - Pharmacy Typing 1.1 6 6.6
Standing relaxed 1.2 5 6.0 Filing (standing) 1.4 0 0.0 Walking about 1.7 7 11.9
Total 20 26.5 1.33
Univers
ity of
Mala
ya

106
Table D22 : Measurements of metabolic rate at Otorinolaringologi, UMMC. Hospital -
Department Activity Level Metabolic rate met No. of people met*people Average
UMMC Seated quiet 1.0 11 11.0 - Otorinolaringologi Typing 1.1 0 0.0
Standing relaxed 1.2 4 4.8 Filing (standing) 1.4 1 1.4 Walking about 1.7 4 6.8
Total 20 24.0 1.20
Table D23 : Measurements of metabolic rate at Oftalmologi, UMMC. Hospital -
Department Activity Level Metabolic rate met No. of people met*people Average
UMMC Seated quiet 1.0 15 15.0 - Oftalmologi Typing 1.1 0 0.0
Standing relaxed 1.2 4 4.8 Filing (standing) 1.4 0 0.0 Walking about 1.7 1 1.7
Total 20 21.5 1.08
Table D24 : Measurements of metabolic rate at Emergency Consultation Hall, UMMC. Hospital -
Department Activity Level Metabolic rate met No. of people met*people Average
UMMC Seated quiet 1.0 0 0.0 - Emergency Typing 1.1 0 0.0
Consultation Hall Standing relaxed 1.2 7 8.4 Filing (standing) 1.4 1 1.4 Walking about 1.7 2 3.4
Total 10 13.2 1.32
Table D25 : Measurements of metabolic rate at Observation ward, UMMC. Hospital -
Department Activity Level Metabolic rate met No. of people met*people Average
UMMC Seated quiet 1.0 9 9.0 - Observation ward Typing 1.1 0 0.0
Standing relaxed 1.2 1 1.2 Filing (standing) 1.4 1 1.4 Walking about 1.7 5 8.5
Total 16 20.1 1.26
Univers
ity of
Mala
ya
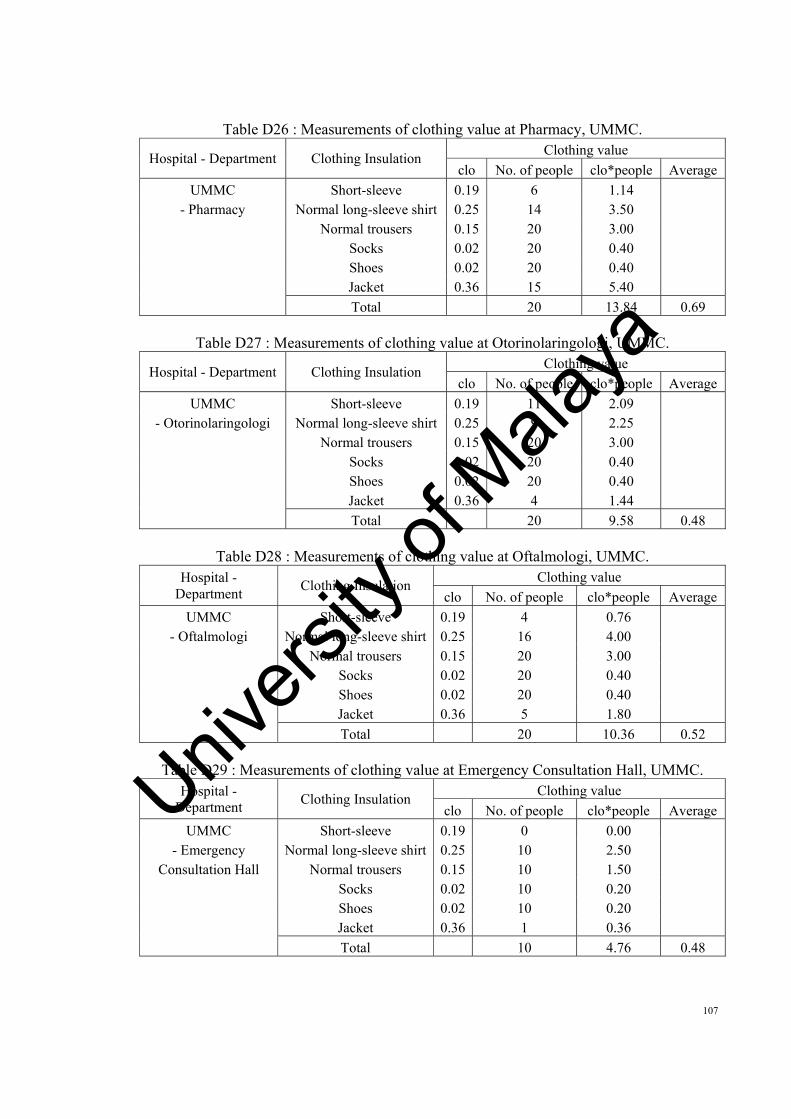
107
Table D26 : Measurements of clothing value at Pharmacy, UMMC.
Hospital - Department Clothing Insulation Clothing value clo No. of people clo*people Average
UMMC Short-sleeve 0.19 6 1.14 - Pharmacy Normal long-sleeve shirt 0.25 14 3.50
Normal trousers 0.15 20 3.00 Socks 0.02 20 0.40 Shoes 0.02 20 0.40 Jacket 0.36 15 5.40
Total 20 13.84 0.69
Table D27 : Measurements of clothing value at Otorinolaringologi, UMMC.
Hospital - Department Clothing Insulation Clothing value clo No. of people clo*people Average
UMMC Short-sleeve 0.19 11 2.09 - Otorinolaringologi Normal long-sleeve shirt 0.25 9 2.25
Normal trousers 0.15 20 3.00 Socks 0.02 20 0.40 Shoes 0.02 20 0.40 Jacket 0.36 4 1.44
Total 20 9.58 0.48
Table D28 : Measurements of clothing value at Oftalmologi, UMMC. Hospital -
Department Clothing Insulation Clothing value clo No. of people clo*people Average
UMMC Short-sleeve 0.19 4 0.76 - Oftalmologi Normal long-sleeve shirt 0.25 16 4.00
Normal trousers 0.15 20 3.00 Socks 0.02 20 0.40 Shoes 0.02 20 0.40 Jacket 0.36 5 1.80
Total 20 10.36 0.52
Table D29 : Measurements of clothing value at Emergency Consultation Hall, UMMC. Hospital -
Department Clothing Insulation Clothing value clo No. of people clo*people Average
UMMC Short-sleeve 0.19 0 0.00 - Emergency Normal long-sleeve shirt 0.25 10 2.50
Consultation Hall Normal trousers 0.15 10 1.50 Socks 0.02 10 0.20 Shoes 0.02 10 0.20 Jacket 0.36 1 0.36
Total 10 4.76 0.48
Univers
ity of
Mala
ya

108
Table D30 : Measurements of clothing value at Observation ward, UMMC.
Hospital - Department Clothing Insulation Clothing value clo No. of people clo*people Average
UMMC Short-sleeve 0.19 12 2.28 - Observation ward Normal long-sleeve shirt 0.25 4 1.00
Normal trousers 0.15 16 2.40 Socks 0.02 16 0.32 Shoes 0.02 16 0.32 Jacket 0.36 1 0.36
Total 16 6.68 0.42
Table D31 : Measurements of AMV at Pharmacy, UMMC. Hospital -
Department Thermal Sensation
Scale Actual Mean Vote
Scale No. of votes Scale*votes Average
UMMC Hot 3 0 0.0 - Pharmacy Warm 2 0 0.0
Slightly warm 1 1 1.0 Neutral 0 10 0.0 Slightly cool -1 4 -4.0 Cool -2 3 -6.0 Cold -3 2 -6.0
Total 20 -15.0 -0.75
Table D32 : Measurements of AMV at Otorinolaringologi, UMMC. Hospital -
Department Thermal Sensation
Scale Actual Mean Vote
Scale No. of votes Scale*votes Average
UMMC Hot 3 0 0.0 - Otorinolaringologi Warm 2 2 4.0
Slightly warm 1 0 0.0 Neutral 0 6 0.0 Slightly cool -1 8 -8.0 Cool -2 3 -6.0 Cold -3 1 -3.0
Total 20 -13.0 -0.65
Univers
ity of
Mala
ya

109
Table D33 : Measurements of AMV at Oftalmologi, UMMC. Hospital -
Department Thermal Sensation
Scale Actual Mean Vote
Scale No. of votes Scale*votes Average
UMMC Hot 3 0 0.0 - Oftalmologi Warm 2 0 0.0
Slightly warm 1 3 3.0 Neutral 0 4 0.0 Slightly cool -1 7 -7.0 Cool -2 2 -4.0 Cold -3 4 -12.0
Total 20 -20.0 -1.00
Table D34 : Measurements of AMV at Emergency Consultation Hall, UMMC. Hospital -
Department Thermal Sensation
Scale Actual Mean Vote
Scale No. of votes Scale*votes Average
UMMC Hot 3 0 0.0 - Emergency Warm 2 0 0.0
Consultation Hall Slightly warm 1 0 0.0 Neutral 0 2 0.0 Slightly cool -1 7 -7.0 Cool -2 1 -2.0 Cold -3 0 0.0
Total 10 -9.0 -0.90
Table D35 : Measurements of AMV at Observation ward, UMMC. Hospital -
Department Thermal Sensation
Scale Actual Mean Vote
Scale No. of votes Scale*votes Average
UMMC Hot 3 0 0.0 - Observation ward Warm 2 0 0.0
Slightly warm 1 1 1.0 Neutral 0 3 0.0 Slightly cool -1 8 -8.0 Cool -2 3 -6.0 Cold -3 1 -3.0
Total 16 -16.0 -1.00
Univers
ity of
Mala
ya

110
Table D36 : Measurements of air temperature at Pediatric ward, Putrajaya.
Hospital - Department
Sampling Point
Tair (oC)
0.1 m 0.6 m 1.1 m 1.7 m Average
Putrajaya 1 24.5 24.1 24.0 23.8 24.1- Pediatric ward 2 24.2 24.2 23.9 24.1 24.1
3 23.9 24.4 24.3 24.3 24.2 4 23.8 24.1 24.2 24.3 24.1 5 24.1 24.1 23.8 23.8 24.0 Total average 24.1
Table D37 : Measurements of air temperature at Orthopedic ward, Putrajaya.
Hospital - Department Sampling Point
Tair (oC)
0.1 m 0.6 m 1.1 m 1.7 m Average
Putrajaya 1 23.9 23.9 23.6 23.5 23.7- Orthopedic ward 2 23.2 23.6 23.8 23.9 23.6
3 23.5 23.5 23.2 23.3 23.4 4 23.2 23.3 23.3 23.3 23.3 5 23.2 23.1 23.2 23.3 23.2 6 23.0 23.2 23.2 23.1 23.1 7 23.2 23.2 23.0 22.9 23.1 Total average 23.3
Table D38 : Measurements of air temperature at Female medical ward, Putrajaya.
Hospital - Department Sampling Point
Tair (oC)
0.1 m 0.6 m 1.1 m 1.7 m Average
Putrajaya 1 23.5 23.5 23.2 23.1 23.3- Female medical ward 2 22.9 23.3 23.5 23.6 23.3
3 23.5 23.5 23.2 23.3 23.4 4 23.3 23.4 23.4 23.4 23.4 5 23.4 23.3 23.4 23.5 23.4 6 23.2 23.4 23.4 23.3 23.3 7 23.4 23.4 23.2 23.1 23.3 Total average 23.3
Table D39 : Measurements of air temperature at Pharmacy, Putrajaya.
Hospital - Department Sampling Point
Tair (oC)
0.1 m 0.6 m 1.1 m 1.7 m Average
Putrajaya 1 22.9 22.0 22.1 22.1 22.3- Pharmacy 2 22.8 22.9 22.7 22.7 22.8
3 22.8 22.6 22.9 22.5 22.7 4 22.9 22.6 22.0 22.4 22.5 5 22.3 22.1 22.4 22.4 22.3 Total average 22.5
Univers
ity of
Mala
ya

111
Table D40 : Measurements of air temperature at X-ray & radiography, Putrajaya.
Hospital - Department Sampling Point
Tair (oC)
0.1 m 0.6 m 1.1 m 1.7 m Average
Putrajaya 1 21.6 21.9 21.8 21.8 21.8- X-ray & radiography 2 21.3 21.5 21.6 22.0 21.6
3 21.2 21.0 21.3 21.0 21.1 4 21.3 21.0 21.0 20.8 21.0 5 21.1 21.2 21.2 21.3 21.2 Total average 21.3
Table D41 : Measurements of air temperature at Out-patient pharmacy, Putrajaya.
Hospital - Department Sampling Point
Tair (oC)
0.1 m 0.6 m 1.1 m 1.7 m Average
Putrajaya 1 23.0 22.0 22.1 22.1 22.3- Out-patient pharmacy 2 22.2 22.3 22.2 22.0 22.2
3 22.6 22.4 22.7 22.3 22.5 4 22.1 21.9 21.3 21.7 21.8 5 22.2 22.0 22.3 22.3 22.2 Total average 22.2
Table D42 : Measurements of air temperature at Day care unit, Putrajaya.
Hospital - Department Sampling Point
Tair (oC)
0.1 m 0.6 m 1.1 m 1.7 m Average
Putrajaya 1 22.4 21.5 21.6 21.6 21.8- Day care unit 2 22.1 22.2 22.0 22.0 22.1
3 21.9 21.7 22.0 21.6 21.8 4 21.5 21.3 20.7 21.1 21.2 5 22.0 21.8 22.1 22.1 22.0 Total average 21.8
Table D43 : Measurements of globe temperature at Pediatric ward, Putrajaya.
Hospital - Department Sampling Point
Tglobe (oC)
0.1 m 0.6 m 1.1 m 1.7 m Average
Putrajaya 1 23.7 23.8 24.1 24.4 24.0- Pediatric ward 2 24.2 24.3 23.3 24.6 24.1
3 23.5 24.0 24.4 24.6 24.1 4 24.6 22.9 23.8 25.4 24.2 5 24.0 24.1 24.2 23.9 24.1 Total average 24.1
Univers
ity of
Mala
ya
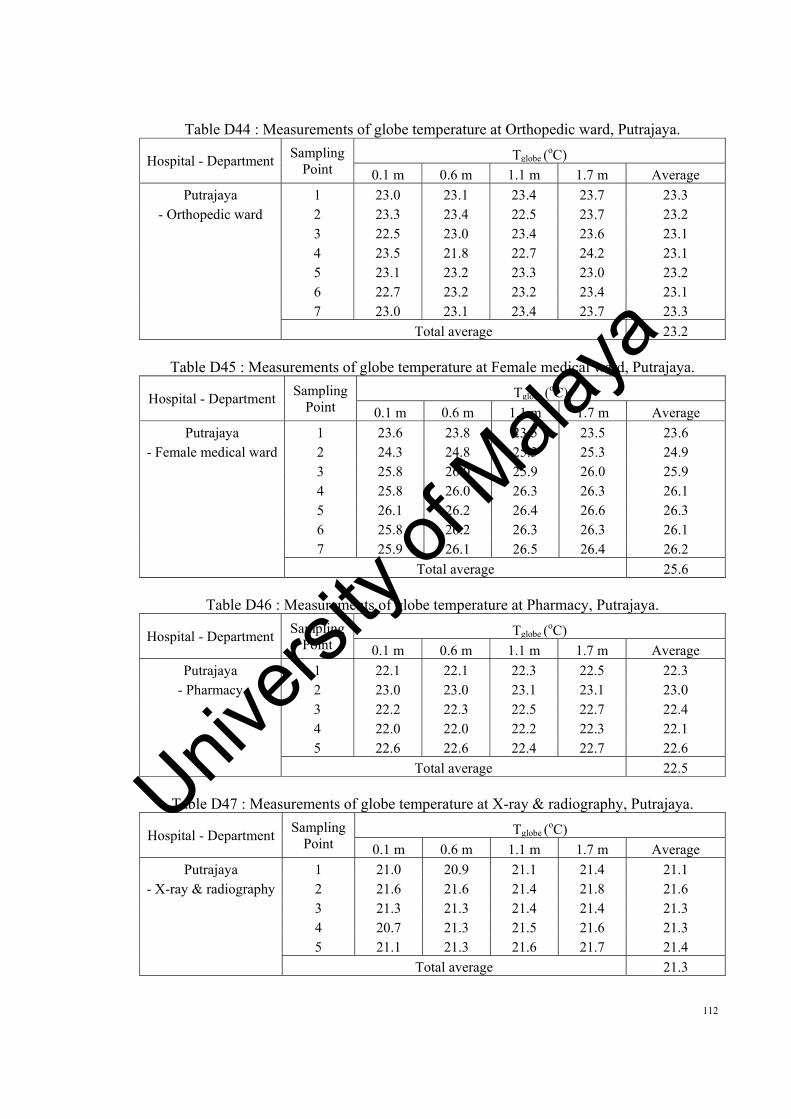
112
Table D44 : Measurements of globe temperature at Orthopedic ward, Putrajaya.
Hospital - Department Sampling Point
Tglobe (oC)
0.1 m 0.6 m 1.1 m 1.7 m Average
Putrajaya 1 23.0 23.1 23.4 23.7 23.3- Orthopedic ward 2 23.3 23.4 22.5 23.7 23.2
3 22.5 23.0 23.4 23.6 23.1 4 23.5 21.8 22.7 24.2 23.1 5 23.1 23.2 23.3 23.0 23.2 6 22.7 23.2 23.2 23.4 23.1 7 23.0 23.1 23.4 23.7 23.3 Total average 23.2
Table D45 : Measurements of globe temperature at Female medical ward, Putrajaya.
Hospital - Department Sampling Point
Tglobe (oC)
0.1 m 0.6 m 1.1 m 1.7 m Average
Putrajaya 1 23.6 23.8 23.5 23.5 23.6- Female medical ward 2 24.3 24.8 25.3 25.3 24.9
3 25.8 26.0 25.9 26.0 25.9 4 25.8 26.0 26.3 26.3 26.1 5 26.1 26.2 26.4 26.6 26.3 6 25.8 26.2 26.3 26.3 26.1 7 25.9 26.1 26.5 26.4 26.2 Total average 25.6
Table D46 : Measurements of globe temperature at Pharmacy, Putrajaya.
Hospital - Department Sampling Point
Tglobe (oC)
0.1 m 0.6 m 1.1 m 1.7 m Average
Putrajaya 1 22.1 22.1 22.3 22.5 22.3- Pharmacy 2 23.0 23.0 23.1 23.1 23.0
3 22.2 22.3 22.5 22.7 22.4 4 22.0 22.0 22.2 22.3 22.1 5 22.6 22.6 22.4 22.7 22.6 Total average 22.5
Table D47 : Measurements of globe temperature at X-ray & radiography, Putrajaya.
Hospital - Department Sampling Point
Tglobe (oC)
0.1 m 0.6 m 1.1 m 1.7 m Average
Putrajaya 1 21.0 20.9 21.1 21.4 21.1- X-ray & radiography 2 21.6 21.6 21.4 21.8 21.6
3 21.3 21.3 21.4 21.4 21.3 4 20.7 21.3 21.5 21.6 21.3 5 21.1 21.3 21.6 21.7 21.4 Total average 21.3
Univers
ity of
Mala
ya

113
Table D48 : Measurements of globe temperature at Out-patient pharmacy, Putrajaya.
Hospital - Department Sampling Point
Tglobe (oC)
0.1 m 0.6 m 1.1 m 1.7 m Average
Putrajaya 1 22.0 22.0 22.2 22.4 22.2- Out-patient pharmacy 2 22.1 22.1 22.3 22.4 22.2
3 22.4 22.5 22.7 22.9 22.6 4 21.8 21.8 22.0 22.1 21.9 5 22.3 22.3 22.0 22.4 22.2 Total average 22.2
Table D49 : Measurements of globe temperature at Day care unit, Putrajaya.
Hospital - Department Sampling Point
Tglobe (oC)
0.1 m 0.6 m 1.1 m 1.7 m Average
Putrajaya 1 21.6 21.5 21.7 22.0 21.7- Day care unit 2 22.1 22.1 21.9 22.3 22.1
3 21.8 21.8 22.0 22.0 21.9 4 20.6 21.2 21.4 21.6 21.2 5 21.8 22.0 22.3 22.5 22.1 Total average 21.8
Table D50 : Measurements of air velocity at Pediatric ward, Putrajaya.
Hospital - Department Sampling Point
V (m/s) 0.1 m 0.6 m 1.1 m 1.7 m Average
Putrajaya 1 0.06 0.09 0.06 0.06 0.07- Pediatric ward 2 0.05 0.05 0.05 0.05 0.05
3 0.02 0.04 0.08 0.07 0.05 4 0.06 0.08 0.07 0.12 0.08 5 0.05 0.06 0.07 0.06 0.06 Total average 0.06
Table D51 : Measurements of air velocity at Orthopedic ward, Putrajaya.
Hospital - Department Sampling Point
V (m/s) 0.1 m 0.6 m 1.1 m 1.7 m Average
Putrajaya 1 0.08 0.13 0.08 0.09 0.10- Orthopedic ward 2 0.09 0.09 0.08 0.10 0.09
3 0.06 0.11 0.21 0.20 0.14 4 0.07 0.10 0.09 0.15 0.10 5 0.10 0.12 0.13 0.12 0.12 6 0.07 0.08 0.09 0.11 0.09 7 0.10 0.12 0.13 0.12 0.12 Total average 0.11
Univers
ity of
Mala
ya
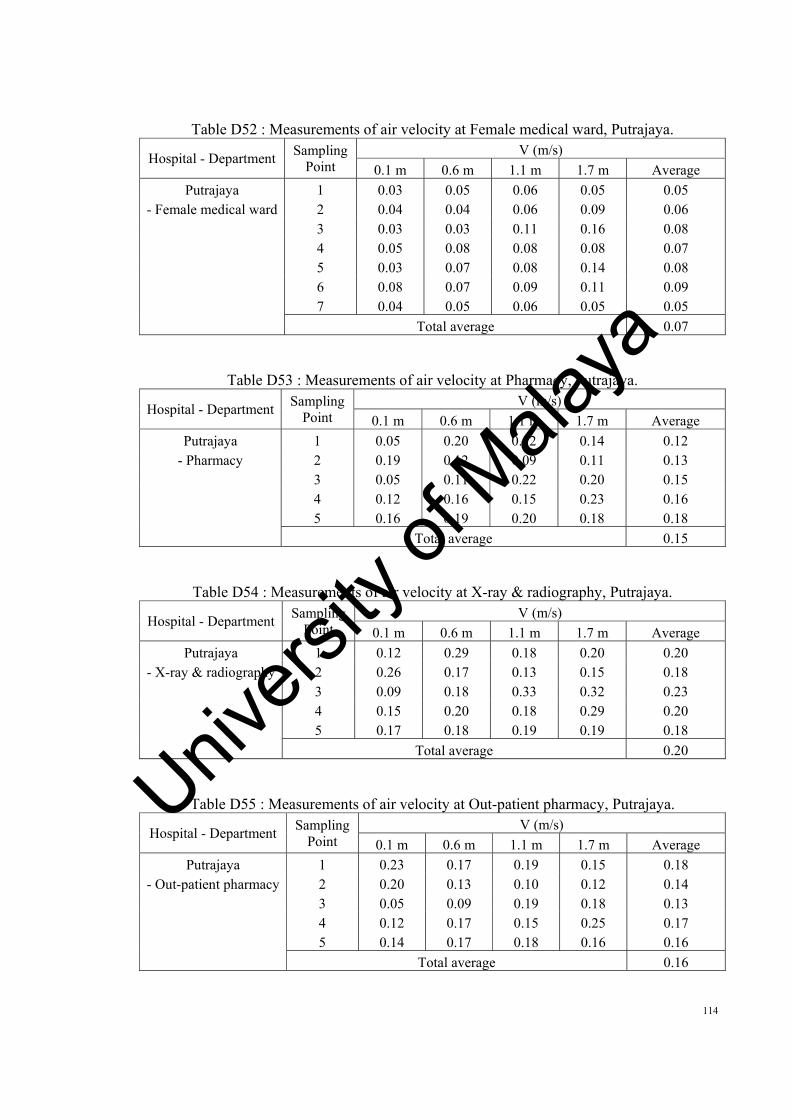
114
Table D52 : Measurements of air velocity at Female medical ward, Putrajaya.
Hospital - Department Sampling Point
V (m/s) 0.1 m 0.6 m 1.1 m 1.7 m Average
Putrajaya 1 0.03 0.05 0.06 0.05 0.05- Female medical ward 2 0.04 0.04 0.06 0.09 0.06
3 0.03 0.03 0.11 0.16 0.08 4 0.05 0.08 0.08 0.08 0.07 5 0.03 0.07 0.08 0.14 0.08 6 0.08 0.07 0.09 0.11 0.09 7 0.04 0.05 0.06 0.05 0.05 Total average 0.07
Table D53 : Measurements of air velocity at Pharmacy, Putrajaya.
Hospital - Department Sampling Point
V (m/s) 0.1 m 0.6 m 1.1 m 1.7 m Average
Putrajaya 1 0.05 0.20 0.12 0.14 0.12- Pharmacy 2 0.19 0.12 0.09 0.11 0.13
3 0.05 0.11 0.22 0.20 0.15 4 0.12 0.16 0.15 0.23 0.16 5 0.16 0.19 0.20 0.18 0.18 Total average 0.15
Table D54 : Measurements of air velocity at X-ray & radiography, Putrajaya.
Hospital - Department Sampling Point
V (m/s) 0.1 m 0.6 m 1.1 m 1.7 m Average
Putrajaya 1 0.12 0.29 0.18 0.20 0.20- X-ray & radiography 2 0.26 0.17 0.13 0.15 0.18
3 0.09 0.18 0.33 0.32 0.23 4 0.15 0.20 0.18 0.29 0.20 5 0.17 0.18 0.19 0.19 0.18 Total average 0.20
Table D55 : Measurements of air velocity at Out-patient pharmacy, Putrajaya.
Hospital - Department Sampling Point
V (m/s) 0.1 m 0.6 m 1.1 m 1.7 m Average
Putrajaya 1 0.23 0.17 0.19 0.15 0.18- Out-patient pharmacy 2 0.20 0.13 0.10 0.12 0.14
3 0.05 0.09 0.19 0.18 0.13 4 0.12 0.17 0.15 0.25 0.17 5 0.14 0.17 0.18 0.16 0.16 Total average 0.16
Univers
ity of
Mala
ya

115
Table D56 : Measurements of air velocity at Day care unit, Putrajaya.
Hospital - Department Sampling Point
V (m/s) 0.1 m 0.6 m 1.1 m 1.7 m Average
Putrajaya 1 0.14 0.22 0.15 0.15 0.17- Day care unit 2 0.16 0.16 0.15 0.17 0.16
3 0.07 0.14 0.27 0.25 0.18 4 0.15 0.20 0.18 0.29 0.20 5 0.19 0.22 0.25 0.23 0.22 Total average 0.19
Table D57 : Measurements of relative humidity at Pediatric ward, Putrajaya.
Hospital - Department Sampling Point
RH (%) 0.1 m 0.6 m 1.1 m 1.7 m Average
Putrajaya 1 63.0 64.0 64.6 64.9 64.1- Pediatric ward 2 66.5 66.6 63.0 66.3 65.6
3 65.5 65.9 65.9 64.7 65.5 4 64.6 62.3 63.7 63.7 63.6 5 58.2 63.4 62.2 68.2 63.0 Total average 64.4
Table D58 : Measurements of relative humidity at Orthopedic ward, Putrajaya.
Hospital - Department Sampling Point
RH (%) 0.1 m 0.6 m 1.1 m 1.7 m Average
Putrajaya 1 56.9 57.8 58.3 58.6 57.9- Orthopedic ward 2 57.7 57.8 54.7 57.5 56.9
3 56.6 56.9 57.0 55.9 56.6 4 57.3 55.3 56.5 56.5 56.4 5 52.1 56.7 55.7 61.1 56.4 6 56.5 56.3 56.6 56.9 56.6 7 57.2 55.2 56.4 56.4 56.3 Total average 56.7
Table D59 : Measurements of relative humidity at Female medical ward, Putrajaya.
Hospital - Department Sampling Point
RH (%) 0.1 m 0.6 m 1.1 m 1.7 m Average
Putrajaya 1 52.1 53.0 48.3 55.8 52.3- Female medical ward 2 53.6 53.5 49.3 56.0 53.1
3 54.4 54.4 49.2 55.2 53.3 4 55.6 55.4 49.7 55.3 54.0 5 56.4 56.0 49.8 55.4 54.4 6 54.8 54.9 49.8 56.1 53.9 7 54.8 55.7 50.8 58.7 55.0 Total average 53.7
Univers
ity of
Mala
ya

116
Table D60 : Measurements of relative humidity at Pharmacy, Putrajaya.
Hospital - Department Sampling Point
RH (%) 0.1 m 0.6 m 1.1 m 1.7 m Average
Putrajaya 1 64.6 68.9 69.8 70.4 68.4- Pharmacy 2 61.6 61.1 61.1 60.5 61.1
3 64.5 63.9 64.2 64.2 64.2 4 63.7 63.8 64.0 65.6 64.3 5 67.2 66.1 69.9 70.0 68.3 Total average 65.3
Table D61 : Measurements of relative humidity at X-ray & radiography, Putrajaya.
Hospital - Department Sampling Point
RH (%) 0.1 m 0.6 m 1.1 m 1.7 m Average
Putrajaya 1 71.9 72.4 72.4 72.4 72.3- X-ray & radiography 2 62.7 63.7 64.4 63.9 63.7
3 67.8 68.8 69.1 69.1 68.7 4 69.4 67.2 68.3 68.7 68.4 5 68.6 69.2 68.7 68.7 68.8 Total average 68.4
Table D62 : Measurements of relative humidity at Out-patient pharmacy, Putrajaya.
Hospital - Department Sampling Point
RH (%) 0.1 m 0.6 m 1.1 m 1.7 m Average
Putrajaya 1 46.5 49.5 50.2 50.6 49.2- Out-patient pharmacy 2 54.6 54.1 54.1 53.6 54.1
3 56.9 56.3 56.6 56.6 56.6 4 55.6 55.7 55.9 57.2 56.1 5 48.9 48.1 50.8 50.9 49.7 Total average 53.1
Table D63 : Measurements of relative humidity at Day care unit, Putrajaya.
Hospital - Department Sampling Point
RH (%) 0.1 m 0.6 m 1.1 m 1.7 m Average
Putrajaya 1 61.8 62.2 62.4 62.4 62.2- Day care unit 2 55.2 55.3 55.4 55.4 55.3
3 54.6 54.4 54.3 53.9 54.3 4 55.0 55.0 54.8 54.8 54.9 5 57.9 57.9 57.7 57.4 57.7 Total average 56.9
Univers
ity of
Mala
ya

117
Table D64 : Measurements of metabolic rate at Pediatric ward, Putrajaya. Hospital -
Department Activity Level Metabolic rate met No. of people met*people Average
Putrajaya Seated quiet 1.0 0 0.0 - Pediatric ward Typing 1.1 0 0.0
Standing relaxed 1.2 6 7.2 Filing (standing) 1.4 2 2.8 Walking about 1.7 2 3.4
Total 10 13.4 1.34
Table D65 : Measurements of metabolic rate at Orthopedic ward, Putrajaya. Hospital -
Department Activity Level Metabolic rate met No. of people met*people Average
Putrajaya Seated quiet 1.0 6 6.0 - Orthopedic ward Typing 1.1 0 0.0
Standing relaxed 1.2 5 6.0 Filing (standing) 1.4 0 0.0 Walking about 1.7 4 6.8
Total 15 18.8 1.25
Table D66 : Measurements of metabolic rate at Female medical ward, Putrajaya.
Hospital - Department Activity Level Metabolic rate met No. of people met*people Average
Putrajaya Seated quiet 1.0 5 5.0 - Female medical ward Typing 1.1 2 2.2
Standing relaxed 1.2 7 8.4 Filing (standing) 1.4 4 5.6 Walking about 1.7 2 3.4
Total 20 24.6 1.23
Table D67 : Measurements of metabolic rate at Pharmacy, Putrajaya. Hospital -
Department Activity Level Metabolic rate met No. of people met*people Average
Putrajaya Seated quiet 1.0 2 2.0 - Pharmacy Typing 1.1 0 0.0
Standing relaxed 1.2 0 0.0 Filing (standing) 1.4 2 2.8 Walking about 1.7 1 1.7
Total 5 6.5 1.30
Univers
ity of
Mala
ya

118
Table D68 : Measurements of metabolic rate at X-ray & radiography, Putrajaya.
Hospital - Department Activity Level Metabolic rate met No. of people met*people Average
Putrajaya Seated quiet 1.0 1 1.0 - X-ray & radiography Typing 1.1 0 0.0
Standing relaxed 1.2 1 1.2 Filing (standing) 1.4 3 4.2 Walking about 1.7 0 0.0
Total 5 6.4 1.28
Table D69 : Measurements of metabolic rate at Out-patient pharmacy, Putrajaya.
Hospital - Department Activity Level Metabolic rate met No. of people met*people Average
Putrajaya Seated quiet 1.0 0 0.0 - Out-patient pharmacy Typing 1.1 0 0.0
Standing relaxed 1.2 1 1.2 Filing (standing) 1.4 4 5.6 Walking about 1.7 0 0.0
Total 5 6.8 1.36
Table D70 : Measurements of metabolic rate at Day care unit, Putrajaya. Hospital -
Department Activity Level Metabolic rate met No. of people met*people Average
Putrajaya Seated quiet 1.0 0 0.0 - Day care unit Typing 1.1 0 0.0
Standing relaxed 1.2 0 0.0 Filing (standing) 1.4 4 5.6 Walking about 1.7 0 0.0
Total 4 5.6 1.40
Table D71 : Measurements of clothing value at Pediatric ward, Putrajaya. Hospital -
Department Clothing Insulation Clothing value clo No. of people clo*people Average
Putrajaya Short-sleeve 0.19 3 0.57 - Pediatric ward Normal long-sleeve shirt 0.25 7 1.75
Normal trousers 0.15 10 1.50 Socks 0.02 10 0.20 Shoes 0.02 10 0.20 Jacket 0.36 0 0.00
Total 10 4.22 0.42
Univers
ity of
Mala
ya
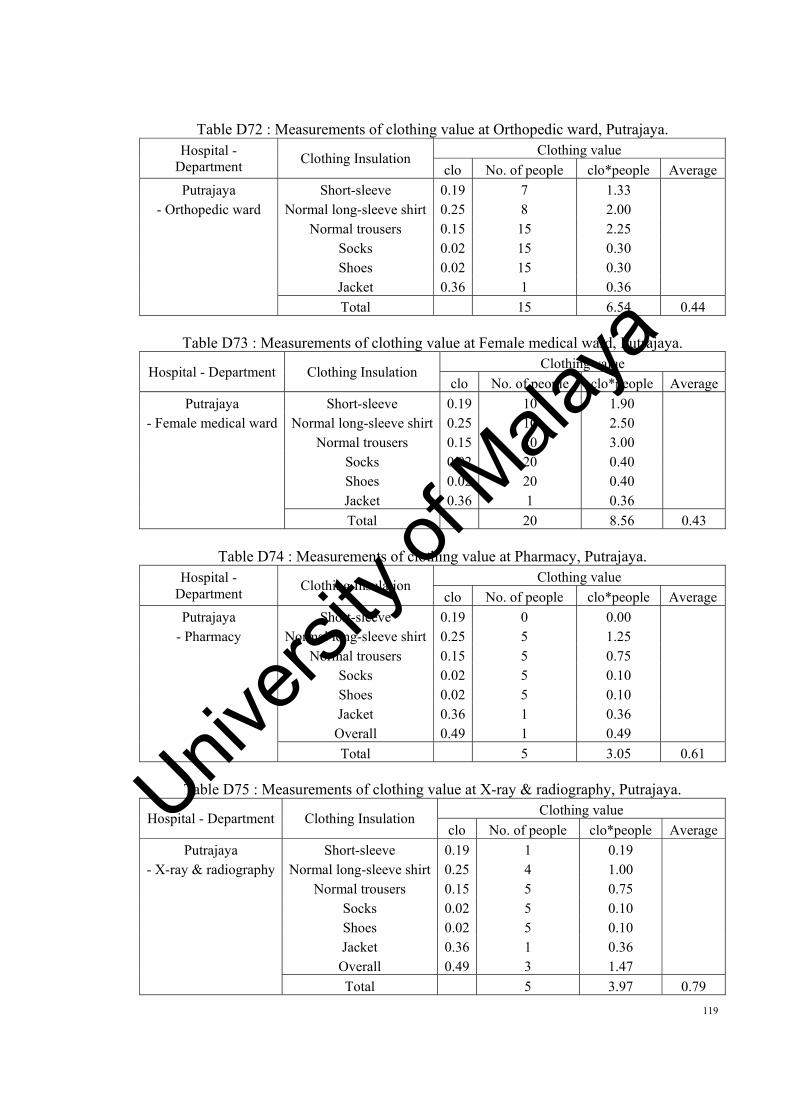
119
Table D72 : Measurements of clothing value at Orthopedic ward, Putrajaya. Hospital -
Department Clothing Insulation Clothing value clo No. of people clo*people Average
Putrajaya Short-sleeve 0.19 7 1.33 - Orthopedic ward Normal long-sleeve shirt 0.25 8 2.00
Normal trousers 0.15 15 2.25 Socks 0.02 15 0.30 Shoes 0.02 15 0.30 Jacket 0.36 1 0.36
Total 15 6.54 0.44
Table D73 : Measurements of clothing value at Female medical ward, Putrajaya.
Hospital - Department Clothing Insulation Clothing value clo No. of people clo*people Average
Putrajaya Short-sleeve 0.19 10 1.90 - Female medical ward Normal long-sleeve shirt 0.25 10 2.50
Normal trousers 0.15 20 3.00 Socks 0.02 20 0.40 Shoes 0.02 20 0.40 Jacket 0.36 1 0.36
Total 20 8.56 0.43
Table D74 : Measurements of clothing value at Pharmacy, Putrajaya. Hospital -
Department Clothing Insulation Clothing value clo No. of people clo*people Average
Putrajaya Short-sleeve 0.19 0 0.00 - Pharmacy Normal long-sleeve shirt 0.25 5 1.25
Normal trousers 0.15 5 0.75 Socks 0.02 5 0.10 Shoes 0.02 5 0.10 Jacket 0.36 1 0.36 Overall 0.49 1 0.49
Total 5 3.05 0.61
Table D75 : Measurements of clothing value at X-ray & radiography, Putrajaya.
Hospital - Department Clothing Insulation Clothing value clo No. of people clo*people Average
Putrajaya Short-sleeve 0.19 1 0.19 - X-ray & radiography Normal long-sleeve shirt 0.25 4 1.00
Normal trousers 0.15 5 0.75 Socks 0.02 5 0.10 Shoes 0.02 5 0.10 Jacket 0.36 1 0.36 Overall 0.49 3 1.47
Total 5 3.97 0.79
Univers
ity of
Mala
ya
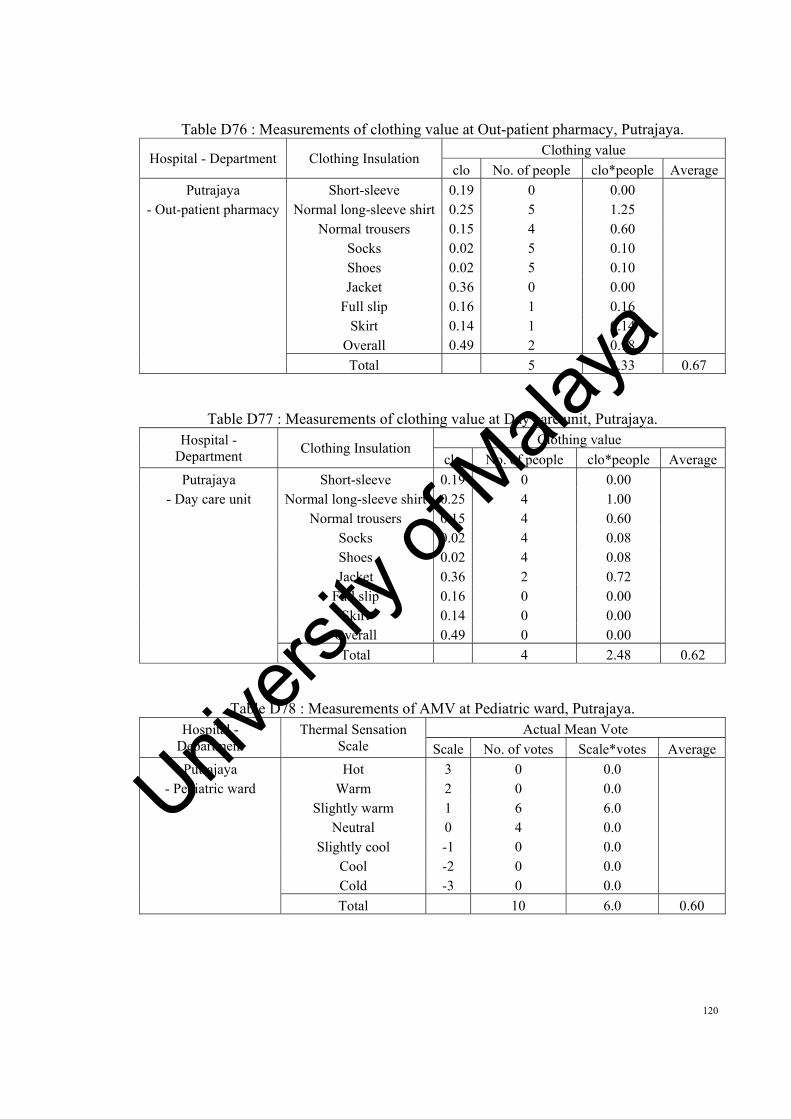
120
Table D76 : Measurements of clothing value at Out-patient pharmacy, Putrajaya.
Hospital - Department Clothing Insulation Clothing value clo No. of people clo*people Average
Putrajaya Short-sleeve 0.19 0 0.00 - Out-patient pharmacy Normal long-sleeve shirt 0.25 5 1.25
Normal trousers 0.15 4 0.60 Socks 0.02 5 0.10 Shoes 0.02 5 0.10 Jacket 0.36 0 0.00 Full slip 0.16 1 0.16 Skirt 0.14 1 0.14 Overall 0.49 2 0.98
Total 5 3.33 0.67
Table D77 : Measurements of clothing value at Day care unit, Putrajaya. Hospital -
Department Clothing Insulation Clothing value clo No. of people clo*people Average
Putrajaya Short-sleeve 0.19 0 0.00 - Day care unit Normal long-sleeve shirt 0.25 4 1.00
Normal trousers 0.15 4 0.60 Socks 0.02 4 0.08 Shoes 0.02 4 0.08 Jacket 0.36 2 0.72 Full slip 0.16 0 0.00 Skirt 0.14 0 0.00 Overall 0.49 0 0.00
Total 4 2.48 0.62
Table D78 : Measurements of AMV at Pediatric ward, Putrajaya. Hospital -
Department Thermal Sensation
Scale Actual Mean Vote
Scale No. of votes Scale*votes Average
Putrajaya Hot 3 0 0.0 - Pediatric ward Warm 2 0 0.0
Slightly warm 1 6 6.0 Neutral 0 4 0.0 Slightly cool -1 0 0.0 Cool -2 0 0.0 Cold -3 0 0.0
Total 10 6.0 0.60
Univers
ity of
Mala
ya

121
Table D79 : Measurements of AMV at Orthopedic ward, Putrajaya. Hospital -
Department Thermal Sensation
Scale Actual Mean Vote
Scale No. of votes Scale*votes Average
Putrajaya Hot 3 0 0.0 - Orthopedic ward Warm 2 0 0.0
Slightly warm 1 1 1.0 Neutral 0 6 0.0 Slightly cool -1 5 -5.0 Cool -2 3 -6.0 Cold -3 0 0.0
Total 15 -10.0 -0.67
Table D80 : Measurements of AMV at Female medical ward, Putrajaya.
Hospital - Department Thermal Sensation Scale
Actual Mean Vote Scale No. of votes Scale*votes Average
Putrajaya Hot 3 0 0.0 - Female medical ward Warm 2 0 0.0
Slightly warm 1 4 4.0 Neutral 0 9 0.0 Slightly cool -1 4 -4.0 Cool -2 2 -4.0 Cold -3 1 -3.0
Total 20 -7.0 -0.35
Table D81 : Measurements of AMV at Pharmacy, Putrajaya. Hospital -
Department Thermal Sensation
Scale Actual Mean Vote
Scale No. of votes Scale*votes Average
Putrajaya Hot 3 0 0.0 - Pharmacy Warm 2 0 0.0
Slightly warm 1 0 0.0 Neutral 0 1 0.0 Slightly cool -1 2 -2.0 Cool -2 0 0.0 Cold -3 2 -6.0
Total 5 -8.0 -1.60
Univers
ity of
Mala
ya

122
Table D82 : Measurements of AMV at X-ray & radiography, Putrajaya.
Hospital - Department Thermal Sensation Scale
Actual Mean Vote Scale No. of votes Scale*votes Average
Putrajaya Hot 3 0 0.0 - X-ray & radiography Warm 2 0 0.0
Slightly warm 1 1 1.0 Neutral 0 0 0.0 Slightly cool -1 2 -2.0 Cool -2 1 -2.0 Cold -3 1 -3.0
Total 5 -6.0 -1.20
Table D83 : Measurements of AMV at Out-patient pharmacy, Putrajaya.
Hospital - Department Thermal Sensation Scale
Actual Mean Vote Scale No. of votes Scale*votes Average
Putrajaya Hot 3 0 0.0 - Out-patient pharmacy Warm 2 0 0.0
Slightly warm 1 1 1.0 Neutral 0 0 0.0 Slightly cool -1 3 -3.0 Cool -2 1 -2.0 Cold -3 0 0.0
Total 5 -4.0 -0.80
Table D84 : Measurements of AMV at Day care unit, Putrajaya. Hospital -
Department Thermal Sensation
Scale Actual Mean Vote
Scale No. of votes Scale*votes Average
Putrajaya Hot 3 0 0.0 - Day care unit Warm 2 0 0.0
Slightly warm 1 0 0.0 Neutral 0 0 0.0 Slightly cool -1 3 -3.0 Cool -2 0 0.0 Cold -3 1 -3.0
Total 4 -6.0 -1.50
Univers
ity of
Mala
ya

123
Table D85 : Measurements of air temperature at Outpatient pharmacy, Sungai Buloh.
Hospital - Department Sampling Point
Tair (oC)
0.1 m 0.6 m 1.1 m 1.7 m Average
Sungai Buloh 1 22.9 22.5 22.3 22.6 22.6- Outpatient pharmacy 2 21.5 21.3 21.3 21.2 21.3
3 21.2 21.1 21.1 21.1 21.1 4 20.9 20.8 20.8 20.7 20.8 5 23.4 23.8 23.7 23.5 23.6 6 19.7 19.8 19.9 20.0 19.9 7 23.0 20.3 20.5 20.6 21.1 Total average 21.5
Table D86 : Measurements of air temperature at Pathodology unit, Sungai Buloh.
Hospital - Department Sampling Point
Tair (oC)
0.1 m 0.6 m 1.1 m 1.7 m Average
Sungai Buloh 1 22.4 22.2 22.2 22.1 22.2- Pathodology unit 2 24.2 24.3 24.7 25.5 24.7
3 22.8 22.1 21.2 21.6 21.9 4 21.4 21.2 21.3 21.4 21.3 5 19.4 19.4 19.1 19.4 19.3 6 20.2 20.3 20.4 20.6 20.4 7 20.8 21.0 21.4 21.4 21.2 Total average 21.6
Table D87 : Measurements of air temperature at X-Ray workstation, Sungai Buloh.
Hospital - Department Sampling Point
Tair (oC)
0.1 m 0.6 m 1.1 m 1.7 m Average
Sungai Buloh 1 22.3 21.9 22.1 22.2 22.1- X-Ray workstation 2 21.8 21.6 21.3 21.5 21.6
3 22.1 22.5 22.7 22.9 22.6 4 22.8 22.6 22.4 22.1 22.5 5 23.4 23.4 23.7 23.8 23.6 6 23.9 23.1 23.6 23.7 23.6 Total average 22.6
Univers
ity of
Mala
ya

124
Table D88 : Measurements of air temperature at Pediatric ward, Sungai Buloh.
Hospital - Department Sampling Point
Tair (oC)
0.1 m 0.6 m 1.1 m 1.7 m Average
Sungai Buloh 1 22.2 22.1 22.3 22.4 22.3- Pediatric ward 2 22.4 22.3 21.3 22.3 22.1
3 21.9 22.2 22.4 22.4 22.2 4 22.5 20.8 21.4 22.6 21.8 5 22.3 22.4 22.4 39.6 26.7 6 22.9 23.2 22.8 23.0 23.0 Total average 23.0
Table D89 : Measurements of air temperature at Maternity ward, Sungai Buloh.
Hospital - Department Sampling Point
Tair (oC)
0.1 m 0.6 m 1.1 m 1.7 m Average
Sungai Buloh 1 23.3 23.2 22.6 22.7 23.0- Maternity ward 2 22.1 22.1 21.9 21.8 22.0
3 21.1 21.2 21.4 21.0 21.2 4 20.9 21.0 22.5 21.3 21.4 5 21.6 21.7 21.8 22.0 21.8 6 21.6 21.5 22.3 21.2 21.7 Total average 21.8
Table D90 : Measurements of globe temperature at Outpatient pharmacy, Sungai Buloh.
Hospital - Department Sampling Point
Tglobe (oC)
0.1 m 0.6 m 1.1 m 1.7 m Average
Sungai Buloh 1 22.1 22.1 22.3 22.5 22.3- Outpatient pharmacy 2 21.5 21.5 21.6 21.7 21.6
3 21.2 21.3 21.5 21.7 21.4 4 21.0 21.0 21.2 21.3 21.1 5 21.8 21.8 21.6 21.9 21.8 6 19.8 20.0 20.1 20.6 20.1 7 22.9 20.6 21.0 21.2 21.4 Total average 21.4
Univers
ity of
Mala
ya

125
Table D91 : Measurements of globe temperature at Pathodology unit, Sungai Buloh.
Hospital - Department Sampling Point
Tglobe (oC)
0.1 m 0.6 m 1.1 m 1.7 m Average
Sungai Buloh 1 22.1 22.3 22.3 22.5 22.3- Pathodology unit 2 23.3 23.9 25.1 26.1 24.6
3 22.8 22.2 21.6 22.1 22.2 4 21.5 21.4 21.6 22.0 21.6 5 19.7 19.9 19.8 20.2 19.9 6 20.2 20.5 20.9 21.2 20.7 7 20.9 21.3 21.9 22.0 21.5 Total average 21.8
Table D92 : Measurements of globe temperature at X-Ray workstation, Sungai Buloh.
Hospital - Department Sampling Point
Tglobe (oC)
0.1 m 0.6 m 1.1 m 1.7 m Average
Sungai Buloh 1 22.2 22.1 22.4 22.7 22.4- X-Ray workstation 2 21.8 21.8 21.6 22.0 21.8
3 21.4 21.4 21.6 21.7 21.5 4 21.0 21.6 21.8 22.0 21.6 5 21.8 22.0 22.4 22.6 22.2 6 21.4 21.8 21.9 22.5 21.9 Total average 21.9
Table D93 : Measurements of globe temperature at Pediatric ward, Sungai Buloh.
Hospital - Department
Sampling Point
Tglobe (oC)
0.1 m 0.6 m 1.1 m 1.7 m Average
Sungai Buloh 1 22.2 22.3 22.6 22.9 22.5- Pediatric ward 2 22.4 22.5 21.6 22.8 22.3
3 21.9 22.4 22.8 23.0 22.5 4 22.5 20.9 21.7 23.2 22.1 5 26.8 26.9 27.0 26.7 26.9 6 22.8 23.3 23.3 23.5 23.2 Total average 23.3
Table D94 : Measurements of globe temperature at Maternity ward, Sungai Buloh.
Hospital - Department
Sampling Point
Tglobe (oC)
0.1 m 0.6 m 1.1 m 1.7 m Average
Sungai Buloh 1 23.5 23.6 21.3 23.6 23.0- Maternity ward 2 22.4 22.5 20.3 22.5 21.9
3 21.3 21.5 19.7 21.8 21.1 4 21.1 21.4 20.2 22.0 21.2 5 21.7 22.1 20.5 22.9 21.8 6 21.7 21.8 20.2 21.8 21.4 Total average 21.7
Univers
ity of
Mala
ya

126
Table D95 : Measurements of air velocity at Outpatient pharmacy, Sungai Buloh.
Hospital - Department Sampling Point
V (m/s) 0.1 m 0.6 m 1.1 m 1.7 m Average
Sungai Buloh 1 0.03 0.13 0.08 0.09 0.08- Outpatient pharmacy 2 0.20 0.13 0.10 0.12 0.14
3 0.04 0.08 0.16 0.15 0.11 4 0.08 0.11 0.10 0.16 0.11 5 0.14 0.17 0.18 0.16 0.16 6 0.05 0.05 0.08 0.12 0.08 7 0.20 0.15 0.17 0.13 0.16 Total average 0.12
Table D96 : Measurements of air velocity at Pathodology unit, Sungai Buloh.
Hospital - Department Sampling Point
V (m/s) 0.1 m 0.6 m 1.1 m 1.7 m Average
Sungai Buloh 1 0.05 0.13 0.08 0.09 0.09- Pathodology unit 2 0.09 0.11 0.10 0.11 0.10
3 0.15 0.16 0.16 0.15 0.16 4 0.08 0.11 0.10 0.12 0.10 5 0.14 0.16 0.19 0.16 0.16 6 0.07 0.08 0.08 0.12 0.09 7 0.20 0.15 0.17 0.14 0.17 Total average 0.12
Table D97 : Measurements of air velocity at X-Ray workstation, Sungai Buloh.
Hospital - Department
Sampling Point
V (m/s)
0.1 m 0.6 m 1.1 m 1.7 m Average
Sungai Buloh 1 0.05 0.13 0.08 0.09 0.09- X-Ray workstation 2 0.20 0.13 0.10 0.12 0.14
3 0.04 0.08 0.15 0.14 0.10 4 0.08 0.11 0.10 0.16 0.11 5 0.14 0.15 0.16 0.16 0.15 6 0.07 0.08 0.08 0.12 0.09 Total average 0.11
Table D98 : Measurements of air velocity at Pediatric ward, Sungai Buloh. Hospital -
Department Sampling
Point V (m/s)
0.1 m 0.6 m 1.1 m 1.7 m Average
Sungai Buloh 1 0.08 0.13 0.08 0.09 0.10- Pediatric ward 2 0.11 0.11 0.10 0.12 0.11
3 0.04 0.08 0.15 0.14 0.10 4 0.08 0.11 0.10 0.16 0.11 5 0.14 0.16 0.18 0.17 0.16 6 0.08 0.09 0.10 0.12 0.10 Total average 0.11
Univers
ity of
Mala
ya

127
Table D99 : Measurements of air velocity at Maternity ward, Sungai Buloh.
Hospital - Department Sampling Point
V (m/s) 0.1 m 0.6 m 1.1 m 1.7 m Average
Sungai Buloh 1 0.09 0.13 0.16 0.14 0.13- Maternity ward 2 0.06 0.06 0.09 0.13 0.09
3 0.03 0.03 0.12 0.18 0.09 4 0.06 0.10 0.11 0.10 0.09 5 0.04 0.10 0.11 0.19 0.11 6 0.07 0.05 0.08 0.10 0.08 Total average 0.10
Table D100 : Measurements of relative humidity at Outpatient pharmacy, Sungai Buloh.
Hospital - Department Sampling Point
RH (%) 0.1 m 0.6 m 1.1 m 1.7 m Average
Sungai Buloh 1 64.4 68.6 69.5 70.1 68.2- Outpatient pharmacy 2 69.6 69.0 69.0 68.3 69.0
3 68.0 67.4 67.7 67.7 67.7 4 65.7 65.8 66.0 67.6 66.3 5 66.2 65.1 68.8 68.9 67.3 6 69.1 68.2 68.0 67.7 68.2 7 70.3 67.2 60.3 66.7 66.1 Total average 67.5
Table D101 : Measurements of relative humidity at Pathodology unit, Sungai Buloh.
Hospital - Department Sampling Point
RH (%) 0.1 m 0.6 m 1.1 m 1.7 m Average
Sungai Buloh 1 76.6 76.4 76.6 76.5 76.5- Pathodology unit 2 59.7 59.6 56.9 54.3 57.6
3 70.5 70.1 70.6 70.5 70.4 4 72.2 72.8 72.4 72.1 72.4 5 71.4 72.2 72.6 72.4 72.1 6 73.2 73.1 72.8 72.2 72.8 7 70.6 70.7 70.7 70.8 70.7 Total average 70.4
Table D102 : Measurements of relative humidity at X-Ray workstation, Sungai Buloh.
Hospital - Department Sampling Point
RH (%) 0.1 m 0.6 m 1.1 m 1.7 m Average
Sungai Buloh 1 67.6 68.1 68.0 68.1 68.0- X-Ray workstation 2 68.3 69.5 70.2 69.6 69.4
3 69.4 70.4 70.7 70.6 70.3 4 70.6 68.3 69.5 69.9 69.6 5 67.0 67.6 67.1 67.1 67.2 6 69.5 69.4 69.5 68.5 69.2 Total average 68.9
Univers
ity of
Mala
ya

128
Table D103 : Measurements of relative humidity at Pediatric ward, Sungai Buloh.
Hospital - Department Sampling Point
RH (%) 0.1 m 0.6 m 1.1 m 1.7 m Average
Sungai Buloh 1 71.8 72.9 73.6 74.0 73.1- Pediatric ward 2 72.9 73.0 69.0 72.7 71.9
3 69.4 69.8 69.8 68.5 69.4 4 68.2 65.8 67.3 67.3 67.1 5 60.8 66.2 65.0 71.3 65.8 6 62.6 62.4 62.7 63.0 62.7 Total average 68.3
Table D104 : Measurements of relative humidity at Maternity ward, Sungai Buloh.
Hospital - Department Sampling Point
RH (%) 0.1 m 0.6 m 1.1 m 1.7 m Average
Sungai Buloh 1 59.2 60.2 54.91 63.4 59.4- Maternity ward 2 64.2 64.0 58.95 67.0 63.5
3 68.4 68.3 61.87 69.3 67.0 4 69.2 68.9 61.77 68.8 67.2 5 64.6 64.1 57.01 63.5 62.3 6 65.4 65.6 59.46 67.0 64.4 Total average 64.0
Table D105 : Measurements of metabolic rate at Outpatient pharmacy, Sungai Buloh.
Hospital - Department Activity Level Metabolic rate met No. of people met*people Average
Sungai Buloh Seated quiet 1.0 4 4.0 - Outpatient pharmacy Typing 1.1 0 0.0
Standing relaxed 1.2 6 7.2 Filing (standing) 1.4 1 1.4 Walking about 1.7 0 0.0
Total 11 12.6 1.15
Table D106 : Measurements of metabolic rate at Pathodology unit, Sungai Buloh. Hospital -
Department Activity Level Metabolic rate met No. of people met*people Average
Sungai Buloh Seated quiet 1.0 0 0.0 - Pathodology unit Typing 1.1 0 0.0
Standing relaxed 1.2 0 0.0 Filing (standing) 1.4 0 0.0 Walking about 1.7 4 6.8
Total 4 6.8 1.70
Univers
ity of
Mala
ya

129
Table D107 : Measurements of metabolic rate at X-Ray workstation, Sungai Buloh. Hospital -
Department Activity Level Metabolic rate met No. of people met*people Average
Sungai Buloh Seated quiet 1.0 0 0.0 - X-Ray workstation Typing 1.1 0 0.0
Standing relaxed 1.2 6 7.2 Filing (standing) 1.4 3 4.2 Walking about 1.7 4 6.8
Total 13 18.2 1.40
Table D108 : Measurements of metabolic rate at Pediatric ward, Sungai Buloh. Hospital -
Department Activity Level Metabolic rate met No. of people met*people Average
Sungai Buloh Seated quiet 1.0 0 0.0 - Pediatric ward Typing 1.1 0 0.0
Standing relaxed 1.2 1 1.2 Filing (standing) 1.4 1 1.4 Walking about 1.7 1 1.7
Total 3 4.3 1.43
Table D109 : Measurements of metabolic rate at Maternity ward, Sungai Buloh. Hospital -
Department Activity Level Metabolic rate met No. of people met*people Average
Sungai Buloh Seated quiet 1.0 0 0.0 - Maternity ward Typing 1.1 0 0.0
Standing relaxed 1.2 2 2.4 Filing (standing) 1.4 0 0.0 Walking about 1.7 3 5.1
Total 5 7.5 1.50
Table D110 : Measurements of clothing value at Outpatient pharmacy, Sungai Buloh.
Hospital - Department Clothing Insulation Clothing value clo No. of people clo*people Average
Sungai Buloh Short-sleeve 0.19 4 0.76 - Outpatient pharmacy Normal long-sleeve shirt 0.25 7 1.75
Normal trousers 0.15 11 1.65 Socks 0.02 11 0.22 Shoes 0.02 11 0.22 Jacket 0.36 8 2.88 Full slip 0.16 0 0.00 Skirt 0.14 0 0.00 Overall 0.49 2 0.98
Total 11 8.46 0.77
Univers
ity of
Mala
ya
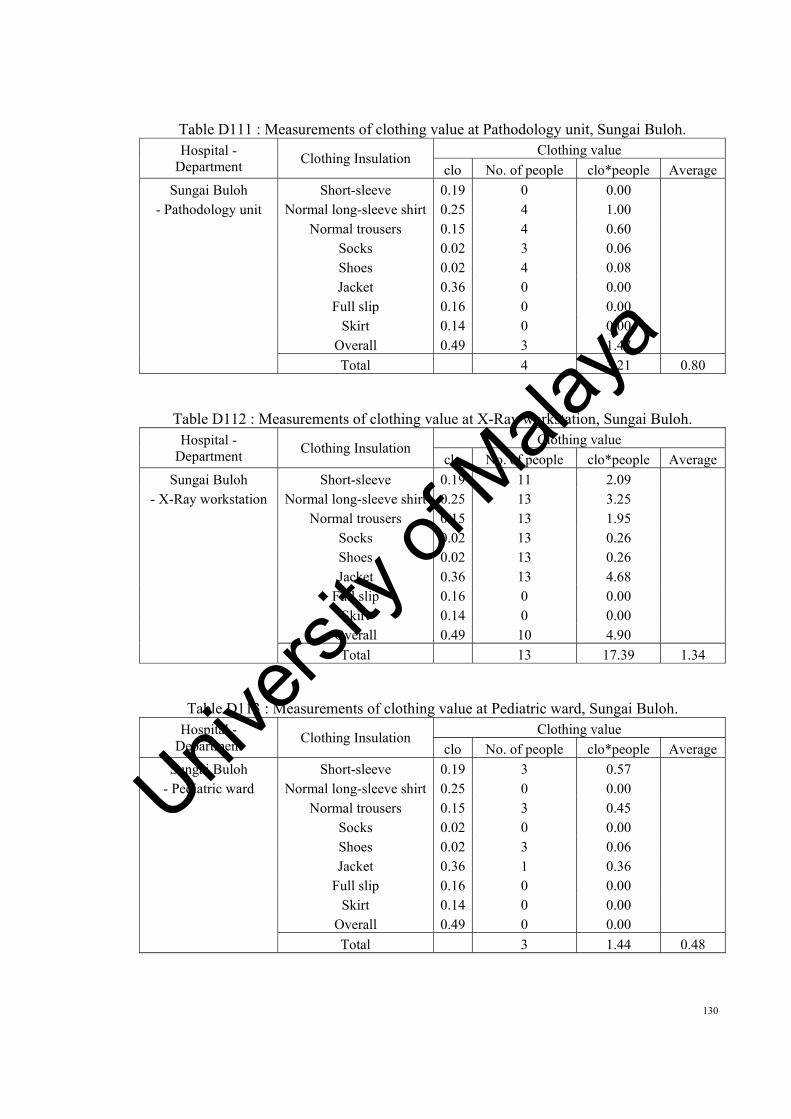
130
Table D111 : Measurements of clothing value at Pathodology unit, Sungai Buloh. Hospital -
Department Clothing Insulation Clothing value clo No. of people clo*people Average
Sungai Buloh Short-sleeve 0.19 0 0.00 - Pathodology unit Normal long-sleeve shirt 0.25 4 1.00
Normal trousers 0.15 4 0.60 Socks 0.02 3 0.06 Shoes 0.02 4 0.08 Jacket 0.36 0 0.00 Full slip 0.16 0 0.00 Skirt 0.14 0 0.00 Overall 0.49 3 1.47
Total 4 3.21 0.80
Table D112 : Measurements of clothing value at X-Ray workstation, Sungai Buloh. Hospital -
Department Clothing Insulation Clothing value clo No. of people clo*people Average
Sungai Buloh Short-sleeve 0.19 11 2.09 - X-Ray workstation Normal long-sleeve shirt 0.25 13 3.25
Normal trousers 0.15 13 1.95 Socks 0.02 13 0.26 Shoes 0.02 13 0.26 Jacket 0.36 13 4.68 Full slip 0.16 0 0.00 Skirt 0.14 0 0.00 Overall 0.49 10 4.90
Total 13 17.39 1.34
Table D113 : Measurements of clothing value at Pediatric ward, Sungai Buloh. Hospital -
Department Clothing Insulation Clothing value clo No. of people clo*people Average
Sungai Buloh Short-sleeve 0.19 3 0.57 - Pediatric ward Normal long-sleeve shirt 0.25 0 0.00
Normal trousers 0.15 3 0.45 Socks 0.02 0 0.00 Shoes 0.02 3 0.06 Jacket 0.36 1 0.36 Full slip 0.16 0 0.00 Skirt 0.14 0 0.00 Overall 0.49 0 0.00
Total 3 1.44 0.48
Univers
ity of
Mala
ya

131
Table D114 : Measurements of clothing value at Maternity ward, Sungai Buloh. Hospital -
Department Clothing Insulation Clothing value clo No. of people clo*people Average
Sungai Buloh Short-sleeve 0.19 4 0.76 - Maternity ward Normal long-sleeve shirt 0.25 1 0.25
Normal trousers 0.15 5 0.75 Socks 0.02 4 0.08 Shoes 0.02 5 0.10 Jacket 0.36 3 1.08 Full slip 0.16 0 0.00 Skirt 0.14 0 0.00 Overall 0.49 1 0.49
Total 5 3.51 0.70
Table D115 : Measurements of AMV at Outpatient pharmacy, Sungai Buloh.
Hospital - Department Thermal Sensation Scale
Actual Mean Vote Scale No. of votes Scale*votes Average
Sungai Buloh Hot 3 0 0.0 - Outpatient pharmacy Warm 2 2 4.0
Slightly warm 1 3 3.0 Neutral 0 2 0.0 Slightly cool -1 1 -1.0 Cool -2 2 -4.0 Cold -3 1 -3.0
Total 11 -1.0 -0.10
Table D116 : Measurements of AMV at Pathodology unit, Sungai Buloh. Hospital -
Department Thermal Sensation
Scale Actual Mean Vote
Scale No. of votes Scale*votes Average
Sungai Buloh Hot 3 0 0.0 - Pathodology unit Warm 2 1 2.0
Slightly warm 1 0 0.0 Neutral 0 2 0.0 Slightly cool -1 1 -1.0 Cool -2 0 0.0 Cold -3 0 0.0
Total 4 1.0 0.10
Univers
ity of
Mala
ya

132
Table D117 : Measurements of AMV at X-Ray workstation, Sungai Buloh. Hospital -
Department Thermal Sensation
Scale Actual Mean Vote
Scale No. of votes Scale*votes Average
Sungai Buloh Hot 3 0 0.0 - X-Ray workstation Warm 2 1 2.0
Slightly warm 1 5 5.0 Neutral 0 2 0.0 Slightly cool -1 5 -5.0 Cool -2 0 0.0 Cold -3 0 0.0
Total 13 2.0 0.10
Table D118 : Measurements of AMV at Pediatric ward, Sungai Buloh. Hospital -
Department Thermal Sensation
Scale Actual Mean Vote
Scale No. of votes Scale*votes Average
Sungai Buloh Hot 3 0 0.0 - Pediatric ward Warm 2 1 2.0
Slightly warm 1 0 0.0 Neutral 0 1 0.0 Slightly cool -1 1 -1.0 Cool -2 0 0.0 Cold -3 0 0.0
Total 3 1.0 0.30
Table D119 : Measurements of AMV at Maternity ward, Sungai Buloh. Hospital -
Department Thermal Sensation
Scale Actual Mean Vote
Scale No. of votes Scale*votes Average
Sungai Buloh Hot 3 0 0.0 - Maternity ward Warm 2 0 0.0
Slightly warm 1 2 2.0 Neutral 0 1 0.0 Slightly cool -1 1 -1.0 Cool -2 1 -2.0 Cold -3 0 0.0
Total 5 -1.0 -0.20
Univers
ity of
Mala
ya
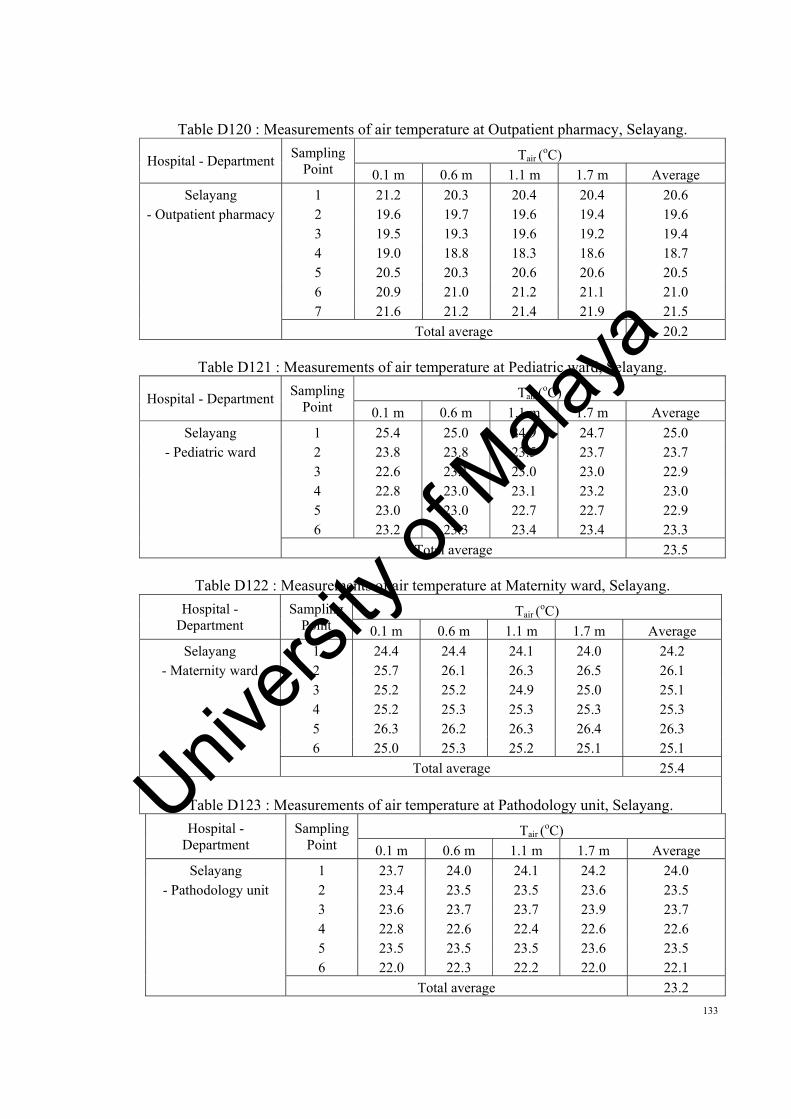
133
Table D120 : Measurements of air temperature at Outpatient pharmacy, Selayang.
Hospital - Department Sampling Point
Tair (oC)
0.1 m 0.6 m 1.1 m 1.7 m Average
Selayang 1 21.2 20.3 20.4 20.4 20.6- Outpatient pharmacy 2 19.6 19.7 19.6 19.4 19.6
3 19.5 19.3 19.6 19.2 19.4 4 19.0 18.8 18.3 18.6 18.7 5 20.5 20.3 20.6 20.6 20.5 6 20.9 21.0 21.2 21.1 21.0 7 21.6 21.2 21.4 21.9 21.5 Total average 20.2
Table D121 : Measurements of air temperature at Pediatric ward, Selayang.
Hospital - Department Sampling Point
Tair (oC)
0.1 m 0.6 m 1.1 m 1.7 m Average
Selayang 1 25.4 25.0 24.9 24.7 25.0- Pediatric ward 2 23.8 23.8 23.5 23.7 23.7
3 22.6 23.1 23.0 23.0 22.9 4 22.8 23.0 23.1 23.2 23.0 5 23.0 23.0 22.7 22.7 22.9 6 23.2 23.3 23.4 23.4 23.3 Total average 23.5
Table D122 : Measurements of air temperature at Maternity ward, Selayang.
Hospital - Department
Sampling Point
Tair (oC)
0.1 m 0.6 m 1.1 m 1.7 m Average
Selayang 1 24.4 24.4 24.1 24.0 24.2- Maternity ward 2 25.7 26.1 26.3 26.5 26.1
3 25.2 25.2 24.9 25.0 25.1 4 25.2 25.3 25.3 25.3 25.3 5 26.3 26.2 26.3 26.4 26.3 6 25.0 25.3 25.2 25.1 25.1 Total average 25.4
Table D123 : Measurements of air temperature at Pathodology unit, Selayang.
Hospital - Department
Sampling Point
Tair (oC)
0.1 m 0.6 m 1.1 m 1.7 m Average
Selayang 1 23.7 24.0 24.1 24.2 24.0- Pathodology unit 2 23.4 23.5 23.5 23.6 23.5
3 23.6 23.7 23.7 23.9 23.7 4 22.8 22.6 22.4 22.6 22.6 5 23.5 23.5 23.5 23.6 23.5 6 22.0 22.3 22.2 22.0 22.1 Total average 23.2
Univers
ity of
Mala
ya

134
Table D124 : Measurements of air temperature at X-ray workstation, Selayang.
Hospital - Department Sampling Point
Tair (oC)
0.1 m 0.6 m 1.1 m 1.7 m Average
Selayang 1 21.7 22.1 22.0 22.0 21.9- X-ray workstation 2 22.6 22.8 22.9 23.3 22.9
3 22.4 22.2 22.5 22.2 22.3 4 20.8 20.5 20.5 20.3 20.5 5 20.5 20.6 20.6 20.7 20.6 6 21.0 21.1 21.1 21.1 21.1 7 21.0 21.0 20.7 20.9 20.9 Total average 21.5
Table D125 : Measurements of globe temperature at Outpatient pharmacy, Selayang.
Hospital - Department Sampling Point
Tglobe (oC)
0.1 m 0.6 m 1.1 m 1.7 m Average
Selayang 1 21.2 20.5 20.8 20.8 20.8- Outpatient pharmacy 2 19.6 19.9 19.7 19.9 19.8
3 19.5 19.4 19.8 19.8 19.6 4 19.1 19.1 18.7 19.1 19.0 5 20.4 20.4 20.8 21.1 20.7 6 20.7 20.7 21.1 21.4 21.0 7 21.7 21.5 21.7 22.4 21.8 Total average 20.4
Table D126 : Measurements of globe temperature at Pediatric ward, Selayang.
Hospital - Department
Sampling Point
Tglobe (oC)
0.1 m 0.6 m 1.1 m 1.7 m Average
Selayang 1 25.4 25.1 25.1 25.1 25.2- Pediatric ward 2 23.7 23.9 23.8 24.2 23.9
3 22.6 23.3 23.2 23.6 23.2 4 22.8 23.2 23.4 23.6 23.3 5 23.0 23.1 23.1 23.1 23.1 6 23.3 23.5 23.7 23.9 23.6 Total average 23.7
Univers
ity of
Mala
ya

135
Table D127 : Measurements of globe temperature at Maternity ward, Selayang.
Hospital - Department
Sampling Point
Tglobe (oC)
0.1 m 0.6 m 1.1 m 1.7 m Average
Selayang 1 24.4 24.6 24.3 24.3 24.4- Maternity ward 2 25.8 26.3 26.8 26.8 26.4
3 25.2 25.4 25.3 25.4 25.3 4 25.3 25.5 25.8 25.8 25.6 5 26.3 26.4 26.6 26.8 26.5 6 25.1 25.4 25.5 25.6 25.4 Total average 25.6
Table D128 : Measurements of globe temperature at Pathodology unit, Selayang.
Hospital - Department
Sampling Point
Tglobe (oC)
0.1 m 0.6 m 1.1 m 1.7 m Average
Selayang 1 23.7 24.1 24.4 24.6 24.2- Pathodology unit 2 23.4 23.7 23.9 24.0 23.8
3 23.6 23.8 24.0 24.4 24.0 4 22.8 22.8 22.7 23.0 22.8 5 23.4 23.6 24.0 24.2 23.8 6 22.0 22.3 22.4 22.3 22.3 Total average 23.5
Table D129 : Measurements of globe temperature at X-ray workstation, Selayang.
Hospital - Department
Sampling Point
Tglobe (oC)
0.1 m 0.6 m 1.1 m 1.7 m Average
Selayang 1 21.8 22.3 22.4 22.4 22.2- X-ray workstation 2 22.6 22.9 23.2 23.7 23.1
3 22.4 22.4 22.8 22.7 22.6 4 20.8 20.8 20.8 20.8 20.8 5 20.5 20.7 20.9 21.2 20.8 6 20.8 21.0 21.2 21.5 21.1 7 21.1 21.3 20.9 21.4 21.2 Total average 21.7
Univers
ity of
Mala
ya

136
Table D130 : Measurements of air velocity at Outpatient pharmacy, Selayang.
Hospital - Department Sampling Point
V (m/s) 0.1 m 0.6 m 1.1 m 1.7 m Average
Selayang 1 0.17 0.21 0.12 0.05 0.14- Outpatient pharmacy 2 0.33 0.11 0.05 0.12 0.15
3 0.12 0.07 0.06 0.13 0.10 4 0.11 0.13 0.08 0.02 0.09 5 0.10 0.09 0.09 0.12 0.10 6 0.10 0.09 0.07 0.08 0.09 7 0.11 0.08 0.06 0.07 0.08 Total average 0.11
Table D131 : Measurements of air velocity at Pediatric ward, Selayang.
Hospital - Department Sampling Point
V (m/s) 0.1 m 0.6 m 1.1 m 1.7 m Average
Selayang 1 0.12 0.13 0.12 0.15 0.13- Pediatric ward 2 0.12 0.17 0.14 0.12 0.14
3 0.14 0.18 0.16 0.14 0.16 4 0.10 0.10 0.08 0.09 0.09 5 0.20 0.11 0.18 0.15 0.16 6 0.10 0.11 0.09 0.10 0.10 Total average 0.13
Table D132 : Measurements of air velocity at Maternity ward, Selayang.
Hospital - Department Sampling Point
V (m/s) 0.1 m 0.6 m 1.1 m 1.7 m Average
Selayang 1 0.21 0.18 0.15 0.11 0.16- Maternity ward 2 0.21 0.17 0.23 0.26 0.22
3 0.17 0.16 0.13 0.15 0.15 4 0.29 0.28 0.26 0.18 0.25 5 0.19 0.14 0.17 0.18 0.17 6 0.32 0.29 0.23 0.25 0.27 Total average 0.20
Table D133 : Measurements of air velocity at Pathodology unit, Selayang.
Hospital - Department Sampling Point
V (m/s) 0.1 m 0.6 m 1.1 m 1.7 m Average
Selayang 1 0.13 0.09 0.11 0.12 0.11- Pathodology unit 2 0.12 0.11 0.10 0.08 0.10
3 0.17 0.10 0.09 0.13 0.12 4 0.18 0.14 0.13 0.08 0.13 5 0.10 0.09 0.24 0.22 0.16 6 0.12 0.09 0.09 0.10 0.10 Total average 0.12
Univers
ity of
Mala
ya

137
Table D134 : Measurements of air velocity at X-ray workstation, Selayang.
Hospital - Department Sampling Point
V (m/s) 0.1 m 0.6 m 1.1 m 1.7 m Average
Selayang 1 0.18 0.14 0.17 0.11 0.15- X-ray workstation 2 0.15 0.10 0.12 0.09 0.12
3 0.10 0.08 0.07 0.08 0.08 4 0.12 0.16 0.10 0.11 0.12 5 0.15 0.13 0.10 0.12 0.13 6 0.13 0.12 0.09 0.08 0.10 7 0.14 0.16 0.10 0.13 0.13 Total average 0.12
Table D135 : Measurements of relative humidity at Outpatient pharmacy, Selayang.
Hospital - Department Sampling Point
RH (%) 0.1 m 0.6 m 1.1 m 1.7 m Average
Selayang 1 57.1 64.1 63.8 63.9 62.2- Outpatient pharmacy 2 64.3 64.1 65.3 66.8 65.1
3 65.3 65.9 65.1 65.0 65.3 4 65.7 66.9 67.9 67.8 67.1 5 60.7 60.5 60.3 60.2 60.4 6 61.0 60.1 60.6 59.6 60.3 7 61.2 65.5 65.7 69.2 65.4 Total average 63.7
Table D136 : Measurements of relative humidity at Pediatric ward, Selayang.
Hospital - Department Sampling Point
RH (%) 0.1 m 0.6 m 1.1 m 1.7 m Average
Selayang 1 58.9 59.5 61.2 61.6 60.3- Pediatric ward 2 58.5 58.5 58.9 63.7 59.9
3 60.7 60.9 61.1 60.4 60.8 4 60.2 60.3 60.2 60.4 60.3 5 61.4 61.1 61.5 61.6 61.4 6 63.5 64.0 63.9 63.8 63.8 Total average 61.1
Table D137 : Measurements of relative humidity at Maternity ward, Selayang.
Hospital - Department Sampling Point
RH (%) 0.1 m 0.6 m 1.1 m 1.7 m Average
Selayang 1 61.1 61.1 61.4 62.1 61.4- Maternity ward 2 58.4 57.9 56.1 55.3 56.9
3 53.4 53.4 54.5 55.2 54.1 4 55.0 54.6 54.2 54.2 54.5 5 55.7 55.7 55.5 55.4 55.6 6 55.5 55.3 55.6 55.5 55.5 Total average 56.3
Univers
ity of
Mala
ya

138
Table D138 : Measurements of relative humidity at Pathodology unit, Selayang.
Hospital - Department Sampling Point
RH (%) 0.1 m 0.6 m 1.1 m 1.7 m Average
Selayang 1 62.3 62.4 61.8 61.8 62.1- Pathodology unit 2 57.7 57.9 57.8 57.2 57.7
3 62.5 62.6 62.7 62.8 62.7 4 73.1 73.8 74.7 75.3 74.3 5 55.1 55.1 54.9 55.6 55.2 6 75.8 75.3 75.5 75.6 75.6 Total average 64.6
Table D139 : Measurements of relative humidity at X-ray workstation, Selayang.
Hospital - Department Sampling Point
RH (%) 0.1 m 0.6 m 1.1 m 1.7 m Average
Selayang 1 65.7 64.4 64.6 64.4 64.8- X-ray workstation 2 62.1 61.3 61.5 60.9 61.4
3 64.2 65.7 64.3 64.8 64.7 4 72.1 72.1 73.2 74.1 72.9 5 71.4 71.2 71.3 71.3 71.3 5 69.2 68.9 69.0 68.9 69.0 6 70.4 70.9 71.4 70.7 70.8 Total average 67.8
Table D140 : Measurements of metabolic rate at Outpatient pharmacy, Selayang.
Hospital - Department Activity Level Metabolic rate met No. of people met*people Average
Selayang Seated quiet 1.0 0 0.0 - Outpatient pharmacy Typing 1.1 0 0.0
Standing relaxed 1.2 1 1.2 Filing (standing) 1.4 5 7.0 Walking about 1.7 1 1.7
Total 7 9.9 1.40
Table D141 : Measurements of metabolic rate at Pediatric ward, Selayang. Hospital -
Department Activity Level Metabolic rate met No. of people met*people Average
Selayang Seated quiet 1.0 0 0.0 - Pediatric ward Typing 1.1 0 0.0
Standing relaxed 1.2 1 1.2 Filing (standing) 1.4 1 1.4 Walking about 1.7 1 1.7
Total 3 4.3 1.43
Univers
ity of
Mala
ya

139
Table D142 : Measurements of metabolic rate at Maternity ward, Selayang. Hospital -
Department Activity Level Metabolic rate met No. of people met*people Average
Selayang Seated quiet 1.0 0 0.0 - Maternity ward Typing 1.1 0 0.0
Standing relaxed 1.2 2 2.4 Filing (standing) 1.4 0 0.0 Walking about 1.7 3 5.1
Total 5 7.5 1.50
Table D143 : Measurements of metabolic rate at Pathodology unit, Selayang. Hospital -
Department Activity Level Metabolic rate met No. of people met*people Average
Selayang Seated quiet 1.0 0 0.0 - Pathodology unit Typing 1.1 0 0.0
Standing relaxed 1.2 4 4.8 Filing (standing) 1.4 0 0.0 Walking about 1.7 0 0.0
Total 4 4.8 1.20
Table D144 : Measurements of metabolic rate at X-ray workstation, Selayang. Hospital -
Department Activity Level Metabolic rate met No. of people met*people Average
Selayang Seated quiet 1.0 0 0.0 - X-ray workstation Typing 1.1 0 0.0
Standing relaxed 1.2 5 6.0 Filing (standing) 1.4 0 0.0 Walking about 1.7 0 0.0
Total 5 6 1.20
Table D145 : Measurements of clothing value at Outpatient pharmacy, Selayang.
Hospital - Department Clothing Insulation Clothing value clo No. of people clo*people Average
Selayang Short-sleeve 0.19 3 0.57 - Outpatient pharmacy Normal long-sleeve shirt 0.25 7 1.75
Normal trousers 0.15 7 1.05 Socks 0.02 7 0.14 Shoes 0.02 7 0.14 Jacket 0.36 7 2.52 Full slip 0.16 0 0.00 Skirt 0.14 0 0.00 Overall 0.49 7 3.43
Total 7 9.60 1.37
Univers
ity of
Mala
ya

140
Table D146 : Measurements of clothing value at Pediatric ward, Selayang. Hospital -
Department Clothing Insulation Clothing value clo No. of people clo*people Average
Selayang Short-sleeve 0.19 3 0.57 - Pediatric ward Normal long-sleeve shirt 0.25 0 0.00
Normal trousers 0.15 3 0.45 Socks 0.02 0 0.00 Shoes 0.02 3 0.06 Jacket 0.36 1 0.36 Full slip 0.16 0 0.00 Skirt 0.14 0 0.00 Overall 0.49 0 0.00
Total 3 1.44 0.48
Table D147 : Measurements of clothing value at Maternity ward, Selayang. Hospital -
Department Clothing Insulation Clothing value clo No. of people clo*people Average
Selayang Short-sleeve 0.19 3 0.57 - Maternity ward Normal long-sleeve shirt 0.25 2 0.50
Normal trousers 0.15 5 0.75 Socks 0.02 1 0.02 Shoes 0.02 5 0.10 Jacket 0.36 3 1.08 Full slip 0.16 0 0.00 Skirt 0.14 0 0.00 Overall 0.49 1 0.49
Total 5 3.51 0.70
Table D148 : Measurements of clothing value at Pathodology unit, Selayang. Hospital -
Department Clothing Insulation Clothing value clo No. of people clo*people Average
Selayang Short-sleeve 0.19 1 0.19 - Pathodology unit Normal long-sleeve shirt 0.25 3 0.75
Normal trousers 0.15 4 0.60 Socks 0.02 4 0.08 Shoes 0.02 4 0.08 Jacket 0.36 2 0.72 Full slip 0.16 0 0.00 Skirt 0.14 0 0.00 Overall 0.49 2 0.98
Total 4 3.40 0.85
Univers
ity of
Mala
ya

141
Table D149 : Measurements of clothing value at X-ray workstation, Selayang. Hospital -
Department Clothing Insulation Clothing value clo No. of people clo*people Average
Selayang Short-sleeve 0.19 4 0.76 - X-ray workstation Normal long-sleeve shirt 0.25 1 0.25
Normal trousers 0.15 5 0.75 Socks 0.02 5 0.10 Shoes 0.02 5 0.10 Jacket 0.36 4 1.44 Full slip 0.16 0 0.00 Skirt 0.14 0 0.00 Overall 0.49 5 2.45
Total 5 5.85 1.17
Table D150 : Measurements of AMV at Outpatient pharmacy, Selayang.
Hospital - Department Thermal Sensation Scale
Actual Mean Vote Scale No. of votes Scale*votes Average
Selayang Hot 3 0 0.0 - Outpatient pharmacy Warm 2 0 0.0
Slightly warm 1 0 0.0 Neutral 0 0 0.0 Slightly cool -1 5 -5.0 Cool -2 0 0.0 Cold -3 2 -6.0
Total 7 -11.0 -2.40
Table D151 : Measurements of AMV at Pediatric ward, Selayang. Hospital -
Department Thermal Sensation
Scale Actual Mean Vote
Scale No. of votes Scale*votes Average
Selayang Hot 3 0 0.0 - Pediatric ward Warm 2 0 0.0
Slightly warm 1 1 1.0 Neutral 0 0 0.0 Slightly cool -1 1 -1.0 Cool -2 1 -2.0 Cold -3 0 0.0
Total 3 -2.0 -0.80
Univers
ity of
Mala
ya
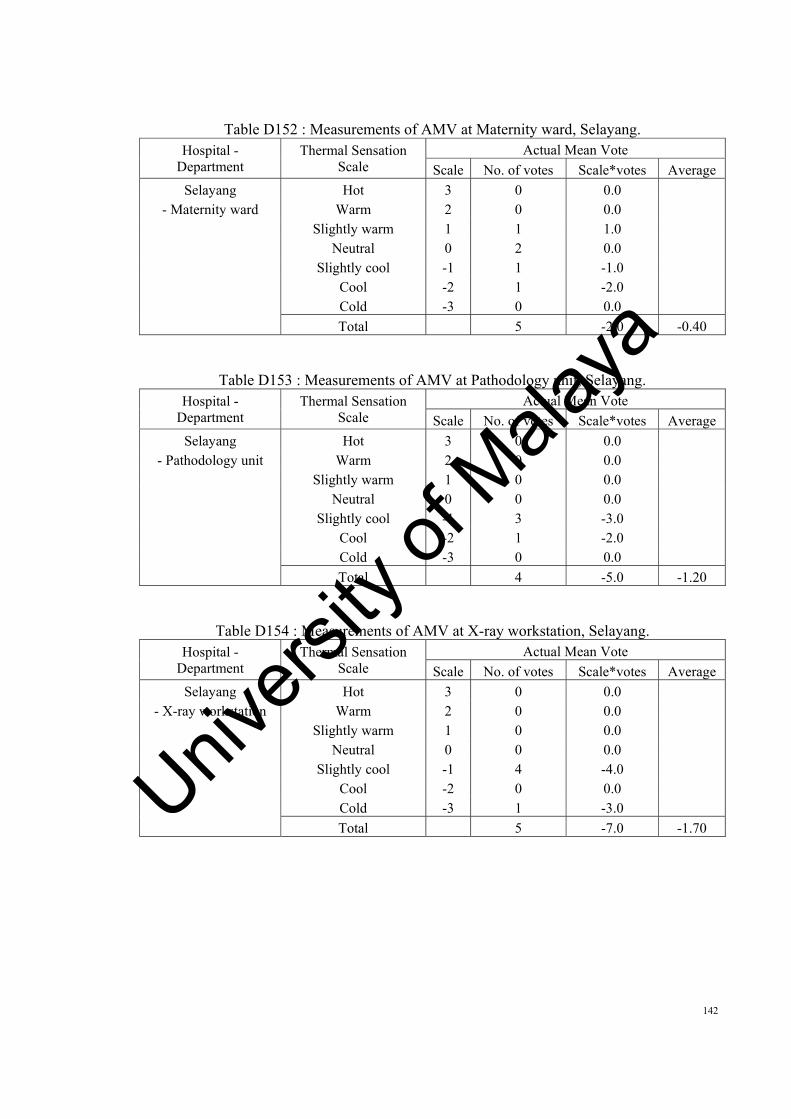
142
Table D152 : Measurements of AMV at Maternity ward, Selayang. Hospital -
Department Thermal Sensation
Scale Actual Mean Vote
Scale No. of votes Scale*votes Average
Selayang Hot 3 0 0.0 - Maternity ward Warm 2 0 0.0
Slightly warm 1 1 1.0 Neutral 0 2 0.0 Slightly cool -1 1 -1.0 Cool -2 1 -2.0 Cold -3 0 0.0
Total 5 -2.0 -0.40
Table D153 : Measurements of AMV at Pathodology unit, Selayang. Hospital -
Department Thermal Sensation
Scale Actual Mean Vote
Scale No. of votes Scale*votes Average
Selayang Hot 3 0 0.0 - Pathodology unit Warm 2 0 0.0
Slightly warm 1 0 0.0 Neutral 0 0 0.0 Slightly cool -1 3 -3.0 Cool -2 1 -2.0 Cold -3 0 0.0
Total 4 -5.0 -1.20
Table D154 : Measurements of AMV at X-ray workstation, Selayang. Hospital -
Department Thermal Sensation
Scale Actual Mean Vote
Scale No. of votes Scale*votes Average
Selayang Hot 3 0 0.0 - X-ray workstation Warm 2 0 0.0
Slightly warm 1 0 0.0 Neutral 0 0 0.0 Slightly cool -1 4 -4.0 Cool -2 0 0.0 Cold -3 1 -3.0
Total 5 -7.0 -1.70
Univers
ity of
Mala
ya

143
Table D155 : Measurements of air temperature at PAC, Klang.
Hospital - Department Sampling Point
Tair (oC)
0.1 m 0.6 m 1.1 m 1.7 m Average
Klang 1 24.3 24.7 24.5 24.6 24.5- Picture Archiving 2 24.4 24.6 24.7 25.1 24.7
Communication 3 23.8 23.6 23.9 23.6 23.7 4 24.7 24.3 24.3 24.1 24.3 5 24.4 24.4 24.5 24.6 24.5 6 24.6 24.7 24.7 24.6 24.7 7 24.3 24.2 23.9 24.1 24.1 Total average 24.4
Table D156 : Measurements of air temperature at Pathology, Klang.
Hospital - Department Sampling Point
Tair (oC)
0.1 m 0.6 m 1.1 m 1.7 m Average
Klang 1 23.3 23.5 23.6 23.7 23.5- Pathology 2 23.0 23.1 23.1 23.2 23.1
3 22.9 23.0 23.0 23.2 23.0 4 23.0 22.8 22.6 22.8 22.8 5 23.4 23.4 23.4 23.4 23.4 6 22.8 23.1 23.0 22.8 22.9 7 22.6 22.9 23.0 23.1 22.9
Total average 23.1
Table D157 : Measurements of air temperature at X-ray & radiography, Klang.
Hospital - Department Sampling Point
Tair (oC)
0.1 m 0.6 m 1.1 m 1.7 m Average
Klang 1 25.1 25.5 25.4 25.4 25.3- X-ray & radiography 2 24.4 24.6 24.7 25.1 24.7
3 25.4 25.2 25.5 25.1 25.3 4 26.7 26.3 26.3 26.0 26.3 5 25.3 25.4 25.4 25.6 25.4 6 25.2 25.3 25.3 25.3 25.3 7 25.2 25.1 24.9 25.0 25.1 8 24.4 24.7 24.6 24.6 24.6 Total average 25.2
Univers
ity of
Mala
ya

144
Table D158 : Measurements of air temperature at Cytology laboratory, Klang.
Hospital - Department
Sampling Point
Tair (oC)
0.1 m 0.6 m 1.1 m 1.7 m Average
Klang 1 19.7 19.8 19.9 19.9 19.8- Cytology laboratory 2 20.8 20.9 20.9 21.0 20.9
3 20.6 20.7 20.7 20.8 20.7 4 21.4 21.2 21.0 21.2 21.2 5 20.9 20.9 20.9 21.0 20.9 6 21.1 21.4 21.3 21.1 21.2 7 21.0 21.2 21.3 21.4 21.2 8 20.8 20.9 20.9 21.0 20.9 Total average 20.9
Table D159 : Measurements of air temperature at Endoscopy, Klang.
Hospital - Department
Sampling Point
Tair (oC)
0.1 m 0.6 m 1.1 m 1.7 m Average
Klang 1 20.4 20.1 20.2 19.9 20.2- Endoscopy 2 19.9 19.9 19.8 19.7 19.8
3 20.2 20.3 20.3 20.4 20.3 4 20.4 20.5 20.5 20.5 20.5 5 20.2 20.2 20.3 20.4 20.3 6 20.2 20.1 20.1 20.1 20.1 7 22.2 22.3 22.4 22.5 22.4 8 22.2 22.2 22.2 22.3 22.2 Total average 20.7
Table D160 : Measurements of air temperature at Medical day care, Klang.
Hospital - Department
Sampling Point
Tair (oC)
0.1 m 0.6 m 1.1 m 1.7 m Average
Klang 1 19.8 19.7 19.7 19.7 19.7- Medical day care 2 23.2 23.1 23.2 23.2 23.2
3 21.2 21.4 21.5 21.7 21.5 4 22.0 22.0 22.1 22.1 22.1 5 22.5 22.5 22.6 22.7 22.6 6 23.0 22.9 23.0 23.0 23.0 7 23.1 23.1 23.2 23.2 23.2 8 23.3 23.3 23.4 23.4 23.4 9 23.3 23.3 23.3 23.4 23.3 10 19.6 19.8 19.8 20.1 19.8 Total average 22.2
Univers
ity of
Mala
ya

145
Table D161 : Measurements of globe temperature at PAC, Klang.
Hospital - Department Sampling Point
Tglobe (oC)
0.1 m 0.6 m 1.1 m 1.7 m Average
Klang 1 23.9 24.4 24.5 24.5 24.3- Picture Archiving 2 23.9 24.2 24.5 25.0 24.4
Communication 3 22.8 22.8 23.3 23.2 23.0 4 24.6 24.6 24.5 24.5 24.5 5 24.7 25.0 25.2 25.6 25.1 6 24.6 24.8 25.1 25.2 24.9 7 24.4 24.7 24.2 24.8 24.5 Total average 24.4
Table D162 : Measurements of globe temperature at Pathology, Klang.
Hospital - Department Sampling Point
Tglobe (oC)
0.1 m 0.6 m 1.1 m 1.7 m Average
Klang 1 23.1 23.5 23.8 24.0 23.6- Pathology 2 22.5 22.8 22.9 23.0 22.8
3 22.4 22.6 22.8 23.2 22.8 4 22.7 22.7 22.6 22.9 22.7 5 23.3 23.5 23.9 24.1 23.7 6 22.6 22.9 23.0 22.9 22.9 7 22.7 22.9 23.1 23.5 23.1 Total average 23.1
Table D163 : Measurements of globe temperature at X-ray & radiography, Klang.
Hospital - Department Sampling Point
Tglobe (oC)
0.1 m 0.6 m 1.1 m 1.7 m Average
Klang 1 25.0 25.6 25.7 25.7 25.5- X-ray & radiography 2 24.3 24.6 24.9 25.4 24.8
3 25.6 25.6 26.1 26.0 25.8 4 26.1 26.1 26.0 26.0 26.0 5 24.6 24.9 25.1 25.5 25.0 6 25.1 25.3 25.6 25.7 25.4 7 25.1 25.4 24.9 25.5 25.2 8 23.6 24.1 24.2 24.2 24.0 Total average 25.2
Univers
ity of
Mala
ya

146
Table D164 : Measurements of globe temperature at Cytology laboratory, Klang.
Hospital - Department
Sampling Point
Tglobe (oC)
0.1 m 0.6 m 1.1 m 1.7 m Average
Klang 1 19.3 19.7 19.7 19.7 19.6- Cytology laboratory 2 20.6 20.9 21.2 21.6 21.1
3 21.0 21.0 21.3 21.2 21.1 4 21.0 21.0 20.9 20.9 20.9 5 20.2 20.4 20.6 20.9 20.5 6 20.8 21.0 21.3 21.4 21.1 7 21.5 21.8 21.3 21.9 21.6 8 20.9 21.4 21.5 21.5 21.3 Total average 20.9
Table D165 : Measurements of globe temperature at Endoscopy, Klang.
Hospital - Department
Sampling Point
Tglobe (oC)
0.1 m 0.6 m 1.1 m 1.7 m Average
Klang 1 19.7 20.2 20.3 20.3 20.1- Endoscopy 2 19.4 19.6 19.9 20.3 19.8
3 20.1 20.1 20.4 20.3 20.2 4 20.5 20.5 20.5 20.5 20.5 5 20.2 20.4 20.6 20.9 20.5 6 20.1 20.3 20.4 20.5 20.3 7 21.6 21.9 21.4 22.0 21.7 8 22.0 22.5 22.6 22.6 22.4 Total average 20.7
Table D166 : Measurements of globe temperature at Medical day care, Klang.
Hospital - Department
Sampling Point
Tglobe (oC)
0.1 m 0.6 m 1.1 m 1.7 m Average
Klang 1 19.2 19.5 19.8 19.9 19.6- Medical day care 2 23.0 23.3 23.4 23.5 23.3
3 20.9 21.1 21.3 21.7 21.3 4 22.2 22.2 22.1 22.4 22.2 5 22.1 22.3 22.7 22.9 22.5 6 22.5 22.7 22.7 22.7 22.7 7 23.1 23.3 23.5 23.9 23.5 8 23.7 23.7 23.6 23.9 23.7 9 23.3 23.5 23.9 24.1 23.7 10 19.4 19.7 19.8 19.7 19.7 Total average 22.2
Univers
ity of
Mala
ya

147
Table D167 : Measurements of air velocity at PAC, Klang.
Hospital - Department Sampling Point
V (m/s) 0.1 m 0.6 m 1.1 m 1.7 m Average
Klang 1 0.14 0.35 0.21 0.24 0.24- Picture Archiving 2 0.21 0.24 0.23 0.25 0.23
Communication 3 0.19 0.20 0.20 0.20 0.20 4 0.15 0.21 0.19 0.23 0.19 5 0.22 0.25 0.30 0.25 0.25 6 0.22 0.23 0.23 0.35 0.26 7 0.25 0.19 0.21 0.18 0.21 Total average 0.23
Table D168 : Measurements of air velocity at Pathology, Klang.
Hospital - Department Sampling Point
V (m/s) 0.1 m 0.6 m 1.1 m 1.7 m Average
Klang 1 0.20 0.40 0.25 0.28 0.28- Pathology 2 0.28 0.33 0.31 0.33 0.31
3 0.26 0.27 0.27 0.26 0.27 4 0.22 0.31 0.28 0.32 0.28 5 0.24 0.27 0.32 0.27 0.27 6 0.24 0.26 0.26 0.39 0.29 7 0.27 0.20 0.23 0.20 0.23 Total average 0.28
Table D169 : Measurements of air velocity at X-ray & radiography, Klang.
Hospital - Department Sampling Point
V (m/s) 0.1 m 0.6 m 1.1 m 1.7 m Average
Klang 1 0.18 0.14 0.17 0.12 0.15- X-ray & radiography 2 0.18 0.12 0.14 0.11 0.14
3 0.20 0.17 0.15 0.17 0.17 4 0.15 0.18 0.12 0.13 0.14 5 0.22 0.19 0.16 0.18 0.19 6 0.14 0.14 0.11 0.10 0.12 7 0.17 0.20 0.12 0.16 0.16 8 0.19 0.16 0.14 0.16 0.16 Total average 0.16
Univers
ity of
Mala
ya

148
Table D170 : Measurements of air velocity at Cytology laboratory, Klang. Hospital -
Department Sampling
Point V (m/s)
0.1 m 0.6 m 1.1 m 1.7 m Average
Klang 1 0.48 0.37 0.45 0.29 0.40- Cytology laboratory 2 0.61 0.42 0.49 0.42 0.49
3 0.53 0.46 0.40 0.46 0.46 4 0.55 0.68 0.45 0.50 0.54 5 0.57 0.49 0.44 0.45 0.49 6 0.56 0.56 0.43 0.38 0.48 7 0.58 0.64 0.42 0.54 0.54 8 0.60 0.53 0.46 0.53 0.53 Total average 0.49
Table D171 : Measurements of air velocity at Endoscopy, Klang. Hospital -
Department Sampling
Point V (m/s)
0.1 m 0.6 m 1.1 m 1.7 m Average
Klang 1 0.09 0.08 0.07 0.05 0.07- Endoscopy 2 0.04 0.03 0.04 0.05 0.04
3 0.05 0.04 0.03 0.04 0.04 4 0.05 0.04 0.04 0.03 0.04 5 0.07 0.05 0.06 0.06 0.06 6 0.04 0.04 0.03 0.03 0.04 7 0.07 0.05 0.06 0.06 0.06 8 0.04 0.04 0.03 0.03 0.04 Total average 0.05
Table D172 : Measurements of air velocity at Medical day care, Klang. Hospital -
Department Sampling
Point V (m/s)
0.1 m 0.6 m 1.1 m 1.7 m Average
Klang 1 0.05 0.05 0.04 0.03 0.04- Medical day care 2 0.04 0.03 0.04 0.05 0.04
3 0.10 0.10 0.08 0.09 0.09 4 0.06 0.06 0.05 0.04 0.05 5 0.06 0.04 0.05 0.05 0.05 6 0.07 0.06 0.05 0.06 0.06 7 0.10 0.07 0.09 0.10 0.09 8 0.05 0.04 0.03 0.04 0.04 9 0.05 0.04 0.03 0.04 0.04 10 0.09 0.09 0.08 0.06 0.08 Total average 0.06
Univers
ity of
Mala
ya

149
Table D173 : Measurements of relative humidity at PAC, Klang.
Hospital - Department Sampling Point
RH (%) 0.1 m 0.6 m 1.1 m 1.7 m Average
Klang 1 49.6 49.7 49.2 49.2 49.4- Picture Archiving 2 50.2 50.3 50.2 49.7 50.1
Communication 3 49.5 49.6 49.6 49.7 49.6 4 49.0 49.5 50.1 50.5 49.8 5 51.1 51.1 50.9 51.6 51.2 6 53.6 53.2 53.4 53.4 53.4 7 50.9 50.9 50.7 51.4 51.0 Total average 50.6
Table D174 : Measurements of relative humidity at Pathology, Klang.
Hospital - Department Sampling Point
RH (%) 0.1 m 0.6 m 1.1 m 1.7 m Average
Klang 1 42.8 42.9 42.5 42.5 42.7- Pathology 2 45.3 45.4 45.3 44.8 45.2
3 47.3 47.4 47.4 47.5 47.4 4 47.1 47.5 48.1 48.5 47.8 5 47.8 47.8 47.7 48.3 47.9 6 47.2 47.0 47.1 47.1 47.1 7 46.2 46.2 46.1 46.7 46.3 Total average 46.3
Table D175 : Measurements of relative humidity at X-ray & radiography, Klang.
Hospital - Department Sampling Point
RH (%) 0.1 m 0.6 m 1.1 m 1.7 m Average
Klang 1 70.3 69.4 69.6 69.0 69.6- X-ray & radiography 2 70.1 71.7 70.2 70.8 70.7
3 71.4 71.4 72.4 73.3 72.1 4 74.1 73.9 74.0 74.0 74.0 5 64.2 64.0 64.0 64.0 64.0 6 71.9 72.3 72.9 72.1 72.3 7 69.2 69.0 69.2 69.0 69.1 8 69.9 70.3 70.8 70.1 70.3 Total average 70.3
Univers
ity of
Mala
ya

150
Table D176 : Measurements of relative humidity at Cytology laboratory, Klang. Hospital -
Department Sampling
Point RH (%)
0.1 m 0.6 m 1.1 m 1.7 m Average
Klang 1 49.3 49.4 48.9 48.9 49.1- Cytology laboratory 2 48.2 48.3 48.2 47.7 48.1
3 48.4 48.5 48.5 48.6 48.5 4 45.9 46.3 46.9 47.3 46.6 5 47.8 47.8 47.7 48.3 47.9 6 47.1 46.9 47.0 47.0 47.0 7 47.6 47.6 47.5 48.1 47.7 8 47.8 47.5 47.6 47.7 47.7 Total average 47.8
Table D177 : Measurements of relative humidity at Endoscopy, Klang. Hospital -
Department Sampling
Point RH (%)
0.1 m 0.6 m 1.1 m 1.7 m Average
Klang 1 75.1 75.3 75.0 75.5 75.2- Endoscopy 2 76.2 76.6 76.5 76.8 76.5
3 75.0 74.7 74.7 74.2 74.7 4 74.9 74.5 74.6 74.5 74.6 5 74.8 74.6 74.7 74.8 74.7 6 76.0 76.0 76.1 76.1 76.1 7 73.3 73.2 72.9 72.3 72.9 8 72.8 72.8 73.3 73.0 73.0 Total average 74.7
Table D178 : Measurements of relative humidity at Medical day care, Klang. Hospital -
Department Sampling
Point RH (%)
0.1 m 0.6 m 1.1 m 1.7 m Average
Klang 1 76.9 77.4 77.7 77.6 77.4- Medical day care 2 68.5 68.6 68.7 68.7 68.6
3 74.0 73.8 73.6 73.0 73.6 4 72.0 72.0 71.8 71.8 71.9 5 71.0 70.9 70.7 70.3 70.7 6 69.5 69.5 69.5 69.5 69.5 7 68.7 68.7 68.7 68.7 68.7 8 68.0 68.2 68.3 68.1 68.2 9 68.0 67.9 67.9 67.8 67.9 10 76.7 76.5 76.3 76.2 76.4 Total average 71.3
Univers
ity of
Mala
ya

151
Table D179 : Measurements of metabolic rate at PAC, Klang. Hospital -
Department Activity Level Metabolic rate met No. of people met*people Average
Klang Seated quiet 1.0 0 0.0 - Picture Archiving Typing 1.1 0 0.0
Communication Standing relaxed 1.2 0 0.0 Filing (standing) 1.4 3 4.2 Walking about 1.7 0 0.0
Total 3 4.2 1.40
Table D180 : Measurements of metabolic rate at Pathology, Klang. Hospital -
Department Activity Level Metabolic rate met No. of people met*people Average
Klang Seated quiet 1.0 0 0 - Pathology Typing 1.1 0 0
Standing relaxed 1.2 0 0 Filing (standing) 1.4 2 2.8 Walking about 1.7 0 0
Total 2 2.8 1.40
Table D181 : Measurements of metabolic rate at X-ray & radiography, Klang.
Hospital - Department Activity Level Metabolic rate met No. of people met*people Average
Klang Seated quiet 1.0 0 0 - X-ray & radiography Typing 1.1 0 0
Standing relaxed 1.2 0 0 Filing (standing) 1.4 2 2.8 Walking about 1.7 1 1.7
Total 3 4.5 1.50
Table D182 : Measurements of metabolic rate at Cytology laboratory, Klang. Hospital -
Department Activity Level Metabolic rate met No. of people met*people Average
Klang Seated quiet 1.0 0 0 - Cytology laboratory Typing 1.1 0 0
Standing relaxed 1.2 0 0 Filing (standing) 1.4 2 2.8 Walking about 1.7 1 1.7
Total 3 4.5 1.50
Univers
ity of
Mala
ya

152
Table D183 : Measurements of metabolic rate at Endoscopy, Klang. Hospital -
Department Activity Level Metabolic rate met No. of people met*people Average
Klang Seated quiet 1.0 0 0 - Endoscopy Typing 1.1 0 0
Standing relaxed 1.2 0 0 Filing (standing) 1.4 2 2.8 Walking about 1.7 4 6.8
Total 6 9.6 1.60
Table D184 : Measurements of metabolic rate at Medical day care, Klang. Hospital -
Department Activity Level Metabolic rate met No. of people met*people Average
Klang Seated quiet 1.0 0 0 - Medical day care Typing 1.1 0 0
Standing relaxed 1.2 2 2.4 Filing (standing) 1.4 7 9.8 Walking about 1.7 0 0
Total 9 12.2 1.36
Table D185 : Measurements of clothing value at PAC, Klang. Hospital -
Department Clothing Insulation Clothing value clo No. of people clo*people Average
Klang Short-sleeve 0.19 3 0.57 - Picture Archiving Normal long-sleeve shirt 0.25 0 0.00
Communication Normal trousers 0.15 3 0.45 Socks 0.02 3 0.06 Shoes 0.02 3 0.06 Jacket 0.36 0 0.00
Total 3 1.14 0.38
Table D186 : Measurements of clothing value at Pathology, Klang. Hospital -
Department Clothing Insulation Clothing value clo No. of people clo*people Average
Klang Short-sleeve 0.19 0 0.00 - Pathology Normal long-sleeve shirt 0.25 2 0.50
Normal trousers 0.15 2 0.30 Socks 0.02 2 0.04 Shoes 0.02 2 0.04 Jacket 0.36 1 0.36
Total 2 1.24 0.62
Univers
ity of
Mala
ya

153
Table D187 : Measurements of clothing value at X-ray & radiography, Klang.
Hospital - Department Clothing Insulation Clothing value clo No. of people clo*people Average
Klang Short-sleeve 0.19 1 0.19 - X-ray & radiography Normal long-sleeve shirt 0.25 2 0.50
Normal trousers 0.15 3 0.45 Socks 0.02 3 0.06 Shoes 0.02 3 0.06 Jacket 0.36 1 0.36
Total 3 1.62 0.54
Table D188 : Measurements of clothing value at Cytology laboratory, Klang. Hospital -
Department Clothing Insulation Clothing value clo No. of people clo*people Average
Klang Short-sleeve 0.19 1 0.19 - Cytology laboratory Normal long-sleeve shirt 0.25 2 0.50
Normal trousers 0.15 3 0.45 Socks 0.02 3 0.06 Shoes 0.02 3 0.06 Jacket 0.36 0 0.00 Overall 0.49 2 0.98
Total 3 2.24 0.75
Table D189 : Measurements of clothing value at Endoscopy, Klang. Hospital -
Department Clothing Insulation Clothing value clo No. of people clo*people Average
Klang Short-sleeve 0.19 0 0.00 - Endoscopy Normal long-sleeve shirt 0.25 6 1.50
Normal trousers 0.15 6 0.90 Socks 0.02 0 0.00 Shoes 0.02 6 0.12 Jacket 0.36 0 0.00 Overall 0.49 0 0.00
Total 6 2.52 0.42
Univers
ity of
Mala
ya

154
Table D190 : Measurements of clothing value at Medical day care, Klang. Hospital -
Department Clothing Insulation Clothing value clo No. of people clo*people Average
Klang Short-sleeve 0.19 1 0.19 - Medical day care Normal long-sleeve shirt 0.25 8 2.00
Normal trousers 0.15 9 1.35 Socks 0.02 7 0.14 Shoes 0.02 9 0.18 Jacket 0.36 2 0.72 Full slip 0.16 0 0.00 Skirt 0.14 0 0.00 Overall 0.49 0 0.00
Total 9 4.58 0.51
Table D191 : Measurements of AMV at PAC, Klang. Hospital -
Department Thermal Sensation
Scale Actual Mean Vote
Scale No. of votes Scale*votes Average
Klang Hot 3 0 0.0 - Picture Archiving Warm 2 0 0.0
Communication Slightly warm 1 3 3.0 Neutral 0 0 0.0 Slightly cool -1 0 0.0 Cool -2 0 0.0 Cold -3 0 0.0
Total 3 3.0 1.00
Table D192 : Measurements of AMV at Pathology, Klang. Hospital -
Department Thermal Sensation
Scale Actual Mean Vote
Scale No. of votes Scale*votes Average
Klang Hot 3 0 0.0 - Pathology Warm 2 0 0.0
Slightly warm 1 0 0.0 Neutral 0 1 0.0 Slightly cool -1 0 0.0 Cool -2 1 -2.0 Cold -3 0 0.0
Total 2 -2.0 -1.00
Univers
ity of
Mala
ya

155
Table D193 : Measurements of AMV at X-ray & radiography, Klang.
Hospital - Department Thermal Sensation Scale
Actual Mean Vote Scale No. of votes Scale*votes Average
Klang Hot 3 0 0.0 - X-ray & radiography Warm 2 1 2.0
Slightly warm 1 0 0.0 Neutral 0 1 0.0 Slightly cool -1 1 -1.0 Cool -2 0 0.0 Cold -3 0 0.0
Total 3 1.0 0.33
Table D194 : Measurements of AMV at Cytology laboratory, Klang. Hospital -
Department Thermal Sensation
Scale Actual Mean Vote
Scale No. of votes Scale*votes Average
Klang Hot 3 0 0.0 - Cytology laboratory Warm 2 0 0.0
Slightly warm 1 1 1.0 Neutral 0 0 0.0 Slightly cool -1 0 0.0 Cool -2 0 0.0 Cold -3 2 -6.0
Total 3 -5.0 -1.67
Table D195 : Measurements of AMV at Endoscopy, Klang. Hospital -
Department Thermal Sensation
Scale Actual Mean Vote
Scale No. of votes Scale*votes Average
Klang Hot 3 0 0.0 - Endoscopy Warm 2 4.5 9.0
Slightly warm 1 0 0.0 Neutral 0 1.5 0.0 Slightly cool -1 0 0.0 Cool -2 0 0.0 Cold -3 0 0.0
Total 6 9.0 1.50
Univers
ity of
Mala
ya

156
Table D196 : Measurements of AMV at Medical day care, Klang. Hospital -
Department Thermal Sensation
Scale Actual Mean Vote
Scale No. of votes Scale*votes Average
Klang Hot 3 0 0.0 - Medical day care Warm 2 3 6.0
Slightly warm 1 1 1.0 Neutral 0 5 0.0 Slightly cool -1 0 0.0 Cool -2 0 0.0 Cold -3 0 0.0
Total 9 7.0 0.77
Table D197 : Measurements of air temperature at Clinic, Kajang.
Hospital - Department Sampling Point
Tair (oC)
0.1 m 0.6 m 1.1 m 1.7 m Average
Kajang 1 25.8 25.3 25.1 25.4 25.4- Clinic 2 25.8 25.5 25.5 25.4 25.5
3 25.4 25.3 25.3 25.3 25.3 4 25.4 25.3 25.3 25.2 25.3 5 25.2 25.6 25.5 25.3 25.4 6 25.3 25.4 25.6 25.7 25.5 Total average 25.4
Table D198 : Measurements of air temperature at Haemodialisis, Kajang.
Hospital - Department Sampling Point
Tair (oC)
0.1 m 0.6 m 1.1 m 1.7 m Average
Kajang 1 25.9 25.4 25.7 25.8 25.7- Haemodialisis 2 25.8 25.5 25.2 25.4 25.5
3 25.2 25.6 25.9 26.1 25.7 4 26.2 25.9 25.7 25.4 25.8 5 25.7 25.7 26.0 26.1 25.9 6 26.4 25.5 26.0 26.1 26.0 Total average 25.8
Table D199 : Measurements of air temperature at Pharmacy, Kajang.
Hospital - Department Sampling Point
Tair (oC)
0.1 m 0.6 m 1.1 m 1.7 m Average
Kajang 1 25.5 25.1 24.9 25.2 25.2- Pharmacy 2 25.5 25.3 25.3 25.2 25.3
3 25.3 25.1 25.1 25.1 25.2 4 25.3 25.2 25.2 25.1 25.2 5 24.9 25.3 25.2 25.0 25.1 6 25.0 25.1 25.2 25.4 25.2 Total average 25.2
Univers
ity of
Mala
ya

157
Table D200 : Measurements of air temperature at X-ray & radiography, Kajang.
Hospital - Department Sampling Point
Tair (oC)
0.1 m 0.6 m 1.1 m 1.7 m Average
Kajang 1 23.4 23.0 23.2 23.3 23.2
- X-ray & radiography 2 23.1 22.9 22.6 22.8 22.9
3 22.8 23.2 23.5 23.7 23.3
4 24.0 23.8 23.5 23.2 23.6
5 23.5 23.5 23.8 23.9 23.7
6 23.8 23.0 23.5 23.6 23.5 Total average 23.4
Table D201 : Measurements of globe temperature at Clinic, Kajang.
Hospital - Department Sampling Point
Tglobe (oC)
0.1 m 0.6 m 1.1 m 1.7 m Average
Kajang 1 25.8 24.9 25.3 25.3 25.3- Clinic 2 25.3 25.7 25.4 25.7 25.5
3 25.1 25.0 25.5 25.5 25.2 4 25.6 25.6 25.1 25.4 25.4 5 25.1 25.1 25.6 26.0 25.5 6 25.1 25.1 25.6 25.9 25.4 Total average 25.4
Table D202 : Measurements of globe temperature at Haemodialisis, Kajang.
Hospital - Department Sampling Point
Tglobe (oC)
0.1 m 0.6 m 1.1 m 1.7 m Average
Kajang 1 25.1 25.7 25.8 25.8 25.6- Haemodialisis 2 24.8 25.1 25.4 26.0 25.3
3 25.4 25.4 25.9 25.8 25.6 4 25.9 25.9 25.8 25.8 25.8 5 25.7 26.0 26.2 26.6 26.1 6 25.9 26.1 26.4 26.4 26.2 Total average 25.8
Table D203 : Measurements of globe temperature at Pharmacy, Kajang.
Hospital - Department Sampling Point
Tglobe (oC)
0.1 m 0.6 m 1.1 m 1.7 m Average
Kajang 1 25.1 24.2 24.6 24.6 24.6- Pharmacy 2 24.7 25.1 24.9 25.1 25.0
3 25.8 25.6 26.2 26.2 25.9 4 25.3 25.3 24.8 25.2 25.1 5 24.7 24.7 25.2 25.6 25.1 6 25.0 25.0 25.5 25.8 25.3 Total average 25.2
Univers
ity of
Mala
ya

158
Table D204 : Measurements of globe temperature at X-ray & radiography, Kajang.
Hospital - Department Sampling Point
Tglobe (oC)
0.1 m 0.6 m 1.1 m 1.7 m Average
Kajang 1 22.0 22.6 22.7 22.7 22.5- X-ray & radiography 2 22.4 22.7 23.0 23.5 22.9
3 23.4 23.4 23.8 23.7 23.6 4 24.0 24.0 23.9 23.9 23.9 5 23.6 23.8 24.0 24.2 23.9 6 23.4 23.6 23.9 24.0 23.7 Total average 23.4
Table D205 : Measurements of air velocity at Clinic, Kajang.
Hospital - Department Sampling Point
V (m/s) 0.1 m 0.6 m 1.1 m 1.7 m Average
Kajang 1 0.06 0.26 0.17 0.19 0.17- Clinic 2 0.21 0.14 0.11 0.13 0.15
3 0.05 0.11 0.22 0.20 0.15 4 0.13 0.18 0.16 0.26 0.18 5 0.14 0.17 0.18 0.16 0.16 6 0.14 0.14 0.19 0.29 0.19 Total average 0.17
Table D206 : Measurements of air velocity at Haemodialisis, Kajang.
Hospital - Department Sampling Point
V (m/s) 0.1 m 0.6 m 1.1 m 1.7 m Average
Kajang 1 0.09 0.23 0.14 0.16 0.16- Haemodialisis 2 0.21 0.14 0.11 0.13 0.15
3 0.08 0.15 0.29 0.27 0.19 4 0.12 0.16 0.15 0.23 0.16 5 0.16 0.17 0.18 0.18 0.17 6 0.12 0.13 0.13 0.20 0.15 Total average 0.16
Table D207 : Measurements of air velocity at Pharmacy, Kajang.
Hospital - Department Sampling Point
V (m/s) 0.1 m 0.6 m 1.1 m 1.7 m Average
Kajang 1 0.06 0.24 0.15 0.17 0.15- Pharmacy 2 0.23 0.15 0.11 0.14 0.16
3 0.07 0.13 0.26 0.25 0.18 4 0.12 0.17 0.15 0.25 0.17 5 0.16 0.19 0.20 0.18 0.18 6 0.14 0.14 0.20 0.30 0.20 Total average 0.17
Univers
ity of
Mala
ya

159
Table D208 : Measurements of air velocity at X-ray & radiography, Kajang.
Hospital - Department Sampling Point
V (m/s) 0.1 m 0.6 m 1.1 m 1.7 m Average
Kajang 1 0.15 0.33 0.20 0.23 0.23- X-ray & radiography 2 0.30 0.20 0.15 0.18 0.21
3 0.10 0.19 0.34 0.34 0.24 4 0.16 0.23 0.20 0.33 0.23 5 0.19 0.20 0.21 0.21 0.20 6 0.13 0.15 0.15 0.23 0.17 Total average 0.21
Table D209 : Measurements of relative humidity at Clinic, Kajang.
Hospital - Department Sampling Point
RH (%) 0.1 m 0.6 m 1.1 m 1.7 m Average
Kajang 1 49.2 55.2 55.0 55.1 53.6- Clinic 2 51.7 51.5 52.4 53.7 52.3
3 50.9 51.3 50.7 50.6 50.9 4 50.8 51.8 52.5 52.5 51.9 5 53.8 53.5 53.4 53.3 53.5 6 53.0 52.2 52.6 51.8 52.4 Total average 52.4
Table D210 : Measurements of relative humidity at Haemodialisis, Kajang.
Hospital - Department Sampling Point
RH (%) 0.1 m 0.6 m 1.1 m 1.7 m Average
Kajang 1 58.8 58.1 58.2 57.7 58.2- Haemodialisis 2 58.5 59.8 58.5 59.0 58.9
3 58.8 58.8 59.6 60.4 59.4 4 60.4 60.3 60.3 60.3 60.3 5 59.7 59.4 59.5 59.4 59.5 6 58.6 59.0 59.4 58.8 58.9 Total average 59.2
Table D211 : Measurements of relative humidity at Pharmacy, Kajang.
Hospital - Department Sampling Point
RH (%) 0.1 m 0.6 m 1.1 m 1.7 m Average
Kajang 1 52.9 59.4 59.2 59.2 57.7- Pharmacy 2 56.3 56.1 57.1 58.5 57.0
3 57.6 58.1 57.4 57.3 57.6 4 57.1 58.1 58.9 58.9 58.3 5 57.6 57.3 57.2 57.1 57.3 6 59.7 58.8 59.2 58.3 59.0 Total average 57.8
Univers
ity of
Mala
ya

160
Table D212 : Measurements of relative humidity at X-ray & radiography, Kajang.
Hospital - Department Sampling Point
RH (%) 0.1 m 0.6 m 1.1 m 1.7 m Average
Kajang 1 50.3 49.7 49.8 49.4 49.8- X-ray & radiography 2 50.8 51.9 50.8 51.2 51.2
3 52.4 52.4 53.1 53.8 52.9 4 53.5 53.4 53.4 53.5 53.5 5 54.4 54.2 54.2 54.2 54.2 6 57.2 57.5 57.9 57.4 57.5 Total average 53.2
Table D213 : Measurements of metabolic rate at Clinic, Kajang. Hospital -
Department Activity Level Metabolic rate met No. of people met*people Average
Kajang Seated quiet 1.0 2 2.0 - Clinic Typing 1.1 0 0.0
Standing relaxed 1.2 0 0.0 Filing (standing) 1.4 1 1.4 Walking about 1.7 0 0.0
Total 3 3.4 1.13
Table D214 : Measurements of metabolic rate at Haemodialisis, Kajang. Hospital -
Department Activity Level Metabolic rate met No. of people met*people Average
Kajang Seated quiet 1.0 0 0.0 - Haemodialisis Typing 1.1 0 0.0
Standing relaxed 1.2 0 0.0 Filing (standing) 1.4 3 4.2 Walking about 1.7 0 0.0
Total 3 4.2 1.40
Table D215 : Measurements of metabolic rate at Pharmacy, Kajang. Hospital -
Department Activity Level Metabolic rate met No. of people met*people Average
Kajang Seated quiet 1.0 0 0.0 - Pharmacy Typing 1.1 0 0.0
Standing relaxed 1.2 0 0.0 Filing (standing) 1.4 1 1.4 Walking about 1.7 1 1.7
Total 2 3.1 1.55
Univers
ity of
Mala
ya

161
Table D216 : Measurements of metabolic rate at X-ray & radiography, Kajang.
Hospital - Department Activity Level Metabolic rate met No. of people met*people Average
Kajang Seated quiet 1.0 0 0.0 - X-ray & radiography Typing 1.1 0 0.0
Standing relaxed 1.2 0 0.0 Filing (standing) 1.4 4 5.6 Walking about 1.7 0 0.0
Total 4 5.6 1.40
Table D217 : Measurements of clothing value at Clinic, Kajang. Hospital -
Department Clothing Insulation Clothing value clo No. of people clo*people Average
Kajang Short-sleeve 0.19 0 0.00 - Clinic Normal long-sleeve shirt 0.25 3 0.75
Normal trousers 0.15 3 0.45 Socks 0.02 3 0.06 Shoes 0.02 3 0.06 Jacket 0.36 0 0.00 Overall 0.49 0 0.00
Total 3 1.32 0.44
Table D218 : Measurements of clothing value at Haemodialisis, Kajang. Hospital -
Department Clothing Insulation Clothing value clo No. of people clo*people Average
Kajang Short-sleeve 0.19 0 0.00 - Haemodialisis Normal long-sleeve shirt 0.25 3 0.75
Normal trousers 0.15 3 0.45 Socks 0.02 3 0.06 Shoes 0.02 3 0.06 Jacket 0.36 0 0.00 Overall 0.49 1 0.49
Total 3 1.81 0.60
Table D219 : Measurements of clothing value at Pharmacy, Kajang. Hospital -
Department Clothing Insulation Clothing value clo No. of people clo*people Average
Kajang Short-sleeve 0.19 0 0.00 - Pharmacy Normal long-sleeve shirt 0.25 2 0.50
Normal trousers 0.15 2 0.30 Socks 0.02 2 0.04 Shoes 0.02 2 0.04 Jacket 0.36 0 0.00 Overall 0.49 0 0.00
Total 2 0.88 0.44
Univers
ity of
Mala
ya

162
Table D220 : Measurements of clothing value at X-ray & radiography, Kajang.
Hospital - Department Clothing Insulation Clothing value clo No. of people clo*people Average
Kajang Short-sleeve 0.19 2 0.38 - X-ray & radiography Normal long-sleeve shirt 0.25 2 0.50
Normal trousers 0.15 4 0.60 Socks 0.02 4 0.08 Shoes 0.02 4 0.08 Jacket 0.36 0 0.00 Overall 0.49 2 0.98
Total 4 2.62 0.66
Table D221 : Measurements of AMV at Clinic, Kajang. Hospital -
Department Thermal Sensation
Scale Actual Mean Vote
Scale No. of votes Scale*votes Average
Kajang Hot 3 0 0.0 - Clinic Warm 2 0 0.0
Slightly warm 1 0 0.0 Neutral 0 0 0.0 Slightly cool -1 2 -2.0 Cool -2 1 -2.0 Cold -3 0 0.0
Total 3 -4.0 -1.33
Table D222 : Measurements of AMV at Haemodialisis, Kajang. Hospital -
Department Thermal Sensation
Scale Actual Mean Vote
Scale No. of votes Scale*votes Average
Kajang Hot 3 0 0.0 - Haemodialisis Warm 2 0 0.0
Slightly warm 1 0 0.0 Neutral 0 3 0.0 Slightly cool -1 0 0.0 Cool -2 0 0.0 Cold -3 0 0.0
Total 3 0.0 0.00
Univers
ity of
Mala
ya

163
Table D223 : Measurements of AMV at Pharmacy, Kajang. Hospital -
Department Thermal Sensation
Scale Actual Mean Vote
Scale No. of votes Scale*votes Average
Kajang Hot 3 0 0.0 - Pharmacy Warm 2 0 0.0
Slightly warm 1 2 2.0 Neutral 0 0 0.0 Slightly cool -1 0 0.0 Cool -2 0 0.0 Cold -3 0 0.0
Total 2 2.0 1.00
Table D224 : Measurements of AMV at X-ray & radiography, Kajang.
Hospital - Department Thermal Sensation Scale
Actual Mean Vote Scale No. of votes Scale*votes Average
Kajang Hot 3 0 0.0 - X-ray & radiography Warm 2 0 0.0
Slightly warm 1 0 0.0 Neutral 0 0 0.0 Slightly cool -1 3 -3.0 Cool -2 1 -2.0 Cold -3 0 0.0
Total 4 -5.0 -1.25
Table D225 : Measurements of air temperature at A & E ward, Private hospital.
Hospital - Department Sampling Point
Tair (oC)
0.1 m 0.6 m 1.1 m 1.7 m Average
Private 1 20.7 20.5 20.5 20.4 20.5- Accident & 2 21.2 21.3 21.6 22.2 21.6
Emergency ward 3 22.1 21.6 20.7 21.1 21.4 4 24.0 23.8 23.9 23.9 23.9 5 20.4 20.4 20.1 20.4 20.3 6 22.6 22.7 22.8 23.0 22.8 7 21.5 21.6 22.0 22.0 21.8 Total average 21.7
Univers
ity of
Mala
ya

164
Table D226 : Measurements of air temperature at Labor ward, Private hospital.
Hospital - Department
Sampling Point
Tair (oC)
0.1 m 0.6 m 1.1 m 1.7 m Average
Private 1 24.8 24.7 24.0 24.1 24.4- Labor ward 2 21.1 21.1 20.9 20.8 20.9
3 21.1 21.2 21.4 21.0 21.1 4 20.0 20.1 21.5 20.4 20.5 5 23.2 23.3 23.5 23.7 23.4 6 22.9 22.8 23.7 22.5 23.0 7 23.5 23.4 22.8 22.9 23.2 Total average 22.4
Table D227 : Measurements of air temperature at Delivery Suite, Private hospital.
Hospital - Department
Sampling Point
Tair (oC)
0.1 m 0.6 m 1.1 m 1.7 m Average
Private 1 20.7 20.6 20.1 20.2 20.4- Delivery Suite 2 22.4 22.4 22.2 22.1 22.3
3 21.2 21.3 21.5 21.1 21.3 4 22.3 22.4 24.0 22.7 22.9 5 21.6 21.7 21.9 22.1 21.8 6 21.8 21.7 22.5 21.4 21.9 7 22.6 22.5 22.0 22.0 22.3 Total average 21.8
Table D228 : Measurements of air temperature at Intensive Care Unit, Private hospital.
Hospital - Department
Sampling Point
Tair (oC)
0.1 m 0.6 m 1.1 m 1.7 m Average
Private 1 22.7 22.5 22.5 22.4 22.5- Intensive Care Unit 2 22.5 22.6 22.9 23.6 22.9
3 23.2 22.5 21.5 21.9 22.3 4 23.8 23.6 23.7 23.8 23.7 5 21.7 21.7 21.4 21.7 21.6 6 22.7 22.8 22.9 23.1 22.9 7 22.8 22.9 23.3 23.3 23.1 Total average 22.7
Univers
ity of
Mala
ya

165
Table D229 : Measurements of globe temperature at A & E ward, Private hospital.
Hospital - Department
Sampling Point
Tglobe (oC)
0.1 m 0.6 m 1.1 m 1.7 m Average
Private 1 20.0 20.5 20.5 20.5 20.4- Accident & 2 21.3 21.6 21.9 22.4 21.8
Emergency ward 3 21.5 21.5 21.8 21.7 21.6 4 24.3 24.2 24.2 24.2 24.2 5 18.7 18.9 19.1 19.4 19.0 6 22.8 23.0 23.2 23.4 23.1 7 22.0 22.2 21.8 22.2 22.1 Total average 21.7
Table D230 : Measurements of globe temperature at Labor ward, Private hospital.
Hospital - Department
Sampling Point
Tglobe (oC)
0.1 m 0.6 m 1.1 m 1.7 m Average
Private 1 24.4 24.6 24.3 24.3 24.4- Labor ward 2 20.4 20.8 21.2 21.2 20.9
3 21.1 21.2 21.1 21.1 21.1 4 20.3 20.5 20.7 20.7 20.5 5 23.3 23.4 23.6 23.8 23.5 6 22.9 23.1 23.2 23.3 23.1 7 23.1 23.3 23.5 23.5 23.3 Total average 22.4
Table D231 : Measurements of globe temperature at Delivery Suite, Private hospital.
Hospital - Department
Sampling Point
Tglobe (oC)
0.1 m 0.6 m 1.1 m 1.7 m Average
Private 1 20.8 21.0 20.7 20.7 20.8- Delivery Suite 2 22.1 22.5 22.9 22.9 22.6
3 21.4 21.5 21.4 21.4 21.4 4 22.5 22.7 22.9 22.9 22.7 5 21.3 21.4 21.6 21.7 21.5 6 21.1 21.3 21.4 21.5 21.3 7 22.2 22.4 22.6 22.6 22.4 Total average 21.8
Univers
ity of
Mala
ya

166
Table D232 : Measurements of globe temperature at Intensive Care Unit, Private hospital.
Hospital - Department
Sampling Point
Tglobe (oC)
0.1 m 0.6 m 1.1 m 1.7 m Average
Private 1 22.0 22.5 22.6 22.6 22.4- Intensive Care Unit 2 22.3 22.6 22.9 23.4 22.8
3 22.2 22.2 22.5 22.4 22.3 4 23.9 23.9 23.8 23.8 23.8 5 21.4 21.6 21.8 22.1 21.7 6 22.7 22.9 23.2 23.3 23.0 7 22.9 23.2 22.7 23.3 23.0 Total average 22.7
Table D233 : Measurements of air velocity at A & E ward, Private hospital. Hospital -
Department Sampling
Point V (m/s)
0.1 m 0.6 m 1.1 m 1.7 m Average
Private 1 0.68 0.60 0.50 0.36 0.53- Accident & 2 0.55 0.44 0.60 0.67 0.57
Emergency ward 3 0.58 0.57 0.46 0.53 0.53 4 0.64 0.64 0.59 0.41 0.57 5 0.60 0.44 0.54 0.57 0.54 6 0.70 0.63 0.50 0.55 0.59 7 0.70 0.52 0.63 0.67 0.63 Total average 0.57
Table D234 : Measurements of air velocity at Labor ward, Private hospital. Hospital -
Department Sampling
Point V (m/s)
0.1 m 0.6 m 1.1 m 1.7 m Average
Private 1 0.57 0.51 0.42 0.31 0.45- Labor ward 2 0.41 0.32 0.44 0.49 0.42
3 0.44 0.43 0.35 0.40 0.40 4 0.52 0.50 0.47 0.32 0.45 5 0.46 0.34 0.41 0.43 0.41 6 0.58 0.52 0.42 0.45 0.49 7 0.54 0.40 0.48 0.51 0.48 Total average 0.44
Univers
ity of
Mala
ya

167
Table D235 : Measurements of air velocity at Delivery Suite, Private hospital. Hospital -
Department Sampling
Point V (m/s)
0.1 m 0.6 m 1.1 m 1.7 m Average
Private 1 0.68 0.62 0.52 0.38 0.55- Delivery Suite 2 0.49 0.39 0.54 0.60 0.51
3 0.64 0.63 0.51 0.59 0.59 4 0.57 0.56 0.52 0.36 0.50 5 0.60 0.44 0.54 0.57 0.54 6 0.63 0.56 0.45 0.49 0.53 7 0.58 0.43 0.52 0.55 0.52 Total average 0.53
Table D236 : Measurements of air velocity at Intensive Care Unit, Private hospital. Hospital -
Department Sampling
Point V (m/s)
0.1 m 0.6 m 1.1 m 1.7 m Average
Private 1 0.48 0.37 0.45 0.29 0.40- Intensive Care Unit 2 0.51 0.34 0.41 0.37 0.41
3 0.46 0.40 0.35 0.40 0.40 4 0.43 0.52 0.35 0.39 0.42 5 0.50 0.43 0.38 0.40 0.43 6 0.46 0.46 0.36 0.32 0.40 7 0.43 0.46 0.31 0.40 0.40 Total average 0.41
Table D237 : Measurements of relative humidity at A & E ward, Private hospital. Hospital -
Department Sampling
Point RH (%)
0.1 m 0.6 m 1.1 m 1.7 m Average
Private 1 62.4 62.6 62.0 62.0 62.2- Accident & 2 60.4 60.6 60.5 59.9 60.3
Emergency ward 3 61.1 61.2 61.2 61.3 61.2 4 61.4 62.0 62.8 63.3 62.4 5 62.3 62.3 62.1 62.9 62.4 6 59.8 59.4 59.5 59.6 59.6 7 62.0 62.0 61.8 62.6 62.1 Total average 61.5
Univers
ity of
Mala
ya

168
Table D238 : Measurements of relative humidity at Labor ward, Private hospital. Hospital -
Department Sampling
Point RH (%)
0.1 m 0.6 m 1.1 m 1.7 m Average
Private 1 58.8 58.8 59.1 59.8 59.1- Labor ward 2 76.3 75.5 73.2 72.1 74.3
3 72.1 72.1 73.5 74.4 73.0 4 65.8 65.3 64.9 64.8 65.2 5 65.9 65.9 65.7 65.6 65.8 6 66.2 66.0 66.2 66.2 66.1 7 67.5 67.0 66.6 66.5 66.9 Total average 67.2
Table D239 : Measurements of relative humidity at Delivery Suite, Private hospital.
Hospital - Department
Sampling Point
RH (%) 0.1 m 0.6 m 1.1 m 1.7 m Average
Private 1 65.3 65.2 65.6 66.3 65.6- Delivery Suite 2 66.4 65.8 63.8 62.8 64.7
3 63.7 63.7 65.0 65.8 64.5 4 63.5 63.0 62.6 62.6 62.9 5 67.3 67.3 67.0 66.9 67.1 6 65.4 65.1 65.5 65.4 65.3 7 66.8 66.3 65.9 65.8 66.2 Total average 65.2
Table D240 : Measurements of relative humidity at Intensive Care Unit, Private hospital.
Hospital - Department
Sampling Point
RH (%) 0.1 m 0.6 m 1.1 m 1.7 m Average
Private 1 71.9 72.0 71.4 71.4 71.7- Intensive Care Unit 2 73.4 73.6 73.4 72.7 73.3
3 73.3 73.5 73.5 73.6 73.5 4 70.3 71.0 71.9 72.5 71.4 5 70.3 70.3 70.0 71.0 70.4 6 73.1 72.7 72.8 73.0 72.9 7 76.5 76.5 76.2 77.2 76.6 Total average 72.8
Table D241 : Measurements of metabolic rate at A & E ward, Private hospital. Hospital -
Department Activity Level Metabolic rate met No. of people met*people Average
Private Seated quiet 1.0 0 0.0 - Accident & Typing 1.1 0 0.0
Emergency ward Standing relaxed 1.2 0 0.0 Filing (standing) 1.4 2 2.8 Walking about 1.7 0 0.0
Total 2 2.8 1.40
Univers
ity of
Mala
ya

169
Table D242 : Measurements of metabolic rate at Labor ward, Private hospital. Hospital -
Department Activity Level Metabolic rate met No. of people met*people Average
Private Seated quiet 1.0 0 0.0 - Labor ward Typing 1.1 0 0.0
Standing relaxed 1.2 0 0.0 Filing (standing) 1.4 0 0.0 Walking about 1.7 2 3.4
Total 2 3.4 1.70
Table D243 : Measurements of metabolic rate at Delivery Suite, Private hospital. Hospital -
Department Activity Level Metabolic rate met No. of people met*people Average
Private Seated quiet 1.0 0 0.0 - Delivery Suite Typing 1.1 0 0.0
Standing relaxed 1.2 0 0.0 Filing (standing) 1.4 0 0.0 Walking about 1.7 3 5.1
Total 3 5.1 1.70
Table D244 : Measurements of metabolic rate at Intensive Care Unit, Private hospital. Hospital -
Department Activity Level Metabolic rate met No. of people met*people Average
Private Seated quiet 1.0 0 0.0 - Intensive Care Unit Typing 1.1 0 0.0
Standing relaxed 1.2 0 0.0 Filing (standing) 1.4 4 5.6 Walking about 1.7 0 0.0
Total 4 5.6 1.40
Table D245 : Measurements of clothing value at A & E ward, Private hospital.
Hospital - Department Clothing Insulation Clothing value clo No. of people clo*people Average
Private Short-sleeve 0.19 1 0.19 - Accident & Normal long-sleeve shirt 0.25 1 0.25
Emergency ward Normal trousers 0.15 2 0.3 Socks 0.02 2 0.04 Shoes 0.02 2 0.04 Jacket 0.36 1 0.36 Overall 0.49 0 0.00
Total 2 1.18 0.59
Univers
ity of
Mala
ya

170
Table D246 : Measurements of clothing value at Labor ward, Private hospital. Hospital -
Department Clothing Insulation Clothing value clo No. of people clo*people Average
Private Short-sleeve 0.19 2 0.38 - Labor ward Normal long-sleeve shirt 0.25 0 0.00
Normal trousers 0.15 2 0.30 Socks 0.02 2 0.04 Shoes 0.02 2 0.04 Jacket 0.36 0 0.00 Overall 0.49 0 0.00
Total 2 0.76 0.38
Table D247 : Measurements of clothing value at Delivery Suite, Private hospital. Hospital -
Department Clothing Insulation Clothing value clo No. of people clo*people Average
Private Short-sleeve 0.19 3 0.57 - Delivery Suite Normal long-sleeve shirt 0.25 0 0.00
Normal trousers 0.15 3 0.45 Socks 0.02 3 0.06 Shoes 0.02 3 0.06 Jacket 0.36 0 0.00 Overall 0.49 0 0.00
Total 3 1.14 0.38
Table D248 : Measurements of clothing value at Intensive Care Unit, Private hospital. Hospital -
Department Clothing Insulation Clothing value clo No. of people clo*people Average
Private Short-sleeve 0.19 3 0.57 - Intensive Care Unit Normal long-sleeve shirt 0.25 1 0.25
Normal trousers 0.15 4 0.60 Socks 0.02 4 0.08 Shoes 0.02 4 0.08 Jacket 0.36 0 0.00 Overall 0.49 0 0.00
Total 4 1.58 0.40
Univers
ity of
Mala
ya
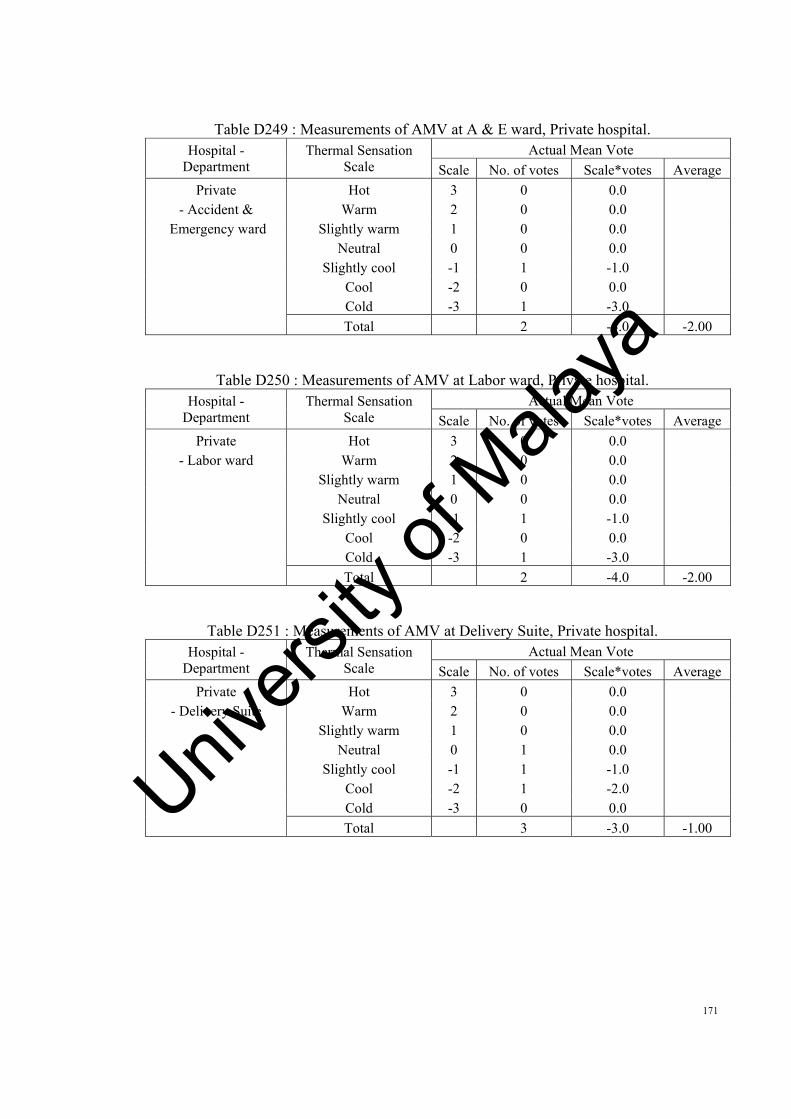
171
Table D249 : Measurements of AMV at A & E ward, Private hospital. Hospital -
Department Thermal Sensation
Scale Actual Mean Vote
Scale No. of votes Scale*votes Average
Private Hot 3 0 0.0 - Accident & Warm 2 0 0.0
Emergency ward Slightly warm 1 0 0.0 Neutral 0 0 0.0 Slightly cool -1 1 -1.0 Cool -2 0 0.0 Cold -3 1 -3.0
Total 2 -4.0 -2.00
Table D250 : Measurements of AMV at Labor ward, Private hospital. Hospital -
Department Thermal Sensation
Scale Actual Mean Vote
Scale No. of votes Scale*votes Average
Private Hot 3 0 0.0 - Labor ward Warm 2 0 0.0
Slightly warm 1 0 0.0 Neutral 0 0 0.0 Slightly cool -1 1 -1.0 Cool -2 0 0.0 Cold -3 1 -3.0
Total 2 -4.0 -2.00
Table D251 : Measurements of AMV at Delivery Suite, Private hospital. Hospital -
Department Thermal Sensation
Scale Actual Mean Vote
Scale No. of votes Scale*votes Average
Private Hot 3 0 0.0 - Delivery Suite Warm 2 0 0.0
Slightly warm 1 0 0.0 Neutral 0 1 0.0 Slightly cool -1 1 -1.0 Cool -2 1 -2.0 Cold -3 0 0.0
Total 3 -3.0 -1.00
Univers
ity of
Mala
ya

172
Table D252 : Measurements of AMV at Intensive Care Unit, Private hospital. Hospital -
Department Thermal Sensation
Scale Actual Mean Vote
Scale No. of votes Scale*votes Average
Private Hot 3 0 0.0 - Intensive Care Unit Warm 2 0 0.0
Slightly warm 1 0 0.0 Neutral 0 2 0.0 Slightly cool -1 1 -1.0 Cool -2 0 0.0 Cold -3 1 -3.0
Total 4 -4.0 -1.00
Table D253 : Measurements of air temperature at Hematologi lab, Kuala Kubu.
Hospital - Department
Sampling Point
Tair (oC)
0.1 m 0.6 m 1.1 m 1.7 m Average
Kuala Kubu 1 26.2 26.6 26.5 26.5 26.4- Hematologi lab 2 26.0 26.2 26.3 26.7 26.3
3 26.2 26.0 26.3 25.9 26.1 4 26.3 26.0 26.0 25.7 26.0 5 25.6 25.7 25.7 25.9 25.7 6 25.6 25.7 25.7 25.6 25.7 7 26.1 26.0 25.6 25.9 25.9 Total average 26.0
Table D254 : Measurements of air temperature at Pharmacy, Kuala Kubu.
Hospital - Department
Sampling Point
Tair (oC)
0.1 m 0.6 m 1.1 m 1.7 m Average
Kuala Kubu 1 26.4 25.3 25.5 25.5 25.7- Pharmacy 2 25.7 25.8 25.6 25.5 25.7
3 25.6 25.4 25.7 25.3 25.5 4 25.9 25.6 24.9 25.4 25.5 5 25.7 25.5 25.8 25.8 25.7 6 24.6 24.7 24.8 24.9 24.7 7 25.6 25.1 25.2 25.9 25.4 8 24.7 23.7 23.8 23.8 24.0 9 23.9 24.0 23.8 23.8 23.9 10 23.9 24.0 23.9 23.7 23.9 11 23.6 23.4 23.7 23.3 23.5 12 23.7 23.4 22.8 23.2 23.3 13 23.6 23.4 23.7 23.7 23.6 14 23.4 23.5 23.6 23.7 23.5 15 23.9 23.0 23.1 23.1 23.3 Total average 24.5
Univers
ity of
Mala
ya

173
Table D255 : Measurements of air temperature at X-Ray workstation, Kuala Kubu.
Hospital - Department
Sampling Point
Tair (oC)
0.1 m 0.6 m 1.1 m 1.7 m Average
Kuala Kubu 1 26.3 26.7 26.6 26.6 26.5- X-Ray workstation 2 26.9 27.1 27.2 27.7 27.2
3 26.9 26.7 27.0 26.6 26.8 4 27.9 27.6 27.6 27.3 27.6 5 27.3 27.3 27.4 27.6 27.4 6 27.6 27.7 27.7 27.6 27.7 7 27.1 27.0 26.6 26.9 26.9 8 26.9 27.3 27.2 27.2 27.1 9 26.6 27.0 26.9 26.9 26.8 10 26.5 26.7 26.8 27.3 26.8 11 26.9 26.7 27.0 26.6 26.8 12 26.5 26.2 26.2 25.9 26.2 13 27.0 27.0 27.1 27.3 27.1 14 25.9 26.0 26.0 25.9 26.0 15 27.4 27.3 26.9 27.2 27.2 Total average 26.9
Table D256 : Measurements of globe temperature at Hematologi lab, Kuala Kubu.
Hospital - Department
Sampling Point
Tglobe (oC)
0.1 m 0.6 m 1.1 m 1.7 m Average
Kuala Kubu 1 26.9 26.0 26.4 26.4 26.4- Hematologi lab 2 26.1 26.5 26.3 26.5 26.4
3 26.1 25.9 26.5 26.5 26.2 4 26.3 26.3 25.8 26.1 26.1 5 25.4 25.4 25.9 26.3 25.8 6 25.1 25.1 25.6 25.9 25.4 7 25.8 25.6 25.8 26.5 25.9 Total average 26.0
Univers
ity of
Mala
ya

174
Table D257 : Measurements of globe temperature at Pharmacy, Kuala Kubu.
Hospital - Department
Sampling Point
Tglobe (oC)
0.1 m 0.6 m 1.1 m 1.7 m Average
Kuala Kubu 1 26.2 25.3 25.7 25.7 25.7- Pharmacy 2 25.4 25.8 25.6 25.8 25.7
3 25.5 25.3 25.9 25.9 25.6 4 25.8 25.8 25.3 25.6 25.6 5 25.3 25.3 25.8 26.2 25.7 6 24.5 24.5 25.0 25.3 24.8 7 25.3 25.1 25.3 26.0 25.4 8 24.6 23.8 24.1 24.1 24.1 9 23.6 23.9 23.7 23.9 23.8 10 24.3 23.5 23.8 23.8 23.8 11 23.3 23.6 23.4 23.6 23.5 12 23.2 23.1 23.5 23.5 23.3 13 23.8 23.8 23.3 23.6 23.6 14 23.3 23.3 23.7 24.1 23.6 15 23.2 23.2 23.7 24.0 23.5 Total average 24.5
Table D258 : Measurements of globe temperature at X-Ray workstation, Kuala Kubu.
Hospital - Department
Sampling Point
Tglobe (oC)
0.1 m 0.6 m 1.1 m 1.7 m Average
Kuala Kubu 1 25.9 26.5 26.6 26.6 26.4- X-Ray workstation 2 26.6 27.0 27.3 27.8 27.2
3 26.6 26.6 27.1 27.0 26.8 4 27.6 27.6 27.5 27.5 27.5 5 27.0 27.3 27.6 27.5 27.4 6 27.4 27.6 27.9 27.8 27.7 7 26.9 27.2 26.7 27.1 27.0 8 26.6 27.2 27.3 27.3 27.1 9 26.4 27.0 27.1 27.1 26.9 10 26.3 26.7 27.0 27.6 26.9 11 26.7 26.7 27.2 27.1 26.9 12 26.0 26.0 25.9 25.9 25.9 13 26.8 27.1 27.3 27.7 27.2 14 25.7 25.9 26.2 26.1 26.0 15 27.2 27.5 27.0 27.3 27.3 Total average 26.9
Univers
ity of
Mala
ya

175
Table D259 : Measurements of air velocity at Hematologi lab, Kuala Kubu. Hospital -
Department Sampling
Point V (m/s)
0.1 m 0.6 m 1.1 m 1.7 m Average
Kuala Kubu 1 0.27 0.18 0.14 0.16 0.19- Hematologi lab 2 0.04 0.09 0.17 0.16 0.12
3 0.12 0.17 0.15 0.25 0.17 4 0.13 0.16 0.17 0.15 0.15 5 0.15 0.15 0.21 0.32 0.21 6 0.30 0.23 0.26 0.20 0.24 7 0.29 0.19 0.14 0.17 0.20 Total average 0.18
Table D260 : Measurements of air velocity at Pharmacy, Kuala Kubu. Hospital -
Department Sampling
Point V (m/s)
0.1 m 0.6 m 1.1 m 1.7 m Average
Kuala Kubu 1 0.23 0.15 0.11 0.14 0.16- Pharmacy 2 0.04 0.09 0.17 0.16 0.12
3 0.11 0.15 0.14 0.22 0.15 4 0.13 0.16 0.17 0.15 0.15 5 0.09 0.09 0.13 0.20 0.13 6 0.16 0.12 0.14 0.11 0.13 7 0.20 0.13 0.10 0.12 0.14 8 0.04 0.09 0.17 0.16 0.12 9 0.08 0.11 0.10 0.16 0.11 10 0.05 0.06 0.07 0.06 0.06 11 0.08 0.08 0.11 0.17 0.11 12 0.13 0.09 0.11 0.08 0.10 13 0.08 0.10 0.10 0.09 0.09 14 0.08 0.08 0.11 0.17 0.11 15 0.18 0.13 0.15 0.11 0.14 Total average 0.12
Univers
ity of
Mala
ya

176
Table D261 : Measurements of air velocity at X-Ray workstation, Kuala Kubu. Hospital -
Department Sampling
Point V (m/s)
0.1 m 0.6 m 1.1 m 1.7 m Average
Kuala Kubu 1 0.14 0.11 0.14 0.09 0.12- X-Ray workstation 2 0.09 0.06 0.07 0.05 0.07
3 0.20 0.17 0.15 0.17 0.17 4 0.06 0.08 0.05 0.06 0.06 5 0.09 0.08 0.06 0.07 0.08 6 0.14 0.13 0.10 0.09 0.11 7 0.11 0.12 0.08 0.10 0.10 8 0.08 0.07 0.08 0.05 0.07 9 0.11 0.08 0.09 0.07 0.09 10 0.08 0.06 0.05 0.06 0.06 11 0.05 0.07 0.04 0.05 0.05 12 0.09 0.08 0.06 0.07 0.08 13 0.08 0.07 0.05 0.05 0.06 14 0.05 0.06 0.04 0.05 0.05 15 0.10 0.11 0.07 0.09 0.09 Total average 0.08
Table D262 : Measurements of relative humidity at Hematologi lab, Kuala Kubu. Hospital -
Department Sampling
Point RH (%)
0.1 m 0.6 m 1.1 m 1.7 m Average
Kuala Kubu 1 48.8 54.8 54.5 54.6 53.2- Hematologi lab 2 52.2 52.0 52.9 54.2 52.8
3 53.9 54.3 53.7 53.6 53.9 4 52.9 53.9 54.6 54.6 54.0 5 54.9 54.6 54.5 54.4 54.6 6 56.0 55.2 55.6 54.7 55.4 7 51.2 54.8 54.9 57.9 54.7 Total average 54.1
Univers
ity of
Mala
ya

177
Table D263 : Measurements of relative humidity at Pharmacy, Kuala Kubu. Hospital -
Department Sampling
Point RH (%)
0.1 m 0.6 m 1.1 m 1.7 m Average
Kuala Kubu 1 50.6 56.9 56.6 56.7 55.2- Pharmacy 2 54.1 53.9 54.9 56.2 54.8
3 55.6 56.0 55.4 55.3 55.6 4 54.6 55.6 56.4 56.3 55.7 5 55.5 55.2 55.1 55.0 55.2 6 51.6 50.8 51.2 50.4 51.0 7 46.4 49.7 49.8 52.5 49.6 8 48.4 54.3 54.0 54.1 52.7 9 51.8 51.6 52.5 53.8 52.4 10 52.4 52.8 52.2 52.2 52.4 11 52.8 53.8 54.5 54.5 53.9 12 55.0 54.7 54.6 54.5 54.7 13 54.8 54.0 54.4 53.6 54.2 14 51.2 54.8 54.9 57.9 54.7 15 56.0 55.2 55.6 54.7 55.4 Total average 53.8
Table D264 : Measurements of relative humidity at X-Ray workstation, Kuala Kubu. Hospital -
Department Sampling
Point RH (%)
0.1 m 0.6 m 1.1 m 1.7 m Average
Kuala Kubu 1 56.8 56.1 56.2 55.7 56.2- X-Ray workstation 2 54.2 55.4 54.2 54.6 54.6
3 54.8 54.8 55.6 56.4 55.4 4 53.5 53.4 53.4 53.4 53.4 5 54.5 54.3 54.3 54.3 54.3 6 54.1 54.4 54.8 54.3 54.4 7 55.1 54.9 54.9 54.9 54.9 8 52.8 53.1 53.5 53.0 53.1 9 53.7 54.9 53.7 54.1 54.1 10 52.9 52.9 53.6 54.3 53.4 11 53.4 53.3 53.3 53.3 53.3 12 54.9 54.7 54.7 54.7 54.7 13 51.8 52.1 52.5 52.0 52.1 14 55.1 54.9 54.9 54.9 54.9 15 51.7 52.0 52.4 51.9 52.0 Total average 54.1
Univers
ity of
Mala
ya

178
Table D265 : Measurements of metabolic rate at Hematologi lab, Kuala Kubu. Hospital -
Department Activity Level Metabolic rate met No. of people met*people Average
Kuala Kubu Seated quiet 1.0 0 0.0 - Hematologi lab Typing 1.1 1 1.1
Standing relaxed 1.2 2 2.4 Filing (standing) 1.4 2 2.8 Walking about 1.7 0 0.0
Total 5 6.3 1.26
Table D266 : Measurements of metabolic rate at Pharmacy, Kuala Kubu. Hospital -
Department Activity Level Metabolic rate met No. of people met*people Average
Kuala Kubu Seated quiet 1.0 0 0.0 - Pharmacy Typing 1.1 5 5.5
Standing relaxed 1.2 7 8.4 Filing (standing) 1.4 1 1.4 Walking about 1.7 0 0.0
Total 13 15.3 1.18
Table D267 : Measurements of metabolic rate at X-Ray workstation, Kuala Kubu. Hospital -
Department Activity Level Metabolic rate met No. of people met*people Average
Kuala Kubu Seated quiet 1.0 0 0.0 - X-Ray workstation Typing 1.1 4 4.4
Standing relaxed 1.2 3 3.6 Filing (standing) 1.4 0 0.0 Walking about 1.7 0 0.0
Total 7 8 1.14
Table D268 : Measurements of clothing value at Hematologi lab, Kuala Kubu. Hospital -
Department Clothing Insulation Clothing value clo No. of people clo*people Average
Kuala Kubu Short-sleeve 0.19 0 0.00 - Hematologi lab Normal long-sleeve shirt 0.25 2 0.50
Normal trousers 0.15 5 0.75 Socks 0.02 1 0.02 Shoes 0.02 5 0.10 Jacket 0.36 3 1.08
Long-sleeved,thin
sweater/vest0.25 1 0.25
Total 5 2.70 0.54
Univers
ity of
Mala
ya
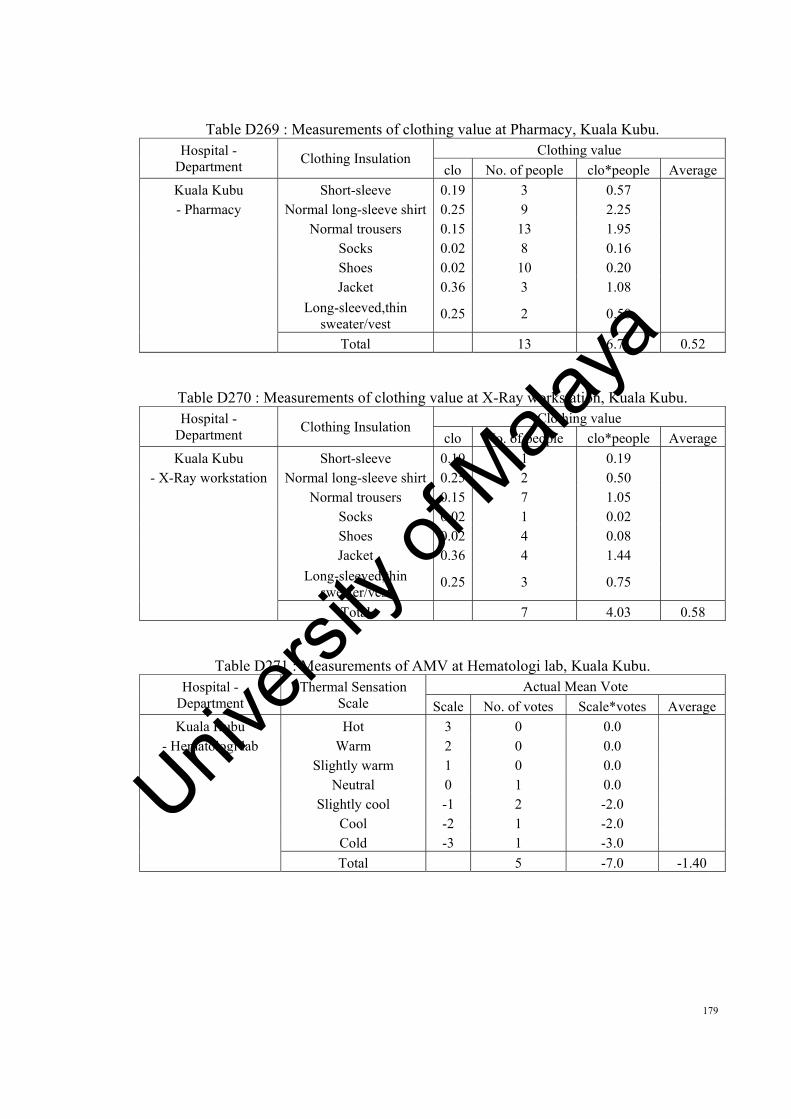
179
Table D269 : Measurements of clothing value at Pharmacy, Kuala Kubu. Hospital -
Department Clothing Insulation Clothing value clo No. of people clo*people Average
Kuala Kubu Short-sleeve 0.19 3 0.57 - Pharmacy Normal long-sleeve shirt 0.25 9 2.25
Normal trousers 0.15 13 1.95 Socks 0.02 8 0.16 Shoes 0.02 10 0.20 Jacket 0.36 3 1.08
Long-sleeved,thin
sweater/vest0.25 2 0.50
Total 13 6.71 0.52
Table D270 : Measurements of clothing value at X-Ray workstation, Kuala Kubu. Hospital -
Department Clothing Insulation Clothing value clo No. of people clo*people Average
Kuala Kubu Short-sleeve 0.19 1 0.19 - X-Ray workstation Normal long-sleeve shirt 0.25 2 0.50
Normal trousers 0.15 7 1.05 Socks 0.02 1 0.02 Shoes 0.02 4 0.08 Jacket 0.36 4 1.44
Long-sleeved,thin
sweater/vest0.25 3 0.75
Total 7 4.03 0.58
Table D271 : Measurements of AMV at Hematologi lab, Kuala Kubu. Hospital -
Department Thermal Sensation
Scale Actual Mean Vote
Scale No. of votes Scale*votes Average
Kuala Kubu Hot 3 0 0.0 - Hematologi lab Warm 2 0 0.0
Slightly warm 1 0 0.0 Neutral 0 1 0.0 Slightly cool -1 2 -2.0 Cool -2 1 -2.0 Cold -3 1 -3.0
Total 5 -7.0 -1.40
Univers
ity of
Mala
ya

180
Table D272 : Measurements of AMV at Pharmacy, Kuala Kubu. Hospital -
Department Thermal Sensation
Scale Actual Mean Vote
Scale No. of votes Scale*votes Average
Kuala Kubu Hot 3 0 0.0 - Pharmacy Warm 2 2 4.0
Slightly warm 1 2 2.0 Neutral 0 4 0.0 Slightly cool -1 5 -5.0 Cool -2 0 0.0 Cold -3 0 0.0
Total 13 1.0 0.08
Table D273 : Measurements of AMV at X-Ray workstation, Kuala Kubu. Hospital -
Department Thermal Sensation
Scale Actual Mean Vote
Scale No. of votes Scale*votes Average
Kuala Kubu Hot 3 0 0.0 - X-Ray workstation Warm 2 0 0.0
Slightly warm 1 7 7.0 Neutral 0 0 0.0 Slightly cool -1 0 0.0 Cool -2 0 0.0 Cold -3 0 0.0
Total 7 7.0 1.00
Table D274 : Measurements of air temperature at Pathology Unit, Banting.
Hospital - Department
Sampling Point
Tair (oC)
0.1 m 0.6 m 1.1 m 1.7 m Average
Banting 1 23.6 23.9 24.0 24.1 23.9- Pathology Unit 2 23.9 24.0 24.0 24.1 24.0
3 23.9 24.0 24.0 24.2 24.0 4 24.1 23.9 23.7 23.9 23.9 5 24.0 24.0 24.0 24.1 24.0 6 22.9 23.2 23.1 22.9 23.0 7 22.4 22.7 22.8 22.9 22.7 8 23.0 23.1 23.1 23.2 23.1 9 22.0 22.3 22.4 22.5 22.3 10 22.4 22.5 22.5 22.6 22.5 11 22.3 22.4 22.4 22.6 22.4 12 22.2 22.0 21.8 22.0 22.0 13 22.3 22.3 22.3 22.4 22.3 14 21.7 22.0 21.9 21.7 21.8 15 21.4 21.7 21.8 21.9 21.7 16 21.8 21.9 21.9 22.0 21.9
Univers
ity of
Mala
ya

181
17 20.9 20.9 20.9 21.0 20.9 18 21.3 21.6 21.5 21.3 21.4 19 21.2 21.4 21.5 21.6 21.4 20 20.9 21.0 21.0 21.1 21.0 Total average 22.5
Table D275 : Measurements of air temperature at Pharmacy, Banting.
Hospital - Department
Sampling Point
Tair (oC)
0.1 m 0.6 m 1.1 m 1.7 m Average
Banting 1 23.6 22.7 22.8 22.8 23.0- Pharmacy 2 23.2 23.3 23.1 23.1 23.2
3 23.5 23.3 23.6 23.2 23.4 4 23.6 23.3 22.7 23.1 23.2 5 22.8 22.6 22.9 22.9 22.8 6 22.5 22.6 22.8 22.8 22.6 7 23.3 22.9 23.0 23.6 23.2 8 24.0 23.1 23.2 23.2 23.4 9 23.3 23.4 23.2 23.2 23.3 10 23.6 23.4 23.7 23.3 23.5 11 23.6 23.3 22.7 23.1 23.2 12 22.1 21.9 22.2 22.2 22.1 13 22.6 22.7 22.9 22.9 22.7 14 22.7 22.3 22.5 23.0 22.6 15 23.0 22.1 22.2 22.2 22.4 16 22.8 22.9 22.7 22.7 22.8 17 23.0 22.8 23.1 22.7 22.9 18 23.4 23.1 22.5 22.9 23.0 19 23.1 22.9 23.2 23.2 23.1 20 23.1 23.2 23.4 23.4 23.2 Total average 23.0
Table D276 : Measurements of globe temperature at Pathology Unit, Banting.
Hospital - Department
Sampling Point
Tglobe (oC)
0.1 m 0.6 m 1.1 m 1.7 m Average
Banting 1 24.7 25.1 25.4 25.6 25.2- Pathology Unit 2 24.9 25.2 25.5 25.6 25.3
3 25.2 25.2 25.4 25.8 25.4 4 25.3 25.3 25.2 25.5 25.3 5 24.9 25.1 25.5 25.7 25.3 6 25.0 25.2 25.3 25.2 25.2 7 24.4 24.8 25.1 25.3 24.9 8 25.0 25.3 25.6 25.7 25.4
Univers
ity of
Mala
ya

182
9 25.2 25.2 25.4 25.8 25.4 10 24.2 24.6 24.9 25.1 24.7 11 24.1 24.5 24.8 25.0 24.6 12 24.8 25.1 25.4 25.5 25.2 13 24.2 24.3 24.5 24.9 24.5 14 25.0 25.0 24.9 25.2 25.0 15 24.6 24.8 25.2 25.4 25.0 16 24.0 24.1 24.2 24.1 24.1 17 23.6 24.0 24.3 24.5 24.1 18 24.3 24.6 24.9 25.0 24.7 19 24.4 24.4 24.6 25.0 24.6 20 23.8 24.2 24.5 24.7 24.3 Total average 24.9
Table D277 : Measurements of globe temperature at Pharmacy, Banting.
Hospital - Department
Sampling Point
Tglobe (oC)
0.1 m 0.6 m 1.1 m 1.7 m Average
Banting 1 25.3 24.4 24.8 24.8 24.8- Pharmacy 2 24.7 25.1 24.9 25.1 25.0
3 25.1 24.9 25.5 25.5 25.2 4 25.2 25.2 24.7 25.1 25.0 5 24.1 24.1 24.6 25.0 24.5 6 24.1 24.1 24.6 24.9 24.4 7 24.9 24.7 24.9 25.5 25.0 8 25.7 24.8 25.2 25.2 25.2 9 24.7 25.1 24.9 25.1 25.0 10 24.9 24.9 25.4 25.7 25.2 11 25.4 24.5 24.9 24.9 24.9 12 24.6 25.0 24.8 25.0 24.9 13 24.4 24.3 24.8 24.8 24.5 14 24.5 24.5 24.0 24.4 24.3 15 23.8 23.8 24.3 24.7 24.2 16 24.3 24.3 24.8 25.1 24.6 17 24.6 24.4 24.6 25.2 24.7 18 25.4 24.5 24.9 24.9 24.9 19 24.6 25.0 24.8 25.0 24.9 20 24.8 24.8 25.3 25.6 25.1 Total average 24.8
Univers
ity of
Mala
ya
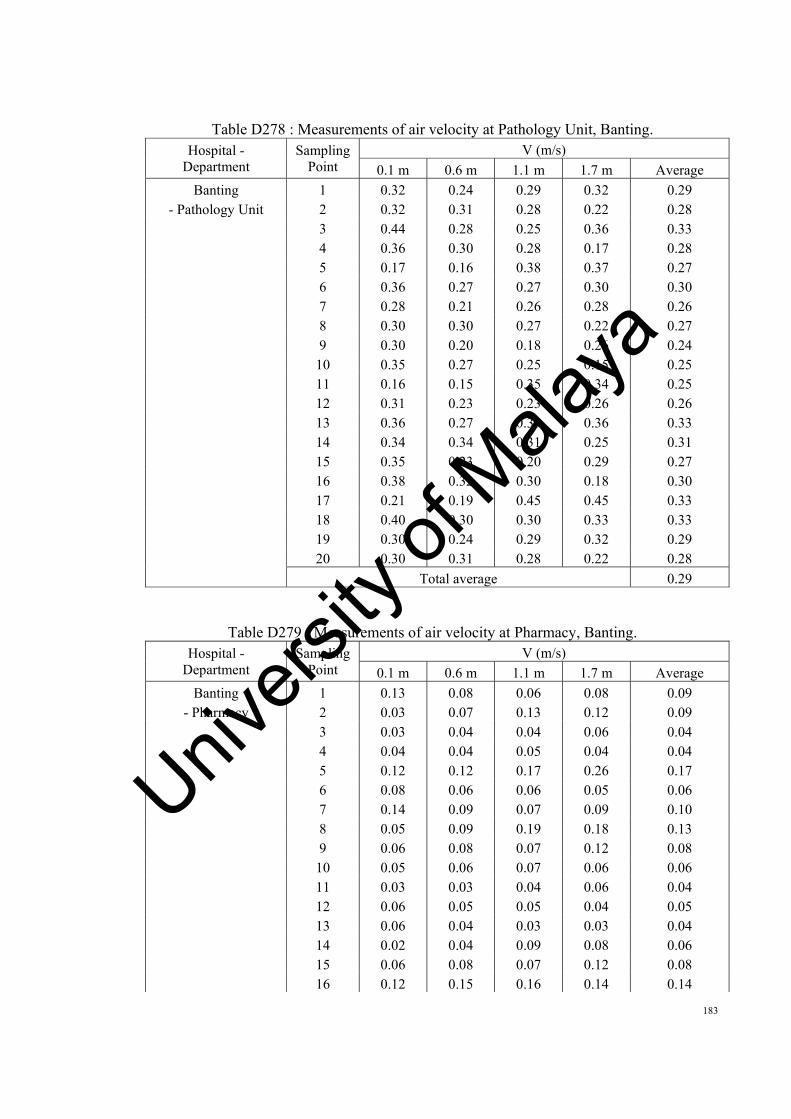
183
Table D278 : Measurements of air velocity at Pathology Unit, Banting. Hospital -
Department Sampling
Point V (m/s)
0.1 m 0.6 m 1.1 m 1.7 m Average
Banting 1 0.32 0.24 0.29 0.32 0.29- Pathology Unit 2 0.32 0.31 0.28 0.22 0.28
3 0.44 0.28 0.25 0.36 0.33 4 0.36 0.30 0.28 0.17 0.28 5 0.17 0.16 0.38 0.37 0.27 6 0.36 0.27 0.27 0.30 0.30 7 0.28 0.21 0.26 0.28 0.26 8 0.30 0.30 0.27 0.22 0.27 9 0.30 0.20 0.18 0.26 0.24 10 0.35 0.27 0.25 0.15 0.25 11 0.16 0.15 0.35 0.34 0.25 12 0.31 0.23 0.23 0.26 0.26 13 0.36 0.27 0.33 0.36 0.33 14 0.34 0.34 0.31 0.25 0.31 15 0.35 0.23 0.20 0.29 0.27 16 0.38 0.32 0.30 0.18 0.30 17 0.21 0.19 0.45 0.45 0.33 18 0.40 0.30 0.30 0.33 0.33 19 0.30 0.24 0.29 0.32 0.29 20 0.30 0.31 0.28 0.22 0.28 Total average 0.29
Table D279 : Measurements of air velocity at Pharmacy, Banting. Hospital -
Department Sampling
Point V (m/s)
0.1 m 0.6 m 1.1 m 1.7 m Average
Banting 1 0.13 0.08 0.06 0.08 0.09- Pharmacy 2 0.03 0.07 0.13 0.12 0.09
3 0.03 0.04 0.04 0.06 0.04 4 0.04 0.04 0.05 0.04 0.04 5 0.12 0.12 0.17 0.26 0.17 6 0.08 0.06 0.06 0.05 0.06 7 0.14 0.09 0.07 0.09 0.10 8 0.05 0.09 0.19 0.18 0.13 9 0.06 0.08 0.07 0.12 0.08 10 0.05 0.06 0.07 0.06 0.06 11 0.03 0.03 0.04 0.06 0.04 12 0.06 0.05 0.05 0.04 0.05 13 0.06 0.04 0.03 0.03 0.04 14 0.02 0.04 0.09 0.08 0.06 15 0.06 0.08 0.07 0.12 0.08 16 0.12 0.15 0.16 0.14 0.14
Univers
ity of
Mala
ya
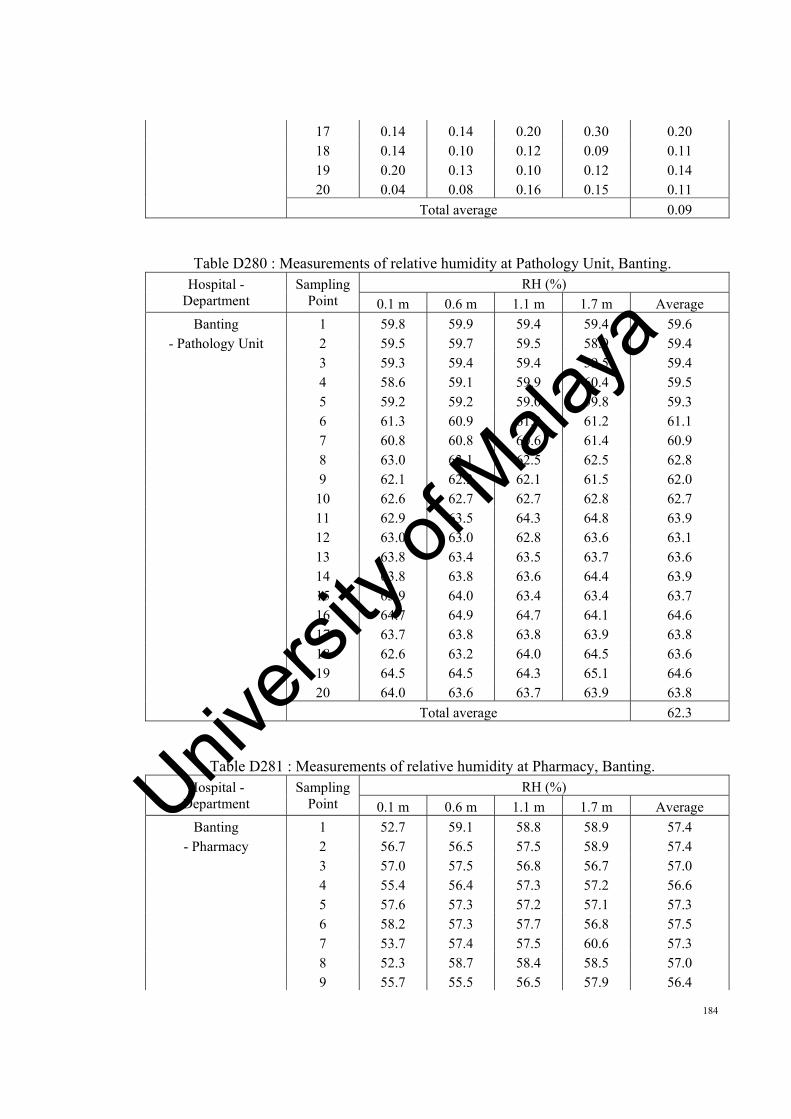
184
17 0.14 0.14 0.20 0.30 0.20 18 0.14 0.10 0.12 0.09 0.11 19 0.20 0.13 0.10 0.12 0.14 20 0.04 0.08 0.16 0.15 0.11 Total average 0.09
Table D280 : Measurements of relative humidity at Pathology Unit, Banting. Hospital -
Department Sampling
Point RH (%)
0.1 m 0.6 m 1.1 m 1.7 m Average
Banting 1 59.8 59.9 59.4 59.4 59.6- Pathology Unit 2 59.5 59.7 59.5 58.9 59.4
3 59.3 59.4 59.4 59.5 59.4 4 58.6 59.1 59.9 60.4 59.5 5 59.2 59.2 59.0 59.8 59.3 6 61.3 60.9 61.0 61.2 61.1 7 60.8 60.8 60.6 61.4 60.9 8 63.0 63.1 62.5 62.5 62.8 9 62.1 62.3 62.1 61.5 62.0 10 62.6 62.7 62.7 62.8 62.7 11 62.9 63.5 64.3 64.8 63.9 12 63.0 63.0 62.8 63.6 63.1 13 63.8 63.4 63.5 63.7 63.6 14 63.8 63.8 63.6 64.4 63.9 15 63.9 64.0 63.4 63.4 63.7 16 64.7 64.9 64.7 64.1 64.6 17 63.7 63.8 63.8 63.9 63.8 18 62.6 63.2 64.0 64.5 63.6 19 64.5 64.5 64.3 65.1 64.6 20 64.0 63.6 63.7 63.9 63.8 Total average 62.3
Table D281 : Measurements of relative humidity at Pharmacy, Banting. Hospital -
Department Sampling
Point RH (%)
0.1 m 0.6 m 1.1 m 1.7 m Average
Banting 1 52.7 59.1 58.8 58.9 57.4- Pharmacy 2 56.7 56.5 57.5 58.9 57.4
3 57.0 57.5 56.8 56.7 57.0 4 55.4 56.4 57.3 57.2 56.6 5 57.6 57.3 57.2 57.1 57.3 6 58.2 57.3 57.7 56.8 57.5 7 53.7 57.4 57.5 60.6 57.3 8 52.3 58.7 58.4 58.5 57.0 9 55.7 55.5 56.5 57.9 56.4
Univers
ity of
Mala
ya

185
10 56.5 56.9 56.3 56.2 56.5 11 55.2 56.2 57.1 57.0 56.4 12 57.8 57.5 57.4 57.3 57.5 13 58.3 57.4 57.8 56.9 57.6 14 52.8 59.3 59.1 59.1 57.6 15 57.1 56.9 57.9 59.3 57.8 16 57.8 58.3 57.6 57.5 57.8 17 56.4 57.4 58.3 58.2 57.6 18 58.3 58.0 57.9 57.8 58.0 19 58.4 57.5 57.9 57.0 57.7 20 53.7 57.5 57.6 60.7 57.4 Total average 57.3
Table D282 : Measurements of metabolic rate at Pathology Unit, Banting.
Hospital - Department Activity Level Metabolic rate
met No. of people met*people Average
Banting Seated quiet 1.0 0 0.0 - Pathology Unit Typing 1.1 3 3.3
Standing relaxed 1.2 2 2.4 Filing (standing) 1.4 0 0.0 Walking about 1.7 2 3.4
Total 7 9.1 1.30
Table D283 : Measurements of metabolic rate at Pharmacy, Banting. Hospital -
Department Activity Level Metabolic rate met No. of people met*people Average
Banting Seated quiet 1.0 0 0 - Pharmacy Typing 1.1 1 1.1
Standing relaxed 1.2 1 1.2 Filing (standing) 1.4 0 0 Walking about 1.7 0 0
Total 2 2.3 1.15
Table D284 : Measurements of clothing value at Pathology Unit, Banting. Hospital -
Department Clothing Insulation Clothing value clo No. of people clo*people Average
Banting Short-sleeve 0.19 3 0.57 - Pathology Unit Normal long-sleeve shirt 0.25 4 1.00
Normal trousers 0.15 7 1.05 Socks 0.02 6 0.12 Shoes 0.02 7 0.14 Jacket 0.36 0 0.00
Long-sleeved,thin
sweater/vest0.25 2 0.50
Total 7 3.38 0.48
Univers
ity of
Mala
ya

186
Table D285 : Measurements of clothing value at Pharmacy, Banting. Hospital -
Department Clothing Insulation Clothing value clo No. of people clo*people Average
Banting Short-sleeve 0.19 1 0.19 - Pharmacy Normal long-sleeve shirt 0.25 1 0.25
Normal trousers 0.15 2 0.30 Socks 0.02 2 0.04 Shoes 0.02 2 0.04 Jacket 0.36 1 0.36
Long-sleeved,thin
sweater/vest0.25 0 0.00
Total 2 1.18 0.59
Table D286 : Measurements of AMV at Pathology Unit, Banting. Hospital -
Department Thermal Sensation
Scale Actual Mean Vote
Scale No. of votes Scale*votes Average
Banting Hot 3 0 0.0 - Pathology Unit Warm 2 0 0.0
Slightly warm 1 1 1.0 Neutral 0 2 0.0 Slightly cool -1 2 -2.0 Cool -2 2 -4.0 Cold -3 0 0.0
Total 7 -5.0 -0.71
Table D287 : Measurements of AMV at Pharmacy, Banting. Hospital -
Department Thermal Sensation
Scale Actual Mean Vote
Scale No. of votes Scale*votes Average
Banting Hot 3 0 0.0 - Pharmacy Warm 2 0 0.0
Slightly warm 1 0 0.0 Neutral 0 0 0.0 Slightly cool -1 2 -2.0 Cool -2 0 0.0 Cold -3 0 0.0
Total 2 -2.0 -1.00
Univers
ity of
Mala
ya

187
Table D288 : UMMC (Outputs from ASHRAE Thermal Comfort Program)
Department PMV PPD (%) Feeling ISO ET* (°C)
SET* (°C) TSENS DISC
PD (%)
PS (%)
TS T.neutral (Humphreys)
T.neutral (Auliciems)
Pharmacy 0.12 5 Comfortable in 23.5 24.8 0 0 17 73 -0.5 21.9 22.0
Otorinolaringologi -0.48 10 Comfortable in 23.0 22.2 -0.1 -0.1 12 69 -0.4 21.9 22.2
Oftalmologi -0.75 17 Comfortable below 22.7,cool 22.0 -0.2 -0.2 12 73 -0.4 21.9 22.2
Emergency Consultation Hall -0.53 11 Comfortable below 22.3,cool 21.6 -0.1 -0.1 16 80 -0.9 21.9 21.4
Observation ward -0.89 22 Comfortable below 21.6,cool 20.4 -0.2 -0.2 17 89 -1.1 21.9 21.1
Univers
ity of
Mala
ya
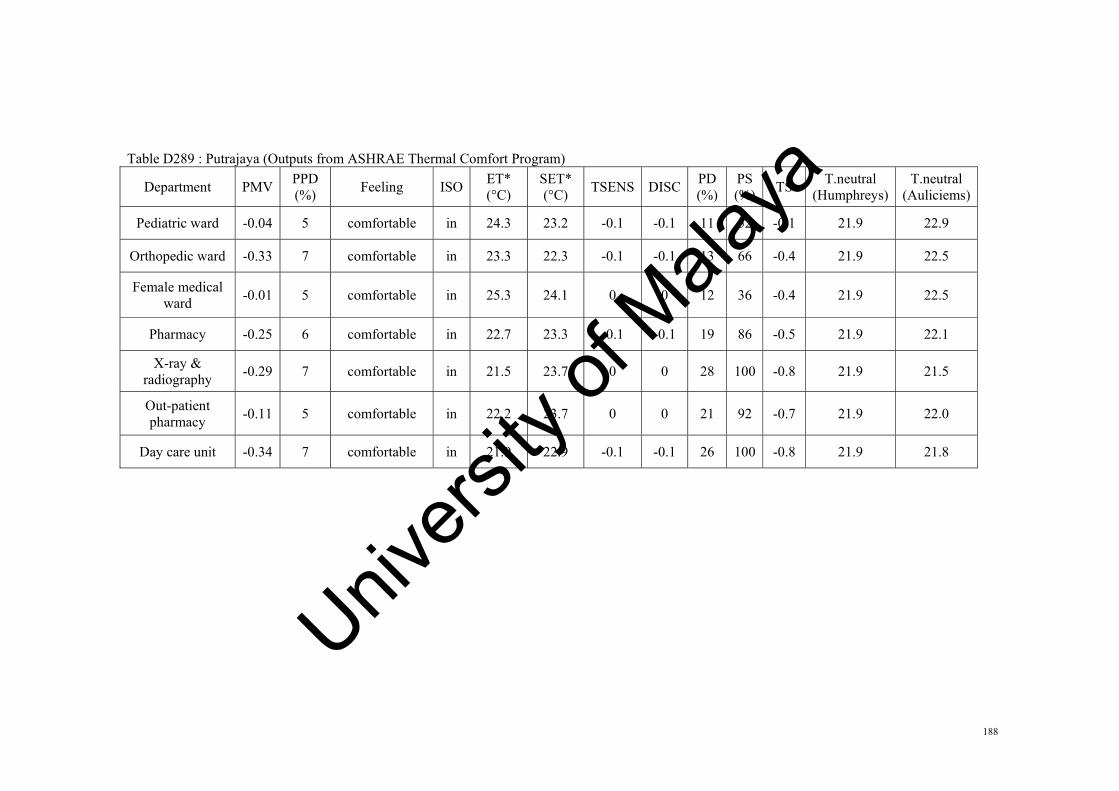
188
Table D289 : Putrajaya (Outputs from ASHRAE Thermal Comfort Program)
Department PMV PPD (%) Feeling ISO
ET* (°C)
SET* (°C) TSENS DISC
PD (%)
PS (%)
TS T.neutral (Humphreys)
T.neutral (Auliciems)
Pediatric ward -0.04 5 comfortable in 24.3 23.2 -0.1 -0.1 11 52 -0.1 21.9 22.9
Orthopedic ward -0.33 7 comfortable in 23.3 22.3 -0.1 -0.1 13 66 -0.4 21.9 22.5
Female medical ward -0.01 5 comfortable in 25.3 24.1 0 0 12 36 -0.4 21.9 22.5
Pharmacy -0.25 6 comfortable in 22.7 23.3 -0.1 -0.1 19 86 -0.5 21.9 22.1
X-ray & radiography -0.29 7 comfortable in 21.5 23.7 0 0 28 100 -0.8 21.9 21.5
Out-patient pharmacy -0.11 5 comfortable in 22.2 23.7 0 0 21 92 -0.7 21.9 22.0
Day care unit -0.34 7 comfortable in 21.9 22.9 -0.1 -0.1 26 100 -0.8 21.9 21.8
Univers
ity of
Mala
ya

189
Table D290 : Sungai Buloh (Outputs from ASHRAE Thermal Comfort Program
Department PMV PPD (%) Feeling ISO ET* (°C)
SET* (°C) TSENS DISC
PD (%)
PS (%)
TS T.neutral (Humphreys)
T.neutral (Auliciems)
Outpatient pharmacy -0.61 13 comfortable below 21.5,cool 22.8 -0.1 -0.1
16 draft risk
92 -0.8 21.9 21.6
Pathodology unit
0.55 11 comfortable above 22.5,cool 26.2 0.1 0.3 16 86 -0.7 21.9 21.7
X-Ray workstation 0.79 18 slightly
uncomfortableabove 23.1 29.9 0.6 1.3 14 81 -0.5 21.9 22.2
Pediatric ward 0 5 comfortable in 23.5 23.1 -0.1 -0.1 13 66 -0.4 21.9 22.4
Maternity ward 0.17 6 comfortable in 22.0,cool 24.1 0 0 13 81 -0.7 21.9 21.8
Table D291 : Selayang (Outputs from ASHRAE Thermal Comfort Program)
Department PMV PPD (%) Feeling ISO ET* (°C)
SET* (°C) TSENS DISC
PD (%)
PS (%)
TS T.neutral (Humphreys)
T.neutral (Auliciems)
Outpatient pharmacy 0.51 10 slightly
uncomfortableabove 20.9,cool 28.3 0.4 0.7 17 100 -1.2 21.9 21.0
Pediatric ward 0.02 5 comfortable in 23.9 23.5 0 0 15 66 -0.3 21.9 22.6
Maternity ward 0.80 19 slightly uncomfortable
above 25.9 27.6 0.4 0.7 19 58 0.2 21.9 23.5
Pathodology unit
0.27 7 comfortable in 23.8 26.0 0.1 0.2 14 66 -0.3 21.9 22.5
X-ray workstation 0.29 7 comfortable in 22.1 26.8 0.2 0.4
16 draft risk
88 -0.8 21.9 21.6
Univers
ity of
Mala
ya

190
Table D292 : Klang (Outputs from ASHRAE Thermal Comfort Program)
Department PMV PPD (%) Feeling ISO ET* (°C) SET*
(°C) TSENS DISCPD (%)
PS (%)
TS T.neutral (Humphreys)
T.neutral (Auliciems)
Picture Archiving Communication -0.27 6 comfortable in 24.4 23.1 -0.1 -0.1 25 79 -0.1 21.9 23.0
Pathology -0.20 6 comfortable in 23.0 24.0 0 0 36 100 -0.5 21.9 22.4
X-ray & radiography 0.65 14 comfortable above
26.0, warm,
too humid
26.3 0.2 0.4 15 55 0.3 21.9 23.4
Cytology laboratory -0.47 10 comfortable in 20.9,
cool 22.7 -0.1 -0.1 87 100 -1.1 21.9 21.4
Endoscopy -0.35 8 comfortable in 21.0, cool
20.5 -0.1 -0.1 15 93 -0.9 21.9 21.3
Medical day care -0.16 6 comfortable in 22.5, cool
22.4 -0.1 -0.1 13 75 -0.6 21.9 22.0
Univers
ity of
Mala
ya

191
Table D293 : Kajang (Outputs from ASHRAE Thermal Comfort Program)
Department PMV PPD (%) Feeling ISO ET*
(°C) SET* (°C) TSENS DISC
PD (%)
PS (%)
TS T.neutral (Humphreys)
T.neutral (Auliciems)
Clinic -0.33 7 comfortable in 25.4 24.1 -0.1 -0.1 16
draft risk
54 0.2 21.9 23.5
Haemodialisis 0.70 15 comfortable above26.2, warm 26.8 0.3 0.5 14 47 0.3 21.9 23.7
Pharmacy 0.41 8 comfortable in 25.4 24.8 0 0 17 57 0.2 21.9 23.4
X-ray & radiography 0.06 5 comfortable in 23.5 24.7 0 0 25 88 -0.4 21.9 22.6
Table D294 : Private (Outputs from ASHRAE Thermal Comfort Program)
Department PMV PPD (%) Feeling ISO ET*
(°C) SET* (°C) TSENS DISC
PD (%)
PS (%)
TS T.neutral (Humphreys)
T.neutral (Auliciems)
Accident & Emergency
ward-0.89 22 comfortable below 21.8 21.2 -0.2 -0.2 100 100 -0.8 21.9 21.7
Labor ward -0.53 11 comfortable below 22.6 21.7 -0.1 -0.1 67 100 -0.5 21.9 22.1
Delivery Suite -0.82 19 comfortable below22.0, cool
20.6 -0.1 -0.1 90 100 -0.7 21.9 21.8
Intensive Care Unit -0.94 24 comfortable below 23.0 21.1 -0.1 -0.1 60 100 -0.4 21.9 22.2
Univers
ity of
Mala
ya

192
Table D295 : Kuala Kubu (Outputs from ASHRAE Thermal Comfort Program)
Department PMV PPD (%) Feeling ISO ET*
(°C) SET* (°C) TSENS DISC
PD (%)
PS (%)
TS T.neutral (Humphreys)
T.neutral (Auliciems)
Hematologi lab 0.47 10 comfortable in 26.1, warm 26.0 0.2 0.3 16 49 0.3 21.9 23.8
Pharmacy -0.06 5 comfortable in 24.6 24.1 0 0 12 53 -0.1 21.9 23.1
X-Ray workstation 0.66 14 comfortable above
27.0, warm,
too humid
26.9 0.4 0.5 8 16 0.6 21.9 24.2
Table D296 : Banting (Outputs from ASHRAE Thermal Comfort Program)
Department PMV PPD (%) Feeling ISO
ET* (°C)
SET* (°C) TSENS DISC
PD (%)
PS (%)
TS T.neutral (Humphreys)
T.neutral (Auliciems)
Pathology Unit -0.26 6 comfortable in 25.3 24.4 0 0 40 79 -0.5 21.9 22.1
Pharmacy -0.08 5 comfortable in 24.8 24.6 0 0 12 44 -0.4 21.9 22.4
Univers
ity of
Mala
ya

193
Appendix E : Graphs of actual mean vote versus operative temperature for hospitals
Figure E1 : AMV vs Top for UMMC hospital.
Figure E2 : AMV vs Top for Putrajaya hospital.
y = 0.1595x ‐ 4.4287R² = 0.4861
‐1.2
‐1
‐0.8
‐0.6
‐0.4
‐0.2
0
0.2
21.00 22.00 23.00 24.00 25.00 26.00 27.00 28.00
Actual M
ean
Vote
Operative temperature (oC)
UMMC Hospital
y = 0.4034x ‐ 10.026R² = 0.5166
‐2
‐1.5
‐1
‐0.5
0
0.5
1
21.00 22.00 23.00 24.00 25.00 26.00
Actual M
ean
Vote
Operative temperature (oC)
Putrajaya Hospital
Univers
ity of
Mala
ya

194
Figure E3 : AMV vs Top for Sungai Buloh hospital.
Figure E4 : AMV vs Top for Selayang hospital.
y = 0.2269x ‐ 4.9546R² = 0.6819
‐0.3
‐0.2
‐0.1
0
0.1
0.2
0.3
0.4
21.00 21.50 22.00 22.50 23.00 23.50
Actual M
ean
Vote
Operative temperature (oC)
Sungai Buloh Hospital
y = 0.3795x ‐ 10.01R² = 0.9646
‐3
‐2.5
‐2
‐1.5
‐1
‐0.5
0
0.5
20.00 21.00 22.00 23.00 24.00 25.00 26.00 27.00
Actual M
ean
Vote
Operative temperature (oC)
Selayang Hospital
Univers
ity of
Mala
ya
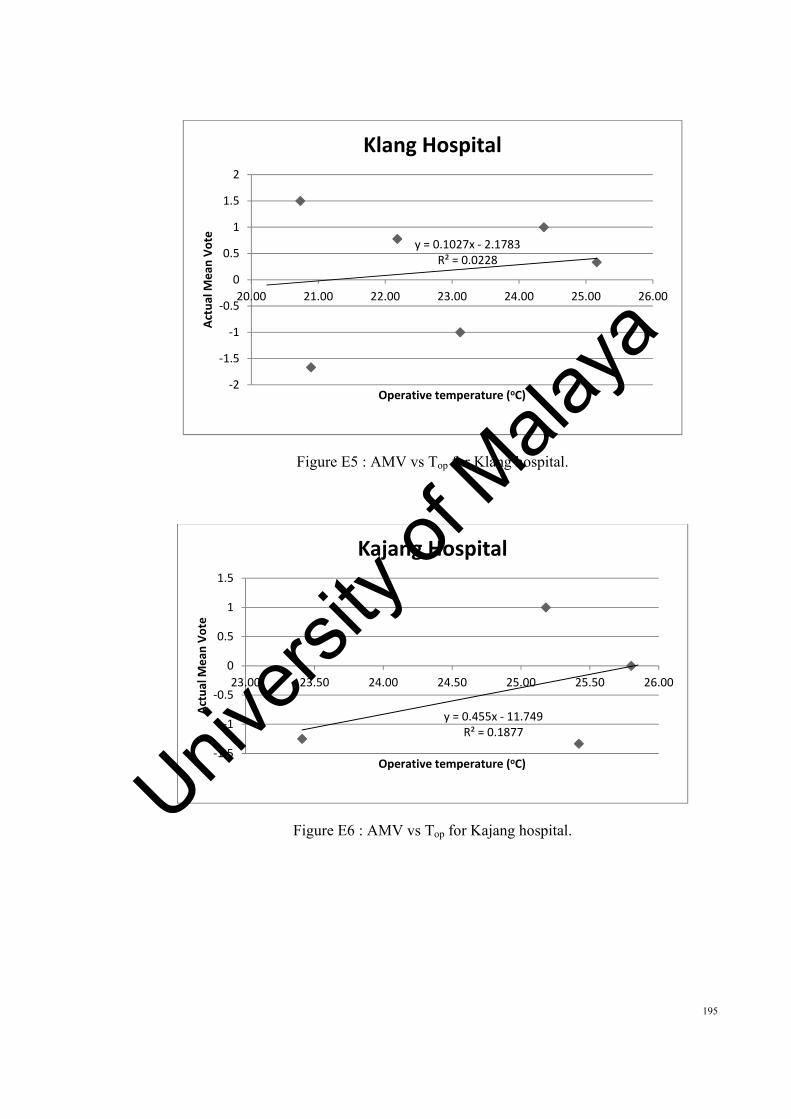
195
Figure E5 : AMV vs Top for Klang hospital.
Figure E6 : AMV vs Top for Kajang hospital.
y = 0.1027x ‐ 2.1783R² = 0.0228
‐2
‐1.5
‐1
‐0.5
0
0.5
1
1.5
2
20.00 21.00 22.00 23.00 24.00 25.00 26.00
Actual M
ean
Vote
Operative temperature (oC)
Klang Hospital
y = 0.455x ‐ 11.749R² = 0.1877
‐1.5
‐1
‐0.5
0
0.5
1
1.5
23.00 23.50 24.00 24.50 25.00 25.50 26.00
Actual M
ean
Vote
Operative temperature (oC)
Kajang Hospital
Univers
ity of
Mala
ya

196
Figure E7 : AMV vs Top for Private hospital.
Figure E8 : AMV vs Top for Kuala Kubu hospital.
y = 0.2881x ‐ 7.8871R² = 0.0533
‐2.5
‐2
‐1.5
‐1
‐0.5
0
0.5
21.00 22.00 23.00 24.00 25.00 26.00 27.00 28.00Actual M
ean
Vote
Operative temperature (oC)
Private Hospital
y = 0.2449x ‐ 6.4261R² = 0.0602
‐2
‐1.5
‐1
‐0.5
0
0.5
1
1.5
24.00 24.50 25.00 25.50 26.00 26.50 27.00
Actual M
ean
Vote
Operative temperature (oC)
Kuala Kubu Hospital
Univers
ity of
Mala
ya

197
Figure E9 : AMV vs Top for Banting hospital.
y = 0.4339x ‐ 11.643R² = 1
‐1.20
‐1.00
‐0.80
‐0.60
‐0.40
‐0.20
0.00
0.20
24.00 24.50 25.00 25.50 26.00 26.50 27.00Actual M
ean
Vote
Operative temperature (oC)
Banting Hospital
Univers
ity of
Mala
ya
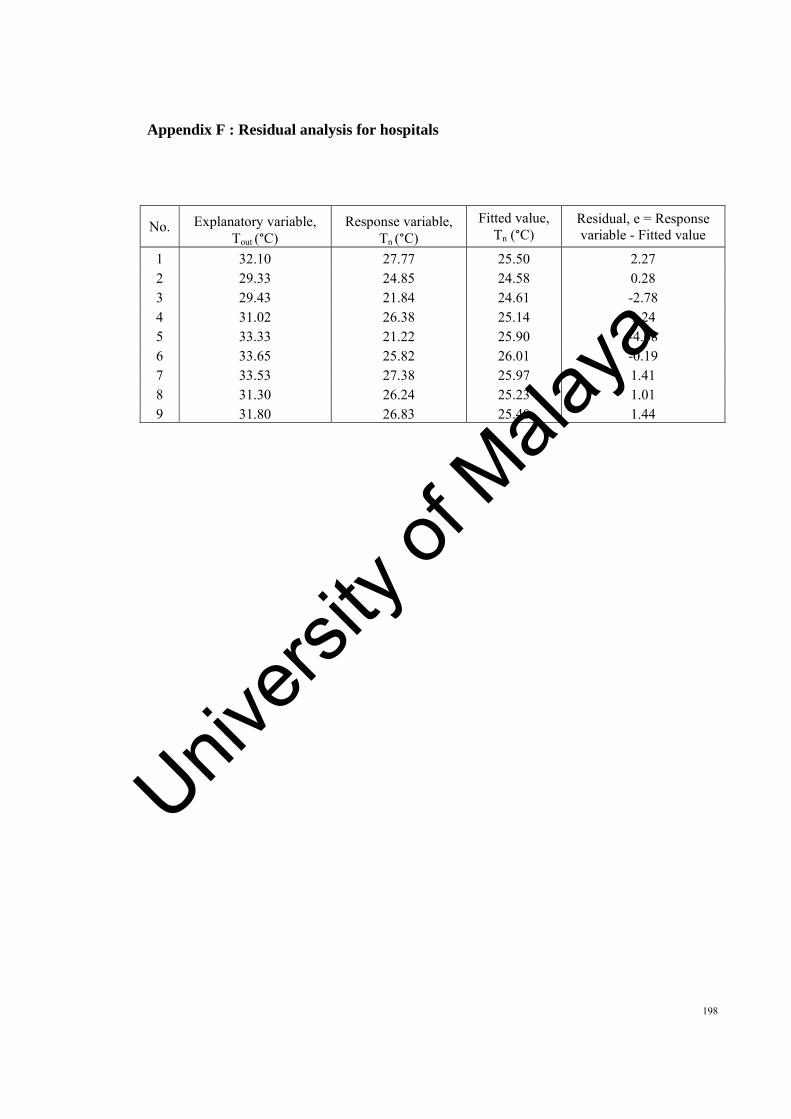
198
Appendix F : Residual analysis for hospitals
No. Explanatory variable, Tout (°C)
Response variable, Tn (°C)
Fitted value, Tn (°C)
Residual, e = Response variable - Fitted value
1 32.10 27.77 25.50 2.272 29.33 24.85 24.58 0.283 29.43 21.84 24.61 -2.784 31.02 26.38 25.14 1.245 33.33 21.22 25.90 -4.686 33.65 25.82 26.01 -0.197 33.53 27.38 25.97 1.418 31.30 26.24 25.23 1.019 31.80 26.83 25.40 1.44
Univers
ity of
Mala
ya

199
Appendix G : Bias uncertainty analysis for hospitals
Table G1 : Bias uncertainty analysis for UMMC - Pharmacy
Point V (m/s) Tglobe (oC) Tair (
oC) RH (%) Tout (oC)
1 0.10 23.0 22.3 69.3 30.52 0.10 23.0 22.4 69.3 31.53 0.10 23.1 22.7 70.2 32.64 0.18 23.2 22.0 70.5 31.65 0.18 23.2 21.8 71.1 31.16 0.14 23.2 21.9 73.3 33.97 0.10 23.3 22.2 79.1 32.68 0.13 23.2 22.3 80.6 32.19 0.18 23.3 22.1 84.3 33.0
Average 0.13 23.2 22.2 74.2 32.1
Bias Uncertainty 0.01 0.03 0.10 1.67 0.38
Error (%) 6.64 0.14 0.45 2.25 1.18
Table G2 : Bias uncertainty analysis for
UMMC - Otorinolaringologi ward
Point V (m/s) Tglobe (oC) Tair (
oC) RH (%) Tout (oC)
1 0.06 22.5 22.5 85.7 32.52 0.10 22.5 22.9 77.2 32.43 0.06 22.6 22.9 73.7 33.24 0.07 22.7 22.8 73.9 30.75 0.06 22.7 22.5 74.8 31.66 0.08 22.8 22.8 75.9 32.37 0.11 22.8 22.6 75.7 33.38 0.06 22.9 22.4 72.6 32.5
Average 0.07 22.7 22.7 76.2 32.3
Bias Uncertainty 0.01 0.05 0.06 1.64 0.33
Error (%) 8.47 0.22 0.28 2.15 1.01
Univers
ity of
Mala
ya

200
Table G3 : Bias uncertainty analysis for UMMC - Oftalmologi ward
Point V (m/s) Tglobe (oC) Tair (
oC) RH (%) Tout (oC)
1 0.12 22.2 22.1 74.4 32.32 0.13 22.3 22.3 73.5 32.93 0.13 22.4 22.0 73.7 32.64 0.12 22.3 22.1 75.4 32.95 0.06 22.4 23.1 79.2 31.36 0.12 22.4 23.3 71.9 32.87 0.06 22.5 23.4 72.9 30.18 0.06 22.5 23.3 71.6 32.29 0.13 22.6 22.8 71.5 32.5
Average 0.10 22.4 22.7 73.8 32.2
Bias Uncertainty 0.01 0.04 0.16 0.86 0.31
Error (%) 7.61 0.20 0.69 1.16 0.97
Table G4 : Bias uncertainty analysis for
UMMC - Emergency Consultation Hall
Point V (m/s) Tglobe (oC) Tair (
oC) RH (%) Tout (oC)
1 0.06 22.9 23.1 66.5 33.12 0.14 22.8 21.6 69.7 30.53 0.06 22.7 21.3 71.6 32.64 0.14 22.5 20.8 74.1 33.25 0.08 22.4 20.8 73.8 32.46 0.10 22.3 20.5 75.4 33.17 0.14 22.3 20.5 75.7 30.48 0.13 22.4 20.5 75.5 32.99 0.11 22.3 20.3 75.3 30.8
Average 0.11 22.5 21.0 73.1 32.1
Bias Uncertainty 0.01 0.07 0.31 1.02 0.31
Error (%) 8.38 0.30 1.48 1.40 0.97
Univers
ity of
Mala
ya

201
Table G5 : Bias uncertainty analysis for UMMC - Observation ward
Point V (m/s) Tglobe (oC) Tair (
oC) RH (%) Tout (oC)
1 0.12 21.4 20.5 74.9 29.42 0.12 21.4 20.4 75.7 30.23 0.10 21.4 20.5 75.1 31.54 0.14 21.4 20.4 75.4 31.95 0.13 21.5 20.3 75.3 32.86 0.08 21.4 20.2 75.4 32.57 0.09 21.4 20.2 75.7 32.78 0.08 21.4 20.3 75.5 32.49 0.16 21.3 20.1 75.7 32.6
Average 0.11 21.4 20.3 75.4 31.8
Bias Uncertainty 0.01 0.02 0.04 0.09 0.38
Error (%) 7.92 0.10 0.22 0.12 1.19
Table G6 : Bias uncertainty analysis for Putrajaya - Pediatric ward
Point V (m/s) Tglobe (oC) Tair (
oC) RH (%) Tout (oC)
1 0.07 24.0 24.1 64.1 27.92 0.05 24.1 24.1 65.6 28.03 0.05 24.1 24.2 65.5 28.94 0.08 24.2 24.1 63.6 28.25 0.06 24.1 24.0 63.0 28.4
Average 0.06 24.1 24.1 64.4 28.3
Bias Uncertainty 0.01 0.04 0.04 0.52 0.20
Error (%) 9.68 0.17 0.17 0.81 0.71
Table G7 : Bias uncertainty analysis for Putrajaya - Orthopedic ward
Point V (m/s) Tglobe (oC) Tair (
oC) RH (%) Tout (oC)
1 0.10 23.3 23.7 57.9 27.72 0.09 23.2 23.6 56.9 28.13 0.14 23.1 23.4 56.6 28.74 0.10 23.1 23.3 56.4 28.95 0.12 23.2 23.2 56.4 28.36 0.09 23.1 23.1 56.6 29.47 0.12 23.3 23.1 56.3 29.6
Average 0.11 23.2 23.3 56.7 28.7
Bias Uncertainty 0.01 0.03 0.09 0.23 0.27
Error (%) 6.64 0.12 0.37 0.40 0.95
Univers
ity of
Mala
ya

202
Table G8 : Bias uncertainty analysis for Putrajaya - Female medical ward
Point V (m/s) Tglobe (oC) Tair (
oC) RH (%) Tout (oC)
1 0.05 23.6 23.3 52.3 28.92 0.06 24.9 23.3 53.1 28.93 0.08 25.9 23.4 53.3 29.44 0.07 26.1 23.4 54.0 29.25 0.08 26.3 23.4 54.4 29.16 0.09 26.1 23.3 53.9 29.27 0.05 26.2 23.3 55.0 29.9
Average 0.07 25.6 23.3 53.7 29.2
Bias Uncertainty 0.01 0.39 0.01 0.39 0.14
Error (%) 8.28 1.51 0.06 0.72 0.49
Table G9 : Bias uncertainty analysis forPutrajaya - Pharmacy
Point V (m/s) Tglobe (oC) Tair (
oC) RH (%) Tout (oC)
1 0.12 22.3 22.3 68.4 29.22 0.13 23.0 22.8 61.1 29.53 0.15 22.4 22.7 64.2 29.44 0.16 22.1 22.5 64.3 29.45 0.18 22.6 22.3 68.3 29.9
Average 0.15 22.5 22.5 65.3 29.5
Bias Uncertainty 0.01 0.18 0.10 1.46 0.14
Error (%) 8.11 0.80 0.44 2.24 0.47
Table G10 : Bias uncertainty analysis forPutrajaya - X-ray & radiography
Point V (m/s) Tglobe (oC) Tair (
oC) RH (%) Tout (oC)
1 0.20 21.1 21.8 72.3 29.92 0.18 21.6 21.6 63.7 29.03 0.23 21.3 21.1 68.7 29.64 0.20 21.3 21.0 68.4 30.55 0.18 21.4 21.2 68.8 30.1
Average 0.20 21.3 21.3 68.4 29.8
Bias Uncertainty 0.01 0.10 0.16 1.72 0.30
Error (%) 5.05 0.47 0.75 2.52 1.01
Univers
ity of
Mala
ya

203
Table G11 : Bias uncertainty analysis for
Putrajaya - Out-patient pharmacy
Point V (m/s) Tglobe (oC) Tair (
oC) RH (%) Tout (oC)
1 0.18 22.2 22.3 49.2 29.92 0.14 22.2 22.2 54.1 29.53 0.13 22.6 22.5 56.6 29.44 0.17 21.9 21.8 56.1 30.75 0.16 22.2 22.2 49.7 30.2
Average 0.16 22.2 22.2 53.1 29.9
Bias Uncertainty 0.01 0.14 0.14 1.48 0.26
Error (%) 6.41 0.63 0.63 2.79 0.87 Table G12 : Bias uncertainty analysis forPutrajaya - Day care unit
Point V (m/s) Tglobe (oC) Tair (
oC) RH (%) Tout (oC)
1 0.17 21.7 21.8 62.2 29.22 0.16 22.1 22.1 55.3 29.83 0.18 21.9 21.8 54.3 29.84 0.20 21.2 21.2 54.9 30.25 0.22 22.1 22.0 57.7 30.7
Average 0.19 21.8 21.8 56.9 29.9
Bias Uncertainty 0.01 0.18 0.18 1.58 0.30
Error (%) 6.45 0.83 0.83 2.78 1.00
Table G13 : Bias uncertainty analysis for Sungai Buloh - Outpatient pharmacy
Point V (m/s) Tglobe (oC) Tair (
oC) RH (%) Tout (oC)
1 0.08 22.3 22.6 68.2 29.92 0.14 21.6 21.3 69.0 29.93 0.11 21.4 21.1 67.7 30.24 0.11 21.1 20.8 66.3 29.95 0.16 21.8 23.6 67.3 30.56 0.08 20.1 19.9 68.2 30.77 0.16 21.4 21.1 66.1 31.0
Average 0.12 21.4 21.5 67.5 30.3
Bias Uncertainty 0.01 0.31 0.53 0.41 0.16
Error (%) 9.52 1.47 2.46 0.61 0.52
Univers
ity of
Mala
ya

204
Table G14 : Bias uncertainty analysis for Sungai Buloh - Pathodology unit
Point V (m/s) Tglobe (oC) Tair (
oC) RH (%) Tout (oC)
1 0.09 22.3 22.2 76.5 31.52 0.10 24.6 24.7 57.6 31.63 0.16 22.2 21.9 70.4 26.44 0.10 21.6 21.3 72.4 26.75 0.16 19.9 19.3 72.1 25.76 0.09 20.7 20.4 72.8 25.77 0.17 21.5 21.2 70.7 24.1
Average 0.12 21.8 21.6 70.4 27.4
Bias Uncertainty 0.01 0.67 0.77 2.70 1.07
Error (%) 9.20 3.08 3.58 3.84 3.91
Table G15 : Bias uncertainty analysis for
Sungai Buloh - X-Ray workstation
Point V (m/s) Tglobe (oC) Tair (
oC) RH (%) Tout (oC)
1 0.09 22.4 22.1 68.0 28.52 0.14 21.8 21.6 69.4 28.03 0.10 21.5 22.6 70.3 28.14 0.11 21.6 22.5 69.6 30.25 0.15 22.2 23.6 67.2 32.06 0.09 21.9 23.6 69.2 32.2
Average 0.11 21.9 22.6 68.9 29.8
Bias Uncertainty 0.01 0.15 0.33 0.52 0.70
Error (%) 8.82 0.69 1.47 0.75 2.35
Table G16 : Bias uncertainty analysis forSungai Buloh - Pediatric ward
Point V (m/s) Tglobe (oC) Tair (
oC) RH (%) Tout (oC)
1 0.10 22.5 22.3 73.1 31.92 0.11 22.3 22.1 71.9 31.23 0.10 22.5 22.2 69.4 30.24 0.11 22.1 21.8 67.1 30.05 0.16 26.9 26.7 65.8 28.06 0.10 23.2 23.0 62.7 28.1
Average 0.11 23.3 23.0 68.3 29.9
Bias Uncertainty 0.01 0.80 0.82 1.73 0.65
Error (%) 8.82 3.44 0.82 2.54 2.18
Univers
ity of
Mala
ya
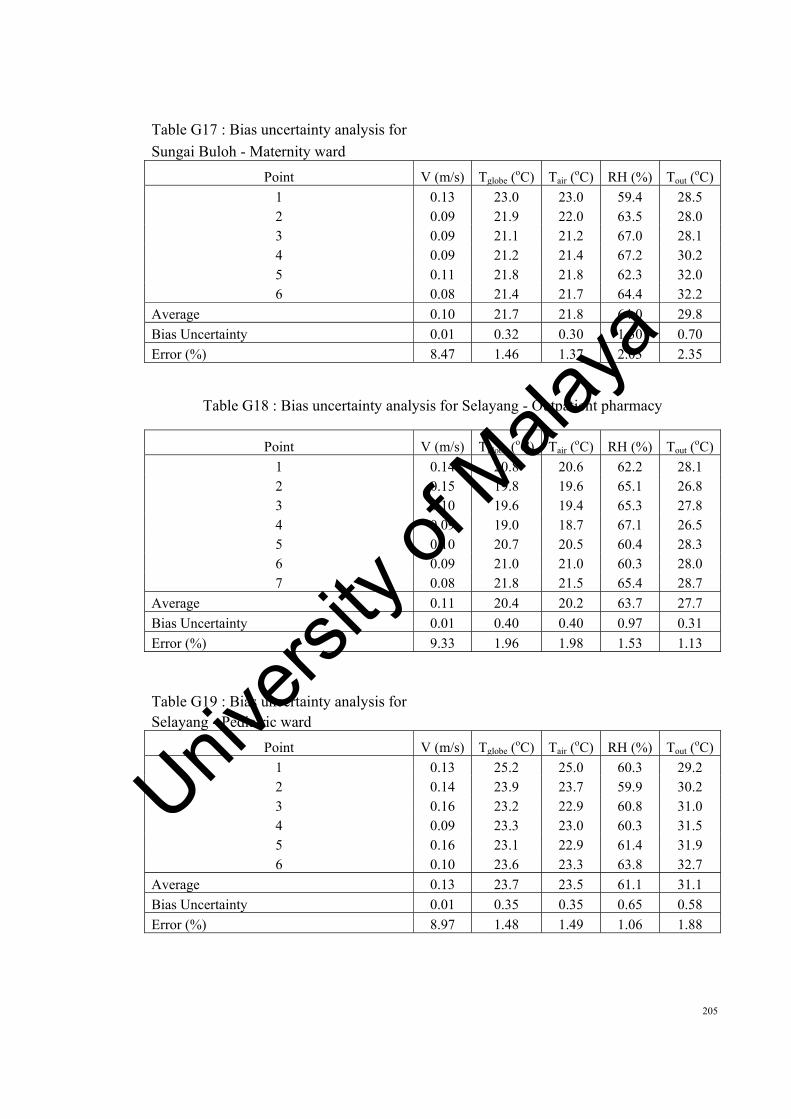
205
Table G17 : Bias uncertainty analysis for
Sungai Buloh - Maternity ward
Point V (m/s) Tglobe (oC) Tair (
oC) RH (%) Tout (oC)
1 0.13 23.0 23.0 59.4 28.52 0.09 21.9 22.0 63.5 28.03 0.09 21.1 21.2 67.0 28.14 0.09 21.2 21.4 67.2 30.25 0.11 21.8 21.8 62.3 32.06 0.08 21.4 21.7 64.4 32.2
Average 0.10 21.7 21.8 64.0 29.8
Bias Uncertainty 0.01 0.32 0.30 1.30 0.70
Error (%) 8.47 1.46 1.37 2.03 2.35
Table G18 : Bias uncertainty analysis for Selayang - Outpatient pharmacy
Point V (m/s) Tglobe (oC) Tair (
oC) RH (%) Tout (oC)
1 0.14 20.8 20.6 62.2 28.12 0.15 19.8 19.6 65.1 26.83 0.10 19.6 19.4 65.3 27.84 0.09 19.0 18.7 67.1 26.55 0.10 20.7 20.5 60.4 28.36 0.09 21.0 21.0 60.3 28.07 0.08 21.8 21.5 65.4 28.7
Average 0.11 20.4 20.2 63.7 27.7
Bias Uncertainty 0.01 0.40 0.40 0.97 0.31
Error (%) 9.33 1.96 1.98 1.53 1.13
Table G19 : Bias uncertainty analysis forSelayang - Pediatric ward
Point V (m/s) Tglobe (oC) Tair (
oC) RH (%) Tout (oC)
1 0.13 25.2 25.0 60.3 29.22 0.14 23.9 23.7 59.9 30.23 0.16 23.2 22.9 60.8 31.04 0.09 23.3 23.0 60.3 31.55 0.16 23.1 22.9 61.4 31.96 0.10 23.6 23.3 63.8 32.7
Average 0.13 23.7 23.5 61.1 31.1
Bias Uncertainty 0.01 0.35 0.35 0.65 0.58
Error (%) 8.97 1.48 1.49 1.06 1.88
Univers
ity of
Mala
ya

206
Table G20 : Bias uncertainty analysis for Selayang - Maternity ward
Point V (m/s) Tglobe (oC) Tair (
oC) RH (%) Tout (oC)
1 0.16 24.4 24.2 61.4 32.12 0.22 26.4 26.1 56.9 32.43 0.15 25.3 25.1 54.1 32.64 0.25 25.6 25.3 54.5 32.75 0.17 26.5 26.3 55.6 32.76 0.27 25.4 25.1 55.5 32.5
Average 0.20 25.6 25.4 56.3 32.5
Bias Uncertainty 0.02 0.35 0.35 1.22 0.10
Error (%) 9.84 1.37 1.38 2.16 0.31
Table G21 : Bias uncertainty analysis forSelayang - Pathodology unit
Point V (m/s) Tglobe (oC) Tair (
oC) RH (%) Tout (oC)
1 0.11 24.2 24.0 62.1 32.12 0.10 23.8 23.5 57.7 31.93 0.12 24.0 23.7 62.7 32.64 0.13 22.8 22.6 74.3 32.85 0.16 23.8 23.5 55.2 32.26 0.10 22.3 22.1 75.6 32.5
Average 0.12 23.5 23.2 64.6 32.4
Bias Uncertainty 0.01 0.32 0.32 3.40 0.15
Error (%) 8.33 1.35 0.82 5.27 0.46
Table G22 : Bias uncertainty analysis forSelayang - X-ray workstation
Point V (m/s) Tglobe (oC) Tair (
oC) RH (%) Tout (oC)
1 0.15 22.2 21.9 64.8 32.52 0.12 23.1 22.9 61.4 32.33 0.08 22.6 22.3 64.7 32.34 0.12 20.8 20.5 72.9 32.45 0.13 20.8 20.6 71.3 31.46 0.10 21.1 21.1 69.0 29.87 0.13 21.2 20.9 70.8 29.4
Average 0.12 21.7 21.5 67.8 31.4
Bias Uncertainty 0.01 0.33 0.34 1.64 0.44
Error (%) 8.43 1.52 1.60 2.42 1.41
Univers
ity of
Mala
ya

207
Table G23 : Bias uncertainty analysis for Klang - Picture Archiving Communication
Point V (m/s) Tglobe (oC) Tair (
oC) RH (%) Tout (oC)
1 0.24 24.3 24.5 49.4 31.52 0.23 24.4 24.7 50.1 33.73 0.20 23.0 23.7 49.6 33.04 0.19 24.5 24.3 49.8 32.15 0.25 25.1 24.5 51.2 33.96 0.26 24.9 24.7 53.4 34.27 0.21 24.5 24.1 51.0 34.4
Average 0.23 24.4 24.4 50.6 33.3
Bias Uncertainty 0.01 0.30 0.14 0.57 0.41
Error (%) 4.43 1.23 0.59 1.13 1.25
Table G24 : Bias uncertainty analysis forKlang - Pathology
Point V (m/s) Tglobe (oC) Tair (
oC) RH (%) Tout (oC)
1 0.28 23.6 23.5 42.7 34.32 0.31 22.8 23.1 45.2 33.03 0.27 22.8 23.0 47.4 33.74 0.28 22.7 22.8 47.8 31.05 0.27 23.7 23.4 47.9 32.76 0.29 22.9 22.9 47.1 32.77 0.23 23.1 22.9 46.3 34.0
Average 0.28 23.1 23.1 46.3 33.1
Bias Uncertainty 0.01 0.14 0.10 0.74 0.47
Error (%) 4.15 0.62 0.43 1.60 1.43
Table G25 : Bias uncertainty analysis forKlang - X-ray & radiography
Point V (m/s) Tglobe (oC) Tair (
oC) RH (%) Tout (oC)
1 0.15 25.5 25.3 69.6 34.02 0.14 24.8 24.7 70.7 34.43 0.17 25.8 25.3 72.1 33.54 0.14 26.0 26.3 74.0 33.55 0.19 25.0 25.4 64.0 33.76 0.12 25.4 25.3 72.3 33.67 0.16 25.2 25.1 69.1 31.28 0.16 24.0 24.6 70.3 33.0
Average 0.16 25.2 25.2 70.3 33.4
Bias Uncertainty 0.01 0.25 0.21 1.25 0.40
Error (%) 5.64 0.99 0.84 1.78 1.20
Univers
ity of
Mala
ya

208
Table G26 : Bias uncertainty analysis for Klang - Cytology laboratory
Point V (m/s) Tglobe (oC) Tair (
oC) RH (%) Tout (oC)
1 0.40 19.6 19.8 49.1 29.62 0.49 21.1 20.9 48.1 30.73 0.46 21.1 20.7 48.5 32.94 0.54 20.9 21.2 46.6 35.05 0.49 20.5 20.9 47.9 33.86 0.48 21.1 21.2 47.0 35.47 0.54 21.6 21.2 47.7 32.68 0.53 21.3 20.9 47.7 34.5
Average 0.49 20.9 20.9 47.8 33.1
Bias Uncertainty 0.02 0.25 0.18 0.31 0.73
Error (%) 3.56 1.20 0.84 0.65 2.19 Table G27 : Bias uncertainty analysis forKlang - Endoscopy
Point V (m/s) Tglobe (oC) Tair (
oC) RH (%) Tout (oC)
1 0.07 20.1 20.2 75.2 30.02 0.04 19.8 19.8 76.5 32.33 0.04 20.2 20.3 74.7 32.24 0.04 20.5 20.5 74.6 33.15 0.06 20.5 20.3 74.7 33.86 0.04 20.3 20.1 76.1 34.37 0.06 21.7 22.4 72.9 35.88 0.04 22.4 22.2 73.0 36.3
Average 0.05 20.7 20.7 74.7 33.5
Bias Uncertainty 0.00 0.33 0.33 0.45 0.79
Error (%) 7.89 1.57 1.57 0.60 2.35 Table G28 : Bias uncertainty analysis for Klang - Medical day care
Point V (m/s) Tglobe (oC) Tair (
oC) RH (%) Tout (oC)
1 0.04 19.6 19.7 77.4 30.32 0.04 23.3 23.2 68.6 32.43 0.09 21.3 21.5 73.6 33.04 0.05 22.2 22.1 71.9 33.65 0.05 22.5 22.6 70.7 34.56 0.06 22.7 23.0 69.5 34.07 0.09 23.5 23.2 68.7 34.68 0.04 23.7 23.4 68.2 34.39 0.04 23.7 23.3 67.9 34.810 0.08 19.7 19.8 76.4 34.6
Average 0.06 22.2 22.2 71.3 33.6
Univers
ity of
Mala
ya

209
Bias Uncertainty 0.01 0.41 0.37 0.95 0.45
Error (%) 8.62 1.85 1.67 1.33 1.34
Table G29 : Bias uncertainty analysis for Kajang - Clinic
Point V (m/s) Tglobe (oC) Tair (
oC) RH (%) Tout (oC)
1 0.17 25.3 25.4 53.6 31.92 0.15 25.5 25.5 52.3 32.53 0.15 25.2 25.3 50.9 33.44 0.18 25.4 25.3 51.9 33.95 0.16 25.5 25.4 53.5 34.16 0.19 25.4 25.5 52.4 34.3
Average 0.17 25.4 25.4 52.4 33.4
Bias Uncertainty 0.01 0.05 0.03 0.45 0.40
Error (%) 4.00 0.20 0.13 0.86 1.20
Table G30 : Bias uncertainty analysis forKajang - Haemodialisis
Point V (m/s) Tglobe (oC) Tair (
oC) RH (%) Tout (oC)
1 0.16 25.6 25.7 58.2 32.32 0.15 25.3 25.5 58.9 32.73 0.19 25.6 25.7 59.4 33.84 0.16 25.8 25.8 60.3 34.35 0.17 26.1 25.9 59.5 33.96 0.15 26.2 26.0 58.9 35.1
Average 0.16 25.8 25.8 59.2 33.7
Bias Uncertainty 0.01 0.15 0.08 0.35 0.47
Error (%) 4.08 0.58 0.32 0.59 1.39 Table G31 : Bias uncertainty analysis for Kajang - Pharmacy
Point V (m/s) Tglobe (oC) Tair (
oC) RH (%) Tout (oC)
1 0.15 24.6 25.2 57.7 32.52 0.16 25.0 25.3 57.0 33.33 0.18 25.9 25.2 57.6 33.84 0.17 25.1 25.2 58.3 34.15 0.18 25.1 25.1 57.3 34.36 0.20 25.3 25.2 59.0 34.6
Average 0.17 25.2 25.2 57.8 33.8
Bias Uncertainty 0.01 0.22 0.03 0.33 0.35
Error (%) 4.81 0.86 0.13 0.58 1.04
Univers
ity of
Mala
ya

210
Table G32 : Bias uncertainty analysis for Kajang - X-ray & radiography
Point V (m/s) Tglobe (oC) Tair (
oC) RH (%) Tout (oC)
1 0.23 22.5 23.2 49.8 32.82 0.21 22.9 22.9 51.2 33.73 0.24 23.6 23.3 52.9 33.74 0.23 23.9 23.6 53.5 34.35 0.20 23.9 23.7 54.2 33.66 0.17 23.7 23.5 57.5 34.1
Average 0.21 23.4 23.4 53.2 33.7
Bias Uncertainty 0.01 0.23 0.13 1.28 0.25
Error (%) 5.48 1.00 0.82 2.41 0.74
Table G33 : Bias uncertainty analysis for Private - Accident & Emergency ward
Point V (m/s) Tglobe (oC) Tair (
oC) RH (%) Tout (oC)
1 0.53 20.4 20.5 62.2 31.12 0.57 21.8 21.6 60.3 32.83 0.53 21.6 21.4 61.2 33.54 0.57 24.2 23.9 62.4 34.55 0.54 19.0 20.3 62.4 33.86 0.59 23.1 22.8 59.6 35.27 0.63 22.1 21.8 62.1 34.0
Average 0.57 21.7 21.7 61.5 33.6
Bias Uncertainty 0.01 0.74 0.51 0.40 0.59
Error (%) 2.53 3.42 2.36 0.65 1.75
Table G34 : Bias uncertainty analysis forPrivate - Labor ward
Point V (m/s) Tglobe (oC) Tair (
oC) RH (%) Tout (oC)
1 0.45 24.4 24.4 59.1 32.12 0.42 20.9 20.9 74.3 32.93 0.40 21.1 21.1 73.0 33.54 0.45 20.5 20.5 65.2 33.85 0.41 23.5 23.4 65.8 33.26 0.49 23.1 23.0 66.1 34.17 0.48 23.3 23.2 66.9 34.5
Average 0.44 22.4 22.4 67.2 33.4
Bias Uncertainty 0.01 0.56 0.56 2.17 0.34
Error (%) 2.90 2.49 2.49 3.23 1.03
Univers
ity of
Mala
ya

211
Table G35 : Bias uncertainty analysis for
Private - Delivery Suite
Point V (m/s) Tglobe (oC) Tair (
oC) RH (%) Tout (oC)
1 0.55 20.8 20.4 65.6 31.92 0.51 22.6 22.3 64.7 32.23 0.59 21.4 21.3 64.5 33.74 0.50 22.7 22.9 62.9 33.55 0.54 21.5 21.8 67.1 34.26 0.53 21.3 21.9 65.3 34.17 0.52 22.4 22.3 66.2 34.7
Average 0.53 21.8 21.8 65.2 33.5
Bias Uncertainty 0.01 0.27 0.36 0.60 0.40
Error (%) 2.41 1.24 1.63 0.92 1.20
Table G36 : Bias uncertainty analysis forPrivate - Intensive Care Unit
Point V (m/s) Tglobe (oC) Tair (
oC) RH (%) Tout (oC)
1 0.40 22.4 22.5 71.7 32.12 0.41 22.8 22.9 73.3 32.33 0.40 22.3 22.3 73.5 33.24 0.42 23.8 23.7 71.4 33.75 0.43 21.7 21.6 70.4 34.26 0.40 23.0 22.9 72.9 34.67 0.40 23.0 23.1 76.6 34.8
Average 0.41 22.7 22.7 72.8 33.6
Bias Uncertainty 0.00 0.30 0.30 0.89 0.39
Error (%) 1.05 1.32 0.82 1.22 1.15
Table G37 : Bias uncertainty analysis for Kuala Kubu - Hematologi lab
Point V (m/s) Tglobe (oC) Tair (
oC) RH (%) Tout (oC)
1 0.19 26.4 26.4 53.2 30.22 0.12 26.4 26.3 52.8 30.93 0.17 26.2 26.1 53.9 31.04 0.15 26.1 26.0 54.0 31.55 0.21 25.8 25.7 54.6 32.06 0.24 25.4 25.7 55.4 32.17 0.20 25.9 25.9 54.7 32.0
Average 0.18 26.0 26.0 54.1 31.4
Bias Uncertainty 0.02 0.14 0.10 0.37 0.27
Error (%) 9.38 0.55 0.38 0.69 0.86
Univers
ity of
Mala
ya
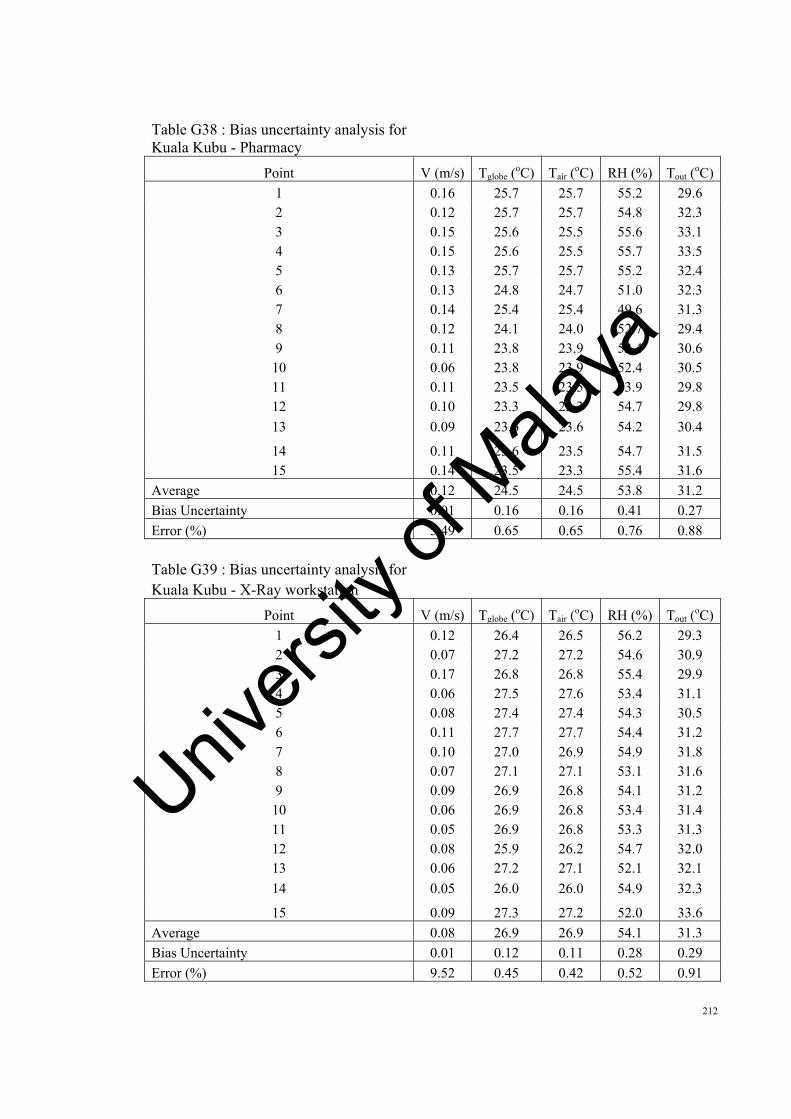
212
Table G38 : Bias uncertainty analysis for Kuala Kubu - Pharmacy
Point V (m/s) Tglobe (oC) Tair (
oC) RH (%) Tout (oC)
1 0.16 25.7 25.7 55.2 29.62 0.12 25.7 25.7 54.8 32.33 0.15 25.6 25.5 55.6 33.14 0.15 25.6 25.5 55.7 33.55 0.13 25.7 25.7 55.2 32.46 0.13 24.8 24.7 51.0 32.37 0.14 25.4 25.4 49.6 31.38 0.12 24.1 24.0 52.7 29.49 0.11 23.8 23.9 52.4 30.610 0.06 23.8 23.9 52.4 30.511 0.11 23.5 23.5 53.9 29.812 0.10 23.3 23.3 54.7 29.8
13 0.09 23.6 23.6 54.2 30.4
14 0.11 23.6 23.5 54.7 31.515 0.14 23.5 23.3 55.4 31.6
Average 0.12 24.5 24.5 53.8 31.2
Bias Uncertainty 0.01 0.16 0.16 0.41 0.27
Error (%) 5.49 0.65 0.65 0.76 0.88
Table G39 : Bias uncertainty analysis forKuala Kubu - X-Ray workstation
Point V (m/s) Tglobe (oC) Tair (
oC) RH (%) Tout (oC)
1 0.12 26.4 26.5 56.2 29.32 0.07 27.2 27.2 54.6 30.93 0.17 26.8 26.8 55.4 29.94 0.06 27.5 27.6 53.4 31.15 0.08 27.4 27.4 54.3 30.56 0.11 27.7 27.7 54.4 31.27 0.10 27.0 26.9 54.9 31.88 0.07 27.1 27.1 53.1 31.69 0.09 26.9 26.8 54.1 31.210 0.06 26.9 26.8 53.4 31.411 0.05 26.9 26.8 53.3 31.312 0.08 25.9 26.2 54.7 32.013 0.06 27.2 27.1 52.1 32.1
14 0.05 26.0 26.0 54.9 32.3
15 0.09 27.3 27.2 52.0 33.6
Average 0.08 26.9 26.9 54.1 31.3
Bias Uncertainty 0.01 0.12 0.11 0.28 0.29
Error (%) 9.52 0.45 0.42 0.52 0.91
Univers
ity of
Mala
ya

213
Table G40 : Bias uncertainty analysis for Banting - Pathology Unit
Point V (m/s) Tglobe (oC) Tair (
oC) RH (%) Tout (oC)
1 0.29 25.2 23.9 59.6 31.9 2 0.28 25.3 24.0 59.4 32.6 3 0.33 25.4 24.0 59.4 33.5 4 0.28 25.3 23.9 59.5 33.7 5 0.27 25.3 24.0 59.3 33.4 6 0.30 25.2 23.0 61.1 33.3 7 0.26 24.9 22.7 60.9 32.2 8 0.27 25.4 23.1 62.8 30.7 9 0.24 25.4 22.3 62.0 31.0 10 0.25 24.7 22.5 62.7 31.1 11 0.25 24.6 22.4 63.9 29.9 12 0.26 25.2 22.0 63.1 30.5 13 0.33 24.5 22.3 63.6 31.8 14 0.31 25.0 21.8 63.9 31.6
15 0.27 25.0 21.7 63.7 31.8 16 0.30 24.1 21.9 64.6 32.3 17 0.33 24.1 20.9 63.8 30.4 18 0.33 24.7 21.4 63.6 31.4 19 0.29 24.6 21.4 64.6 32.1 20 0.28 24.3 21.0 63.8 31.8
Average 0.29 24.9 22.5 62.3 31.9 Bias Uncertainty 0.00 0.06 0.16 0.27 0.19 Error (%) 1.57 0.26 0.69 0.43 0.60
Univers
ity of
Mala
ya

214
Table G41 : Bias uncertainty analysis for Banting - Pharmacy
Point V (m/s) Tglobe (oC) Tair (
oC) RH (%) Tout (oC)
1 0.09 24.8 23.0 57.4 29.9 2 0.09 25.0 23.2 57.4 31.6 3 0.04 25.2 23.4 57.0 32.7 4 0.04 25.0 23.2 56.6 32.8 5 0.17 24.5 22.8 57.3 32.8 6 0.06 24.4 22.6 57.5 32.7 7 0.10 25.0 23.2 57.3 31.8 8 0.13 25.2 23.4 57.0 30.0 9 0.08 25.0 23.3 56.4 31.3 10 0.06 25.2 23.5 56.5 31.4 11 0.04 24.9 23.2 56.4 29.8 12 0.05 24.9 22.1 57.5 29.6 13 0.04 24.5 22.7 57.6 31.4 14 0.06 24.3 22.6 57.6 31.7
15 0.08 24.2 22.4 57.8 31.8 16 0.14 24.6 22.8 57.8 31.5 17 0.20 24.7 22.9 57.6 32.1 18 0.11 24.9 23.0 58.0 32.6 19 0.14 24.9 23.1 57.7 33.5 20 0.11 25.1 23.2 57.4 32.8
Average 0.09 24.8 23.0 57.3 31.7 Bias Uncertainty 0.01 0.05 0.07 0.08 0.20 Error (%) 8.74 0.20 0.30 0.14 0.62
Univers
ity of
Mala
ya
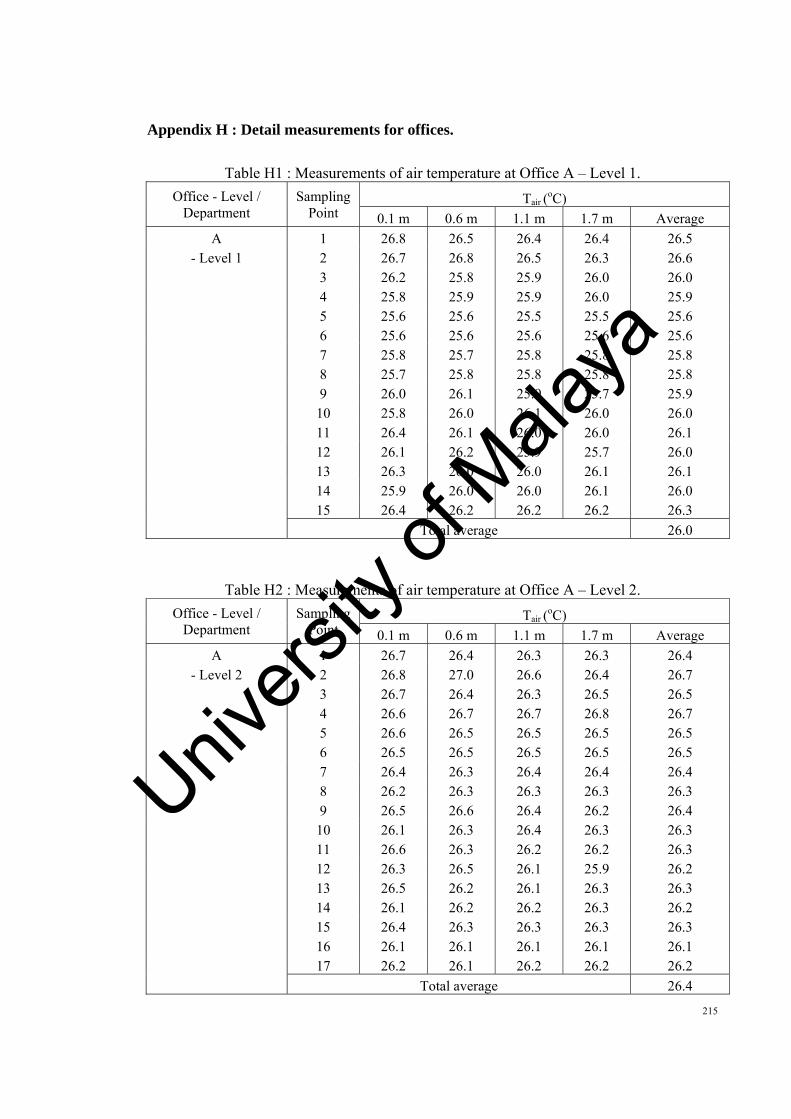
215
Appendix H : Detail measurements for offices.
Table H1 : Measurements of air temperature at Office A – Level 1.
Office - Level / Department
Sampling Point
Tair (oC)
0.1 m 0.6 m 1.1 m 1.7 m Average
A 1 26.8 26.5 26.4 26.4 26.5- Level 1 2 26.7 26.8 26.5 26.3 26.6
3 26.2 25.8 25.9 26.0 26.0 4 25.8 25.9 25.9 26.0 25.9 5 25.6 25.6 25.5 25.5 25.6 6 25.6 25.6 25.6 25.6 25.6 7 25.8 25.7 25.8 25.8 25.8 8 25.7 25.8 25.8 25.8 25.8 9 26.0 26.1 25.9 25.7 25.9 10 25.8 26.0 26.1 26.0 26.0 11 26.4 26.1 26.0 26.0 26.1 12 26.1 26.2 25.9 25.7 26.0 13 26.3 26.0 26.0 26.1 26.1 14 25.9 26.0 26.0 26.1 26.0 15 26.4 26.2 26.2 26.2 26.3 Total average 26.0
Table H2 : Measurements of air temperature at Office A – Level 2.
Office - Level / Department
Sampling Point
Tair (oC)
0.1 m 0.6 m 1.1 m 1.7 m Average
A 1 26.7 26.4 26.3 26.3 26.4- Level 2 2 26.8 27.0 26.6 26.4 26.7
3 26.7 26.4 26.3 26.5 26.5 4 26.6 26.7 26.7 26.8 26.7 5 26.6 26.5 26.5 26.5 26.5 6 26.5 26.5 26.5 26.5 26.5 7 26.4 26.3 26.4 26.4 26.4 8 26.2 26.3 26.3 26.3 26.3 9 26.5 26.6 26.4 26.2 26.4 10 26.1 26.3 26.4 26.3 26.3 11 26.6 26.3 26.2 26.2 26.3 12 26.3 26.5 26.1 25.9 26.2 13 26.5 26.2 26.1 26.3 26.3 14 26.1 26.2 26.2 26.3 26.2 15 26.4 26.3 26.3 26.3 26.3 16 26.1 26.1 26.1 26.1 26.1 17 26.2 26.1 26.2 26.2 26.2 Total average 26.4
Univers
ity of
Mala
ya
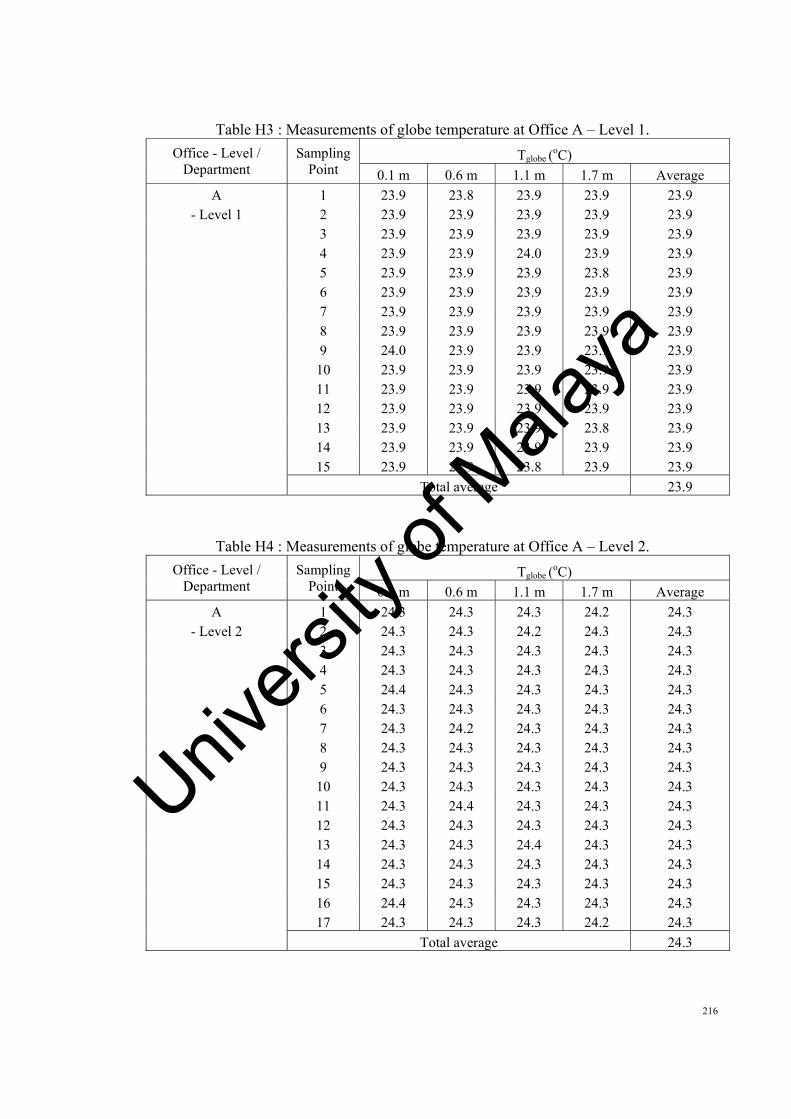
216
Table H3 : Measurements of globe temperature at Office A – Level 1.
Office - Level / Department
Sampling Point
Tglobe (oC)
0.1 m 0.6 m 1.1 m 1.7 m Average
A 1 23.9 23.8 23.9 23.9 23.9- Level 1 2 23.9 23.9 23.9 23.9 23.9
3 23.9 23.9 23.9 23.9 23.9 4 23.9 23.9 24.0 23.9 23.9 5 23.9 23.9 23.9 23.8 23.9 6 23.9 23.9 23.9 23.9 23.9 7 23.9 23.9 23.9 23.9 23.9 8 23.9 23.9 23.9 23.9 23.9 9 24.0 23.9 23.9 23.9 23.9 10 23.9 23.9 23.9 23.9 23.9 11 23.9 23.9 23.9 23.9 23.9 12 23.9 23.9 23.9 23.9 23.9 13 23.9 23.9 23.9 23.8 23.9 14 23.9 23.9 23.9 23.9 23.9 15 23.9 23.9 23.8 23.9 23.9 Total average 23.9
Table H4 : Measurements of globe temperature at Office A – Level 2.
Office - Level / Department
Sampling Point
Tglobe (oC)
0.1 m 0.6 m 1.1 m 1.7 m Average
A 1 24.3 24.3 24.3 24.2 24.3- Level 2 2 24.3 24.3 24.2 24.3 24.3
3 24.3 24.3 24.3 24.3 24.3 4 24.3 24.3 24.3 24.3 24.3 5 24.4 24.3 24.3 24.3 24.3 6 24.3 24.3 24.3 24.3 24.3 7 24.3 24.2 24.3 24.3 24.3 8 24.3 24.3 24.3 24.3 24.3 9 24.3 24.3 24.3 24.3 24.3 10 24.3 24.3 24.3 24.3 24.3 11 24.3 24.4 24.3 24.3 24.3 12 24.3 24.3 24.3 24.3 24.3 13 24.3 24.3 24.4 24.3 24.3 14 24.3 24.3 24.3 24.3 24.3 15 24.3 24.3 24.3 24.3 24.3 16 24.4 24.3 24.3 24.3 24.3 17 24.3 24.3 24.3 24.2 24.3 Total average 24.3
Univers
ity of
Mala
ya

217
Table H5 : Measurements of air velocity at Office A – Level 1.
Office - Level / Department
Sampling Point
V (m/s) 0.1 m 0.6 m 1.1 m 1.7 m Average
A 1 0.04 0.04 0.04 0.04 0.04- Level 1 2 0.01 0.01 0.02 0.01 0.01
3 0.02 0.01 0.01 0.02 0.02 4 0.02 0.01 0.01 0.01 0.01 5 0.02 0.03 0.01 0.02 0.02 6 0.02 0.02 0.02 0.01 0.02 7 0.02 0.01 0.01 0.01 0.01 8 0.01 0.01 0.02 0.01 0.01 9 0.02 0.01 0.01 0.01 0.01 10 0.01 0.02 0.01 0.01 0.01 11 0.01 0.01 0.01 0.01 0.01 12 0.01 0.01 0.02 0.01 0.01 13 0.01 0.01 0.01 0.01 0.01 14 0.01 0.02 0.01 0.01 0.01 15 0.02 0.03 0.01 0.02 0.02 Total average 0.02
Table H6 : Measurements of air velocity at Office A – Level 2.
Office - Level / Department
Sampling Point
V (m/s) 0.1 m 0.6 m 1.1 m 1.7 m Average
A 1 0.03 0.02 0.02 0.02 0.02- Level 2 2 0.03 0.01 0.01 0.03 0.02
3 0.02 0.04 0.04 0.02 0.03 4 0.03 0.02 0.01 0.01 0.02 5 0.02 0.03 0.02 0.02 0.02 6 0.04 0.04 0.04 0.04 0.04 7 0.02 0.02 0.02 0.02 0.02 8 0.07 0.04 0.04 0.08 0.06 9 0.02 0.03 0.02 0.01 0.02 10 0.02 0.03 0.01 0.02 0.02 11 0.03 0.02 0.02 0.02 0.02 12 0.03 0.01 0.01 0.03 0.02 13 0.01 0.03 0.03 0.01 0.02 14 0.03 0.02 0.01 0.01 0.02 15 0.02 0.03 0.02 0.02 0.02 16 0.03 0.01 0.01 0.03 0.02 17 0.04 0.08 0.08 0.04 0.06 Total average 0.03
Univers
ity of
Mala
ya

218
Table H7 : Measurements of relative humidity at Office A – Level 1.
Office - Level / Department
Sampling Point
RH (%) 0.1 m 0.6 m 1.1 m 1.7 m Average
A 1 44.9 45.4 45.6 47.4 45.8- Level 1 2 56.6 56.9 56.8 57.1 56.9
3 57.0 57.5 57.3 57.3 57.3 4 57.8 57.7 58.4 58.2 58.0 5 58.8 58.6 58.6 58.9 58.7 6 60.0 59.7 59.2 59.0 59.5 7 60.6 60.4 60.6 60.3 60.5 8 61.0 60.4 60.1 60.6 60.5 9 60.3 60.5 60.1 61.1 60.5 10 58.8 59.9 60.2 60.3 59.8 11 58.8 59.5 59.7 62.0 60.0 12 58.4 58.7 58.6 59.0 58.7 13 59.5 60.0 59.8 59.8 59.8 14 57.7 57.6 58.4 58.1 57.9 15 58.2 58.0 58.0 58.3 58.1 Total average 58.1
Table H8 : Measurements of relative humidity at Office A – Level 2.
Office - Level / Department
Sampling Point
RH (%) 0.1 m 0.6 m 1.1 m 1.7 m Average
A 1 60.2 60.5 60.4 60.8 60.5- Level 2 2 59.2 59.7 59.5 59.5 59.5
3 59.5 59.4 60.3 60.0 59.8 4 59.5 59.3 59.3 59.6 59.4 5 61.0 60.8 60.2 60.0 60.5 6 61.2 61.0 61.2 60.9 61.1 7 61.7 61.1 60.8 61.3 61.2 8 61.7 61.9 61.5 62.5 61.9 9 60.3 61.4 61.9 62.0 61.4 10 61.1 61.6 61.4 61.4 61.4 11 60.7 60.6 61.5 61.2 61.0 12 61.0 60.8 60.8 61.1 60.9 13 61.5 61.2 60.6 60.4 60.9 14 59.7 59.5 59.7 59.4 59.6 15 60.2 59.6 59.3 59.8 59.7 16 59.6 59.8 59.4 60.4 59.8 17 58.7 59.8 60.3 60.4 59.8 Total average 60.5
Univers
ity of
Mala
ya
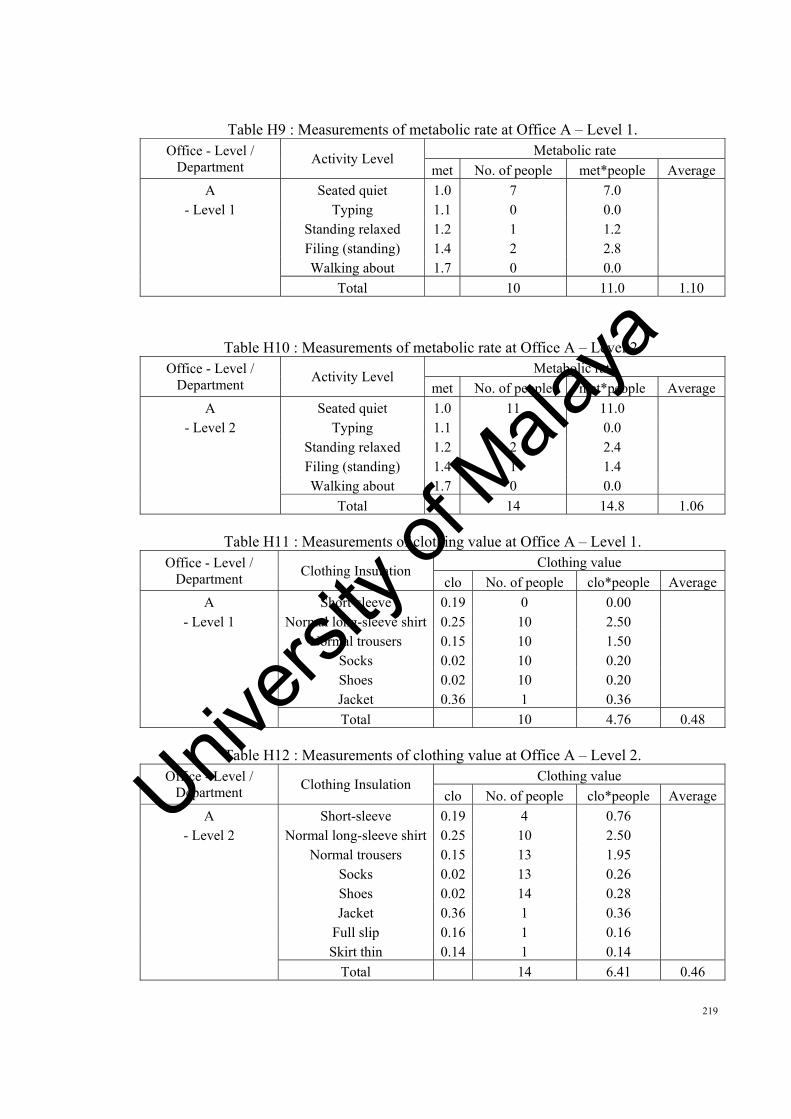
219
Table H9 : Measurements of metabolic rate at Office A – Level 1. Office - Level /
Department Activity Level Metabolic rate met No. of people met*people Average
A Seated quiet 1.0 7 7.0 - Level 1 Typing 1.1 0 0.0
Standing relaxed 1.2 1 1.2 Filing (standing) 1.4 2 2.8 Walking about 1.7 0 0.0
Total 10 11.0 1.10
Table H10 : Measurements of metabolic rate at Office A – Level 2. Office - Level /
Department Activity Level Metabolic rate met No. of people met*people Average
A Seated quiet 1.0 11 11.0 - Level 2 Typing 1.1 0 0.0
Standing relaxed 1.2 2 2.4 Filing (standing) 1.4 1 1.4 Walking about 1.7 0 0.0
Total 14 14.8 1.06
Table H11 : Measurements of clothing value at Office A – Level 1. Office - Level /
Department Clothing Insulation Clothing value clo No. of people clo*people Average
A Short-sleeve 0.19 0 0.00 - Level 1 Normal long-sleeve shirt 0.25 10 2.50
Normal trousers 0.15 10 1.50 Socks 0.02 10 0.20 Shoes 0.02 10 0.20 Jacket 0.36 1 0.36
Total 10 4.76 0.48
Table H12 : Measurements of clothing value at Office A – Level 2. Office - Level /
Department Clothing Insulation Clothing value clo No. of people clo*people Average
A Short-sleeve 0.19 4 0.76 - Level 2 Normal long-sleeve shirt 0.25 10 2.50
Normal trousers 0.15 13 1.95 Socks 0.02 13 0.26 Shoes 0.02 14 0.28 Jacket 0.36 1 0.36 Full slip 0.16 1 0.16 Skirt thin 0.14 1 0.14
Total 14 6.41 0.46
Univers
ity of
Mala
ya

220
Table H13 : Measurements of AMV at Office A – Level 1. Office - Level /
Department Thermal Sensation
Scale Actual Mean Vote
Scale No. of votes Scale*votes Average
A Hot 3 0 0.0 - Level 1 Warm 2 4 8.0
Slightly warm 1 1 1.0 Neutral 0 3 0.0 Slightly cool -1 2 -2.0 Cool -2 0 0.0 Cold -3 0 0.0
Total 10 7.0 0.70
Table H14 : Measurements of AMV at Office A – Level 2. Office - Level /
Department Thermal Sensation
Scale Actual Mean Vote
Scale No. of votes Scale*votes Average
A Hot 3 1 3.0 - Level 2 Warm 2 4 8.0
Slightly warm 1 4 4.0 Neutral 0 4 0.0 Slightly cool -1 1 -1.0 Cool -2 0 0.0 Cold -3 0 0.0
Total 14 14.0 1.00
Table H15 : Measurements of air temperature at Office B – Level 8.
Office - Level / Department
Sampling Point
Tair (oC)
0.1 m 0.6 m 1.1 m 1.7 m Average
B 1 21.8 21.8 21.8 21.7 21.8- Level 8 2 21.8 21.8 21.8 21.8 21.8
3 21.8 21.7 21.7 21.7 21.7 4 22.0 21.9 21.9 21.9 21.9 5 22.3 22.3 22.3 22.1 22.3 6 22.2 22.2 22.2 22.2 22.2 7 22.1 22.1 22.0 22.0 22.1 8 21.2 21.1 21.1 21.1 21.1 9 21.0 21.1 21.1 21.1 21.1 10 21.0 20.9 20.9 20.9 20.9 Total average 21.7
Univers
ity of
Mala
ya

221
Table H16 : Measurements of air temperature at Office B – Level 14.
Office - Level / Department
Sampling Point
Tair (oC)
0.1 m 0.6 m 1.1 m 1.7 m Average
B 1 20.8 20.8 20.8 20.6 20.8- Level 14 2 21.0 20.9 20.9 20.9 20.9
3 20.9 20.9 20.9 20.8 20.9 4 21.2 21.1 21.1 21.1 21.1 5 21.4 21.3 21.3 21.2 21.3 6 21.2 21.2 21.3 21.3 21.3 7 21.0 21.1 21.1 21.0 21.1 8 20.8 20.8 20.8 20.8 20.8 9 20.7 20.5 20.5 20.4 20.5 10 20.5 20.5 20.5 20.5 20.5 11 19.7 19.6 19.6 19.6 19.6 Total average 20.8
Table H17 : Measurements of air temperature at Office B – Level 17.
Office - Level / Department
Sampling Point
Tair (oC)
0.1 m 0.6 m 1.1 m 1.7 m Average
B 1 22.1 22.1 22.0 21.8 22.0- Level 17 2 21.7 21.7 21.7 21.7 21.7
3 21.6 21.7 21.7 21.6 21.7 4 21.2 21.2 21.2 21.3 21.2 5 21.3 21.3 21.3 21.4 21.3 6 21.2 21.3 21.3 21.3 21.3 7 21.3 21.2 21.2 21.2 21.2 8 21.5 21.4 21.4 21.4 21.4 9 21.6 21.8 21.7 21.7 21.7 10 22.2 22.1 22.1 22.1 22.1 11 22.4 22.3 22.3 22.3 22.3 12 22.6 22.5 22.5 22.5 22.5 13 22.7 22.7 22.7 22.7 22.7 14 22.8 22.8 22.8 22.8 22.8 15 22.9 22.8 22.9 22.8 22.9 16 22.6 22.5 22.6 22.5 22.6 17 22.6 22.6 22.6 22.5 22.6 18 22.5 22.6 22.5 22.5 22.5 Total average 22.0
Univers
ity of
Mala
ya

222
Table H18 : Measurements of air temperature at Office B – Level 21.
Office - Level / Department
Sampling Point
Tair (oC)
0.1 m 0.6 m 1.1 m 1.7 m Average
B 1 23.0 23.0 23.1 23.0 23.0- Level 21 2 22.7 22.7 22.8 22.7 22.7
3 22.5 22.6 22.6 22.6 22.6 4 22.4 22.4 22.5 22.5 22.5 Total average 22.7
Table H19 : Measurements of globe temperature at Office B – Level 8.
Office - Level / Department
Sampling Point
Tglobe (oC)
0.1 m 0.6 m 1.1 m 1.7 m Average
B 1 23.2 22.5 22.8 22.8 22.8- Level 8 2 22.6 22.9 22.7 22.9 22.8
3 22.8 22.7 23.1 23.1 22.9 4 23.1 23.1 22.6 23.0 22.9 5 22.5 22.5 22.9 23.2 22.8 6 22.2 22.2 22.7 23.0 22.5 7 22.4 22.2 22.4 22.9 22.4 8 23.2 22.5 22.8 22.8 22.8 9 23.0 23.3 23.1 23.3 23.2 10 22.8 22.7 23.1 23.1 22.9 Total average 22.8
Table H20 : Measurements of globe temperature at Office B – Level 14.
Office - Level / Department
Sampling Point
Tglobe (oC)
0.1 m 0.6 m 1.1 m 1.7 m Average
B 1 22.2 22.6 22.9 23.1 22.7- Level 14 2 22.4 22.6 22.8 22.9 22.7
3 22.4 22.6 22.8 23.2 22.8 4 22.9 22.9 22.8 23.1 22.9 5 22.3 22.5 22.9 23.1 22.7 6 22.1 22.4 22.5 22.4 22.4 7 21.9 22.2 22.5 22.7 22.3 8 22.4 22.7 22.8 22.9 22.7 9 22.4 22.6 22.8 23.2 22.8 10 22.6 22.6 22.5 22.8 22.6 11 22.7 22.9 23.2 23.4 23.1 Total average 22.7
Univers
ity of
Mala
ya

223
Table H21 : Measurements of globe temperature at Office B – Level 17.
Office - Level / Department
Sampling Point
Tglobe (oC)
0.1 m 0.6 m 1.1 m 1.7 m Average
B 1 23.1 22.4 22.7 22.7 22.7- Level 17 2 22.5 22.8 22.6 22.8 22.7
3 22.8 22.6 23.1 23.1 22.9 4 23.2 23.2 22.7 23.2 23.1 5 22.6 22.6 23.0 23.3 22.9 6 22.1 22.1 22.6 22.9 22.4 7 22.3 22.1 22.3 22.7 22.3 8 22.4 22.8 23.1 23.2 22.9 9 22.7 23.0 23.2 23.3 23.1 10 22.7 22.7 22.9 23.3 22.9 11 23.1 23.1 23.0 23.3 23.1 12 22.4 22.6 23.0 23.2 22.8 13 22.6 22.8 22.9 22.8 22.8 14 22.1 22.4 22.6 22.6 22.4 15 22.0 22.2 22.4 22.8 22.4 16 22.3 22.3 22.2 22.5 22.3 17 22.1 22.3 22.7 22.9 22.5 18 22.5 22.6 22.7 22.6 22.6 Total average 22.7
Table H22 : Measurements of globe temperature at Office B – Level 21.
Office - Level / Department
Sampling Point
Tglobe (oC)
0.1 m 0.6 m 1.1 m 1.7 m Average
B 1 23.5 23.8 23.6 23.8 23.7- Level 21 2 23.7 23.6 24.0 24.0 23.8
3 23.8 23.8 23.3 23.6 23.6 4 23.4 23.4 23.8 24.2 23.7 Total average 23.7
Univers
ity of
Mala
ya

224
Table H23 : Measurements of air velocity at Office B – Level 8.
Office - Level / Department
Sampling Point
V (m/s) 0.1 m 0.6 m 1.1 m 1.7 m Average
B 1 0.11 0.13 0.11 0.06 0.10- Level 8 2 0.09 0.14 0.05 0.08 0.09
3 0.08 0.05 0.06 0.05 0.06 4 0.20 0.10 0.10 0.18 0.14 5 0.10 0.21 0.23 0.10 0.16 6 0.10 0.07 0.05 0.05 0.07 7 0.07 0.12 0.07 0.08 0.08 8 0.10 0.10 0.11 0.10 0.10 9 0.12 0.13 0.15 0.13 0.13 10 0.10 0.06 0.05 0.11 0.08 Total average 0.10
Table H24 : Measurements of air velocity at Office B – Level 14.
Office - Level / Department
Sampling Point
V (m/s) 0.1 m 0.6 m 1.1 m 1.7 m Average
B 1 0.06 0.06 0.06 0.06 0.06- Level 14 2 0.14 0.15 0.17 0.15 0.15
3 0.07 0.04 0.04 0.08 0.06 4 0.06 0.06 0.06 0.03 0.05 5 0.06 0.09 0.03 0.05 0.06 6 0.10 0.07 0.09 0.06 0.08 7 0.13 0.06 0.06 0.11 0.09 8 0.06 0.12 0.13 0.06 0.09 9 0.10 0.07 0.05 0.05 0.07 10 0.14 0.07 0.07 0.13 0.10 11 0.09 0.18 0.20 0.09 0.14 Total average 0.09
Table H25 : Measurements of air velocity at Office B – Level 17.
Office - Level / Department
Sampling Point
V (m/s) 0.1 m 0.6 m 1.1 m 1.7 m Average
B 1 0.09 0.14 0.05 0.08 0.09- Level 17 2 0.14 0.10 0.12 0.09 0.11
3 0.11 0.06 0.06 0.10 0.08 4 0.06 0.13 0.14 0.06 0.10 5 0.14 0.10 0.07 0.07 0.10 6 0.10 0.16 0.10 0.13 0.12 7 0.04 0.04 0.04 0.04 0.04 8 0.07 0.08 0.09 0.08 0.08
Univers
ity of
Mala
ya

225
9 0.11 0.07 0.06 0.12 0.09 10 0.08 0.09 0.08 0.04 0.07 11 0.06 0.09 0.03 0.05 0.06 12 0.13 0.09 0.11 0.08 0.10 13 0.11 0.06 0.06 0.10 0.08 14 0.05 0.10 0.11 0.05 0.08 15 0.14 0.11 0.07 0.06 0.10 16 0.02 0.03 0.02 0.02 0.02 17 0.10 0.11 0.10 0.05 0.09 18 0.06 0.09 0.03 0.05 0.06 Total average 0.08
Table H26 : Measurements of air velocity at Office B – Level 21.
Office - Level / Department
Sampling Point
V (m/s) 0.1 m 0.6 m 1.1 m 1.7 m Average
B 1 0.07 0.04 0.04 0.08 0.06- Level 21 2 0.07 0.08 0.07 0.03 0.06
3 0.07 0.11 0.04 0.06 0.07 4 0.09 0.06 0.08 0.06 0.07 Total average 0.07
Table H27 : Measurements of relative humidity at Office B – Level 8.
Office - Level / Department
Sampling Point
RH (%) 0.1 m 0.6 m 1.1 m 1.7 m Average
B 1 52.0 52.2 52.1 52.5 52.2- Level 8 2 52.3 52.7 52.5 52.5 52.5
3 52.3 52.2 52.9 52.7 52.5 4 52.3 52.1 52.1 52.4 52.2 5 51.9 51.6 51.1 51.0 51.4 6 51.2 51.0 51.2 51.0 51.1 7 51.2 50.7 50.5 50.9 50.8 8 50.9 51.1 50.8 51.6 51.1 9 52.0 53.0 53.4 53.5 53.0 10 54.1 53.8 53.3 53.1 53.6 Total average 52.0
Univers
ity of
Mala
ya

226
Table H28 : Measurements of relative humidity at Office B – Level 14.
Office - Level / Department
Sampling Point
RH (%) 0.1 m 0.6 m 1.1 m 1.7 m Average
B 1 53.6 53.6 54.3 54.1 53.9- Level 14 2 53.2 53.0 53.0 53.3 53.1
3 53.5 53.2 52.7 52.6 53.0 4 53.3 53.1 53.3 53.0 53.2 5 53.7 53.2 52.9 53.4 53.3 6 53.0 53.2 52.8 53.7 53.2 7 52.1 53.1 53.5 53.6 53.1 8 52.0 52.7 52.8 54.9 53.1 9 53.1 53.3 53.2 53.6 53.3 10 53.2 53.6 53.4 53.4 53.4 11 53.3 53.3 54.0 53.8 53.6 Total average 53.3
Table H29 : Measurements of relative humidity at Office B – Level 17.
Office - Level / Department
Sampling Point
RH (%) 0.1 m 0.6 m 1.1 m 1.7 m Average
B 1 57.9 57.8 58.7 58.4 58.2- Level 17 2 58.3 58.1 58.1 58.4 58.2
3 58.5 58.2 57.7 57.5 58.0 4 59.6 59.4 59.6 59.3 59.5 5 60.0 59.4 59.1 59.6 59.5 6 61.3 61.5 61.1 62.1 61.5 7 61.9 63.0 63.5 63.6 63.0 8 62.0 62.8 63.0 65.5 63.3 9 64.3 64.6 64.5 64.9 64.6 10 64.2 64.7 64.5 64.5 64.5 11 63.1 63.0 63.9 63.6 63.4 12 62.7 62.5 62.5 62.8 62.6 13 62.9 62.6 62.0 61.8 62.3 14 62.4 62.2 62.4 62.1 62.3 15 64.0 63.4 63.1 63.6 63.5 16 64.2 64.4 64.0 65.0 64.4 17 63.0 64.2 64.7 64.8 64.2 18 64.8 64.5 63.9 63.7 64.2 Total average 62.1
Univers
ity of
Mala
ya

227
Table H30 : Measurements of relative humidity at Office B – Level 21.
Office - Level / Department
Sampling Point
RH (%) 0.1 m 0.6 m 1.1 m 1.7 m Average
B 1 59.5 59.3 59.3 59.6 59.4- Level 21 2 60.4 60.2 59.6 59.4 59.9
3 60.5 60.3 60.5 60.2 60.4 4 61.5 60.9 60.6 61.1 61.0 Total average 60.2
Table H31 : Measurements of metabolic rate at Office B – Level 8. Office - Level /
Department Activity Level Metabolic rate met No. of people met*people Average
B Seated quiet 1.0 7 7.0 - Level 8 Typing 1.1 11 12.1
Standing relaxed 1.2 4 4.8 Filing (standing) 1.4 3 4.2 Walking about 1.7 0 0.0
Total 25 28.1 1.12
Table H32 : Measurements of metabolic rate at Office B – Level 14. Office - Level /
Department Activity Level Metabolic rate met No. of people met*people Average
B Seated quiet 1.0 5 5.0 - Level 14 Typing 1.1 5 5.5
Standing relaxed 1.2 1 1.2 Filing (standing) 1.4 0 0.0 Walking about 1.7 0 0.0
Total 11 11.7 1.06
Table H33 : Measurements of metabolic rate at Office B – Level 17. Office - Level /
Department Activity Level Metabolic rate met No. of people met*people Average
B Seated quiet 1.0 5 5.0 - Level 17 Typing 1.1 16 17.6
Standing relaxed 1.2 2 2.4 Filing (standing) 1.4 0 0.0 Walking about 1.7 0 0.0
Total 23 25.0 1.09
Univers
ity of
Mala
ya

228
Table H34 : Measurements of metabolic rate at Office B – Level 21. Office - Level /
Department Activity Level Metabolic rate met No. of people met*people Average
B Seated quiet 1.0 4 4.0 - Level 21 Typing 1.1 1 1.1
Standing relaxed 1.2 0 0.0 Filing (standing) 1.4 0 0.0 Walking about 1.7 1 1.7
Total 6 6.8 1.13
Table H35 : Measurements of clothing value at Office B – Level 8. Office - Level /
Department Clothing Insulation Clothing value clo No. of people clo*people Average
B Short-sleeve 0.19 4 0.76 - Level 8 Normal long-sleeve shirt 0.25 21 5.25
Normal trousers 0.15 25 3.75 Socks 0.02 25 0.50 Shoes 0.02 25 0.50 Jacket 0.36 0 0.00 Full slip 0.16 0 0.00 Skirt thin 0.14 0 0.00
Total 25 10.76 0.43
Table H36 : Measurements of clothing value at Office B – Level 14. Office - Level /
Department Clothing Insulation Clothing value clo No. of people clo*people Average
B Short-sleeve 0.19 0 0.00 - Level 14 Normal long-sleeve shirt 0.25 11 2.75
Normal trousers 0.15 11 1.65 Socks 0.02 11 0.22 Shoes 0.02 11 0.22 Jacket 0.36 2 0.72 Full slip 0.16 0 0.00 Skirt thin 0.14 0 0.00
Total 11 5.56 0.51
Univers
ity of
Mala
ya
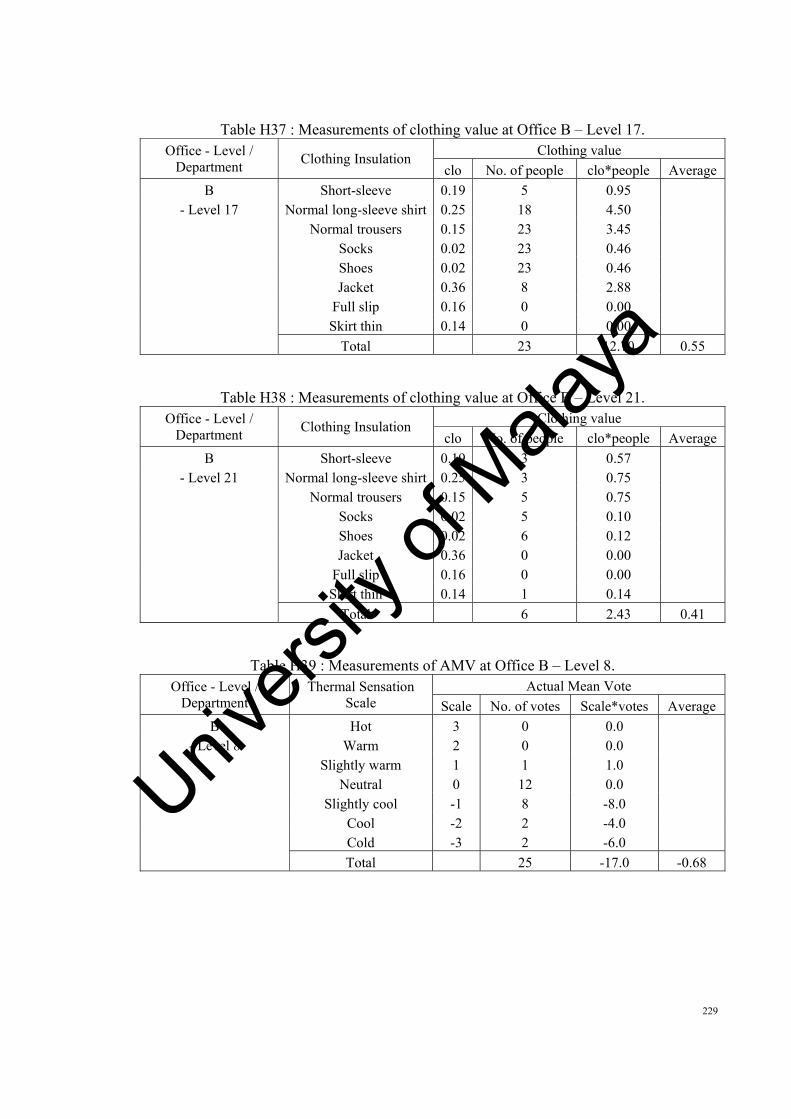
229
Table H37 : Measurements of clothing value at Office B – Level 17. Office - Level /
Department Clothing Insulation Clothing value clo No. of people clo*people Average
B Short-sleeve 0.19 5 0.95 - Level 17 Normal long-sleeve shirt 0.25 18 4.50
Normal trousers 0.15 23 3.45 Socks 0.02 23 0.46 Shoes 0.02 23 0.46 Jacket 0.36 8 2.88 Full slip 0.16 0 0.00 Skirt thin 0.14 0 0.00
Total 23 12.70 0.55
Table H38 : Measurements of clothing value at Office B – Level 21. Office - Level /
Department Clothing Insulation Clothing value clo No. of people clo*people Average
B Short-sleeve 0.19 3 0.57 - Level 21 Normal long-sleeve shirt 0.25 3 0.75
Normal trousers 0.15 5 0.75 Socks 0.02 5 0.10 Shoes 0.02 6 0.12 Jacket 0.36 0 0.00 Full slip 0.16 0 0.00 Skirt thin 0.14 1 0.14
Total 6 2.43 0.41
Table H39 : Measurements of AMV at Office B – Level 8. Office - Level /
Department Thermal Sensation
Scale Actual Mean Vote
Scale No. of votes Scale*votes Average
B Hot 3 0 0.0 - Level 8 Warm 2 0 0.0
Slightly warm 1 1 1.0 Neutral 0 12 0.0 Slightly cool -1 8 -8.0 Cool -2 2 -4.0 Cold -3 2 -6.0
Total 25 -17.0 -0.68
Univers
ity of
Mala
ya

230
Table H40 : Measurements of AMV at Office B – Level 14. Office - Level /
Department Thermal Sensation
Scale Actual Mean Vote
Scale No. of votes Scale*votes Average
B Hot 3 0 0.0 - Level 14 Warm 2 1 2.0
Slightly warm 1 1 1.0 Neutral 0 2 0.0 Slightly cool -1 2 -2.0 Cool -2 4 -8.0 Cold -3 1 -3.0
Total 11 -10.0 -0.91
Table H41 : Measurements of AMV at Office B – Level 17. Office - Level /
Department Thermal Sensation
Scale Actual Mean Vote
Scale No. of votes Scale*votes Average
B Hot 3 0 0.0 - Level 17 Warm 2 0 0.0
Slightly warm 1 0 0.0 Neutral 0 14 0.0 Slightly cool -1 5 -5.0 Cool -2 4 -8.0 Cold -3 0 0.0
Total 23 -13.0 -0.57
Table H42 : Measurements of AMV at Office B – Level 21. Office - Level /
Department Thermal Sensation
Scale Actual Mean Vote
Scale No. of votes Scale*votes Average
B Hot 3 0 0.0 - Level 21 Warm 2 0 0.0
Slightly warm 1 1 1.0 Neutral 0 3 0.0 Slightly cool -1 2 -2.0 Cool -2 0 0.0 Cold -3 0 0.0
Total 6 -1.0 -0.17
Univers
ity of
Mala
ya

231
Table H43 : Measurements of air temperature at Office C – Ground Floor.
Office - Level / Department
Sampling Point
Tair (oC)
0.1 m 0.6 m 1.1 m 1.7 m Average
C 1 23.5 23.4 23.4 23.4 23.4- Ground Floor 2 23.6 23.7 23.8 23.9 23.8
3 24.0 24.0 24.1 24.0 24.0 4 24.0 24.0 24.1 24.0 24.0 5 23.9 23.8 23.9 24.0 23.9 6 23.0 23.0 23.0 23.0 23.0 7 23.3 23.2 23.2 23.2 23.2 8 23.6 23.6 23.7 23.7 23.7 9 26.0 26.3 26.1 26.1 26.1 10 26.0 26.0 26.1 26.1 26.1 11 25.1 25.1 25.1 25.1 25.1 12 25.0 25.1 25.0 25.0 25.0 13 24.8 24.7 24.7 24.8 24.8 14 25.0 25.0 25.1 25.1 25.1 15 25.2 25.4 25.4 25.4 25.4 Total average 24.4
Table H44 : Measurements of air temperature at Office C – Level 1.
Office - Level / Department
Sampling Point
Tair (oC)
0.1 m 0.6 m 1.1 m 1.7 m Average
C 1 23.8 23.7 23.5 23.5 23.6- Level 1 2 23.1 23.1 23.3 23.4 23.2
3 23.7 23.7 23.8 23.8 23.8 4 23.6 23.5 23.6 23.5 23.6 5 23.1 23.1 23.1 23.1 23.1 6 22.8 23.0 23.0 23.0 23.0 7 23.0 22.9 22.9 22.9 22.9 8 22.9 23.2 23.2 23.4 23.2 9 22.6 22.7 22.7 22.9 22.7 10 22.9 23.1 23.0 23.1 23.0 11 23.5 23.5 23.6 23.6 23.6 12 23.3 23.3 23.3 23.4 23.3 13 23.2 23.3 23.3 23.2 23.3 14 22.8 22.9 23.0 23.1 23.0 15 23.2 23.1 23.3 23.4 23.3 16 22.9 23.0 22.9 22.9 22.9 Total average 23.2
Univers
ity of
Mala
ya

232
Table H45 : Measurements of globe temperature at Office C – Ground Floor.
Office - Level / Department
Sampling Point
Tglobe (oC)
0.1 m 0.6 m 1.1 m 1.7 m Average
C 1 26.3 26.5 26.2 26.2 26.3- Ground Floor 2 25.3 25.8 26.2 26.2 25.9
3 25.7 25.9 25.8 25.9 25.8 4 25.5 25.7 26.0 26.0 25.8 5 25.6 25.7 25.9 26.1 25.8 6 25.5 25.9 26.0 26.0 25.8 7 25.7 25.9 25.6 25.6 25.7 8 25.1 25.6 26.1 26.1 25.7 9 25.5 25.7 25.6 25.7 25.6 10 25.4 25.6 25.9 25.9 25.7 11 25.5 25.6 25.8 26.0 25.7 12 25.4 25.8 25.9 25.9 25.7 13 25.6 25.7 25.8 25.8 25.7 14 25.3 25.5 25.8 25.7 25.6 15 25.4 25.5 25.7 25.9 25.6 Total average 25.8
Table H46 : Measurements of globe temperature at Office C – Level 1.
Office - Level / Department
Sampling Point
Tglobe (oC)
0.1 m 0.6 m 1.1 m 1.7 m Average
C 1 27.8 26.9 27.3 27.3 27.3- Level 1 2 26.7 27.1 26.9 27.1 27.0
3 26.3 26.1 26.7 26.7 26.4 4 26.4 26.4 25.9 26.3 26.2 5 25.6 25.6 26.1 26.5 26.0 6 25.5 25.5 26.0 26.4 25.8 7 26.2 25.3 25.7 25.7 25.7 8 25.2 25.6 25.4 25.6 25.5 9 24.9 24.7 25.3 25.3 25.0 10 25.1 25.1 24.6 25.0 24.9 11 24.6 24.6 25.1 25.5 25.0 12 24.7 24.7 25.2 25.5 25.0 13 24.6 25.0 24.8 25.0 24.9 14 24.8 24.6 25.2 25.2 24.9 15 25.1 25.1 24.6 25.0 24.9 16 24.5 24.5 25.0 25.4 24.9 Total average 25.6
Univers
ity of
Mala
ya
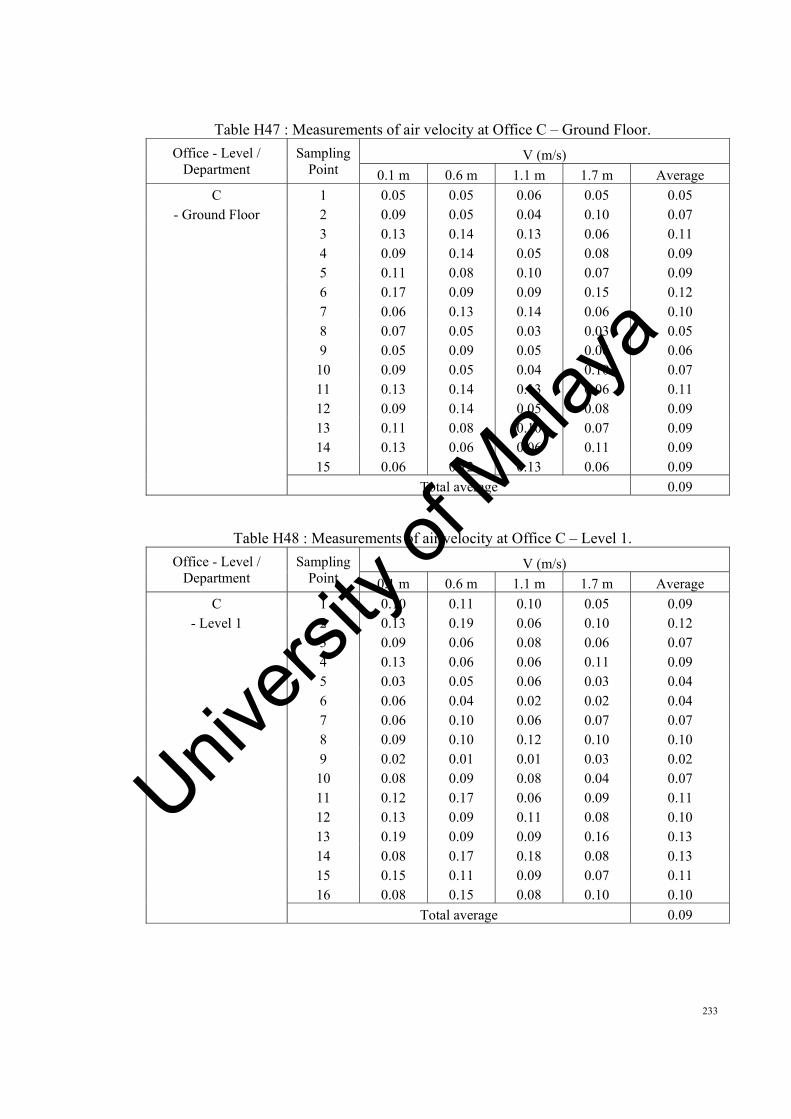
233
Table H47 : Measurements of air velocity at Office C – Ground Floor.
Office - Level / Department
Sampling Point
V (m/s) 0.1 m 0.6 m 1.1 m 1.7 m Average
C 1 0.05 0.05 0.06 0.05 0.05- Ground Floor 2 0.09 0.05 0.04 0.10 0.07
3 0.13 0.14 0.13 0.06 0.11 4 0.09 0.14 0.05 0.08 0.09 5 0.11 0.08 0.10 0.07 0.09 6 0.17 0.09 0.09 0.15 0.12 7 0.06 0.13 0.14 0.06 0.10 8 0.07 0.05 0.03 0.03 0.05 9 0.05 0.09 0.05 0.06 0.06 10 0.09 0.05 0.04 0.10 0.07 11 0.13 0.14 0.13 0.06 0.11 12 0.09 0.14 0.05 0.08 0.09 13 0.11 0.08 0.10 0.07 0.09 14 0.13 0.06 0.06 0.11 0.09 15 0.06 0.12 0.13 0.06 0.09 Total average 0.09
Table H48 : Measurements of air velocity at Office C – Level 1.
Office - Level / Department
Sampling Point
V (m/s) 0.1 m 0.6 m 1.1 m 1.7 m Average
C 1 0.10 0.11 0.10 0.05 0.09- Level 1 2 0.13 0.19 0.06 0.10 0.12
3 0.09 0.06 0.08 0.06 0.07 4 0.13 0.06 0.06 0.11 0.09 5 0.03 0.05 0.06 0.03 0.04 6 0.06 0.04 0.02 0.02 0.04 7 0.06 0.10 0.06 0.07 0.07 8 0.09 0.10 0.12 0.10 0.10 9 0.02 0.01 0.01 0.03 0.02 10 0.08 0.09 0.08 0.04 0.07 11 0.12 0.17 0.06 0.09 0.11 12 0.13 0.09 0.11 0.08 0.10 13 0.19 0.09 0.09 0.16 0.13 14 0.08 0.17 0.18 0.08 0.13 15 0.15 0.11 0.09 0.07 0.11 16 0.08 0.15 0.08 0.10 0.10 Total average 0.09
Univers
ity of
Mala
ya

234
Table H49 : Measurements of relative humidity at Office C – Ground Floor.
Office - Level / Department
Sampling Point
RH (%) 0.1 m 0.6 m 1.1 m 1.7 m Average
C 1 43.7 43.5 43.1 42.9 43.3- Ground Floor 2 47.9 47.7 47.9 47.7 47.8
3 48.4 47.9 47.7 48.1 48.0 4 48.0 48.2 47.9 48.6 48.2 5 47.4 48.3 48.7 48.8 48.3 6 47.5 48.1 48.3 50.2 48.5 7 48.5 48.7 48.6 49.0 48.7 8 48.8 49.2 49.0 49.0 49.0 9 49.3 49.2 49.9 49.7 49.5 10 49.8 49.6 49.6 49.9 49.7 11 50.5 50.2 49.7 49.6 50.0 12 50.3 50.1 50.3 50.1 50.2 13 50.8 50.3 50.1 50.5 50.4 14 50.4 50.6 50.3 51.1 50.6 15 50.0 50.9 51.3 51.4 50.9 Total average 48.9
Table H50 : Measurements of relative humidity at Office C – Level 1.
Office - Level / Department
Sampling Point
RH (%) 0.1 m 0.6 m 1.1 m 1.7 m Average
C 1 41.4 41.8 41.6 41.6 41.6- Level 1 2 42.2 42.1 42.8 42.5 42.4
3 43.3 43.1 43.1 43.4 43.2 4 43.4 43.2 42.8 42.6 43.0 5 42.0 41.8 42.0 41.8 41.9 6 43.6 43.2 43.0 43.4 43.3 7 42.0 42.1 41.8 42.5 42.1 8 42.0 42.8 43.2 43.2 42.8 9 42.4 42.8 42.6 42.6 42.6 10 41.6 41.5 42.1 41.9 41.8 11 43.9 43.7 43.7 44.0 43.8 12 49.1 48.9 48.4 48.3 48.7 13 49.7 49.5 49.7 49.5 49.6 14 47.4 46.9 46.7 47.1 47.0 15 46.7 46.9 46.6 47.3 46.9 16 45.9 46.7 47.1 47.2 46.7 Total average 44.2
Univers
ity of
Mala
ya

235
Table H51 : Measurements of metabolic rate at Office C – Ground Floor. Office - Level /
Department Activity Level Metabolic rate met No. of people met*people Average
C Seated quiet 1.0 2 2.0 - Ground Floor Typing 1.1 28 30.8
Standing relaxed 1.2 2 2.4 Filing (standing) 1.4 1 1.4 Walking about 1.7 0 0.0
Total 33 36.6 1.11
Table H52 : Measurements of metabolic rate at Office C – Level 1. Office - Level /
Department Activity Level Metabolic rate met No. of people met*people Average
C Seated quiet 1.0 0 0.0 - Level 1 Typing 1.1 28 30.8
Standing relaxed 1.2 1 1.2 Filing (standing) 1.4 1 1.4 Walking about 1.7 3 5.1
Total 33 38.5 1.17
Table H53 : Measurements of clothing value at Office C – Ground Floor. Office - Level /
Department Clothing Insulation Clothing value clo No. of people clo*people Average
C Short-sleeve 0.19 1 0.19 - Ground Floor Normal long-sleeve shirt 0.25 32 8.00
Normal trousers 0.15 33 4.95 Socks 0.02 33 0.66 Shoes 0.02 33 0.66 Jacket 0.36 33 11.88
Total 33 26.34 0.80
Table H54 : Measurements of clothing value at Office C – Level 1. Office - Level /
Department Clothing Insulation Clothing value clo No. of people clo*people Average
C Short-sleeve 0.19 8 1.52 - Level 1 Normal long-sleeve shirt 0.25 25 6.25
Normal trousers 0.15 31 4.65 Socks 0.02 31 0.62 Shoes 0.02 33 0.66 Jacket 0.36 27 9.72 Full slip 0.16 0 0.00 Skirt thin 0.14 2 0.28
Total 33 23.70 0.72
Univers
ity of
Mala
ya
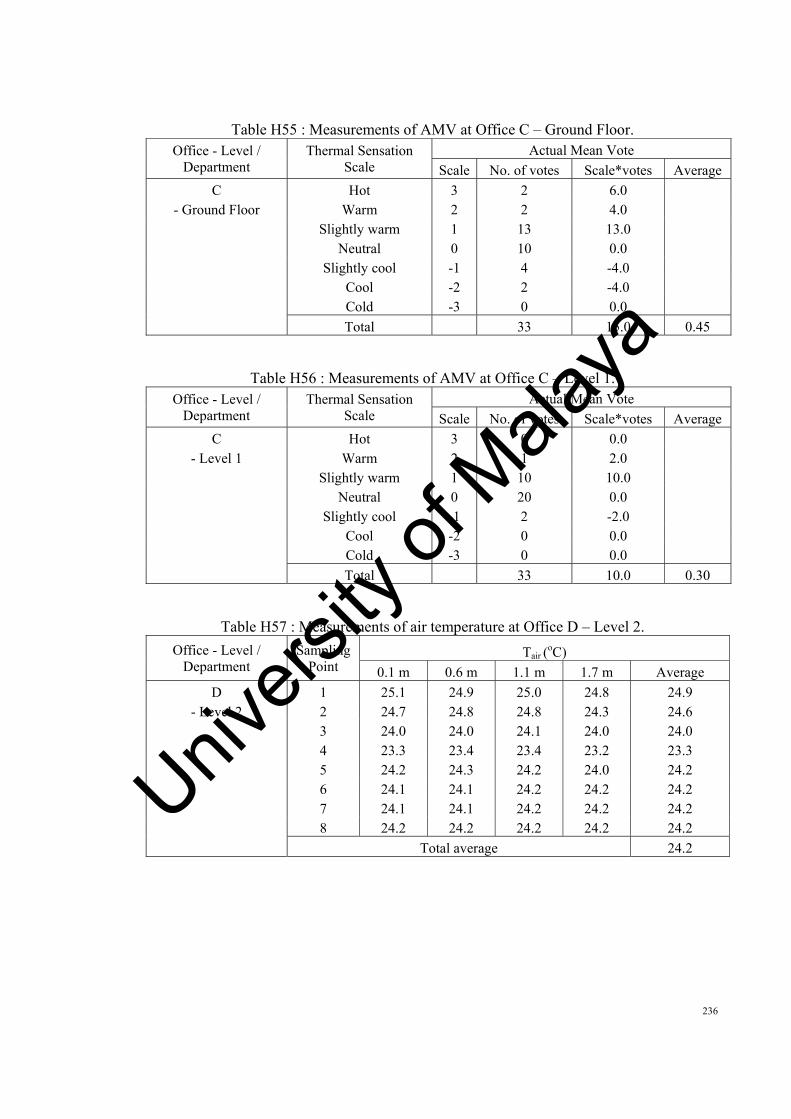
236
Table H55 : Measurements of AMV at Office C – Ground Floor. Office - Level /
Department Thermal Sensation
Scale Actual Mean Vote
Scale No. of votes Scale*votes Average
C Hot 3 2 6.0 - Ground Floor Warm 2 2 4.0
Slightly warm 1 13 13.0 Neutral 0 10 0.0 Slightly cool -1 4 -4.0 Cool -2 2 -4.0 Cold -3 0 0.0
Total 33 15.0 0.45
Table H56 : Measurements of AMV at Office C – Level 1. Office - Level /
Department Thermal Sensation
Scale Actual Mean Vote
Scale No. of votes Scale*votes Average
C Hot 3 0 0.0 - Level 1 Warm 2 1 2.0
Slightly warm 1 10 10.0 Neutral 0 20 0.0 Slightly cool -1 2 -2.0 Cool -2 0 0.0 Cold -3 0 0.0
Total 33 10.0 0.30
Table H57 : Measurements of air temperature at Office D – Level 2.
Office - Level / Department
Sampling Point
Tair (oC)
0.1 m 0.6 m 1.1 m 1.7 m Average
D 1 25.1 24.9 25.0 24.8 24.9- Level 2 2 24.7 24.8 24.8 24.3 24.6
3 24.0 24.0 24.1 24.0 24.0 4 23.3 23.4 23.4 23.2 23.3 5 24.2 24.3 24.2 24.0 24.2 6 24.1 24.1 24.2 24.2 24.2 7 24.1 24.1 24.2 24.2 24.2 8 24.2 24.2 24.2 24.2 24.2 Total average 24.2
Univers
ity of
Mala
ya

237
Table H58 : Measurements of air temperature at Office D – Level 4.
Office - Level / Department
Sampling Point
Tair (oC)
0.1 m 0.6 m 1.1 m 1.7 m Average
D 1 25.1 24.9 25.0 24.8 24.9- Level 4 2 24.7 24.8 24.8 24.8 24.8
3 24.7 24.8 24.8 24.8 24.8 4 24.2 24.3 24.2 24.0 24.2 5 24.0 24.0 24.1 23.5 23.9 6 23.4 23.4 23.4 23.2 23.4 7 23.1 23.1 23.1 23.2 23.1 8 23.3 23.4 23.4 23.3 23.4 9 23.1 23.1 23.2 23.1 23.1 10 23.3 23.4 23.6 23.4 23.4 Total average 23.9
Table H59 : Measurements of globe temperature at Office D – Level 2.
Office - Level / Department
Sampling Point
Tglobe (oC)
0.1 m 0.6 m 1.1 m 1.7 m Average
D 1 25.4 24.5 24.9 24.9 24.9- Level 2 2 24.4 24.8 24.5 24.8 24.6
3 23.9 23.8 24.2 24.3 24.0 4 23.5 23.5 23.0 23.5 23.3 5 23.8 23.8 24.3 24.7 24.2 6 23.9 23.9 24.4 24.7 24.2 7 24.4 24.2 23.9 24.4 24.2 8 23.9 23.9 24.4 24.7 24.2 Total average 24.2
Table H60 : Measurements of globe temperature at Office D – Level 4.
Office - Level / Department
Sampling Point
Tglobe (oC)
0.1 m 0.6 m 1.1 m 1.7 m Average
D 1 24.8 24.7 25.0 25.2 24.9- Level 4 2 25.0 25.0 24.5 25.0 24.8
3 24.4 24.4 25.0 25.2 24.8 4 23.9 23.9 24.4 24.7 24.2 5 24.3 23.5 23.9 23.9 23.9 6 23.1 23.5 23.3 23.5 23.4 7 23.0 22.9 23.4 23.4 23.1 8 23.5 23.5 23.1 23.5 23.4 9 22.8 22.8 23.3 23.6 23.1 10 23.1 23.1 23.6 23.9 23.4 Total average 23.9
Univers
ity of
Mala
ya

238
Table H61 : Measurements of air velocity at Office D – Level 2.
Office - Level / Department
Sampling Point
V (m/s) 0.1 m 0.6 m 1.1 m 1.7 m Average
D 1 0.03 0.03 0.03 0.03 0.03- Level 2 2 0.02 0.04 0.02 0.04 0.03
3 0.02 0.01 0.04 0.09 0.04 4 0.03 0.03 0.04 0.05 0.04 5 0.04 0.05 0.05 0.05 0.05 6 0.01 0.03 0.10 0.10 0.06 7 0.02 0.05 0.03 0.09 0.05 8 0.03 0.03 0.02 0.03 0.03 Total average 0.04
Table H62 : Measurements of air velocity at Office D – Level 4.
Office - Level / Department
Sampling Point
V (m/s) 0.1 m 0.6 m 1.1 m 1.7 m Average
D 1 0.02 0.01 0.03 0.01 0.02- Level 4 2 0.03 0.03 0.03 0.04 0.03
3 0.02 0.01 0.04 0.02 0.02 4 0.02 0.02 0.03 0.02 0.02 5 0.04 0.04 0.04 0.05 0.04 6 0.03 0.04 0.03 0.03 0.03 7 0.03 0.04 0.02 0.03 0.03 8 0.04 0.04 0.05 0.04 0.04 9 0.03 0.02 0.01 0.04 0.02 10 0.02 0.04 0.04 0.04 0.04 Total average 0.03
Table H63 : Measurements of relative humidity at Office D – Level 2.
Office - Level / Department
Sampling Point
RH (%) 0.1 m 0.6 m 1.1 m 1.7 m Average
D 1 51.2 51.5 53.2 51.7 51.9- Level 2 2 52.7 52.8 52.8 52.7 52.8
3 53.7 54.5 54.2 52.8 53.8 4 53.0 53.4 53.2 53.5 53.3 5 52.3 53.3 53.2 52.1 52.7 6 52.2 53.8 53.0 52.7 52.9 7 52.7 53.1 53.2 52.7 52.9 8 53.0 53.5 53.6 53.2 53.3 Total average 53.0
Univers
ity of
Mala
ya

239
Table H64 : Measurements of relative humidity at Office D – Level 4.
Office - Level / Department
Sampling Point
RH (%) 0.1 m 0.6 m 1.1 m 1.7 m Average
D 1 50.6 51.0 51.8 50.7 51.0- Level 4 2 51.7 52.2 52.0 52.6 52.1
3 53.3 53.3 53.6 53.1 53.3 4 52.5 53.8 53.0 52.7 53.0 5 52.4 53.4 54.3 53.5 53.4 6 53.3 53.5 53.6 53.7 53.5 7 54.0 54.5 54.2 53.9 54.2 8 53.0 53.1 53.2 52.9 53.1 9 52.6 52.8 52.8 52.8 52.8 10 52.2 52.4 52.7 52.1 52.4 Total average 52.9
Table H65 : Measurements of metabolic rate at Office D – Level 2. Office - Level /
Department Activity Level Metabolic rate met No. of people met*people Average
D Seated quiet 1.0 0 0.0 - Level 2 Typing 1.1 1 1.1
Standing relaxed 1.2 1 1.2 Filing (standing) 1.4 2 2.8 Walking about 1.7 2 3.4
Total 6 8.5 1.42
Table H66 : Measurements of metabolic rate at Office D – Level 4. Office - Level /
Department Activity Level Metabolic rate met No. of people met*people Average
D Seated quiet 1.0 0 0.0 - Level 4 Typing 1.1 1 1.1
Standing relaxed 1.2 8 9.6 Filing (standing) 1.4 1 1.4 Walking about 1.7 0 0.0
Total 10 12.1 1.21
Univers
ity of
Mala
ya

240
Table H67 : Measurements of clothing value at Office D – Level 2. Office - Level /
Department Clothing Insulation Clothing value clo No. of people clo*people Average
D Short-sleeve 0.19 0 0.00 - Level 2 Normal long-sleeve shirt 0.25 6 1.50
Normal trousers 0.15 6 0.90 Socks 0.02 3 0.06 Shoes 0.02 6 0.12 Jacket 0.36 0 0.00
Total 6 2.58 0.43
Table H68 : Measurements of clothing value at Office D – Level 4. Office - Level /
Department Clothing Insulation Clothing value clo No. of people clo*people Average
D Short-sleeve 0.19 0 0.00 - Level 4 Normal long-sleeve shirt 0.25 10 2.50
Normal trousers 0.15 9 1.35 Socks 0.02 2 0.04 Shoes 0.02 10 0.20 Jacket 0.36 5 1.80 Full slip 0.16 0 0.00 Skirt thin 0.14 1 0.14
Total 10 6.03 0.60
Table H69 : Measurements of AMV at Office D – Level 2. Office - Level /
Department Thermal Sensation
Scale Actual Mean Vote
Scale No. of votes Scale*votes Average
D Hot 3 0 0.0 - Level 2 Warm 2 0 0.0
Slightly warm 1 1 1.0 Neutral 0 4 0.0 Slightly cool -1 0 0.0 Cool -2 1 -2.0 Cold -3 0 0.0
Total 6 -1.0 -0.17
Univers
ity of
Mala
ya

241
Table H70 : Measurements of AMV at Office D – Level 4. Office - Level /
Department Thermal Sensation
Scale Actual Mean Vote
Scale No. of votes Scale*votes Average
D Hot 3 0 0.0 - Level 4 Warm 2 0 0.0
Slightly warm 1 2 2.0 Neutral 0 5 0.0 Slightly cool -1 2 -2.0 Cool -2 1 -2.0 Cold -3 0 0.0
Total 10 -2.0 -0.20
Table H71 : Measurements of air temperature at Office E – HR Department.
Office - Level / Department
Sampling Point
Tair (oC)
0.1 m 0.6 m 1.1 m 1.7 m Average
E 1 23.6 23.3 23.2 23.2 23.3- Human Resource 2 23.1 23.2 22.9 22.7 23.0
Department 3 22.9 22.6 22.5 22.7 22.7 4 22.7 22.8 22.8 22.9 22.8 5 23.0 22.9 22.9 22.9 22.9 Total average 22.9
Table H72 : Measurements of air temperature at Office E – Corporate Department.
Office - Level / Department
Sampling Point
Tair (oC)
0.1 m 0.6 m 1.1 m 1.7 m Average
E 1 22.8 22.8 22.8 22.8 22.8- Corporate 2 22.6 22.5 22.6 22.6 22.6Department 3 22.8 22.9 22.9 22.9 22.9
4 22.4 22.5 22.3 22.1 22.3 5 22.5 22.7 22.8 22.7 22.7 Total average 22.7
Table H73 : Measurements of globe temperature at Office E – HR Department.
Office - Level / Department
Sampling Point
Tglobe (oC)
0.1 m 0.6 m 1.1 m 1.7 m Average
E 1 24.3 24.6 24.4 24.6 24.5- Human Resource 2 24.2 24.1 24.5 24.5 24.3
Department 3 24.4 24.4 23.9 24.2 24.2 4 23.6 23.6 24.0 24.4 23.9 5 23.5 23.5 24.0 24.3 23.8 Total average 24.1
Univers
ity of
Mala
ya

242
Table H74 : Measurements of globe temperature at Office E – Corporate Department.
Office - Level / Department
Sampling Point
Tglobe (oC)
0.1 m 0.6 m 1.1 m 1.7 m Average
E 1 23.7 23.0 23.3 23.3 23.3- Corporate 2 23.2 23.5 23.3 23.5 23.4Department 3 23.3 23.2 23.6 23.6 23.4
4 23.6 23.5 23.1 23.6 23.4 5 23.0 23.0 23.4 23.8 23.3 Total average 23.4
Table H75 : Measurements of air velocity at Office E – HR Department.
Office - Level / Department
Sampling Point
V (m/s) 0.1 m 0.6 m 1.1 m 1.7 m Average
E 1 0.03 0.06 0.07 0.03 0.05- Human Resource 2 0.06 0.04 0.02 0.02 0.04
Department 3 0.03 0.06 0.03 0.04 0.04 4 0.05 0.06 0.07 0.06 0.06 5 0.07 0.04 0.04 0.08 0.06 Total average 0.05
Table H76 : Measurements of air velocity at Office E – Corporate Department.
Office - Level / Department
Sampling Point
V (m/s) 0.1 m 0.6 m 1.1 m 1.7 m Average
E 1 0.04 0.02 0.02 0.04 0.03- Corporate 2 0.05 0.05 0.05 0.02 0.04Department 3 0.03 0.05 0.02 0.03 0.03
4 0.04 0.03 0.03 0.02 0.03 5 0.06 0.03 0.03 0.05 0.04 Total average 0.03
Table H77 : Measurements of relative humidity at Office E – HR Department.
Office - Level / Department
Sampling Point
RH (%) 0.1 m 0.6 m 1.1 m 1.7 m Average
E 1 60.8 60.6 60.0 59.8 60.3- Human Resource 2 61.2 61.0 61.2 60.9 61.1
Department 3 62.5 61.9 61.6 62.1 62.0 4 63.1 63.3 62.9 63.9 63.3 5 61.7 62.8 63.3 63.4 62.8 Total average 61.9
Univers
ity of
Mala
ya

243
Table H78 : Measurements of relative humidity at Office E – Corporate Department.
Office - Level / Department
Sampling Point
RH (%) 0.1 m 0.6 m 1.1 m 1.7 m Average
E 1 59.5 59.4 60.3 60.0 59.8- Corporate 2 58.2 58.0 58.0 58.3 58.1Department 3 58.6 58.4 57.8 57.6 58.1
4 64.4 64.2 64.4 64.1 64.3 5 63.8 63.2 62.9 63.4 63.3 Total average 60.7
Table H79 : Measurements of metabolic rate at Office E – HR Department. Office - Level /
Department Activity Level Metabolic rate met No. of people met*people Average
E Seated quiet 1.0 2 2.0 - Human Resource Typing 1.1 4 4.4
Department Standing relaxed 1.2 0 0.0 Filing (standing) 1.4 0 0.0 Walking about 1.7 6 10.2
Total 12 16.6 1.38
Table H80 : Measurements of metabolic rate at Office E – Corporate Department. Office - Level /
Department Activity Level Metabolic rate met No. of people met*people Average
E Seated quiet 1.0 1 1.0 - Corporate Typing 1.1 12 13.2 Department Standing relaxed 1.2 0 0.0
Filing (standing) 1.4 0 0.0 Walking about 1.7 3 5.1
Total 16 19.3 1.21
Table H81 : Measurements of clothing value at Office E – HR Department. Office - Level /
Department Clothing Insulation Clothing value clo No. of people clo*people Average
E Short-sleeve 0.19 8 1.52 - Human Resource Normal long-sleeve shirt 0.25 4 1.00
Department Normal trousers 0.15 12 1.80 Socks 0.02 12 0.24 Shoes 0.02 12 0.24 Jacket 0.36 1 0.36
Total 12 5.16 0.43
Univers
ity of
Mala
ya

244
Table H82 : Measurements of clothing value at Office E – Corporate Department. Office - Level /
Department Clothing Insulation Clothing value clo No. of people clo*people Average
E Short-sleeve 0.19 4 0.76 - Corporate Normal long-sleeve shirt 0.25 12 3.00 Department Normal trousers 0.15 16 2.40
Socks 0.02 16 0.32 Shoes 0.02 16 0.32 Jacket 0.36 4 1.44 Full slip 0.16 0 0.00 Skirt thin 0.14 0 0.00
Total 16 8.24 0.52
Table H83 : Measurements of AMV at Office E – HR Department. Office - Level /
Department Thermal Sensation
Scale Actual Mean Vote
Scale No. of votes Scale*votes Average
E Hot 3 0 0.0 - Human Resource Warm 2 0 0.0
Department Slightly warm 1 1 1.0 Neutral 0 7 0.0 Slightly cool -1 2 -2.0 Cool -2 2 -4.0 Cold -3 0 0.0
Total 12 -5.0 -0.42
Table H84 : Measurements of AMV at Office E – Corporate Department. Office - Level /
Department Thermal Sensation
Scale Actual Mean Vote
Scale No. of votes Scale*votes Average
E Hot 3 0 0.0 - Corporate Warm 2 0 0.0 Department Slightly warm 1 3 3.0
Neutral 0 7 0.0 Slightly cool -1 2 -2.0 Cool -2 2 -4.0 Cold -3 2 -6.0
Total 16 -9.0 -0.56
Univers
ity of
Mala
ya

245
Table H85 : Measurements of air temperature at Office F – Level 1.
Office - Level / Department
Sampling Point
Tair (oC)
0.1 m 0.6 m 1.1 m 1.7 m Average
F 1 22.1 21.8 21.7 21.7 21.8- Level 1 2 21.4 21.5 21.2 21.0 21.3
3 20.8 20.5 20.4 20.6 20.6 4 20.2 20.3 20.3 20.4 20.3 5 20.3 20.2 20.2 20.2 20.2 6 20.1 20.1 20.1 20.1 20.1 7 19.9 19.8 19.9 19.9 19.9 8 19.6 19.7 19.7 19.7 19.7 9 19.5 19.6 19.4 19.2 19.4 10 18.9 19.1 19.2 19.1 19.1 Total average 20.2
Table H86 : Measurements of air temperature at Office F – Ground Floor.
Office - Level / Department
Sampling Point
Tair (oC)
0.1 m 0.6 m 1.1 m 1.7 m Average
F 1 25.0 24.7 24.6 24.6 24.7- Ground Floor 2 23.1 23.2 22.9 22.7 23.0
3 23.9 23.6 23.5 23.7 23.7 4 23.2 23.3 23.3 23.4 23.3 5 23.2 23.1 23.1 23.1 23.1 6 23.1 23.1 23.1 23.1 23.1 7 23.3 23.2 23.3 23.3 23.3 8 23.3 23.4 23.4 23.4 23.4 9 23.3 23.4 23.2 23.0 23.2 10 23.1 23.3 23.4 23.3 23.3 Total average 23.4
Table H87 : Measurements of globe temperature at Office F – Level 1.
Office - Level / Department
Sampling Point
Tglobe (oC)
0.1 m 0.6 m 1.1 m 1.7 m Average
F 1 21.5 21.5 21.2 21.4 21.4- Level 1 2 21.2 21.2 21.5 21.6 21.4
3 21.3 21.3 21.6 21.6 21.4 4 21.6 21.2 21.4 21.4 21.4 5 21.2 21.5 21.3 21.5 21.4 6 21.3 21.3 21.5 21.4 21.4 7 21.5 21.5 21.4 21.5 21.5 8 21.4 21.4 21.6 21.6 21.5 9 21.4 21.5 21.5 21.6 21.5 10 21.4 21.5 21.4 21.4 21.4 Total average 21.4
Univers
ity of
Mala
ya

246
Table H88 : Measurements of globe temperature at Office F – Ground Floor.
Office - Level / Department
Sampling Point
Tglobe (oC)
0.1 m 0.6 m 1.1 m 1.7 m Average
F 1 25.2 24.4 24.7 24.7 24.7- Ground Floor 2 22.7 23.1 22.9 23.1 23.0
3 23.6 23.5 24.0 24.0 23.7 4 23.5 23.5 23.0 23.4 23.3 5 22.8 22.8 23.3 23.6 23.1 6 22.8 22.8 23.3 23.6 23.1 7 23.0 23.4 23.2 23.4 23.3 8 23.3 23.2 23.6 23.6 23.4 9 23.4 23.4 22.9 23.2 23.2 10 23.0 23.0 23.4 23.8 23.3 Total average 23.4
Table H89 : Measurements of air velocity at Office F – Level 1.
Office - Level / Department
Sampling Point
V (m/s) 0.1 m 0.6 m 1.1 m 1.7 m Average
F 1 0.06 0.06 0.06 0.06 0.06- Level 1 2 0.05 0.05 0.06 0.05 0.05
3 0.14 0.08 0.07 0.15 0.11 4 0.16 0.18 0.16 0.08 0.14 5 0.08 0.13 0.04 0.07 0.08 6 0.18 0.13 0.15 0.11 0.14 7 0.13 0.06 0.06 0.11 0.09 8 0.06 0.13 0.14 0.06 0.10 9 0.07 0.05 0.03 0.03 0.05 10 0.04 0.07 0.04 0.05 0.05 Total average 0.09
Table H90 : Measurements of air velocity at Office F – Ground Floor.
Office - Level / Department
Sampling Point
V (m/s) 0.1 m 0.6 m 1.1 m 1.7 m Average
F 1 0.13 0.13 0.14 0.13 0.13- Ground Floor 2 0.11 0.12 0.14 0.12 0.12
3 0.10 0.06 0.05 0.11 0.08 4 0.10 0.11 0.10 0.05 0.09 5 0.10 0.15 0.05 0.08 0.10 6 0.14 0.10 0.12 0.09 0.11 7 0.08 0.04 0.04 0.07 0.06 8 0.05 0.10 0.11 0.05 0.08 9 0.07 0.05 0.03 0.03 0.05 10 0.04 0.07 0.04 0.05 0.05 Total average 0.09
Univers
ity of
Mala
ya

247
Table H91 : Measurements of relative humidity at Office F – Level 1.
Office - Level / Department
Sampling Point
RH (%) 0.1 m 0.6 m 1.1 m 1.7 m Average
F 1 52.1 52.8 52.9 55.0 53.2- Level 1 2 52.4 52.6 52.5 52.9 52.6
3 54.3 54.8 54.6 54.6 54.6 4 55.4 55.3 56.2 55.9 55.7 5 55.5 55.3 55.3 55.6 55.4 6 56.8 56.5 56.0 55.8 56.3 7 57.5 57.3 57.5 57.2 57.4 8 56.5 56.0 55.7 56.2 56.1 9 58.2 58.4 58.0 58.9 58.4 10 56.9 57.9 58.4 58.5 57.9 Total average 55.8
Table H92 : Measurements of relative humidity at Office F – Ground Floor.
Office - Level / Department
Sampling Point
RH (%) 0.1 m 0.6 m 1.1 m 1.7 m Average
F 1 57.4 58.1 58.3 60.6 58.6- Ground Floor 2 61.1 61.4 61.3 61.7 61.4
3 60.0 60.5 60.3 60.3 60.3 4 61.2 61.1 62.0 61.7 61.5 5 62.8 62.5 62.5 62.9 62.7 6 63.3 63.0 62.4 62.2 62.7 7 62.8 62.6 62.8 62.5 62.7 8 62.9 62.3 62.0 62.5 62.4 9 62.5 62.7 62.3 63.3 62.7 10 63.6 64.8 65.3 65.4 64.8 Total average 62.0
Table H93 : Measurements of metabolic rate at Office F – Level 1. Office - Level /
Department Activity Level Metabolic rate met No. of people met*people Average
F Seated quiet 1.0 2 2.0 - Level 1 Typing 1.1 7 7.7
Standing relaxed 1.2 2 2.4 Filing (standing) 1.4 0 0.0 Walking about 1.7 6 10.2
Total 17 22.3 1.31
Univers
ity of
Mala
ya

248
Table H94 : Measurements of metabolic rate at Office F – Ground Floor. Office - Level /
Department Activity Level Metabolic rate met No. of people met*people Average
F Seated quiet 1.0 15 15.0 - Ground Floor Typing 1.1 2 2.2
Standing relaxed 1.2 4 4.8 Filing (standing) 1.4 8 11.2 Walking about 1.7 7 11.9
Total 36 45.1 1.25
Table H95 : Measurements of clothing value at Office F – Level 1. Office - Level /
Department Clothing Insulation Clothing value clo No. of people clo*people Average
F Short-sleeve 0.19 14 2.66 - Level 1 Normal long-sleeve shirt 0.25 3 0.75
Normal trousers 0.15 17 2.55 Socks 0.02 1 0.02 Shoes 0.02 0 0.00 Jacket 0.36 9 3.24
Total 17 9.22 0.54
Table H96 : Measurements of clothing value at Office F – Ground Floor. Office - Level /
Department Clothing Insulation Clothing value clo No. of people clo*people Average
F Short-sleeve 0.19 24 4.56 - Ground Floor Normal long-sleeve shirt 0.25 12 3.00
Normal trousers 0.15 34 5.10 Socks 0.02 23 0.46 Shoes 0.02 36 0.72 Jacket 0.36 11 3.96 Full slip 0.16 1 0.16 Skirt thin 0.14 2 0.28
Total 36 18.24 0.51
Table H97 : Measurements of AMV at Office F – Level 1. Office - Level /
Department Thermal Sensation
Scale Actual Mean Vote
Scale No. of votes Scale*votes Average
F Hot 3 0 0.0 - Level 1 Warm 2 0 0.0
Slightly warm 1 1 1.0 Neutral 0 1 0.0 Slightly cool -1 4 -4.0 Cool -2 7 -14.0 Cold -3 4 -12.0
Total 17 -29.0 -1.71
Univers
ity of
Mala
ya

249
Table H98 : Measurements of AMV at Office F – Ground Floor. Office - Level /
Department Thermal Sensation
Scale Actual Mean Vote
Scale No. of votes Scale*votes Average
F Hot 3 0 0.0 - Ground Floor Warm 2 1 2.0
Slightly warm 1 4 4.0 Neutral 0 9 0.0 Slightly cool -1 13 -13.0 Cool -2 5 -10.0 Cold -3 4 -12.0
Total 36 -29.0 -0.81
Table H99 : Measurements of air temperature at Office G – Level 19, Tower 1.
Office - Level / Department
Sampling Point
Tair (oC)
0.1 m 0.6 m 1.1 m 1.7 m Average
G 1 24.3 24.0 23.9 24.1 24.1- Level 19 2 23.6 23.7 23.7 23.8 23.7Tower 1 3 24.3 24.2 24.2 24.2 24.2
4 24.2 24.2 24.2 24.2 24.2 5 24.2 24.1 24.2 24.2 24.2 6 23.8 23.9 23.9 23.9 23.9 7 24.0 24.1 23.9 23.7 23.9 8 22.8 23.0 23.1 23.0 23.0 Total average 23.9
Table H100 : Measurements of air temperature at Office G – Level 20, Tower 1.
Office - Level / Department
Sampling Point
Tair (oC)
0.1 m 0.6 m 1.1 m 1.7 m Average
G 1 24.7 24.4 24.3 24.3 24.4- Level 20 2 23.5 23.6 23.3 23.1 23.4Tower 1 3 23.6 23.3 23.2 23.4 23.4
4 23.3 23.4 23.4 23.5 23.4 5 23.2 23.1 23.1 23.1 23.1 6 23.0 23.0 23.0 23.0 23.0 7 22.5 22.4 22.5 22.5 22.5 8 22.5 22.6 22.6 22.6 22.6 9 22.7 22.8 22.6 22.4 22.6 10 22.5 22.7 22.8 22.7 22.7 Total average 23.1
Univers
ity of
Mala
ya

250
Table H101 : Measurements of air temperature at Office G – Level 10, Tower 2.
Office - Level / Department
Sampling Point
Tair (oC)
0.1 m 0.6 m 1.1 m 1.7 m Average
G 1 23.1 22.8 22.7 22.9 22.9- Level 10 2 23.1 23.2 23.2 23.3 23.2Tower 2 3 23.7 23.6 23.6 23.6 23.6
Total average 23.2
Table H102 : Measurements of air temperature at Office G – Level 15, Tower 2.
Office - Level / Department
Sampling Point
Tair (oC)
0.1 m 0.6 m 1.1 m 1.7 m Average
G 1 23.5 23.2 23.1 23.1 23.2- Level 15 2 23.2 23.3 23.0 22.8 23.1Tower 2 3 23.5 23.2 23.1 23.3 23.3
4 23.2 23.3 23.3 23.4 23.3 5 22.9 22.8 22.8 22.8 22.8 6 23.2 23.2 23.2 23.2 23.2 7 23.4 23.3 23.4 23.4 23.4 8 23.4 23.5 23.5 23.5 23.5 9 23.9 24.0 23.8 23.6 23.8 10 23.5 23.7 23.8 23.7 23.7 Total average 23.3
Table H103 : Measurements of air temperature at Office G – Level 26, Tower 2.
Office - Level / Department
Sampling Point
Tair (oC)
0.1 m 0.6 m 1.1 m 1.7 m Average
G 1 20.2 20.1 20.1 20.1 20.1- Level 26 2 21.3 21.3 21.3 21.3 21.3Tower 2 3 20.7 20.6 20.7 20.7 20.7
4 21.0 21.1 21.1 21.1 21.1 5 21.5 21.6 21.4 21.2 21.4 6 21.8 21.5 21.4 21.4 21.5 7 21.1 21.2 20.9 20.7 21.0 8 21.7 21.4 21.3 21.5 21.5 9 21.1 21.2 21.2 21.3 21.2 10 22.0 21.9 21.9 21.9 21.9 Total average 21.2
Univers
ity of
Mala
ya

251
Table H104 : Measurements of globe temperature at Office G – Level 19, Tower 1.
Office - Level / Department
Sampling Point
Tglobe (oC)
0.1 m 0.6 m 1.1 m 1.7 m Average
G 1 24.2 23.9 24.0 24.0 24.0- Level 19 2 23.9 24.0 23.8 24.0 23.9Tower 1 3 23.8 23.9 24.0 24.0 23.9
4 24.0 23.9 23.8 24.0 23.9 5 23.9 23.9 24.1 24.1 24.0 6 23.8 23.8 24.1 24.0 23.9 7 23.9 24.0 24.0 24.0 24.0 8 24.0 24.0 23.9 24.0 24.0 Total average 24.0
Table H105 : Measurements of globe temperature at Office G – Level 20, Tower 1.
Office - Level / Department
Sampling Point
Tglobe (oC)
0.1 m 0.6 m 1.1 m 1.7 m Average
G 1 24.9 24.0 24.4 24.4 24.4- Level 20 2 23.5 23.8 23.6 23.8 23.7Tower 1 3 23.5 23.4 23.8 23.8 23.6
4 23.7 23.7 23.2 23.7 23.5 5 23.3 23.3 23.7 24.1 23.6 6 23.2 23.2 23.7 24.0 23.5 7 23.3 23.6 23.4 23.6 23.5 8 23.4 23.3 23.7 23.7 23.5 9 23.6 23.6 23.1 23.4 23.4 10 23.1 23.1 23.5 23.9 23.4 Total average 23.6
Table H106 : Measurements of globe temperature at Office G – Level 10, Tower 2.
Office - Level / Department
Sampling Point
Tglobe (oC)
0.1 m 0.6 m 1.1 m 1.7 m Average
G 1 23.5 23.8 23.6 23.8 23.7- Level 10 2 23.6 23.5 23.9 23.9 23.7Tower 2 3 23.9 23.9 23.4 23.7 23.7
Total average 23.7
Univers
ity of
Mala
ya

252
Table H107 : Measurements of globe temperature at Office G – Level 15, Tower 2.
Office - Level / Department
Sampling Point
Tglobe (oC)
0.1 m 0.6 m 1.1 m 1.7 m Average
G 1 22.9 23.1 22.8 22.8 22.9- Level 15 2 22.4 22.7 23.0 23.0 22.8Tower 2 3 22.9 23.0 22.9 22.9 22.9
4 22.8 23.0 23.1 23.1 23.0 5 22.8 22.9 23.1 23.3 23.0 6 22.9 23.1 23.2 23.1 23.1 7 23.1 23.2 23.1 23.1 23.1 8 22.9 23.1 23.3 23.3 23.1 9 23.0 23.1 23.3 23.5 23.2 10 23.1 23.3 23.3 23.3 23.3 Total average 23.0
Table H108 : Measurements of globe temperature at Office G – Level 26, Tower 2.
Office - Level / Department
Sampling Point
Tglobe (oC)
0.1 m 0.6 m 1.1 m 1.7 m Average
G 1 21.5 21.5 21.4 21.4 21.5- Level 26 2 21.5 21.4 21.5 21.5 21.5Tower 2 3 21.5 21.6 21.5 21.5 21.5
4 21.4 21.5 21.5 21.5 21.5 5 21.4 21.4 21.5 21.5 21.5 6 21.4 21.5 21.6 21.5 21.5 7 21.5 21.4 21.5 21.6 21.5 8 21.4 21.5 21.4 21.4 21.4 9 21.4 21.5 21.5 21.5 21.5 10 21.4 21.4 21.5 21.5 21.5 Total average 21.5
Table H109 : Measurements of air velocity at Office G – Level 19, Tower 1.
Office - Level / Department
Sampling Point
V (m/s) 0.1 m 0.6 m 1.1 m 1.7 m Average
G 1 0.23 0.11 0.11 0.20 0.16- Level 19 2 0.12 0.23 0.25 0.12 0.18Tower 1 3 0.17 0.13 0.09 0.08 0.12
4 0.10 0.16 0.10 0.13 0.12 5 0.09 0.09 0.10 0.09 0.09 6 0.12 0.13 0.15 0.13 0.13 7 0.25 0.15 0.12 0.27 0.20 8 0.18 0.20 0.18 0.09 0.16 Total average 0.15
Univers
ity of
Mala
ya

253
Table H110 : Measurements of air velocity at Office G – Level 20, Tower 1.
Office - Level / Department
Sampling Point
V (m/s) 0.1 m 0.6 m 1.1 m 1.7 m Average
G 1 0.28 0.20 0.16 0.14 0.20- Level 20 2 0.22 0.35 0.22 0.27 0.26Tower 1 3 0.18 0.20 0.23 0.20 0.20
4 0.12 0.07 0.06 0.14 0.10 5 0.11 0.13 0.11 0.06 0.10 6 0.11 0.16 0.05 0.08 0.10 7 0.35 0.25 0.30 0.23 0.28 8 0.27 0.14 0.14 0.25 0.20 9 0.13 0.26 0.28 0.13 0.20 10 0.28 0.20 0.15 0.15 0.20 Total average 0.18
Table H111 : Measurements of air velocity at Office G – Level 10, Tower 2.
Office - Level / Department
Sampling Point
V (m/s) 0.1 m 0.6 m 1.1 m 1.7 m Average
G 1 0.05 0.10 0.11 0.05 0.08- Level 10 2 0.14 0.10 0.08 0.06 0.10Tower 2 3 0.07 0.12 0.07 0.08 0.08
Total average 0.09
Table H112 : Measurements of air velocity at Office G – Level 15, Tower 2.
Office - Level / Department
Sampling Point
V (m/s) 0.1 m 0.6 m 1.1 m 1.7 m Average
G 1 0.06 0.06 0.06 0.06 0.06- Level 15 2 0.13 0.14 0.16 0.14 0.14Tower 2 3 0.07 0.04 0.04 0.08 0.06
4 0.10 0.11 0.10 0.05 0.09 5 0.14 0.21 0.07 0.11 0.13 6 0.08 0.05 0.06 0.05 0.06 7 0.11 0.06 0.06 0.10 0.08 8 0.04 0.08 0.08 0.04 0.06 9 0.08 0.06 0.05 0.04 0.06 10 0.05 0.09 0.05 0.06 0.06 Total average 0.08
Univers
ity of
Mala
ya

254
Table H113 : Measurements of air velocity at Office G – Level 26, Tower 2.
Office - Level / Department
Sampling Point
V (m/s) 0.1 m 0.6 m 1.1 m 1.7 m Average
G 1 0.20 0.14 0.17 0.13 0.16- Level 26 2 0.17 0.09 0.09 0.15 0.12Tower 2 3 0.09 0.18 0.20 0.09 0.14
4 0.14 0.10 0.08 0.06 0.10 5 0.08 0.13 0.08 0.09 0.09 6 0.07 0.04 0.04 0.08 0.06 7 0.18 0.20 0.18 0.09 0.16 8 0.11 0.16 0.05 0.08 0.10 9 0.14 0.10 0.12 0.09 0.11 10 0.09 0.04 0.04 0.08 0.06 Total average 0.11
Table H114 : Measurements of relative humidity at Office G – Level 19, Tower 1.
Office - Level / Department
Sampling Point
RH (%) 0.1 m 0.6 m 1.1 m 1.7 m Average
G 1 57.8 57.6 57.8 57.5 57.7- Level 19 2 58.2 57.7 57.4 57.9 57.8Tower 1 3 56.8 57.0 56.6 57.5 57.0
4 56.7 57.7 58.2 58.3 57.7 5 57.6 57.9 57.8 58.2 57.9 6 57.5 58.0 57.8 57.8 57.8 7 57.9 57.8 58.7 58.4 58.2 8 58.7 58.5 58.5 58.8 58.6 Total average 57.8
Table H115 : Measurements of relative humidity at Office G – Level 20, Tower 1.
Office - Level / Department
Sampling Point
RH (%) 0.1 m 0.6 m 1.1 m 1.7 m Average
G 1 55.0 56.0 56.5 56.5 56.0- Level 20 2 59.4 59.9 59.7 59.7 59.7Tower 1 3 59.3 59.2 60.1 59.8 59.6
4 59.1 58.9 58.9 59.2 59.0 5 60.4 60.2 59.6 59.4 59.9 6 60.5 60.3 60.5 60.2 60.4 7 62.0 61.4 61.1 61.6 61.5 8 61.2 61.4 61.0 62.0 61.4 9 59.8 60.9 61.4 61.5 60.9 10 59.9 60.6 60.8 63.2 61.1 Total average 60.0
Univers
ity of
Mala
ya

255
Table H116 : Measurements of relative humidity at Office G – Level 10, Tower 2.
Office - Level / Department
Sampling Point
RH (%) 0.1 m 0.6 m 1.1 m 1.7 m Average
G 1 60.1 60.6 60.4 60.4 60.4- Level 10 2 59.3 59.2 60.1 59.8 59.6Tower 2 3 57.7 57.5 57.5 57.8 57.6
Total average 59.2
Table H117 : Measurements of relative humidity at Office G – Level 15, Tower 2.
Office - Level / Department
Sampling Point
RH (%) 0.1 m 0.6 m 1.1 m 1.7 m Average
G 1 59.7 59.1 58.8 59.3 59.2- Level 15 2 59.4 59.6 59.2 60.2 59.6Tower 2 3 58.3 59.4 59.9 60.0 59.4
4 58.6 59.3 59.5 61.9 59.8 5 60.4 60.7 60.6 61.0 60.7 6 59.6 60.1 59.9 59.9 59.9 7 58.6 58.5 59.4 59.1 58.9 8 57.7 57.5 57.5 57.8 57.6 9 58.2 57.9 57.4 57.2 57.7 10 57.1 56.9 57.1 56.8 57.0 Total average 59.0
Table H118 : Measurements of relative humidity at Office G – Level 26, Tower 2.
Office - Level / Department
Sampling Point
RH (%) 0.1 m 0.6 m 1.1 m 1.7 m Average
G 1 65.5 65.7 65.3 66.3 65.7- Level 26 2 61.1 62.2 62.7 62.8 62.2Tower 2 3 62.6 63.1 62.9 62.9 62.9
4 62.0 61.9 62.8 62.5 62.3 5 62.6 62.4 62.4 62.7 62.5 6 62.0 61.7 61.1 60.9 61.4 7 62.4 62.2 62.4 62.1 62.3 8 61.9 61.3 61.0 61.5 61.4 9 61.2 61.4 61.0 62.0 61.4 10 59.3 60.4 60.9 61.1 60.4 Total average 62.3
Univers
ity of
Mala
ya

256
Table H119 : Measurements of metabolic rate at Office G – Level 19, Tower 1. Office - Level /
Department Activity Level Metabolic rate met No. of people met*people Average
G Seated quiet 1.0 0 0.0 - Level 19 Typing 1.1 1 1.1 Tower 1 Standing relaxed 1.2 0 0.0
Filing (standing) 1.4 0 0.0 Walking about 1.7 11 18.7
Total 12 19.8 1.65
Table H120 : Measurements of metabolic rate at Office G – Level 20, Tower 1. Office - Level /
Department Activity Level Metabolic rate met No. of people met*people Average
G Seated quiet 1.0 3 3.0 - Level 20 Typing 1.1 13 14.3 Tower 1 Standing relaxed 1.2 2 2.4
Filing (standing) 1.4 1 1.4 Walking about 1.7 4 6.8
Total 23 27.9 1.21
Table H121 : Measurements of metabolic rate at Office G – Level 10, Tower 2. Office - Level /
Department Activity Level Metabolic rate met No. of people met*people Average
G Seated quiet 1.0 0 0.0 - Level 10 Typing 1.1 1 1.1 Tower 2 Standing relaxed 1.2 0 0.0
Filing (standing) 1.4 0 0.0 Walking about 1.7 3 5.1
Total 4 6.2 1.55
Table H122 : Measurements of metabolic rate at Office G – Level 15, Tower 2. Office - Level /
Department Activity Level Metabolic rate met No. of people met*people Average
G Seated quiet 1.0 11 11.0 - Level 15 Typing 1.1 5 5.5 Tower 2 Standing relaxed 1.2 2 2.4
Filing (standing) 1.4 0 0.0 Walking about 1.7 1 1.7
Total 19 20.6 1.08
Univers
ity of
Mala
ya

257
Table H123 : Measurements of metabolic rate at Office G – Level 26, Tower 2. Office - Level /
Department Activity Level Metabolic rate met No. of people met*people Average
G Seated quiet 1.0 0 0.0 - Level 26 Typing 1.1 9 9.9 Tower 2 Standing relaxed 1.2 0 0.0
Filing (standing) 1.4 0 0.0 Walking about 1.7 3 5.1
Total 12 15.0 1.25
Table H124 : Measurements of clothing value at Office G – Level 19, Tower 1. Office - Level /
Department Clothing Insulation Clothing value clo No. of people clo*people Average
G Short-sleeve 0.19 7 1.33 - Level 19 Normal long-sleeve shirt 0.25 5 1.25 Tower 1 Normal trousers 0.15 12 1.80
Socks 0.02 12 0.24 Shoes 0.02 12 0.24 Jacket 0.36 2 0.72
Total 12 5.58 0.47
Table H125 : Measurements of clothing value at Office G – Level 20, Tower 1. Office - Level /
Department Clothing Insulation Clothing value clo No. of people clo*people Average
G Short-sleeve 0.19 6 1.14 - Level 20 Normal long-sleeve shirt 0.25 17 4.25 Tower 1 Normal trousers 0.15 23 3.45
Socks 0.02 23 0.46 Shoes 0.02 23 0.46 Jacket 0.36 6 2.16 Full slip 0.16 0 0.00 Skirt thin 0.14 0 0.00
Total 23 11.92 0.52
Univers
ity of
Mala
ya

258
Table H126 : Measurements of clothing value at Office G – Level 10, Tower 2. Office - Level /
Department Clothing Insulation Clothing value clo No. of people clo*people Average
G Short-sleeve 0.19 3 0.57 - Level 10 Normal long-sleeve shirt 0.25 1 0.25 Tower 2 Normal trousers 0.15 3 0.45
Socks 0.02 4 0.08 Shoes 0.02 4 0.08 Jacket 0.36 0 0.00 Full slip 0.16 0 0.00 Skirt thin 0.14 1 0.14
Total 4 1.57 0.39
Table H127 : Measurements of clothing value at Office G – Level 15, Tower 2. Office - Level /
Department Clothing Insulation Clothing value clo No. of people clo*people Average
G Short-sleeve 0.19 9 1.71 - Level 15 Normal long-sleeve shirt 0.25 10 2.50 Tower 2 Normal trousers 0.15 16 2.40
Socks 0.02 16 0.32 Shoes 0.02 19 0.38 Jacket 0.36 3 1.08 Full slip 0.16 2 0.32 Skirt thin 0.14 3 0.42
Total 19 9.13 0.48
Table H128 : Measurements of clothing value at Office G – Level 26, Tower 2. Office - Level /
Department Clothing Insulation Clothing value clo No. of people clo*people Average
G Short-sleeve 0.19 10 1.90 - Level 26 Normal long-sleeve shirt 0.25 2 0.50 Tower 2 Normal trousers 0.15 7 1.05
Socks 0.02 12 0.24 Shoes 0.02 12 0.24 Jacket 0.36 0 0.00 Full slip 0.16 0 0.00 Skirt thin 0.14 5 0.70
Total 12 4.63 0.39
Univers
ity of
Mala
ya

259
Table H129 : Measurements of AMV at Office G – Level 19, Tower 1. Office - Level /
Department Thermal Sensation
Scale Actual Mean Vote
Scale No. of votes Scale*votes Average
G Hot 3 0 0.0 - Level 19 Warm 2 2 4.0 Tower 1 Slightly warm 1 6 6.0
Neutral 0 4 0.0 Slightly cool -1 0 0.0 Cool -2 0 0.0 Cold -3 0 0.0
Total 12 10.0 0.83
Table H130 : Measurements of AMV at Office G – Level 20, Tower 1. Office - Level /
Department Thermal Sensation
Scale Actual Mean Vote
Scale No. of votes Scale*votes Average
G Hot 3 0 0.0 - Level 20 Warm 2 0 0.0 Tower 1 Slightly warm 1 2 2.0
Neutral 0 2 0.0 Slightly cool -1 10 -10.0 Cool -2 5 -10.0 Cold -3 4 -12.0
Total 23 -30.0 -1.30
Table H131 : Measurements of AMV at Office G – Level 10, Tower 2. Office - Level /
Department Thermal Sensation
Scale Actual Mean Vote
Scale No. of votes Scale*votes Average
G Hot 3 0 0.0 - Level 10 Warm 2 0 0.0 Tower 2 Slightly warm 1 1 1.0
Neutral 0 3 0.0 Slightly cool -1 0 0.0 Cool -2 0 0.0 Cold -3 0 0.0
Total 4 1.0 0.25
Univers
ity of
Mala
ya

260
Table H132 : Measurements of AMV at Office G – Level 15, Tower 2. Office - Level /
Department Thermal Sensation
Scale Actual Mean Vote
Scale No. of votes Scale*votes Average
G Hot 3 0 0.0 - Level 15 Warm 2 0 0.0 Tower 2 Slightly warm 1 1 1.0
Neutral 0 13 0.0 Slightly cool -1 3 -3.0 Cool -2 2 -4.0 Cold -3 0 0.0
Total 19 -6.0 -0.32
Table H133 : Measurements of AMV at Office G – Level 26, Tower 2. Office - Level /
Department Thermal Sensation
Scale Actual Mean Vote
Scale No. of votes Scale*votes Average
G Hot 3 0 0.0 - Level 26 Warm 2 0 0.0 Tower 2 Slightly warm 1 0 0.0
Neutral 0 5 0.0 Slightly cool -1 2 -2.0 Cool -2 2 -4.0 Cold -3 3 -9.0
Total 12 -15.0 -1.25
Univers
ity of
Mala
ya
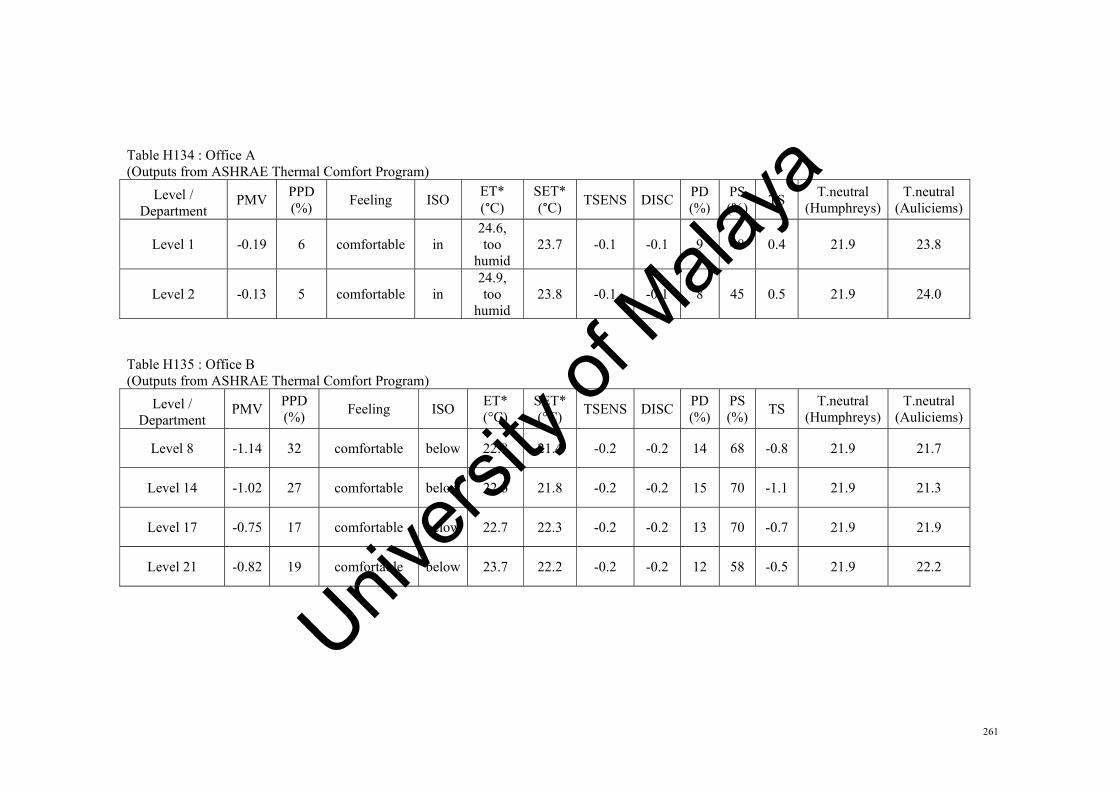
261
Table H134 : Office A (Outputs from ASHRAE Thermal Comfort Program)
Level / Department
PMV PPD (%) Feeling ISO
ET* (°C)
SET* (°C) TSENS DISC
PD (%)
PS (%)
TS T.neutral (Humphreys)
T.neutral (Auliciems)
Level 1 -0.19 6 comfortable in 24.6, too
humid23.7 -0.1 -0.1 9 48 0.4 21.9 23.8
Level 2 -0.13 5 comfortable in 24.9, too
humid23.8 -0.1 -0.1 8 45 0.5 21.9 24.0
Table H135 : Office B (Outputs from ASHRAE Thermal Comfort Program)
Level / Department
PMV PPD (%) Feeling ISO ET*
(°C) SET* (°C) TSENS DISC
PD (%)
PS (%)
TS T.neutral (Humphreys)
T.neutral (Auliciems)
Level 8 -1.14 32 comfortable below 22.8 21.4 -0.2 -0.2 14 68 -0.8 21.9 21.7
Level 14 -1.02 27 comfortable below 22.6 21.8 -0.2 -0.2 15 70 -1.1 21.9 21.3
Level 17 -0.75 17 comfortable below 22.7 22.3 -0.2 -0.2 13 70 -0.7 21.9 21.9
Level 21 -0.82 19 comfortable below 23.7 22.2 -0.2 -0.2 12 58 -0.5 21.9 22.2
Univers
ity of
Mala
ya

262
Table H136 : Office C (Outputs from ASHRAE Thermal Comfort Program)
Level / Department
PMV PPD (%) Feeling ISO
ET* (°C)
SET* (°C) TSENS DISC PD
(%) PS (%)
TS T.neutral (Humphreys)
T.neutral (Auliciems)
Ground Floor 0.51 10 comfortable above 25.6 27.0 0.3 0.5 11 31 -0.1 21.9 23.0
Level 1 0.42 9 comfortable in 25.1 26.2 0.2 0.2 12 36 -0.5 21.9 22.5
Table H137 : Office D (Outputs from ASHRAE Thermal Comfort Program)
Level / Department
PMV PPD (%) Feeling ISO
ET* (°C)
SET* (°C) TSENS DISC
PD (%)
PS (%)
TS T.neutral (Humphreys)
T.neutral (Auliciems)
Level 2 0.12 5 comfortable in 24.3 23.4 0 0 11 51 -0.1 21.9 22.9
Level 4 0.01 5 comfortable in 23.9 24.3 0 0 11 54 -0.2 21.9 22.8
Table H138 : Office E (Outputs from ASHRAE Thermal Comfort Program)
Level / Department
PMV PPD (%) Feeling ISO
ET* (°C)
SET* (°C) TSENS DISC
PD (%)
PS (%)
TS T.neutral (Humphreys)
T.neutral (Auliciems)
Human Resource
Department0.05 5 comfortable in 24.0 23.1 -0.1 -0.1 12 55 -0.4 21.9 22.3
Corporate Department -0.34 7 comfortable in 23.3 22.9 -0.1 -0.1 12 63 -0.5 21.9 22.2
Univers
ity of
Mala
ya

263
Table H139 : Office F (Outputs from ASHRAE Thermal Comfort Program)
Level / Department
PMV PPD (%) Feeling ISO ET* (°C) SET*
(°C) TSENS DISCPD (%)
PS (%)
TS T.neutral (Humphreys)
T.neutral (Auliciems)
Level 1 -0.68 15 comfortable below 21.3, cool 21.3 -0.2 -0.2 15 86 -1.2 21.9 21.0
Ground Floor -0.08 5 comfortable in 23.6 23.2 -0.1 -0.1 12 61 -0.3 21.9 22.6
Table H140 : Office G (Outputs from ASHRAE Thermal Comfort Program)
Level / Department
PMV PPD (%) Feeling ISO ET* (°C) SET*
(°C) TSENS DISCPD (%)
PS (%)
TS T.neutral (Humphreys)
T.neutral (Auliciems)
Level 19, Tower 1 0.31 7 comfortable in 24.2 24.1 0 0 17 68 -0.2 21.9 22.8
Level 20, Tower 1 -0.49 10 comfortable in 23.8 23.3 -0.1 -0.1 22 79 -0.4 21.9 22.4
Level 10, Tower 2 0.08 5 comfortable in 23.7 22.7 -0.1 -0.1 12 58 -0.4 21.9 22.5
Level 15, Tower 2 -0.75 17 comfortable below 23.1 22.1 -0.2 -0.2 12 65 -0.3 21.9 22.5
Level 26, Tower 2 -0.93 23 comfortable below 21.6, cool 20.1 -0.2 -0.2 15 87 -0.9 21.9 21.5
Univers
ity of
Mala
ya

264
Appendix I : Graphs of actual mean vote versus operative temperature for offices
Figure I1 : Graph of AMV vs Top for Office A.
Figure I2 : Graph of AMV vs Top for Office B.
y = 1.1331x ‐ 27.189R² = 1
‐1.50
‐1.00
‐0.50
0.00
0.50
1.00
1.50
2.00
2.50
23.00 23.50 24.00 24.50 25.00 25.50 26.00Actual M
ean
Vote
Operative temperature (oC)
Office A
y = 0.6045x ‐ 14.362R² = 0.8929
‐1.00
‐0.80
‐0.60
‐0.40
‐0.20
0.00
0.20
0.40
0.60
22.00 22.50 23.00 23.50 24.00 24.50 25.00
Actual M
ean
Vote
Operative temperature (oC)
Office B
Univers
ity of
Mala
ya

265
Figure I3 : Graph of AMV vs Top for Office C.
Figure I4 : Graph of AMV vs Top for Office D.
y = 0.4535x ‐ 11.136R² = 1
‐0.40
‐0.20
0.00
0.20
0.40
0.60
0.80
1.00
24.00 24.50 25.00 25.50 26.00
Actual M
ean
Vote
Operative temperature (oC)
Office C
y = 0.1042x ‐ 2.6885R² = 1
‐0.25
‐0.20
‐0.15
‐0.10
‐0.05
0.00
0.05
23.50 24.00 24.50 25.00 25.50 26.00 26.50
Actual M
ean
Vote
Operative temperature (oC)
Office D
Univers
ity of
Mala
ya

266
Figure I5 : Graph of AMV vs Top for Office E.
Figure I6 : Graph of AMV vs Top for Office F.
y = 0.2081x ‐ 5.3798R² = 1
‐0.60
‐0.50
‐0.40
‐0.30
‐0.20
‐0.10
0.00
0.10
23.00 23.50 24.00 24.50 25.00 25.50 26.00 26.50Actual M
ean
Vote
Operative temperature (oC)
Office E
y = 0.4196x ‐ 10.628R² = 1
‐2.00
‐1.50
‐1.00
‐0.50
0.00
0.50
21.00 22.00 23.00 24.00 25.00 26.00
Actual M
ean
Vote
Operative temperature (oC)
Office F
Univers
ity of
Mala
ya

267
Figure I7 : Graph of AMV vs Top for Office G.
y = 0.5864x ‐ 13.932R² = 0.3898
‐1.50
‐1.00
‐0.50
0.00
0.50
1.00
1.50
21.00 21.50 22.00 22.50 23.00 23.50 24.00 24.50 25.00
Actual M
ean
Vote
Operative temperature (oC)
Office G
Univers
ity of
Mala
ya

268
Appendix J : Residual analysis for offices
No. Explanatory variable, Tout (°C)
Response variable, Tn (°C)
Fitted value, Tn (°C)
Residual, e = Response variable - Fitted value
1 29.40 24.00 24.41 -0.412 28.60 23.76 24.30 -0.543 34.50 24.56 25.08 -0.534 33.40 25.80 24.94 0.865 30.80 25.85 24.59 1.266 32.46 25.33 24.81 0.527 33.30 23.76 24.92 -1.17
Univers
ity of
Mala
ya

269
Appendix K : Bias uncertainty analysis for offices
Table K1 : Bias uncertainty for Office A - Level 1
Point V (m/s) Tglobe (oC) Tair (
oC) RH (%) Tout (oC)
1 0.04 23.9 26.5 45.8 28.52 0.01 23.9 26.6 56.9 29.13 0.02 23.9 26.0 57.3 30.14 0.01 23.9 25.9 58.0 30.25 0.02 23.9 25.6 58.7 30.26 0.02 23.9 25.6 59.5 30.17 0.01 23.9 25.8 60.5 29.38 0.01 23.9 25.8 60.5 27.69 0.01 23.9 25.9 60.5 28.810 0.01 23.9 26.0 59.8 28.911 0.01 23.9 26.1 60.0 28.812 0.01 23.9 26.0 58.7 28.713 0.01 23.9 26.1 59.8 28.914 0.01 23.9 26.0 57.9 29.215 0.02 23.9 26.3 58.1 29.3
Average 0.02 23.9 26.0 58.1 29.2
Maximum 0.04 23.9 26.6 60.5 30.2
Minimum 0.01 23.9 25.6 45.8 27.6
Count 15 15 15 15 15
Bias Uncertainty 0.002 0.00 0.07 0.98 0.17
Error (%) 10.38 0.00 0.26 1.69 0.59
Table K2 : Bias uncertainty for Office A - Level 2
Point V (m/s) Tglobe (oC) Tair (
oC) RH (%) Tout (oC)
1 0.02 24.3 26.4 60.5 29.12 0.02 24.3 26.7 59.5 29.53 0.03 24.3 26.5 59.8 30.54 0.02 24.3 26.7 59.4 30.65 0.02 24.3 26.5 60.5 30.66 0.04 24.3 26.5 61.1 30.57 0.02 24.3 26.4 61.2 29.78 0.06 24.3 26.3 61.9 29.09 0.02 24.3 26.4 61.4 29.210 0.02 24.3 26.3 61.4 29.311 0.02 24.3 26.3 61.0 28.912 0.02 24.3 26.2 60.9 28.113 0.02 24.3 26.3 60.9 29.314 0.02 24.3 26.2 59.6 29.6
Univers
ity of
Mala
ya

270
15 0.02 24.3 26.3 59.7 29.716 0.02 24.3 26.1 59.8 29.417 0.06 24.3 26.2 59.8 30.0
Average 0.03 24.3 26.4 60.5 29.6
Maximum 0.06 24.3 26.7 61.9 30.6
Minimum 0.02 24.3 26.1 59.4 28.1
Count 17 17 17 17 17
Bias Uncertainty 0.002 0.00 0.04 0.15 0.15
Error (%) 8.89 0.00 0.13 0.24 0.50
Table K3 : Bias uncertainty for Office B - Level 8
Point V (m/s) Tglobe (oC) Tair (
oC) RH (%) Tout (oC)
1 0.10 22.8 21.8 52.2 26.82 0.09 22.8 21.8 52.5 28.43 0.06 22.9 21.7 52.5 29.44 0.14 22.9 21.9 52.2 29.45 0.16 22.8 22.3 51.4 29.46 0.07 22.5 22.2 51.1 29.37 0.08 22.4 22.1 50.8 28.58 0.10 22.8 21.1 51.1 26.99 0.13 23.2 21.1 53.0 28.110 0.08 22.9 20.9 53.6 28.2
Average 0.10 22.8 21.7 52.0 28.5
Maximum 0.16 23.2 22.3 53.6 29.4
Minimum 0.06 22.4 20.9 50.8 26.8
Count 10 10 10 10 10
Bias Uncertainty 0.010 0.07 0.14 0.28 0.26
Error (%) 9.90 0.32 0.65 0.54 0.92
Univers
ity of
Mala
ya

271
Table K4 : Bias uncertainty for Office B - Level 14
Point V (m/s) Tglobe (oC) Tair (
oC) RH (%) Tout (oC)
1 0.06 22.7 20.8 53.9 26.12 0.15 22.7 20.9 53.1 27.23 0.06 22.8 20.9 53.0 28.24 0.05 22.9 21.1 53.2 28.25 0.06 22.7 21.3 53.3 28.26 0.08 22.4 21.3 53.2 28.27 0.09 22.3 21.1 53.1 27.48 0.09 22.7 20.8 53.1 26.79 0.07 22.8 20.5 53.3 27.010 0.10 22.6 20.5 53.4 27.011 0.14 23.1 19.6 53.6 26.0
Average 0.09 22.7 20.8 53.3 27.3
Maximum 0.15 23.1 21.3 53.9 28.2
Minimum 0.05 22.3 19.6 53.0 26.0
Count 11 11 11 11 11
Bias Uncertainty 0.009 0.07 0.15 0.08 0.20
Error (%) 10.53 0.29 0.74 0.15 0.75
Table K5 : Bias uncertainty for Office B - Level 17.
Point V (m/s) Tglobe (oC) Tair (
oC) RH (%) Tout (oC)
1 0.09 22.7 22.0 58.2 28.02 0.11 22.7 21.7 58.2 28.83 0.08 22.9 21.7 58.0 29.84 0.10 23.1 21.2 59.5 29.95 0.10 22.9 21.3 59.5 29.96 0.12 22.4 21.3 61.5 29.87 0.04 22.3 21.2 63.0 29.08 0.08 22.9 21.4 63.3 27.79 0.09 23.1 21.7 64.6 28.5
10 0.07 22.9 22.1 64.5 28.611 0.06 23.1 22.3 63.4 27.812 0.10 22.8 22.5 62.6 27.913 0.08 22.8 22.7 62.3 28.614 0.08 22.4 22.8 62.3 28.915 0.10 22.4 22.9 63.5 29.016 0.02 22.3 22.6 64.4 28.717 0.09 22.5 22.6 64.2 29.318 0.06 22.6 22.5 64.2 29.7
Average 0.08 22.7 22.0 62.1 28.9
Maximum 0.12 23.1 22.9 64.6 29.9
Univers
ity of
Mala
ya
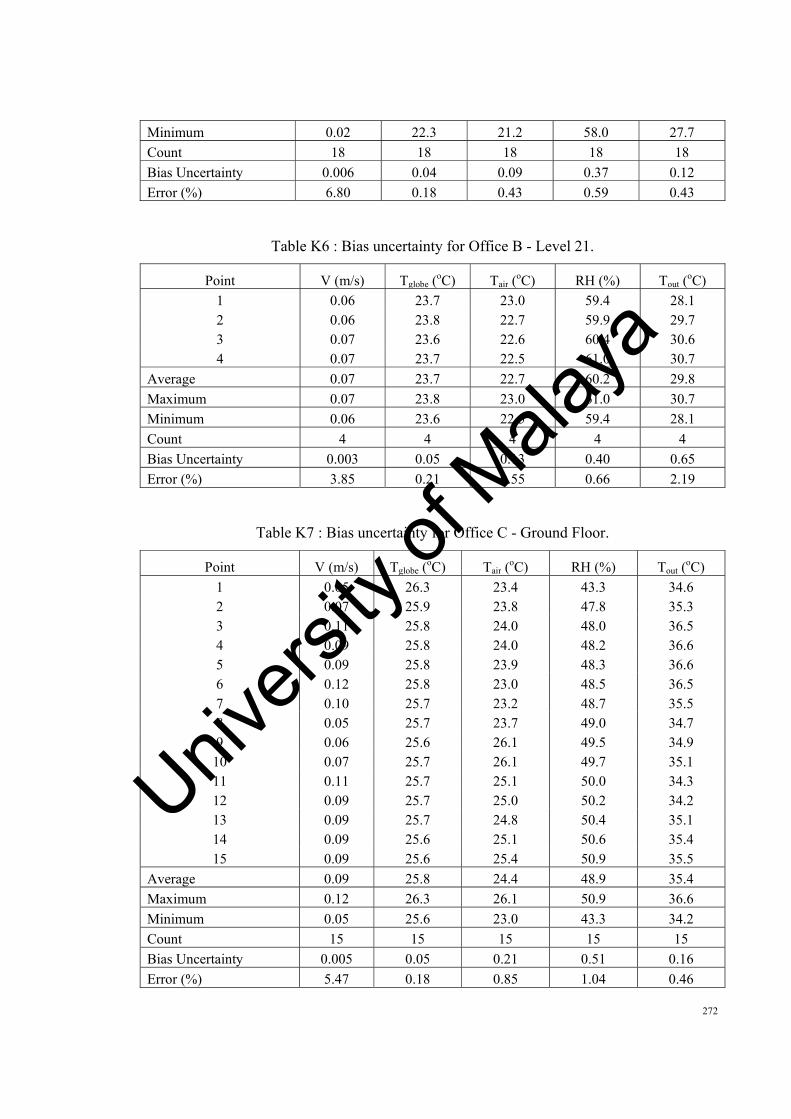
272
Minimum 0.02 22.3 21.2 58.0 27.7
Count 18 18 18 18 18
Bias Uncertainty 0.006 0.04 0.09 0.37 0.12
Error (%) 6.80 0.18 0.43 0.59 0.43
Table K6 : Bias uncertainty for Office B - Level 21.
Point V (m/s) Tglobe (oC) Tair (
oC) RH (%) Tout (oC)
1 0.06 23.7 23.0 59.4 28.12 0.06 23.8 22.7 59.9 29.73 0.07 23.6 22.6 60.4 30.64 0.07 23.7 22.5 61.0 30.7
Average 0.07 23.7 22.7 60.2 29.8
Maximum 0.07 23.8 23.0 61.0 30.7
Minimum 0.06 23.6 22.5 59.4 28.1
Count 4 4 4 4 4
Bias Uncertainty 0.003 0.05 0.13 0.40 0.65
Error (%) 3.85 0.21 0.55 0.66 2.19
Table K7 : Bias uncertainty for Office C - Ground Floor.
Point V (m/s) Tglobe (oC) Tair (
oC) RH (%) Tout (oC)
1 0.05 26.3 23.4 43.3 34.62 0.07 25.9 23.8 47.8 35.33 0.11 25.8 24.0 48.0 36.54 0.09 25.8 24.0 48.2 36.65 0.09 25.8 23.9 48.3 36.66 0.12 25.8 23.0 48.5 36.57 0.10 25.7 23.2 48.7 35.58 0.05 25.7 23.7 49.0 34.79 0.06 25.6 26.1 49.5 34.910 0.07 25.7 26.1 49.7 35.111 0.11 25.7 25.1 50.0 34.312 0.09 25.7 25.0 50.2 34.213 0.09 25.7 24.8 50.4 35.114 0.09 25.6 25.1 50.6 35.415 0.09 25.6 25.4 50.9 35.5
Average 0.09 25.8 24.4 48.9 35.4
Maximum 0.12 26.3 26.1 50.9 36.6
Minimum 0.05 25.6 23.0 43.3 34.2
Count 15 15 15 15 15
Bias Uncertainty 0.005 0.05 0.21 0.51 0.16
Error (%) 5.47 0.18 0.85 1.04 0.46
Univers
ity of
Mala
ya

273
Table K8 : Bias uncertainty for Office C – Level 1.
Point V (m/s) Tglobe (oC) Tair (
oC) RH (%) Tout (oC)
1 0.09 27.3 23.6 41.6 33.02 0.12 27.0 23.2 42.4 33.53 0.07 26.4 23.8 43.2 34.74 0.09 26.2 23.6 43.0 34.85 0.04 26.0 23.1 41.9 34.86 0.04 25.8 23.0 43.3 34.77 0.07 25.7 22.9 42.1 33.78 0.10 25.5 23.2 42.8 32.99 0.02 25.0 22.7 42.6 33.2
10 0.07 24.9 23.0 41.8 33.311 0.11 25.0 23.6 43.8 32.712 0.10 25.0 23.3 48.7 32.513 0.13 24.9 23.3 49.6 33.314 0.13 24.9 23.0 47.0 33.615 0.11 24.9 23.3 46.9 33.716 0.10 24.9 22.9 46.7 33.4
Average 0.09 25.6 23.2 44.2 33.6
Maximum 0.13 27.3 23.8 49.6 34.8
Minimum 0.02 24.9 22.7 41.6 32.5
Count 16 16 16 16 16
Bias Uncertainty 0.007 0.15 0.07 0.50 0.14
Error (%) 7.91 0.59 0.30 1.13 0.43
Table K9 : Bias uncertainty for Office D - Level 2.
Point V (m/s) Tglobe (oC) Tair (
oC) RH (%) Tout (oC)
1 0.03 24.9 24.9 51.9 31.72 0.03 24.6 24.6 52.8 33.53 0.04 24.0 24.0 53.8 34.44 0.04 23.3 23.3 53.3 34.65 0.05 24.2 24.2 52.7 34.66 0.06 24.2 24.2 52.9 34.57 0.05 24.2 24.2 52.9 33.78 0.03 24.2 24.2 53.3 31.9
Average 0.04 24.2 24.2 52.9 33.6
Maximum 0.06 24.9 24.9 53.8 34.6
Minimum 0.03 23.3 23.3 51.9 31.7
Count 8 8 8 8 8
Bias Uncertainty 0.004 0.20 0.20 0.24 0.36
Error (%) 9.09 0.83 0.83 0.45 1.07
Univers
ity of
Mala
ya
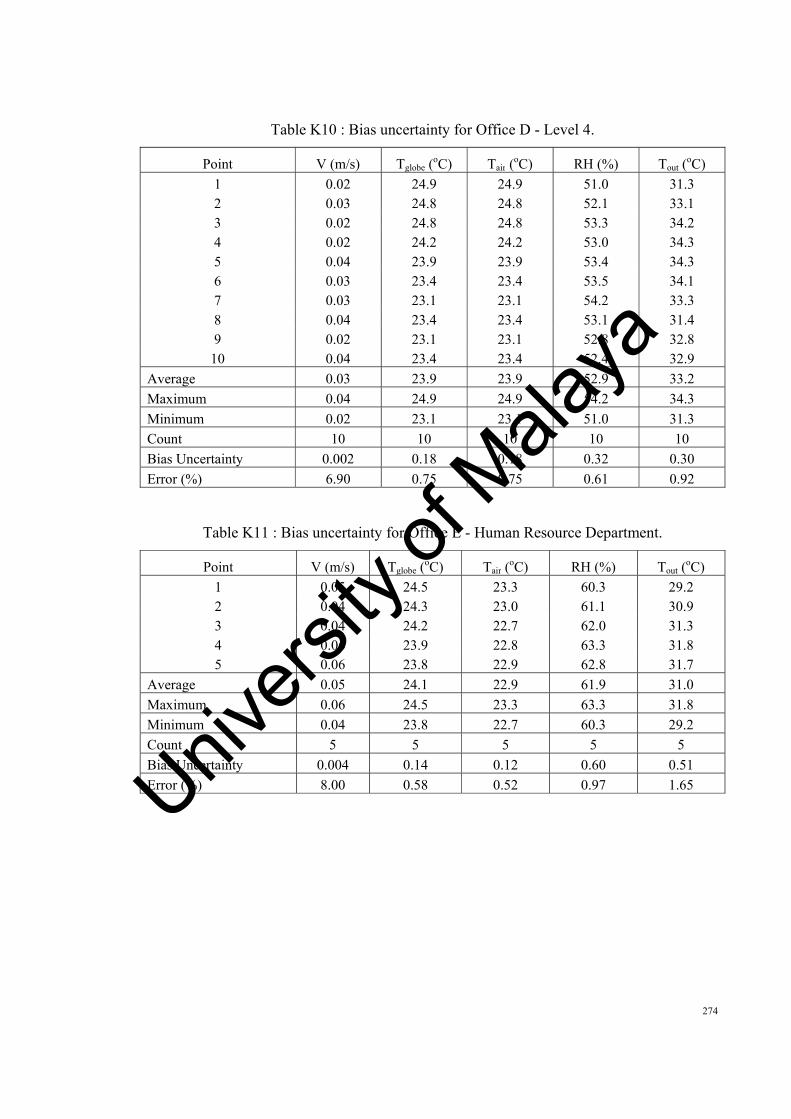
274
Table K10 : Bias uncertainty for Office D - Level 4.
Point V (m/s) Tglobe (oC) Tair (
oC) RH (%) Tout (oC)
1 0.02 24.9 24.9 51.0 31.32 0.03 24.8 24.8 52.1 33.13 0.02 24.8 24.8 53.3 34.24 0.02 24.2 24.2 53.0 34.35 0.04 23.9 23.9 53.4 34.36 0.03 23.4 23.4 53.5 34.17 0.03 23.1 23.1 54.2 33.38 0.04 23.4 23.4 53.1 31.49 0.02 23.1 23.1 52.8 32.8
10 0.04 23.4 23.4 52.4 32.9
Average 0.03 23.9 23.9 52.9 33.2
Maximum 0.04 24.9 24.9 54.2 34.3
Minimum 0.02 23.1 23.1 51.0 31.3
Count 10 10 10 10 10
Bias Uncertainty 0.002 0.18 0.18 0.32 0.30
Error (%) 6.90 0.75 0.75 0.61 0.92
Table K11 : Bias uncertainty for Office E - Human Resource Department.
Point V (m/s) Tglobe (oC) Tair (
oC) RH (%) Tout (oC)
1 0.05 24.5 23.3 60.3 29.22 0.04 24.3 23.0 61.1 30.93 0.04 24.2 22.7 62.0 31.34 0.06 23.9 22.8 63.3 31.85 0.06 23.8 22.9 62.8 31.7
Average 0.05 24.1 22.9 61.9 31.0
Maximum 0.06 24.5 23.3 63.3 31.8
Minimum 0.04 23.8 22.7 60.3 29.2
Count 5 5 5 5 5
Bias Uncertainty 0.004 0.14 0.12 0.60 0.51
Error (%) 8.00 0.58 0.52 0.97 1.65
Univers
ity of
Mala
ya

275
Table K12 : Bias uncertainty for Office E - Corporate Department.
Point V (m/s) Tglobe (oC) Tair (
oC) RH (%) Tout (oC)
1 0.03 23.3 22.8 59.8 30.32 0.04 23.4 22.6 58.1 30.53 0.03 23.4 22.9 58.1 30.84 0.03 23.4 22.3 64.3 30.75 0.04 23.3 22.7 63.3 30.7
Average 0.03 23.4 22.7 60.7 30.6
Maximum 0.04 23.4 22.9 64.3 30.8
Minimum 0.03 23.3 22.3 58.1 30.3
Count 5 5 5 5 5
Bias Uncertainty 0.002 0.02 0.12 1.24 0.10
Error (%) 5.88 0.09 0.53 2.04 0.33
Table K13 : Bias uncertainty for Office F - Level 1.
Point V (m/s) Tglobe (oC) Tair (
oC) RH (%) Tout (oC)
1 0.06 21.4 21.8 53.2 30.62 0.05 21.4 21.3 52.6 32.33 0.11 21.4 20.6 54.6 33.44 0.14 21.4 20.3 55.7 33.45 0.08 21.4 20.2 55.4 33.56 0.14 21.4 20.1 56.3 33.47 0.09 21.5 19.9 57.4 32.58 0.10 21.5 19.7 56.1 30.79 0.05 21.5 19.4 58.4 32.0
10 0.05 21.4 19.1 57.9 32.1
Average 0.09 21.4 20.2 55.8 32.4
Maximum 0.14 21.5 21.8 58.4 33.5
Minimum 0.05 21.4 19.1 52.6 30.6
Count 10 10 10 10 10
Bias Uncertainty 0.009 0.01 0.27 0.58 0.30
Error (%) 10.34 0.05 1.33 1.04 0.92
Univers
ity of
Mala
ya

276
Table K14 : Bias uncertainty for Office F - Ground Floor.
Point V (m/s) Tglobe (oC) Tair (
oC) RH (%) Tout (oC)
1 0.13 24.7 24.7 58.6 30.72 0.12 23.0 23.0 61.4 32.43 0.08 23.7 23.7 60.3 33.64 0.09 23.3 23.3 61.5 33.75 0.10 23.1 23.1 62.7 33.76 0.11 23.1 23.1 62.7 33.57 0.06 23.3 23.3 62.7 32.68 0.08 23.4 23.4 62.4 30.89 0.05 23.2 23.2 62.7 32.110 0.05 23.3 23.3 64.8 32.2
Average 0.09 23.4 23.4 62.0 32.5
Maximum 0.13 24.7 24.7 64.8 33.7
Minimum 0.05 23.0 23.0 58.6 30.7
Count 10 10 10 10 10
Bias Uncertainty 0.008 0.17 0.17 0.62 0.30
Error (%) 9.56 0.74 0.74 1.00 0.91
Table K15 : Bias uncertainty for Office G - Level 19, Tower 1.
Point V (m/s) Tglobe (oC) Tair (
oC) RH (%) Tout (oC)
1 0.16 24.0 24.1 57.7 35.92 0.18 23.9 23.7 57.8 35.73 0.12 23.9 24.2 57.0 34.84 0.12 23.9 24.2 57.7 34.05 0.09 24.0 24.2 57.9 34.36 0.13 23.9 23.9 57.8 34.47 0.20 24.0 23.9 58.2 34.28 0.16 24.0 23.0 58.6 34.2
Average 0.15 24.0 23.9 57.8 34.7
Maximum 0.20 24.0 24.2 58.6 35.9
Minimum 0.09 23.9 23.0 57.0 34.0
Count 8 8 8 8 8
Bias Uncertainty 0.014 0.01 0.15 0.20 0.24
Error (%) 9.48 0.05 0.63 0.35 0.68
Univers
ity of
Mala
ya

277
Table K16 : Bias uncertainty for Office G - Level 20, Tower 1.
Point V (m/s) Tglobe (oC) Tair (
oC) RH (%) Tout (oC)
1 0.20 24.4 24.4 56.0 31.62 0.26 23.7 23.4 59.7 33.43 0.20 23.6 23.4 59.6 34.64 0.10 23.5 23.4 59.0 34.75 0.10 23.6 23.1 59.9 34.76 0.10 23.5 23.0 60.4 34.57 0.28 23.5 22.5 61.5 33.68 0.20 23.5 22.6 61.4 31.79 0.20 23.4 22.6 60.9 33.1
10 0.20 23.4 22.7 61.1 33.2
Average 0.18 23.6 23.1 60.0 33.5
Maximum 0.28 24.4 24.4 61.5 34.7
Minimum 0.10 23.4 22.5 56.0 31.6
Count 10 10 10 10 10
Bias Uncertainty 0.018 0.10 0.19 0.55 0.31
Error (%) 9.78 0.42 0.82 0.92 0.92
Table K17 : Bias uncertainty for Office G - Level 10, Tower 2.
Point V (m/s) Tglobe (oC) Tair (
oC) RH (%) Tout (oC)
1 0.08 23.7 22.9 60.4 33.72 0.10 23.7 23.2 59.6 33.43 0.08 23.7 23.6 57.6 34.0
Average 0.09 23.7 23.2 59.2 33.7
Maximum 0.10 23.7 23.6 60.4 34.0
Minimum 0.08 23.7 22.9 57.6 33.4
Count 3 3 3 3 3
Bias Uncertainty 0.007 0.00 0.23 0.93 0.20
Error (%) 7.69 0.00 1.00 1.58 0.59
Univers
ity of
Mala
ya
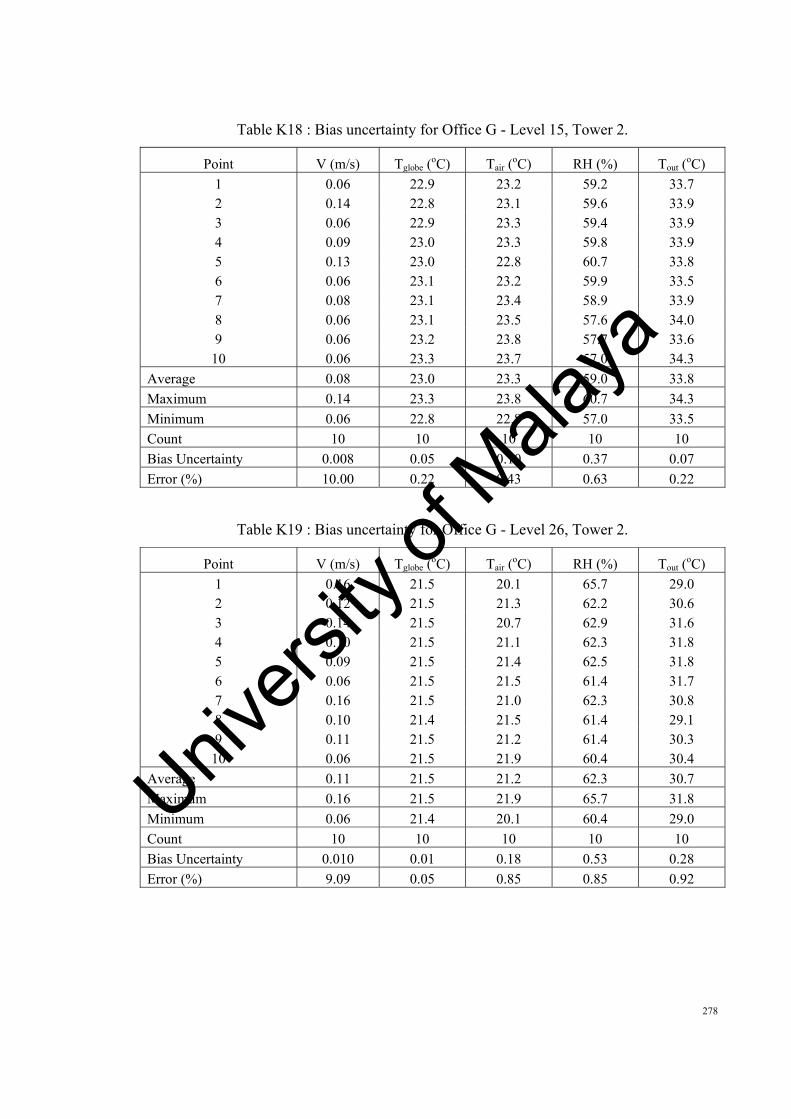
278
Table K18 : Bias uncertainty for Office G - Level 15, Tower 2.
Point V (m/s) Tglobe (oC) Tair (
oC) RH (%) Tout (oC)
1 0.06 22.9 23.2 59.2 33.72 0.14 22.8 23.1 59.6 33.93 0.06 22.9 23.3 59.4 33.94 0.09 23.0 23.3 59.8 33.95 0.13 23.0 22.8 60.7 33.86 0.06 23.1 23.2 59.9 33.57 0.08 23.1 23.4 58.9 33.98 0.06 23.1 23.5 57.6 34.09 0.06 23.2 23.8 57.7 33.6
10 0.06 23.3 23.7 57.0 34.3
Average 0.08 23.0 23.3 59.0 33.8
Maximum 0.14 23.3 23.8 60.7 34.3
Minimum 0.06 22.8 22.8 57.0 33.5
Count 10 10 10 10 10
Bias Uncertainty 0.008 0.05 0.10 0.37 0.07
Error (%) 10.00 0.22 0.43 0.63 0.22
Table K19 : Bias uncertainty for Office G - Level 26, Tower 2.
Point V (m/s) Tglobe (oC) Tair (
oC) RH (%) Tout (oC)
1 0.16 21.5 20.1 65.7 29.02 0.12 21.5 21.3 62.2 30.63 0.14 21.5 20.7 62.9 31.64 0.10 21.5 21.1 62.3 31.85 0.09 21.5 21.4 62.5 31.86 0.06 21.5 21.5 61.4 31.77 0.16 21.5 21.0 62.3 30.88 0.10 21.4 21.5 61.4 29.19 0.11 21.5 21.2 61.4 30.3
10 0.06 21.5 21.9 60.4 30.4
Average 0.11 21.5 21.2 62.3 30.7
Maximum 0.16 21.5 21.9 65.7 31.8
Minimum 0.06 21.4 20.1 60.4 29.0
Count 10 10 10 10 10
Bias Uncertainty 0.010 0.01 0.18 0.53 0.28
Error (%) 9.09 0.05 0.85 0.85 0.92
Univers
ity of
Mala
ya

279
Appendix L : Detail measurements for lecture halls
Table L1 : Measurements of air temperature at Lecture Hall A.
Lecture Hall
Sampling Point
Tair (oC)
0.1 m 0.6 m 1.1 m 1.7 m Average A 1 24.8 24.2 23.7 23.1 24.0 2 22.5 22.5 22.0 21.3 22.1 3 21.3 21.4 21.0 21.1 21.2 4 20.5 19.8 19.1 19.4 19.7 5 19.4 19.1 18.9 18.9 19.1 6 19.0 19.0 19.1 19.1 19.1 Total average 20.8
Table L2 : Measurements of globe temperature at Lecture Hall A.
Lecture Hall
Sampling Point
Tglobe (oC)
0.1 m 0.6 m 1.1 m 1.7 m Average A 1 24.9 24.3 23.7 23.1 24.0 2 24.8 24.8 24.2 23.4 24.3 3 23.7 23.8 23.4 23.5 23.6 4 24.2 23.4 22.6 22.9 23.3 5 23.1 22.7 22.5 22.5 22.7 6 22.4 22.4 22.6 22.6 22.5 Total average 23.4
Table L3 : Measurements of air velocity at Lecture Hall A.
Lecture Hall
Sampling Point
V (m/s)
0.1 m 0.6 m 1.1 m 1.7 m Average A 1 0.16 0.12 0.14 0.12 0.14 2 0.30 0.30 0.23 0.13 0.24 3 0.29 0.23 0.23 0.07 0.21 4 0.07 0.46 0.26 0.11 0.23 5 0.23 0.25 0.17 0.20 0.21 6 0.06 0.13 0.19 0.24 0.16 Total average 0.20
Univers
ity of
Mala
ya

280
Table L4 : Measurements of relative humidity at Lecture Hall A.
Lecture Hall
Sampling Point
RH (%)
0.1 m 0.6 m 1.1 m 1.7 m Average A 1 53.0 51.3 51.2 49.3 51.2 2 49.6 48.8 48.3 47.3 48.5 3 47.5 47.6 47.5 47.1 47.4 4 46.1 46.3 45.7 46.0 46.0 5 46.8 46.6 46.0 46.4 46.5 6 46.3 46.7 46.6 46.1 46.4 Total average 47.7
Table L5 : Measurements of metabolic rate at Lecture Hall A – Point 1. Lecture
Hall Activity Level Metabolic rate met No. of people met*people Average
A Seated quiet 1.0 1 1.0 - Point 1 Typing 1.1 0 0.0
Standing relaxed 1.2 3 3.6 Filing (standing) 1.4 0 0.0 Walking about 1.7 0 0.0 Total 4 4.6 1.15
Table L6 : Measurements of metabolic rate at Lecture Hall A – Point 2. Lecture
Hall Activity Level Metabolic rate met No. of people met*people Average
A Seated quiet 1.0 4 4.0 - Point 2 Typing 1.1 0 0.0
Standing relaxed 1.2 0 0.0 Filing (standing) 1.4 0 0.0 Walking about 1.7 0 0.0 Total 4 4.0 1.00
Table L7 : Measurements of metabolic rate at Lecture Hall A – Point 3. Lecture
Hall Activity Level Metabolic rate met No. of people met*people Average
A Seated quiet 1.0 6 6.0 - Point 3 Typing 1.1 0 0.0
Standing relaxed 1.2 0 0.0 Filing (standing) 1.4 0 0.0 Walking about 1.7 0 0.0 Total 6 6.0 1.00
Univers
ity of
Mala
ya

281
Table L8 : Measurements of metabolic rate at Lecture Hall A – Point 4. Lecture
Hall Activity Level Metabolic rate met No. of people met*people Average
A Seated quiet 1.0 2 2.0 - Point 4 Typing 1.1 1 1.1
Standing relaxed 1.2 1 1.2 Filing (standing) 1.4 0 0.0 Walking about 1.7 0 0.0 Total 4 4.3 1.08
Table L9 : Measurements of metabolic rate at Lecture Hall A – Point 5. Lecture
Hall Activity Level Metabolic rate met No. of people met*people Average
A Seated quiet 1.0 4 4.0 - Point 5 Typing 1.1 0 0.0
Standing relaxed 1.2 0 0.0 Filing (standing) 1.4 0 0.0 Walking about 1.7 0 0.0 Total 4 4.0 1.00
Table L10 : Measurements of metabolic rate at Lecture Hall A – Point 6. Lecture
Hall Activity Level Metabolic rate met No. of people met*people Average
A Seated quiet 1.0 4 4.0 - Point 6 Typing 1.1 0 0.0
Standing relaxed 1.2 0 0.0 Filing (standing) 1.4 0 0.0 Walking about 1.7 0 0.0 Total 4 4.0 1.00
Table L11 : Measurements of clothing value at Lecture Hall A – Point 1.
Lecture Hall Clothing Insulation Clothing value clo No. of people clo*people Average
A Short-sleeve 0.19 2 0.38 - Point 1 Normal long-sleeve shirt 0.25 2 0.50
Normal trousers 0.15 4 0.60 Socks 0.02 0 0.00 Shoes 0.02 4 0.08 Jacket 0.36 4 1.44 Total 4 3.00 0.75
Univers
ity of
Mala
ya

282
Table L12 : Measurements of clothing value at Lecture Hall A – Point 2.
Lecture Hall Clothing Insulation Clothing value clo No. of people clo*people Average
A Short-sleeve 0.19 4 0.76 - Point 2 Normal long-sleeve shirt 0.25 0 0.00
Normal trousers 0.15 4 0.60 Socks 0.02 0 0.00 Shoes 0.02 4 0.08 Jacket 0.36 2 0.72 Total 4 2.16 0.54
Table L13 : Measurements of clothing value at Lecture Hall A – Point 3.
Lecture Hall Clothing Insulation Clothing value clo No. of people clo*people Average
A Short-sleeve 0.19 2 0.38 - Point 3 Normal long-sleeve shirt 0.25 4 1.00
Normal trousers 0.15 6 0.90 Socks 0.02 0 0.00 Shoes 0.02 6 0.12 Jacket 0.36 6 2.16 Total 6 4.56 0.76
Table L14 : Measurements of clothing value at Lecture Hall A – Point 4.
Lecture Hall Clothing Insulation Clothing value clo No. of people clo*people Average
A Short-sleeve 0.19 4 0.76 - Point 4 Normal long-sleeve shirt 0.25 0 0.00
Normal trousers 0.15 4 0.60 Socks 0.02 0 0.00 Shoes 0.02 4 0.08 Jacket 0.36 2 0.72 Total 4 2.16 0.54
Table L15 : Measurements of clothing value at Lecture Hall A – Point 5.
Lecture Hall Clothing Insulation Clothing value clo No. of people clo*people Average
A Short-sleeve 0.19 4 0.76 - Point 5 Normal long-sleeve shirt 0.25 0 0.00
Normal trousers 0.15 4 0.60 Socks 0.02 0 0.00 Shoes 0.02 4 0.08 Jacket 0.36 3 1.08 Total 4 2.52 0.63
Univers
ity of
Mala
ya

283
Table L16 : Measurements of clothing value at Lecture Hall A – Point 6.
Lecture Hall Clothing Insulation Clothing value clo No. of people clo*people Average
A Short-sleeve 0.19 4 0.76 - Point 6 Normal long-sleeve shirt 0.25 0 0.00
Normal trousers 0.15 4 0.60 Socks 0.02 0 0.00 Shoes 0.02 4 0.08 Jacket 0.36 0 0.00 Total 4 1.44 0.36
Table L17 : Measurements of AMV at Lecture Hall A – Point 1. Lecture
Hall Thermal Sensation Scale Actual Mean Vote Scale No. of votes Scale*votes Average
A Hot 3 0 0.0 - Point 1 Warm 2 0 0.0
Slightly warm 1 2 2.0 Neutral 0 1 0.0 Slightly cool -1 0 0.0 Cool -2 0 0.0 Cold -3 1 -3.0
Total 4 -1.0 -0.25
Table L18 : Measurements of AMV at Lecture Hall A – Point 2. Lecture
Hall Thermal Sensation Scale Actual Mean Vote Scale No. of votes Scale*votes Average
A Hot 3 0 0.0 - Point 2 Warm 2 0 0.0
Slightly warm 1 0 0.0 Neutral 0 0 0.0 Slightly cool -1 3 -3.0 Cool -2 0 0.0 Cold -3 1 -3.0
Total 4 -6.0 -1.50
Univers
ity of
Mala
ya

284
Table L19 : Measurements of AMV at Lecture Hall A – Point 3. Lecture
Hall Thermal Sensation Scale Actual Mean Vote Scale No. of votes Scale*votes Average
A Hot 3 0 0.0 - Point 3 Warm 2 0 0.0
Slightly warm 1 0 0.0 Neutral 0 1 0.0 Slightly cool -1 4 -4.0 Cool -2 0 0.0 Cold -3 1 -3.0
Total 6 -7.0 -1.17
Table L20 : Measurements of AMV at Lecture Hall A – Point 4. Lecture
Hall Thermal Sensation Scale Actual Mean Vote Scale No. of votes Scale*votes Average
A Hot 3 0 0.0 - Point 4 Warm 2 0 0.0
Slightly warm 1 0 0.0 Neutral 0 0 0.0 Slightly cool -1 4 -4.0 Cool -2 0 0.0 Cold -3 0 0.0
Total 4 -4.0 -1.00
Table L21 : Measurements of AMV at Lecture Hall A – Point 5. Lecture
Hall Thermal Sensation Scale Actual Mean Vote Scale No. of votes Scale*votes Average
A Hot 3 0 0.0 - Point 5 Warm 2 0 0.0
Slightly warm 1 0 0.0 Neutral 0 0 0.0 Slightly cool -1 0 0.0 Cool -2 2 -4.0 Cold -3 2 -6.0
Total 4 -10.0 -2.50
Univers
ity of
Mala
ya

285
Table L22 : Measurements of AMV at Lecture Hall A – Point 6. Lecture
Hall Thermal Sensation Scale Actual Mean Vote Scale No. of votes Scale*votes Average
A Hot 3 0 0.0 - Point 6 Warm 2 0 0.0
Slightly warm 1 0 0.0 Neutral 0 0 0.0 Slightly cool -1 0 0.0 Cool -2 4 -8.0 Cold -3 0 0.0
Total 4 -8.0 -2.00
Table L23 : Measurements of air temperature at Lecture Hall B.
Lecture Hall
Sampling Point
Tair (oC)
0.1 m 0.6 m 1.1 m 1.7 m Average B 1 21.2 21.2 21.3 21.3 21.3 2 21.2 21.3 21.5 21.4 21.4 3 21.0 21.1 21.0 20.9 21.0 4 21.0 21.0 20.8 20.8 20.9 5 21.1 21.1 21.0 20.9 21.0 6 21.0 21.0 21.1 21.0 21.0 Total average 21.1
Table L24 : Measurements of globe temperature at Lecture Hall B.
Lecture Hall
Sampling Point
Tglobe (oC)
0.1 m 0.6 m 1.1 m 1.7 m Average B 1 22.5 22.3 22.3 22.5 22.4 2 22.5 22.4 22.5 22.7 22.5 3 22.5 22.6 22.6 22.6 22.6 4 22.5 22.8 22.4 22.7 22.6 5 22.7 22.7 22.6 22.7 22.7 6 22.5 22.5 22.8 23.0 22.7 Total average 22.6
Table L25 : Measurements of air velocity at Lecture Hall B.
Lecture Hall
Sampling Point
V (m/s)
0.1 m 0.6 m 1.1 m 1.7 m Average B 1 0.24 0.14 0.28 0.22 0.22 2 0.09 0.09 0.14 0.16 0.12 3 0.14 0.16 0.16 0.22 0.17 4 0.11 0.12 0.12 0.06 0.10 5 0.15 0.15 0.12 0.20 0.16 6 0.04 0.12 0.12 0.11 0.10 Total average 0.15
Univers
ity of
Mala
ya

286
Table L26 : Measurements of relative humidity at Lecture Hall B.
Lecture Hall
Sampling Point
RH (%)
0.1 m 0.6 m 1.1 m 1.7 m Average B 1 62.1 61.7 61.7 61.6 61.8 2 62.5 62.3 63.8 61.5 62.5 3 62.3 62.8 62.3 62.8 62.6 4 63.6 63.4 62.7 62.8 63.1 5 62.4 62.6 62.0 62.7 62.4 6 63.0 63.0 63.1 63.0 63.0 Total average 62.6
Table L27 : Measurements of metabolic rate at Lecture Hall B – Point 1. Lecture
Hall Activity Level Metabolic rate met No. of people met*people Average
B Seated quiet 1.0 2 2.0 - Point 1 Typing 1.1 2 2.2
Standing relaxed 1.2 1 1.2 Filing (standing) 1.4 0 0.0 Walking about 1.7 0 0.0 Total 5 5.4 1.08
Table L28 : Measurements of metabolic rate at Lecture Hall B – Point 2. Lecture
Hall Activity Level Metabolic rate met No. of people met*people Average
B Seated quiet 1.0 5 5.0 - Point 2 Typing 1.1 0 0.0
Standing relaxed 1.2 0 0.0 Filing (standing) 1.4 0 0.0 Walking about 1.7 0 0.0 Total 5 5.0 1.00
Table L29 : Measurements of metabolic rate at Lecture Hall B – Point 3. Lecture
Hall Activity Level Metabolic rate met No. of people met*people Average
B Seated quiet 1.0 2 2.0 - Point 3 Typing 1.1 0 0.0
Standing relaxed 1.2 3 3.6 Filing (standing) 1.4 0 0.0 Walking about 1.7 0 0.0 Total 5 5.6 1.12
Univers
ity of
Mala
ya

287
Table L30 : Measurements of metabolic rate at Lecture Hall B – Point 4. Lecture
Hall Activity Level Metabolic rate met No. of people met*people Average
B Seated quiet 1.0 5 5.0 - Point 4 Typing 1.1 0 0.0
Standing relaxed 1.2 0 0.0 Filing (standing) 1.4 0 0.0 Walking about 1.7 0 0.0 Total 5 5.0 1.00
Table L31 : Measurements of metabolic rate at Lecture Hall B – Point 5. Lecture
Hall Activity Level Metabolic rate met No. of people met*people Average
B Seated quiet 1.0 5 5.0 - Point 5 Typing 1.1 0 0.0
Standing relaxed 1.2 0 0.0 Filing (standing) 1.4 0 0.0 Walking about 1.7 0 0.0 Total 5 5.0 1.00
Table L32 : Measurements of metabolic rate at Lecture Hall B – Point 6. Lecture
Hall Activity Level Metabolic rate met No. of people met*people Average
B Seated quiet 1.0 5 5.0 - Point 6 Typing 1.1 0 0.0
Standing relaxed 1.2 0 0.0 Filing (standing) 1.4 0 0.0 Walking about 1.7 0 0.0 Total 5 5.0 1.00
Table L33 : Measurements of clothing value at Lecture Hall B – Point 1.
Lecture Hall Clothing Insulation Clothing value clo No. of people clo*people Average
B Short-sleeve 0.19 3 0.57 - Point 1 Normal long-sleeve shirt 0.25 2 0.50
Normal trousers 0.15 5 0.75 Socks 0.02 0 0.00 Shoes 0.02 5 0.10 Jacket 0.36 3 1.08 Total 5 3.00 0.60
Univers
ity of
Mala
ya

288
Table L34 : Measurements of clothing value at Lecture Hall B – Point 2.
Lecture Hall Clothing Insulation Clothing value clo No. of people clo*people Average
B Short-sleeve 0.19 5 0.95 - Point 2 Normal long-sleeve shirt 0.25 0 0.00
Normal trousers 0.15 5 0.75 Socks 0.02 0 0.00 Shoes 0.02 5 0.10 Jacket 0.36 3 1.08 Total 5 2.88 0.58
Table L35 : Measurements of clothing value at Lecture Hall B – Point 3.
Lecture Hall Clothing Insulation Clothing value clo No. of people clo*people Average
B Short-sleeve 0.19 5 0.95 - Point 3 Normal long-sleeve shirt 0.25 0 0.00
Normal trousers 0.15 5 0.75 Socks 0.02 0 0.00 Shoes 0.02 5 0.10 Jacket 0.36 5 1.80 Total 5 3.60 0.72
Table L36 : Measurements of clothing value at Lecture Hall B – Point 4.
Lecture Hall Clothing Insulation Clothing value clo No. of people clo*people Average
B Short-sleeve 0.19 5 0.95 - Point 4 Normal long-sleeve shirt 0.25 0 0.00
Normal trousers 0.15 5 0.75 Socks 0.02 0 0.00 Shoes 0.02 5 0.10 Jacket 0.36 2 0.72 Total 5 2.52 0.50
Table L37 : Measurements of clothing value at Lecture Hall B – Point 5.
Lecture Hall Clothing Insulation Clothing value clo No. of people clo*people Average
B Short-sleeve 0.19 5 0.95 - Point 5 Normal long-sleeve shirt 0.25 0 0.00
Normal trousers 0.15 5 0.75 Socks 0.02 0 0.00 Shoes 0.02 5 0.10 Jacket 0.36 5 1.80 Total 5 3.60 0.72
Univers
ity of
Mala
ya

289
Table L38 : Measurements of clothing value at Lecture Hall B – Point 6.
Lecture Hall Clothing Insulation Clothing value clo No. of people clo*people Average
B Short-sleeve 0.19 5 0.95 - Point 6 Normal long-sleeve shirt 0.25 0 0.00
Normal trousers 0.15 5 0.75 Socks 0.02 0 0.00 Shoes 0.02 5 0.10 Jacket 0.36 5 1.80 Total 5 3.60 0.72
Table L39 : Measurements of AMV at Lecture Hall B – Point 1. Lecture
Hall Thermal Sensation Scale Actual Mean Vote Scale No. of votes Scale*votes Average
B Hot 3 0 0.0 - Point 1 Warm 2 0 0.0
Slightly warm 1 3 3.0 Neutral 0 0 0.0 Slightly cool -1 0 0.0 Cool -2 2 -4.0 Cold -3 0 0.0
Total 5 -1.0 -0.20
Table L40 : Measurements of AMV at Lecture Hall B – Point 2. Lecture
Hall Thermal Sensation Scale Actual Mean Vote Scale No. of votes Scale*votes Average
B Hot 3 0 0.0 - Point 2 Warm 2 0 0.0
Slightly warm 1 0 0.0 Neutral 0 1 0.0 Slightly cool -1 0 0.0 Cool -2 4 -8.0 Cold -3 0 0.0
Total 5 -8.0 -1.60
Univers
ity of
Mala
ya

290
Table L41 : Measurements of AMV at Lecture Hall B – Point 3. Lecture
Hall Thermal Sensation Scale Actual Mean Vote Scale No. of votes Scale*votes Average
B Hot 3 0 0.0 - Point 3 Warm 2 0 0.0
Slightly warm 1 0 0.0 Neutral 0 0 0.0 Slightly cool -1 4 -4.0 Cool -2 0 0.0 Cold -3 1 -3.0
Total 5 -7.0 -1.40
Table L42 : Measurements of AMV at Lecture Hall B – Point 4. Lecture
Hall Thermal Sensation Scale Actual Mean Vote Scale No. of votes Scale*votes Average
B Hot 3 0 0.0 - Point 4 Warm 2 0 0.0
Slightly warm 1 0 0.0 Neutral 0 0 0.0 Slightly cool -1 0 0.0 Cool -2 5 -10.0 Cold -3 0 0.0
Total 5 -10.0 -2.00
Table L43 : Measurements of AMV at Lecture Hall B – Point 5. Lecture
Hall Thermal Sensation Scale Actual Mean Vote Scale No. of votes Scale*votes Average
B Hot 3 0 0.0 - Point 5 Warm 2 0 0.0
Slightly warm 1 0 0.0 Neutral 0 0 0.0 Slightly cool -1 4 -4.0 Cool -2 0 0.0 Cold -3 1 -3.0
Total 5 -7.0 -1.40
Univers
ity of
Mala
ya

291
Table L44 : Measurements of AMV at Lecture Hall B – Point 6. Lecture
Hall Thermal Sensation Scale Actual Mean Vote Scale No. of votes Scale*votes Average
B Hot 3 0 0.0 - Point 6 Warm 2 0 0.0
Slightly warm 1 3 3.0 Neutral 0 1 0.0 Slightly cool -1 0 0.0 Cool -2 1 -2.0 Cold -3 0 0.0
Total 5 1.0 0.20
Table L45 : Measurements of air temperature at Lecture Hall C.
Lecture Hall
Sampling Point
Tair (oC)
0.1 m 0.6 m 1.1 m 1.7 m Average C 1 22.0 21.8 21.9 21.9 21.9 2 22.4 22.3 22.3 21.8 22.2 3 22.6 22.7 22.9 22.8 22.8 4 22.8 22.8 22.5 22.5 22.7 5 22.1 22.0 22.0 22.1 22.1 6 22.0 22.0 21.9 21.9 22.0 Total average 22.3
Table L46 : Measurements of globe temperature at Lecture Hall C.
Lecture Hall
Sampling Point
Tglobe (oC)
0.1 m 0.6 m 1.1 m 1.7 m Average C 1 22.8 22.6 22.6 22.8 22.7 2 22.7 22.6 22.7 22.9 22.7 3 22.6 22.7 22.7 22.7 22.7 4 22.6 22.9 22.5 22.8 22.7 5 22.7 22.7 22.6 22.7 22.7 6 22.4 22.4 22.7 22.9 22.6 Total average 22.7
Table L47 : Measurements of air velocity at Lecture Hall C.
Lecture Hall
Sampling Point
V (m/s)
0.1 m 0.6 m 1.1 m 1.7 m Average C 1 0.12 0.21 0.20 0.20 0.18 2 0.03 0.04 0.05 0.27 0.10 3 0.06 0.10 0.13 0.12 0.10 4 0.07 0.04 0.07 0.30 0.12 5 0.09 0.13 0.06 0.20 0.12 6 0.11 0.20 0.25 0.29 0.21 Total average 0.14
Univers
ity of
Mala
ya

292
Table L48 : Measurements of relative humidity at Lecture Hall C.
Lecture Hall
Sampling Point
RH (%)
0.1 m 0.6 m 1.1 m 1.7 m Average C 1 69.4 69.8 69.9 70.0 69.8 2 68.2 68.1 67.9 67.6 68.0 3 68.6 68.5 70.0 68.2 68.8 4 66.8 67.0 67.2 67.2 67.1 5 69.1 69.6 69.8 69.9 69.6 6 69.0 69.8 69.9 70.1 69.7 Total average 68.8
Table L49 : Measurements of metabolic rate at Lecture Hall C – Point 1. Lecture
Hall Activity Level Metabolic rate met No. of people met*people Average
C Seated quiet 1.0 4 4.0 - Point 1 Typing 1.1 0 0.0
Standing relaxed 1.2 0 0.0 Filing (standing) 1.4 0 0.0 Walking about 1.7 0 0.0 Total 4 4.0 1.00
Table L50 : Measurements of metabolic rate at Lecture Hall C – Point 2. Lecture
Hall Activity Level Metabolic rate met No. of people met*people Average
C Seated quiet 1.0 2 2.0 - Point 2 Typing 1.1 0 0.0
Standing relaxed 1.2 2 2.4 Filing (standing) 1.4 0 0.0 Walking about 1.7 0 0.0 Total 4 4.4 1.10
Table L51 : Measurements of metabolic rate at Lecture Hall C – Point 3. Lecture
Hall Activity Level Metabolic rate met No. of people met*people Average
C Seated quiet 1.0 4 4.0 - Point 3 Typing 1.1 0 0.0
Standing relaxed 1.2 0 0.0 Filing (standing) 1.4 0 0.0 Walking about 1.7 0 0.0 Total 4 4.0 1.00
Univers
ity of
Mala
ya

293
Table L52 : Measurements of metabolic rate at Lecture Hall C – Point 4. Lecture
Hall Activity Level Metabolic rate met No. of people met*people Average
C Seated quiet 1.0 2 2.0 - Point 4 Typing 1.1 1 1.1
Standing relaxed 1.2 0 0.0 Filing (standing) 1.4 0 0.0 Walking about 1.7 1 1.7 Total 4 4.8 1.20
Table L53 : Measurements of metabolic rate at Lecture Hall C – Point 5. Lecture
Hall Activity Level Metabolic rate met No. of people met*people Average
C Seated quiet 1.0 1 1.0 - Point 5 Typing 1.1 0 0.0
Standing relaxed 1.2 4 4.8 Filing (standing) 1.4 0 0.0 Walking about 1.7 0 0.0 Total 5 5.8 1.16
Table L54 : Measurements of metabolic rate at Lecture Hall C – Point 6. Lecture
Hall Activity Level Metabolic rate met No. of people met*people Average
C Seated quiet 1.0 5 5.0 - Point 6 Typing 1.1 0 0.0
Standing relaxed 1.2 0 0.0 Filing (standing) 1.4 0 0.0 Walking about 1.7 0 0.0 Total 5 5.0 1.00
Table L55 : Measurements of clothing value at Lecture Hall C – Point 1.
Lecture Hall Clothing Insulation Clothing value clo No. of people clo*people Average
C Short-sleeve 0.19 4 0.76 - Point 1 Normal long-sleeve shirt 0.25 0 0.00
Normal trousers 0.15 4 0.60 Socks 0.02 0 0.00 Shoes 0.02 4 0.08 Jacket 0.36 4 1.44 Total 4 2.88 0.72
Univers
ity of
Mala
ya

294
Table L56 : Measurements of clothing value at Lecture Hall C – Point 2.
Lecture Hall Clothing Insulation Clothing value clo No. of people clo*people Average
C Short-sleeve 0.19 3 0.57 - Point 2 Normal long-sleeve shirt 0.25 1 0.25
Normal trousers 0.15 4 0.60 Socks 0.02 0 0.00 Shoes 0.02 4 0.08 Jacket 0.36 3 1.08 Total 4 2.58 0.65
Table L57 : Measurements of clothing value at Lecture Hall C – Point 3.
Lecture Hall Clothing Insulation Clothing value clo No. of people clo*people Average
C Short-sleeve 0.19 4 0.76 - Point 3 Normal long-sleeve shirt 0.25 0 0.00
Normal trousers 0.15 4 0.60 Socks 0.02 0 0.00 Shoes 0.02 4 0.08 Jacket 0.36 3 1.08 Total 4 2.52 0.63
Table L58 : Measurements of clothing value at Lecture Hall C – Point 4.
Lecture Hall Clothing Insulation Clothing value clo No. of people clo*people Average
C Short-sleeve 0.19 4 0.76 - Point 4 Normal long-sleeve shirt 0.25 0 0.00
Normal trousers 0.15 4 0.60 Socks 0.02 0 0.00 Shoes 0.02 4 0.08 Jacket 0.36 4 1.44 Total 4 2.88 0.72
Table L59 : Measurements of clothing value at Lecture Hall C – Point 5.
Lecture Hall Clothing Insulation Clothing value clo No. of people clo*people Average
C Short-sleeve 0.19 4 0.76 - Point 5 Normal long-sleeve shirt 0.25 1 0.25
Normal trousers 0.15 5 0.75 Socks 0.02 0 0.00 Shoes 0.02 5 0.10 Jacket 0.36 0 0.00 Total 5 1.86 0.37
Univers
ity of
Mala
ya

295
Table L60 : Measurements of clothing value at Lecture Hall C – Point 6.
Lecture Hall Clothing Insulation Clothing value clo No. of people clo*people Average
C Short-sleeve 0.19 5 0.95 - Point 6 Normal long-sleeve shirt 0.25 0 0.00
Normal trousers 0.15 5 0.75 Socks 0.02 0 0.00 Shoes 0.02 5 0.10 Jacket 0.36 5 1.80 Total 5 3.60 0.72
Table L61 : Measurements of AMV at Lecture Hall C – Point 1. Lecture
Hall Thermal Sensation
Scale Actual Mean Vote
Scale No. of votes Scale*votes Average
C Hot 3 0 0.0 - Point 1 Warm 2 0 0.0
Slightly warm 1 0 0.0 Neutral 0 0 0.0 Slightly cool -1 3 -3.0 Cool -2 0 0.0 Cold -3 1 -3.0 Total 4 -6.0 -1.50
Table L62 : Measurements of AMV at Lecture Hall C – Point 2. Lecture
Hall Thermal Sensation
Scale Actual Mean Vote
Scale No. of votes Scale*votes Average
C Hot 3 0 0.0 - Point 2 Warm 2 0 0.0
Slightly warm 1 0 0.0 Neutral 0 0 0.0 Slightly cool -1 3 -3.0 Cool -2 1 -2.0 Cold -3 0 0.0 Total 4 -5.0 -1.25
Univers
ity of
Mala
ya

296
Table L63 : Measurements of AMV at Lecture Hall C – Point 3. Lecture
Hall Thermal Sensation
Scale Actual Mean Vote
Scale No. of votes Scale*votes Average
C Hot 3 0 0.0 - Point 3 Warm 2 0 0.0
Slightly warm 1 0 0.0 Neutral 0 0 0.0 Slightly cool -1 3 -3.0 Cool -2 0 0.0 Cold -3 1 -3.0 Total 4 -6.0 -1.50
Table L64 : Measurements of AMV at Lecture Hall C – Point 4. Lecture
Hall Thermal Sensation
Scale Actual Mean Vote
Scale No. of votes Scale*votes Average
C Hot 3 0 0.0 - Point 4 Warm 2 0 0.0
Slightly warm 1 0 0.0 Neutral 0 0 0.0 Slightly cool -1 3 -3.0 Cool -2 0 0.0 Cold -3 1 -3.0 Total 4 -6.0 -1.50
Table L65 : Measurements of AMV at Lecture Hall C – Point 5. Lecture
Hall Thermal Sensation
Scale Actual Mean Vote
Scale No. of votes Scale*votes Average
C Hot 3 0 0.0 - Point 5 Warm 2 0 0.0
Slightly warm 1 0 0.0 Neutral 0 0 0.0 Slightly cool -1 3 -3.0 Cool -2 2 -4.0 Cold -3 0 0.0 Total 5 -7.0 -1.40
Univers
ity of
Mala
ya

297
Table L66 : Measurements of AMV at Lecture Hall C – Point 6. Lecture
Hall Thermal Sensation
Scale Actual Mean Vote
Scale No. of votes Scale*votes Average
C Hot 3 0 0.0 - Point 6 Warm 2 0 0.0
Slightly warm 1 0 0.0 Neutral 0 0 0.0 Slightly cool -1 0 0.0 Cool -2 5 -10.0 Cold -3 0 0.0 Total 5 -10.0 -2.00
Table L67 : Measurements of air temperature at Lecture Hall D.
Lecture Hall
Sampling Point
Tair (oC)
0.1 m 0.6 m 1.1 m 1.7 m Average D 1 22.7 23.0 23.0 23.0 22.9 2 22.0 22.1 22.2 22.2 22.1 3 22.0 22.1 22.3 22.3 22.2 4 23.2 23.2 23.1 23.1 23.2 5 22.0 21.7 22.0 22.1 22.0 6 21.8 21.7 21.8 21.7 21.8 Total average 22.3
Table L68 : Measurements of globe temperature at Lecture Hall D.
Lecture Hall
Sampling Point
Tglobe (oC)
0.1 m 0.6 m 1.1 m 1.7 m Average D 1 22.9 22.3 21.9 21.3 22.1 2 22.5 22.5 22.0 21.3 22.1 3 22.3 22.4 22.0 22.1 22.2 4 23.0 22.2 21.4 21.8 22.1 5 22.6 22.2 22.0 22.0 22.2 6 22.1 22.1 22.3 22.3 22.2 Total average 22.2
Table L69 : Measurements of air velocity at Lecture Hall D.
Lecture Hall
Sampling Point
V (m/s)
0.1 m 0.6 m 1.1 m 1.7 m Average D 1 0.09 0.11 0.13 0.11 0.11 2 0.12 0.14 0.07 0.16 0.12 3 0.06 0.05 0.17 0.19 0.12 4 0.04 0.08 0.11 0.18 0.10 5 0.17 0.23 0.18 0.25 0.21 6 0.08 0.17 0.14 0.19 0.15 Total average 0.13
Univers
ity of
Mala
ya

298
Table L70 : Measurements of relative humidity at Lecture Hall D.
Lecture Hall
Sampling Point
RH (%)
0.1 m 0.6 m 1.1 m 1.7 m Average D 1 48.4 49.8 49.2 48.9 49.1 2 47.5 47.4 47.4 47.3 47.4 3 48.3 48.4 48.3 47.8 48.2 4 48.0 48.2 48.8 49.1 48.5 5 49.9 49.7 50.1 50.0 49.9 6 48.1 48.5 49.0 48.4 48.5 Total average 48.6
Table L71 : Measurements of metabolic rate at Lecture Hall D – Point 1. Lecture
Hall Activity Level Metabolic rate met No. of people met*people Average
D Seated quiet 1.0 5 5.0 - Point 1 Typing 1.1 0 0.0
Standing relaxed 1.2 0 0.0 Filing (standing) 1.4 0 0.0 Walking about 1.7 0 0.0 Total 5 5.0 1.00
Table L72 : Measurements of metabolic rate at Lecture Hall D – Point 2. Lecture
Hall Activity Level Metabolic rate met No. of people met*people Average
D Seated quiet 1.0 4 4.0 - Point 2 Typing 1.1 0 0.0
Standing relaxed 1.2 0 0.0 Filing (standing) 1.4 0 0.0 Walking about 1.7 0 0.0 Total 4 4.0 1.00
Table L73 : Measurements of metabolic rate at Lecture Hall D – Point 3. Lecture
Hall Activity Level Metabolic rate met No. of people met*people Average
D Seated quiet 1.0 4 4.0 - Point 3 Typing 1.1 0 0.0
Standing relaxed 1.2 0 0.0 Filing (standing) 1.4 0 0.0 Walking about 1.7 0 0.0 Total 4 4.0 1.00
Univers
ity of
Mala
ya

299
Table L74 : Measurements of metabolic rate at Lecture Hall D – Point 4. Lecture
Hall Activity Level Metabolic rate met No. of people met*people Average
D Seated quiet 1.0 4 4.0 - Point 4 Typing 1.1 0 0.0
Standing relaxed 1.2 0 0.0 Filing (standing) 1.4 0 0.0 Walking about 1.7 0 0.0 Total 4 4.0 1.00
Table L75 : Measurements of metabolic rate at Lecture Hall D – Point 5. Lecture
Hall Activity Level Metabolic rate met No. of people met*people Average
D Seated quiet 1.0 5 5.0 - Point 5 Typing 1.1 0 0.0
Standing relaxed 1.2 0 0.0 Filing (standing) 1.4 0 0.0 Walking about 1.7 0 0.0 Total 5 5.0 1.00
Table L76 : Measurements of metabolic rate at Lecture Hall D – Point 6. Lecture
Hall Activity Level Metabolic rate met No. of people met*people Average
D Seated quiet 1.0 1 1.0 - Point 6 Typing 1.1 1 1.1
Standing relaxed 1.2 2 2.4 Filing (standing) 1.4 0 0.0 Walking about 1.7 0 0.0 Total 4 4.5 1.13
Table L77 : Measurements of clothing value at Lecture Hall D – Point 1.
Lecture Hall Clothing Insulation Clothing value clo No. of people clo*people Average
D Short-sleeve 0.19 2 0.38 - Point 1 Normal long-sleeve shirt 0.25 3 0.75
Normal trousers 0.15 5 0.75 Socks 0.02 0 0.00 Shoes 0.02 5 0.10 Jacket 0.36 3 1.08 Total 5 3.06 0.61
Univers
ity of
Mala
ya

300
Table L78 : Measurements of clothing value at Lecture Hall D – Point 2.
Lecture Hall Clothing Insulation Clothing value clo No. of people clo*people Average
D Short-sleeve 0.19 4 0.76 - Point 2 Normal long-sleeve shirt 0.25 0 0.00
Normal trousers 0.15 4 0.60 Socks 0.02 0 0.00 Shoes 0.02 4 0.08 Jacket 0.36 3 1.08 Total 4 2.52 0.63
Table L79 : Measurements of clothing value at Lecture Hall D – Point 3.
Lecture Hall Clothing Insulation Clothing value clo No. of people clo*people Average
D Short-sleeve 0.19 4 0.76 - Point 3 Normal long-sleeve shirt 0.25 0 0.00
Normal trousers 0.15 4 0.60 Socks 0.02 0 0.00 Shoes 0.02 4 0.08 Jacket 0.36 4 1.44 Total 4 2.88 0.72
Table L80 : Measurements of clothing value at Lecture Hall D – Point 4.
Lecture Hall Clothing Insulation Clothing value clo No. of people clo*people Average
D Short-sleeve 0.19 4 0.76 - Point 4 Normal long-sleeve shirt 0.25 0 0.00
Normal trousers 0.15 4 0.60 Socks 0.02 0 0.00 Shoes 0.02 4 0.08 Jacket 0.36 3 1.08 Total 4 2.52 0.63
Table L81 : Measurements of clothing value at Lecture Hall D – Point 5.
Lecture Hall Clothing Insulation Clothing value clo No. of people clo*people Average
D Short-sleeve 0.19 5 0.95 - Point 5 Normal long-sleeve shirt 0.25 0 0.00
Normal trousers 0.15 5 0.75 Socks 0.02 0 0.00 Shoes 0.02 5 0.10 Jacket 0.36 5 1.80 Total 5 3.60 0.72
Univers
ity of
Mala
ya
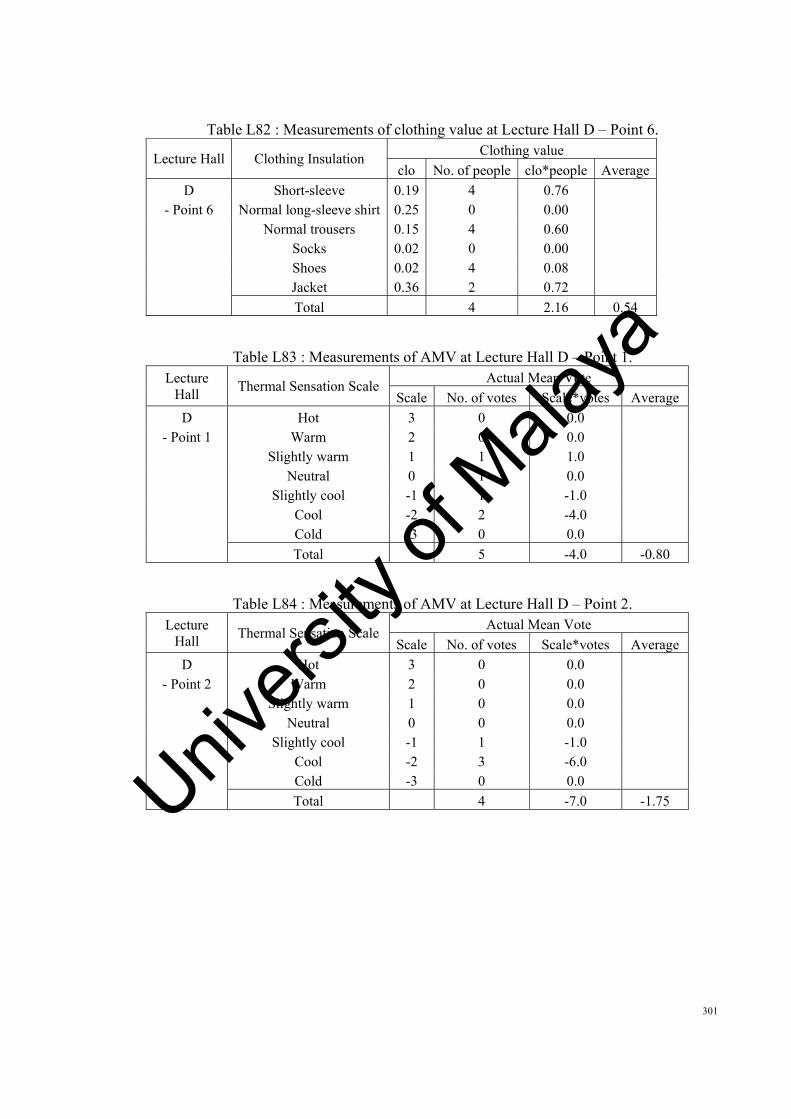
301
Table L82 : Measurements of clothing value at Lecture Hall D – Point 6.
Lecture Hall Clothing Insulation Clothing value clo No. of people clo*people Average
D Short-sleeve 0.19 4 0.76 - Point 6 Normal long-sleeve shirt 0.25 0 0.00
Normal trousers 0.15 4 0.60 Socks 0.02 0 0.00 Shoes 0.02 4 0.08 Jacket 0.36 2 0.72 Total 4 2.16 0.54
Table L83 : Measurements of AMV at Lecture Hall D – Point 1. Lecture
Hall Thermal Sensation Scale Actual Mean Vote Scale No. of votes Scale*votes Average
D Hot 3 0 0.0 - Point 1 Warm 2 0 0.0
Slightly warm 1 1 1.0 Neutral 0 1 0.0 Slightly cool -1 1 -1.0 Cool -2 2 -4.0 Cold -3 0 0.0
Total 5 -4.0 -0.80
Table L84 : Measurements of AMV at Lecture Hall D – Point 2. Lecture
Hall Thermal Sensation Scale Actual Mean Vote Scale No. of votes Scale*votes Average
D Hot 3 0 0.0 - Point 2 Warm 2 0 0.0
Slightly warm 1 0 0.0 Neutral 0 0 0.0 Slightly cool -1 1 -1.0 Cool -2 3 -6.0 Cold -3 0 0.0
Total 4 -7.0 -1.75
Univers
ity of
Mala
ya

302
Table L85 : Measurements of AMV at Lecture Hall D – Point 3. Lecture
Hall Thermal Sensation Scale Actual Mean Vote Scale No. of votes Scale*votes Average
D Hot 3 0 0.0 - Point 3 Warm 2 0 0.0
Slightly warm 1 0 0.0 Neutral 0 0 0.0 Slightly cool -1 3 -3.0 Cool -2 0 0.0 Cold -3 1 -3.0
Total 4 -6.0 -1.50
Table L86 : Measurements of AMV at Lecture Hall D – Point 4. Lecture
Hall Thermal Sensation Scale Actual Mean Vote Scale No. of votes Scale*votes Average
D Hot 3 0 0.0 - Point 4 Warm 2 0 0.0
Slightly warm 1 0 0.0 Neutral 0 0 0.0 Slightly cool -1 3 -3.0 Cool -2 0 0.0 Cold -3 1 -3.0
Total 4 -6.0 -1.50
Table L87 : Measurements of AMV at Lecture Hall D – Point 5. Lecture
Hall Thermal Sensation Scale Actual Mean Vote Scale No. of votes Scale*votes Average
D Hot 3 0 0.0 - Point 5 Warm 2 0 0.0
Slightly warm 1 0 0.0 Neutral 0 0 0.0 Slightly cool -1 4 -4.0 Cool -2 0 0.0 Cold -3 1 -3.0
Total 5 -7.0 -1.40
Univers
ity of
Mala
ya
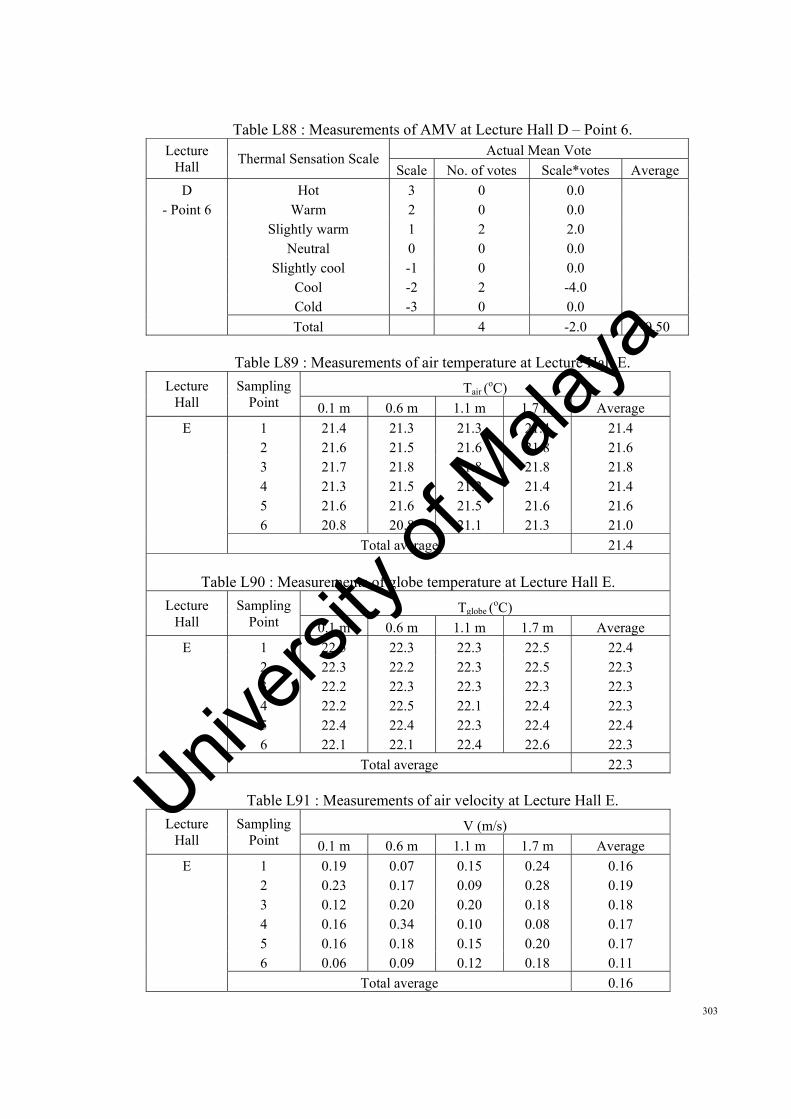
303
Table L88 : Measurements of AMV at Lecture Hall D – Point 6. Lecture
Hall Thermal Sensation Scale Actual Mean Vote Scale No. of votes Scale*votes Average
D Hot 3 0 0.0 - Point 6 Warm 2 0 0.0
Slightly warm 1 2 2.0 Neutral 0 0 0.0 Slightly cool -1 0 0.0 Cool -2 2 -4.0 Cold -3 0 0.0
Total 4 -2.0 -0.50
Table L89 : Measurements of air temperature at Lecture Hall E.
Lecture Hall
Sampling Point
Tair (oC)
0.1 m 0.6 m 1.1 m 1.7 m Average E 1 21.4 21.3 21.3 21.4 21.4 2 21.6 21.5 21.6 21.8 21.6 3 21.7 21.8 21.8 21.8 21.8 4 21.3 21.5 21.2 21.4 21.4 5 21.6 21.6 21.5 21.6 21.6 6 20.8 20.8 21.1 21.3 21.0 Total average 21.4
Table L90 : Measurements of globe temperature at Lecture Hall E.
Lecture Hall
Sampling Point
Tglobe (oC)
0.1 m 0.6 m 1.1 m 1.7 m Average E 1 22.5 22.3 22.3 22.5 22.4 2 22.3 22.2 22.3 22.5 22.3 3 22.2 22.3 22.3 22.3 22.3 4 22.2 22.5 22.1 22.4 22.3 5 22.4 22.4 22.3 22.4 22.4 6 22.1 22.1 22.4 22.6 22.3 Total average 22.3
Table L91 : Measurements of air velocity at Lecture Hall E.
Lecture Hall
Sampling Point
V (m/s)
0.1 m 0.6 m 1.1 m 1.7 m Average E 1 0.19 0.07 0.15 0.24 0.16 2 0.23 0.17 0.09 0.28 0.19 3 0.12 0.20 0.20 0.18 0.18 4 0.16 0.34 0.10 0.08 0.17 5 0.16 0.18 0.15 0.20 0.17 6 0.06 0.09 0.12 0.18 0.11 Total average 0.16
Univers
ity of
Mala
ya

304
Table L92 : Measurements of relative humidity at Lecture Hall E.
Lecture Hall
Sampling Point
RH (%)
0.1 m 0.6 m 1.1 m 1.7 m Average E 1 48.1 48.2 48.4 47.7 48.1 2 47.9 47.8 48.2 48.9 48.2 3 47.6 47.6 47.8 47.7 47.7 4 47.4 48.6 48.8 49.3 48.5 5 49.1 48.7 48.9 49.2 49.0 6 50.6 50.7 51.0 50.3 50.7 Total average 48.7
Table L93 : Measurements of metabolic rate at Lecture Hall E – Point 1. Lecture
Hall Activity Level Metabolic rate met No. of people met*people Average
E Seated quiet 1.0 4 4.0 - Point 1 Typing 1.1 0 0.0
Standing relaxed 1.2 1 1.2 Filing (standing) 1.4 0 0.0 Walking about 1.7 0 0.0 Total 5 5.2 1.04
Table L94 : Measurements of metabolic rate at Lecture Hall E – Point 2. Lecture
Hall Activity Level Metabolic rate met No. of people met*people Average
E Seated quiet 1.0 4 4.0 - Point 2 Typing 1.1 0 0.0
Standing relaxed 1.2 0 0.0 Filing (standing) 1.4 0 0.0 Walking about 1.7 0 0.0 Total 4 4.0 1.00
Table L95 : Measurements of metabolic rate at Lecture Hall E – Point 3. Lecture
Hall Activity Level Metabolic rate met No. of people met*people Average
E Seated quiet 1.0 5 5.0 - Point 3 Typing 1.1 0 0.0
Standing relaxed 1.2 0 0.0 Filing (standing) 1.4 0 0.0 Walking about 1.7 0 0.0 Total 5 5.0 1.00
Univers
ity of
Mala
ya

305
Table L96 : Measurements of metabolic rate at Lecture Hall E – Point 4. Lecture
Hall Activity Level Metabolic rate met No. of people met*people Average
E Seated quiet 1.0 5 5.0 - Point 4 Typing 1.1 0 0.0
Standing relaxed 1.2 0 0.0 Filing (standing) 1.4 0 0.0 Walking about 1.7 0 0.0 Total 5 5.0 1.00
Table L97 : Measurements of metabolic rate at Lecture Hall E – Point 5. Lecture
Hall Activity Level Metabolic rate met No. of people met*people Average
E Seated quiet 1.0 2 2.0 - Point 5 Typing 1.1 0 0.0
Standing relaxed 1.2 0 0.0 Filing (standing) 1.4 3 4.2 Walking about 1.7 0 0.0 Total 5 6.2 1.24
Table L98 : Measurements of metabolic rate at Lecture Hall E – Point 6. Lecture
Hall Activity Level Metabolic rate met No. of people met*people Average
E Seated quiet 1.0 4 4.0 - Point 6 Typing 1.1 0 0.0
Standing relaxed 1.2 0 0.0 Filing (standing) 1.4 0 0.0 Walking about 1.7 0 0.0 Total 4 4.0 1.00
Table L99 : Measurements of clothing value at Lecture Hall E – Point 1.
Lecture Hall Clothing Insulation Clothing value clo No. of people clo*people Average
E Short-sleeve 0.19 5 0.95 - Point 1 Normal long-sleeve shirt 0.25 0 0.00
Normal trousers 0.15 5 0.75 Socks 0.02 0 0.00 Shoes 0.02 5 0.10 Jacket 0.36 5 1.80 Total 5 3.60 0.72
Univers
ity of
Mala
ya
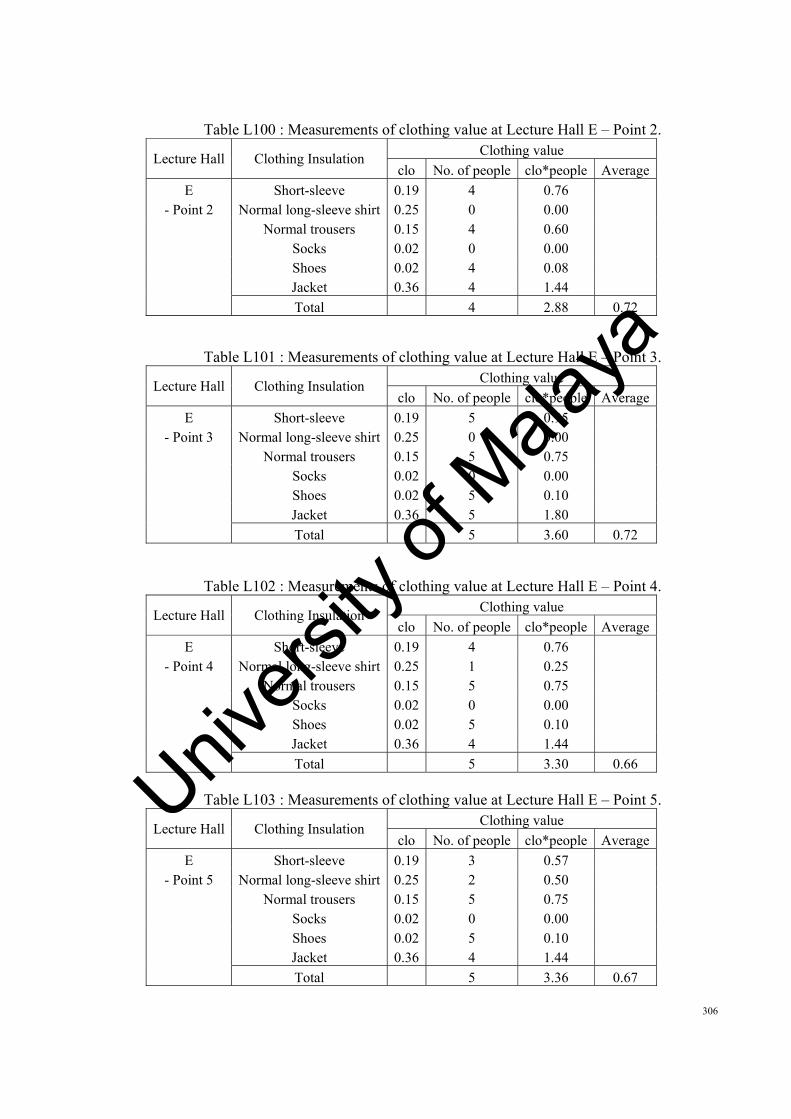
306
Table L100 : Measurements of clothing value at Lecture Hall E – Point 2.
Lecture Hall Clothing Insulation Clothing value clo No. of people clo*people Average
E Short-sleeve 0.19 4 0.76 - Point 2 Normal long-sleeve shirt 0.25 0 0.00
Normal trousers 0.15 4 0.60 Socks 0.02 0 0.00 Shoes 0.02 4 0.08 Jacket 0.36 4 1.44 Total 4 2.88 0.72
Table L101 : Measurements of clothing value at Lecture Hall E – Point 3.
Lecture Hall Clothing Insulation Clothing value clo No. of people clo*people Average
E Short-sleeve 0.19 5 0.95 - Point 3 Normal long-sleeve shirt 0.25 0 0.00
Normal trousers 0.15 5 0.75 Socks 0.02 0 0.00 Shoes 0.02 5 0.10 Jacket 0.36 5 1.80 Total 5 3.60 0.72
Table L102 : Measurements of clothing value at Lecture Hall E – Point 4.
Lecture Hall Clothing Insulation Clothing value clo No. of people clo*people Average
E Short-sleeve 0.19 4 0.76 - Point 4 Normal long-sleeve shirt 0.25 1 0.25
Normal trousers 0.15 5 0.75 Socks 0.02 0 0.00 Shoes 0.02 5 0.10 Jacket 0.36 4 1.44 Total 5 3.30 0.66
Table L103 : Measurements of clothing value at Lecture Hall E – Point 5.
Lecture Hall Clothing Insulation Clothing value clo No. of people clo*people Average
E Short-sleeve 0.19 3 0.57 - Point 5 Normal long-sleeve shirt 0.25 2 0.50
Normal trousers 0.15 5 0.75 Socks 0.02 0 0.00 Shoes 0.02 5 0.10 Jacket 0.36 4 1.44 Total 5 3.36 0.67
Univers
ity of
Mala
ya

307
Table L104 : Measurements of clothing value at Lecture Hall E – Point 6.
Lecture Hall Clothing Insulation Clothing value clo No. of people clo*people Average
E Short-sleeve 0.19 4 0.76 - Point 6 Normal long-sleeve shirt 0.25 0 0.00
Normal trousers 0.15 4 0.60 Socks 0.02 0 0.00 Shoes 0.02 4 0.08 Jacket 0.36 3 1.08 Total 4 2.52 0.63
Table L105 : Measurements of AMV at Lecture Hall E – Point 1.
Lecture Hall Thermal Sensation ScaleActual Mean Vote
Scale No. of votes Scale*votes Average E Hot 3 0 0.0
- Point 1 Warm 2 0 0.0 Slightly warm 1 0 0.0 Neutral 0 0 0.0 Slightly cool -1 4 -4.0 Cool -2 0 0.0 Cold -3 1 -3.0 Total 5 -7.0 -1.40
Table L106 : Measurements of AMV at Lecture Hall E – Point 2. Lecture
Hall Thermal Sensation ScaleActual Mean Vote
Scale No. of votes Scale*votes Average
E Hot 3 0 0.0 - Point 2 Warm 2 0 0.0
Slightly warm 1 0 0.0 Neutral 0 0 0.0 Slightly cool -1 3 -3.0 Cool -2 0 0.0 Cold -3 1 -3.0 Total 4 -6.0 -1.50
Univers
ity of
Mala
ya

308
Table L107 : Measurements of AMV at Lecture Hall E – Point 3. Lecture
Hall Thermal Sensation ScaleActual Mean Vote
Scale No. of votes Scale*votes Average
E Hot 3 0 0.0 - Point 3 Warm 2 0 0.0
Slightly warm 1 0 0.0 Neutral 0 0 0.0 Slightly cool -1 3 -3.0 Cool -2 2 -4.0 Cold -3 0 0.0 Total 5 -7.0 -1.40
Table L108 : Measurements of AMV at Lecture Hall E – Point 4. Lecture
Hall Thermal Sensation ScaleActual Mean Vote
Scale No. of votes Scale*votes Average
E Hot 3 0 0.0 - Point 4 Warm 2 0 0.0
Slightly warm 1 0 0.0 Neutral 0 0 0.0 Slightly cool -1 3 -3.0 Cool -2 2 -4.0 Cold -3 0 0.0 Total 5 -7.0 -1.40
Table L109 : Measurements of AMV at Lecture Hall E – Point 5. Lecture
Hall Thermal Sensation ScaleActual Mean Vote
Scale No. of votes Scale*votes Average
E Hot 3 0 0.0 - Point 5 Warm 2 0 0.0
Slightly warm 1 0 0.0 Neutral 0 0 0.0 Slightly cool -1 4 -4.0 Cool -2 0 0.0 Cold -3 1 -3.0 Total 5 -7.0 -1.40
Univers
ity of
Mala
ya

309
Table L110 : Measurements of AMV at Lecture Hall E – Point 6. Lecture
Hall Thermal Sensation ScaleActual Mean Vote
Scale No. of votes Scale*votes Average
E Hot 3 0 0.0 - Point 6 Warm 2 0 0.0
Slightly warm 1 0 0.0 Neutral 0 0 0.0 Slightly cool -1 2 -2.0 Cool -2 2 -4.0 Cold -3 0 0.0 Total 4 -6.0 -1.50
Table L111 : Measurements of air temperature at Lecture Hall F.
Lecture Hall
Sampling Point
Tair (oC)
0.1 m 0.6 m 1.1 m 1.7 m Average F 1 24.7 24.6 24.7 24.5 24.6 2 24.5 24.6 24.6 24.6 24.6 3 25.0 25.0 25.1 25.0 25.0 4 25.2 25.2 25.3 25.3 25.3 5 25.3 25.3 25.3 25.4 25.3 6 25.4 25.4 25.3 25.1 25.3 Total average 25.0
Table L112 : Measurements of globe temperature at Lecture Hall F.
Lecture Hall
Sampling Point
Tglobe (oC)
0.1 m 0.6 m 1.1 m 1.7 m Average F 1 26.7 26.1 25.5 24.9 25.8 2 26.1 26.1 25.5 24.7 25.6 3 25.3 25.4 25.0 25.1 25.2 4 26.2 25.3 24.4 24.8 25.2 5 25.7 25.3 25.1 25.1 25.3 6 25.1 25.1 25.3 25.3 25.2 Total average 25.4
Table L113 : Measurements of air velocity at Lecture Hall F.
Lecture Hall
Sampling Point
V (m/s)
0.1 m 0.6 m 1.1 m 1.7 m Average F 1 0.06 0.07 0.14 0.12 0.10 2 0.08 0.04 0.06 0.17 0.09 3 0.15 0.09 0.09 0.22 0.14 4 0.03 0.05 0.15 0.16 0.10 5 0.07 0.05 0.06 0.18 0.09 6 0.02 0.07 0.08 0.18 0.09 Total average 0.10
Univers
ity of
Mala
ya

310
Table L114 : Measurements of relative humidity at Lecture Hall F.
Lecture Hall
Sampling Point
RH (%)
0.1 m 0.6 m 1.1 m 1.7 m Average F 1 60.8 61.0 61.7 61.9 61.4 2 61.6 61.8 62.0 61.6 61.8 3 64.0 63.4 63.4 62.9 63.4 4 63.6 63.6 64.2 63.7 63.8 5 62.7 61.6 61.5 62.5 62.1 6 63.1 61.1 60.6 61.1 61.5 Total average 62.3
Table L115 : Measurements of metabolic rate at Lecture Hall F – Point 1. Lecture
Hall Activity Level Metabolic rate met No. of people met*people Average
F Seated quiet 1.0 6 6.0 - Point 1 Typing 1.1 0 0.0
Standing relaxed 1.2 0 0.0 Filing (standing) 1.4 1 1.4 Walking about 1.7 0 0.0 Total 7 7.4 1.06
Table L116 : Measurements of metabolic rate at Lecture Hall F – Point 2. Lecture
Hall Activity Level Metabolic rate met No. of people met*people Average
F Seated quiet 1.0 6 6.0 - Point 2 Typing 1.1 0 0.0
Standing relaxed 1.2 1 1.2 Filing (standing) 1.4 0 0.0 Walking about 1.7 0 0.0 Total 7 7.2 1.03
Table L117 : Measurements of metabolic rate at Lecture Hall F – Point 3. Lecture
Hall Activity Level Metabolic rate met No. of people met*people Average
F Seated quiet 1.0 6 6.0 - Point 3 Typing 1.1 0 0.0
Standing relaxed 1.2 0 0.0 Filing (standing) 1.4 1 1.4 Walking about 1.7 0 0.0 Total 7 7.4 1.06
Univers
ity of
Mala
ya

311
Table L118 : Measurements of metabolic rate at Lecture Hall F – Point 4. Lecture
Hall Activity Level Metabolic rate met No. of people met*people Average
F Seated quiet 1.0 6 6.0 - Point 4 Typing 1.1 0 0.0
Standing relaxed 1.2 0 0.0 Filing (standing) 1.4 1 1.4 Walking about 1.7 0 0.0 Total 7 7.4 1.06
Table L119 : Measurements of metabolic rate at Lecture Hall F – Point 5. Lecture
Hall Activity Level Metabolic rate met No. of people met*people Average
F Seated quiet 1.0 5 5.0 - Point 5 Typing 1.1 0 0.0
Standing relaxed 1.2 2 2.4 Filing (standing) 1.4 0 0.0 Walking about 1.7 0 0.0 Total 7 7.4 1.06
Table L120 : Measurements of metabolic rate at Lecture Hall F – Point 6. Lecture
Hall Activity Level Metabolic rate met No. of people met*people Average
F Seated quiet 1.0 5 5.0 - Point 6 Typing 1.1 0 0.0
Standing relaxed 1.2 2 2.4 Filing (standing) 1.4 0 0.0 Walking about 1.7 0 0.0 Total 7 7.4 1.06
Table L121 : Measurements of clothing value at Lecture Hall F – Point 1.
Lecture Hall Clothing Insulation Clothing value clo No. of people clo*people Average
F Short-sleeve 0.19 7 1.33 - Point 1 Normal long-sleeve shirt 0.25 0 0.00
Normal trousers 0.15 7 1.05 Socks 0.02 0 0.00 Shoes 0.02 7 0.14 Jacket 0.36 7 2.52 Total 7 5.04 0.72
Univers
ity of
Mala
ya

312
Table L122 : Measurements of clothing value at Lecture Hall F – Point 2.
Lecture Hall Clothing Insulation Clothing value clo No. of people clo*people Average
F Short-sleeve 0.19 6 1.14 - Point 2 Normal long-sleeve shirt 0.25 1 0.25
Normal trousers 0.15 7 1.05 Socks 0.02 0 0.00 Shoes 0.02 7 0.14 Jacket 0.36 7 2.52 Total 7 5.10 0.73
Table L123 : Measurements of clothing value at Lecture Hall F – Point 3.
Lecture Hall Clothing Insulation Clothing value clo No. of people clo*people Average
F Short-sleeve 0.19 7 1.33 - Point 3 Normal long-sleeve shirt 0.25 0 0.00
Normal trousers 0.15 7 1.05 Socks 0.02 0 0.00 Shoes 0.02 7 0.14 Jacket 0.36 4 1.44 Total 7 3.96 0.57
Table L124 : Measurements of clothing value at Lecture Hall F – Point 4.
Lecture Hall Clothing Insulation Clothing value clo No. of people clo*people Average
F Short-sleeve 0.19 6 1.14 - Point 4 Normal long-sleeve shirt 0.25 1 0.25
Normal trousers 0.15 7 1.05 Socks 0.02 0 0.00 Shoes 0.02 7 0.14 Jacket 0.36 3 1.08 Total 7 3.66 0.52
Table L125 : Measurements of clothing value at Lecture Hall F – Point 5.
Lecture Hall Clothing Insulation Clothing value clo No. of people clo*people Average
F Short-sleeve 0.19 7 1.33 - Point 5 Normal long-sleeve shirt 0.25 0 0.00
Normal trousers 0.15 7 1.05 Socks 0.02 0 0.00 Shoes 0.02 7 0.14 Jacket 0.36 7 2.52 Total 7 5.04 0.72
Univers
ity of
Mala
ya

313
Table L126 : Measurements of clothing value at Lecture Hall F – Point 6.
Lecture Hall Clothing Insulation Clothing value clo No. of people clo*people Average
F Short-sleeve 0.19 4 0.76 - Point 6 Normal long-sleeve shirt 0.25 3 0.75
Normal trousers 0.15 7 1.05 Socks 0.02 0 0.00 Shoes 0.02 7 0.14 Jacket 0.36 2 0.72 Total 7 3.42 0.49
Table L127 : Measurements of AMV at Lecture Hall F – Point 1.
Lecture Hall Thermal Sensation ScaleActual Mean Vote
Scale No. of votes Scale*votes Average F Hot 3 0 0.0
- Point 1 Warm 2 4 8.0 Slightly warm 1 3 3.0 Neutral 0 0 0.0 Slightly cool -1 0 0.0 Cool -2 0 0.0 Cold -3 0 0.0 Total 7 11.0 1.57
Table L128 : Measurements of AMV at Lecture Hall F – Point 2.
Lecture Hall Thermal Sensation ScaleActual Mean Vote
Scale No. of votes Scale*votes Average F Hot 3 0 0.0
- Point 2 Warm 2 0 0.0 Slightly warm 1 7 7.0 Neutral 0 0 0.0 Slightly cool -1 0 0.0 Cool -2 0 0.0 Cold -3 0 0.0 Total 7 7.0 1.00
Univers
ity of
Mala
ya

314
Table L129 : Measurements of AMV at Lecture Hall F – Point 3. Lecture
Hall Thermal Sensation Scale Actual Mean Vote Scale No. of votes Scale*votes Average
F Hot 3 0 0.0 - Point 3 Warm 2 0 0.0
Slightly warm 1 0 0.0 Neutral 0 0 0.0 Slightly cool -1 5 -5.0 Cool -2 2 -4.0 Cold -3 0 0.0
Total 7 -9.0 -1.29
Table L130 : Measurements of AMV at Lecture Hall F – Point 4. Lecture
Hall Thermal Sensation Scale Actual Mean Vote Scale No. of votes Scale*votes Average
F Hot 3 0 0.0 - Point 4 Warm 2 0 0.0
Slightly warm 1 0 0.0 Neutral 0 0 0.0 Slightly cool -1 7 -7.0 Cool -2 0 0.0 Cold -3 0 0.0
Total 7 -7.0 -1.00
Table L131 : Measurements of AMV at Lecture Hall F – Point 5. Lecture
Hall Thermal Sensation Scale Actual Mean Vote Scale No. of votes Scale*votes Average
F Hot 3 0 0.0 - Point 5 Warm 2 0 0.0
Slightly warm 1 0 0.0 Neutral 0 7 0.0 Slightly cool -1 0 0.0 Cool -2 0 0.0 Cold -3 0 0.0
Total 7 0.0 0.00
Univers
ity of
Mala
ya

315
Table L132 : Measurements of AMV at Lecture Hall F – Point 6. Lecture
Hall Thermal Sensation Scale Actual Mean Vote Scale No. of votes Scale*votes Average
F Hot 3 0 0.0 - Point 6 Warm 2 0 0.0
Slightly warm 1 0 0.0 Neutral 0 3 0.0 Slightly cool -1 4 -4.0 Cool -2 0 0.0 Cold -3 0 0.0
Total 7 -4.0 -0.57
Univers
ity of
Mala
ya
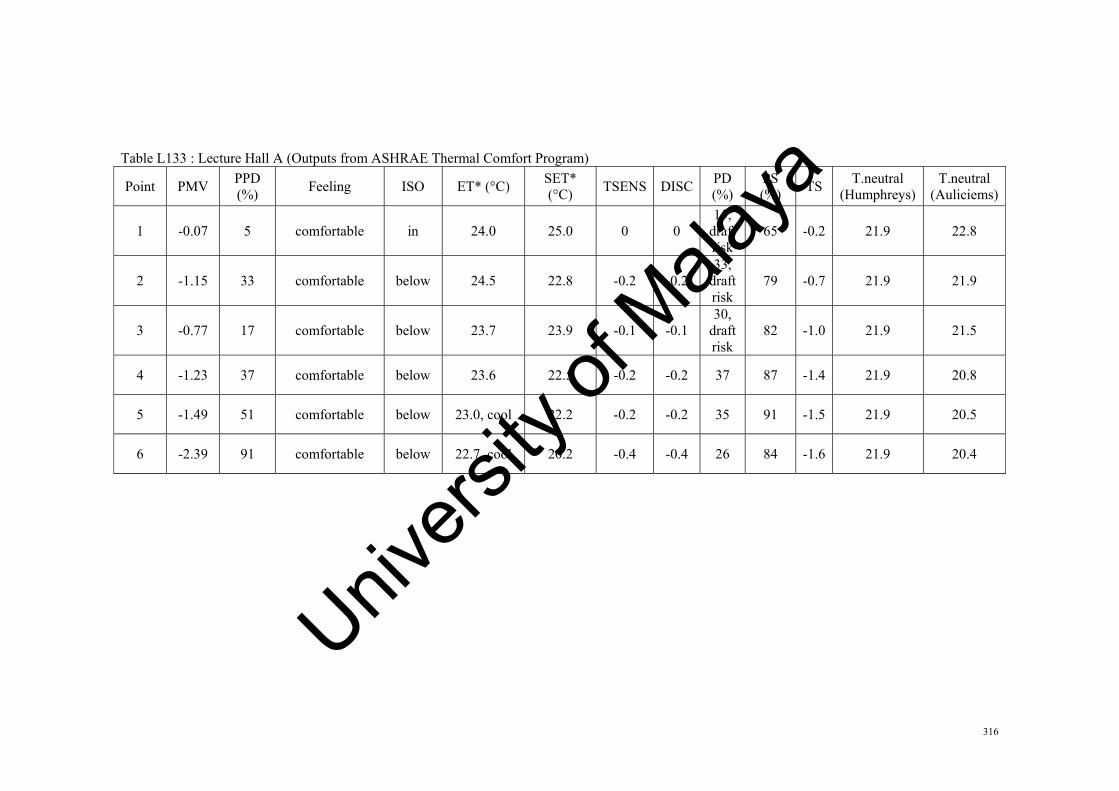
316
Table L133 : Lecture Hall A (Outputs from ASHRAE Thermal Comfort Program)
Point PMV PPD (%) Feeling ISO ET* (°C) SET*
(°C) TSENS DISCPD (%)
PS (%) TS T.neutral
(Humphreys)T.neutral
(Auliciems)
1 -0.07 5 comfortable in 24.0 25.0 0 0 15,
draft risk
65 -0.2 21.9 22.8
2 -1.15 33 comfortable below 24.5 22.8 -0.2 -0.2 33,
draft risk
79 -0.7 21.9 21.9
3 -0.77 17 comfortable below 23.7 23.9 -0.1 -0.1 30,
draft risk
82 -1.0 21.9 21.5
4 -1.23 37 comfortable below 23.6 22.5 -0.2 -0.2 37 87 -1.4 21.9 20.8
5 -1.49 51 comfortable below 23.0, cool 22.2 -0.2 -0.2 35 91 -1.5 21.9 20.5
6 -2.39 91 comfortable below 22.7, cool 20.2 -0.4 -0.4 26 84 -1.6 21.9 20.4
Univers
ity of
Mala
ya

317
Table L134 : Lecture Hall B (Outputs from ASHRAE Thermal Comfort Program)
Point PMV PPD (%) Feeling ISO ET* (°C) SET*
(°C) TSENS DISCPD (%)
PS (%) TS T.neutral
(Humphreys)T.neutral
(Auliciems)
1 -1.08 30 comfortable below 22.7, cool 22.1 -0.2 -0.2 32,
draft risk
100 -0.9 21.9 21.5
2 -1.14 32 comfortable below 22.7, cool 22.3 -0.2 -0.2 17,
draft risk
76 -0.8 21.9 21.6
3 -0.62 13 comfortable below 22.9, cool 23.7 -0.1 -0.1 24,
draft risk
87 -0.9 21.9 21.4
4 -1.36 43 comfortable below 22.8, cool 21.7 -0.3 -0.3 14 69 -1.0 21.9 21.4
5 -0.89 22 comfortable below 23.0, cool 23.2 -0.1 -0.1 23,
draft risk
83 -0.9 21.9 21.4
6 -0.71 16 comfortable below 22.8, cool 23.3 -0.1 -0.1 14 69 -0.9 21.9 21.4
Univers
ity of
Mala
ya

318
Table L135 : Lecture Hall C (Outputs from ASHRAE Thermal Comfort Program)
Point PMV PPD (%) Feeling ISO ET* (°C) SET*
(°C) TSENS DISCPD (%)
PS (%) TS T.neutral
(Humphreys)T.neutral
(Auliciems)
1 -0.83 20 comfortable below 23.0, cool 23.1 -0.1 -0.1 24,
draft risk
89 -0.7 21.9 21.8
2 -0.43 9 comfortable in 22.9, cool 23.2 -0.1 -0.1 13 69 -0.6 21.9 22.0
3 -0.73 16 comfortable below 23.0, cool 22.9 -0.2 -0.2 12 69 -0.4 21.9 22.3
4 -0.12 5 comfortable in 22.9, cool 24.0 0 0 15 76 -0.5 21.9 22.2
5 -0.94 23 comfortable below 22.9, cool 21.1 -0.2 -0.2 16,
draft risk
76 -0.6 21.9 21.9
6 -0.92 23 comfortable below 22.9, cool 22.7 -0.2 -0.2 28,
draft risk
97 -0.6 21.9 21.9
Univers
ity of
Mala
ya

319
Table L136 : Lecture Hall D (Outputs from ASHRAE Thermal Comfort Program)
Point PMV PPD (%) Feeling ISO ET* (°C) SET*
(°C) TSENS DISCPD (%)
PS (%) TS T.neutral
(Humphreys)T.neutral
(Auliciems)
1 -1.16 33 comfortable below 22.0, cool 21.8 -0.2 -0.2 13 81 -0.5 21.9 22.3
2 -1.19 35 comfortable below 22.1, cool 22.0 -0.2 -0.2 16,
draft risk
82 -0.8 21.9 21.9
3 -0.92 23 comfortable below 22.2, cool 22.7 -0.2 -0.2 16,
draft risk
81 -0.7 21.9 22.0
4 -1.04 28 comfortable below 22.1, cool 21.9 -0.2 -0.2 12 77 -0.5 21.9 22.4
5 -1.17 34 comfortable below 22.3, cool 22.1 -0.2 -0.2 28,
draft risk
100 -0.8 21.9 21.9
6 -1.17 34 comfortable below 22.2, cool 21.7 -0.2 -0.2 20,
draft risk
89 -0.8 21.9 21.8
Univers
ity of
Mala
ya

320
Table L137 : Lecture Hall E (Outputs from ASHRAE Thermal Comfort Program)
Point PMV PPD (%) Feeling ISO ET* (°C) SET*
(°C) TSENS DISCPD (%)
PS (%) TS T.neutral
(Humphreys)T.neutral
(Auliciems)
1 -1.04 28 comfortable below 22.5, cool 22.8 -0.2 -0.2 22,
draft risk
88 -0.9 21.9 21.6
2 -1.14 33 comfortable below 22.3, cool 22.3 -0.2 -0.2 26,
draft risk
96 -0.9 21.9 21.7
3 -1.10 31 comfortable below 22.3, cool 22.4 -0.2 -0.2 24,
draft risk
94 -0.8 21.9 21.8
4 -1.25 38 comfortable below 22.4, cool 22.1 -0.2 -0.2 24,
draft risk
91 -0.9 21.9 21.6
5 -0.56 12 comfortable below 22.4, cool 23.2 -0.1 -0.1 23,
draft risk
91 -0.9 21.9 21.7
6 -1.13 32 comfortable below 22.3, cool 22.2 -0.2 -0.2 16,
draft risk
76 -1.0 21.9 21.4
Univers
ity of
Mala
ya

321
Table L138 : Lecture Hall F (Outputs from ASHRAE Thermal Comfort Program)
Point PMV PPD (%) Feeling ISO ET*
(°C) SET* (°C) TSENS DISC PD
(%) PS (%) TS T.neutral (Humphreys)
T.neutral (Auliciems)
1 0.51 10 comfortable above 26.0 26.8 0.3 0.4 10
31, not enough
air movement
0 21.9 23.1
2 0.30 7 comfortable in 25.8 26.4 0.1 0.2 10
33, not enough
air movement
0 21.9 23.1
3 0.05 5 comfortable in 25.4 25.2 0 0 14
49, not enough
air movement
0.1 21.9 23.3
4 0.10 5 comfortable in 25.4, too
humid 24.8 0 0 10
37, not enough
air movement
0.2 21.9 23.5
5 0.44 9 comfortable in 25.6, too
humid 26.5 0.2 0.3 10
37, not enough
air movement
0.2 21.9 23.5
6 0.00 5 comfortable in 25.3 24.5 0 0 10
38,not enough
air movement
0.2 21.9 23.5
Univers
ity of
Mala
ya

322
Appendix M : Graphs of actual mean vote versus operative temperature for lecture
halls
Figure M1 : Graph of AMV vs Top for Lecture Hall A.
Figure M2 : Graph of AMV vs Top for Lecture Hall B.
y = 0.6634x ‐ 16.972R² = 0.4065
‐3.00
‐2.50
‐2.00
‐1.50
‐1.00
‐0.50
0.00
0.50
22.00 22.50 23.00 23.50 24.00 24.50 25.00 25.50 26.00 26.50
Actual M
ean
Vote
Operative temperature (oC)
Lecture Hall A
y = 0.5067x ‐ 12.465R² = 0.0034
‐2.50
‐2.00
‐1.50
‐1.00
‐0.50
0.00
0.50
22.00 22.50 23.00 23.50 24.00 24.50 25.00
Actual M
ean
Vote
Operative temperature (oC)
Lecture Hall B
Univers
ity of
Mala
ya

323
Figure M3 : Graph of AMV vs Top for Lecture Hall C.
Figure M4 : Graph of AMV vs Top for Lecture Hall D.
y = 1.2016x ‐ 28.765R² = 0.0301
‐2.50
‐2.00
‐1.50
‐1.00
‐0.50
0.00
0.50
22.50 23.00 23.50 24.00 24.50Actual M
ean
Vote
Operative temperature (oC)
Lecture Hall C
y = 2.0808x ‐ 47.401R² = 0.0349
‐2.00
‐1.50
‐1.00
‐0.50
0.00
0.50
1.00
22.00 22.20 22.40 22.60 22.80 23.00
Actual M
ean
Vote
Operative temperature (oC)
Lecture Hall D
Univers
ity of
Mala
ya
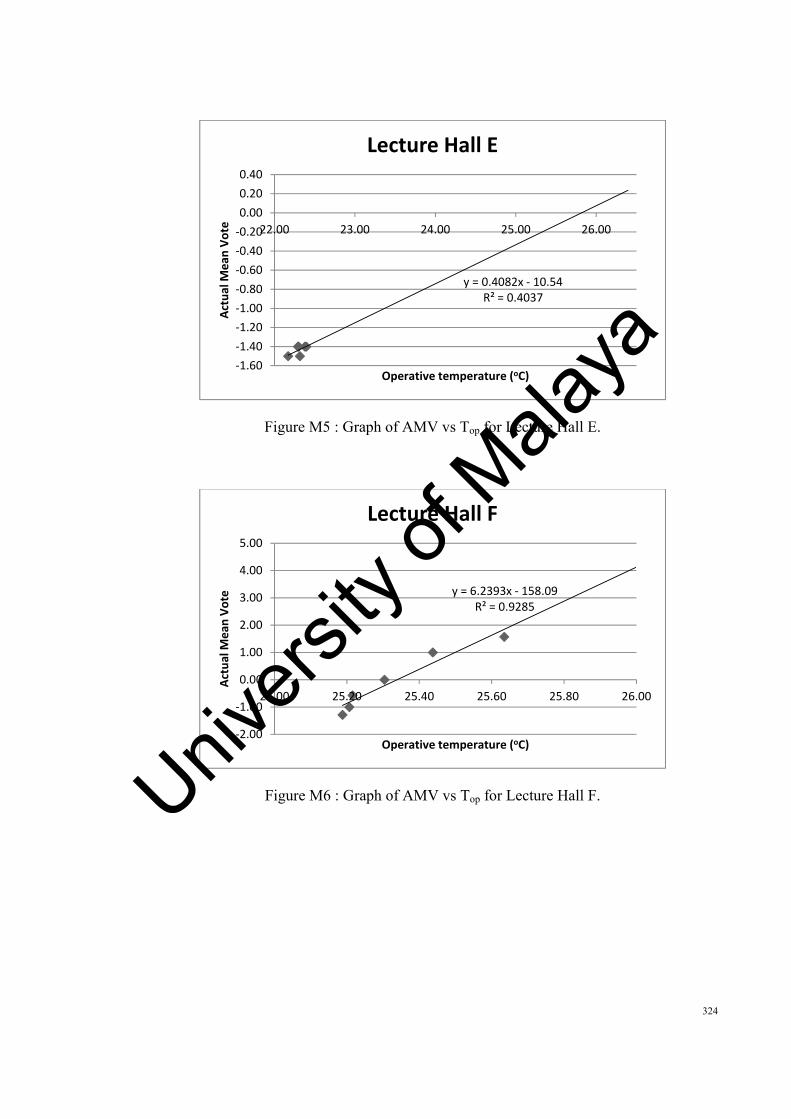
324
Figure M5 : Graph of AMV vs Top for Lecture Hall E.
Figure M6 : Graph of AMV vs Top for Lecture Hall F.
y = 0.4082x ‐ 10.54R² = 0.4037
‐1.60
‐1.40
‐1.20
‐1.00
‐0.80
‐0.60
‐0.40
‐0.20
0.00
0.20
0.40
22.00 23.00 24.00 25.00 26.00Actual M
ean
Vote
Operative temperature (oC)
Lecture Hall E
y = 6.2393x ‐ 158.09R² = 0.9285
‐2.00
‐1.00
0.00
1.00
2.00
3.00
4.00
5.00
25.00 25.20 25.40 25.60 25.80 26.00
Actual M
ean
Vote
Operative temperature (oC)
Lecture Hall F
Univers
ity of
Mala
ya

325
Appendix N : Residual analysis for lecture halls
No. Explanatory variable, Tout (°C)
Response variable, Tn (°C)
Fitted value, Tn (°C)
Residual, e = Response variable - Fitted value
1 33.02 25.58 25.57 0.02 2 26.30 24.60 23.72 0.88 3 26.70 23.94 23.83 0.11 4 26.68 22.78 23.82 -1.04 5 33.90 25.82 25.81 0.01 6 32.08 25.34 25.31 0.03
Univers
ity of
Mala
ya

326
Appendix O : Bias uncertainty analysis for lecture halls
Table O1 : Bias uncertainty analysis for Lecture Hall A.
Point V (m/s) Tglobe (oC) Tair (
oC) RH (%) Tout (oC)
1 0.14 24.0 24.0 51.2 33.12 0.24 24.3 22.1 48.5 33.13 0.21 23.6 21.2 47.4 33.04 0.23 23.3 19.7 46.0 33.05 0.21 22.7 19.1 46.5 33.06 0.16 22.5 19.1 46.4 32.9
Average 0.20 23.4 20.8 47.7 33.0
Maximum 0.24 24.3 24.0 51.2 33.1
Minimum 0.14 22.5 19.1 46.0 32.9
Count 6 6 6 6 6
Bias Uncertainty 0.018 0.30 0.82 0.86 0.03
Error (%) 8.96 1.28 3.92 1.81 0.10
Table O2 : Bias uncertainty analysis for Lecture Hall B.
Point V (m/s) Tglobe (oC) Tair (
oC) RH (%) Tout (oC)
1 0.22 22.4 21.3 61.8 26.42 0.12 22.5 21.4 62.5 26.33 0.17 22.6 21.0 62.6 26.24 0.10 22.6 20.9 63.1 26.25 0.16 22.7 21.0 62.4 26.36 0.10 22.7 21.0 63.0 26.4
Average 0.15 22.6 21.1 62.6 26.3
Maximum 0.22 22.7 21.4 63.1 26.4
Minimum 0.10 22.4 20.9 61.8 26.2
Count 6 6 6 6 6
Bias Uncertainty 0.020 0.05 0.08 0.23 0.03
Error (%) 13.79 0.22 0.36 0.36 0.13
Univers
ity of
Mala
ya

327
Table O3 : Bias uncertainty analysis for Lecture Hall C.
Point V (m/s) Tglobe (oC) Tair (
oC) RH (%) Tout (oC)
1 0.18 22.7 21.9 69.8 26.62 0.10 22.7 22.2 68.0 26.73 0.10 22.7 22.8 68.8 26.84 0.12 22.7 22.7 67.1 26.85 0.12 22.7 22.1 69.6 26.76 0.21 22.6 22.0 69.7 26.6
Average 0.14 22.7 22.3 68.8 26.7
Maximum 0.21 22.7 22.8 69.8 26.8
Minimum 0.10 22.6 21.9 67.1 26.6
Count 6 6 6 6 6
Bias Uncertainty 0.018 0.02 0.14 0.45 0.03
Error (%) 13.25 0.07 0.64 0.66 0.12
Table O4 : Bias uncertainty analysis for Lecture Hall D.
Point V (m/s) Tglobe (oC) Tair (
oC) RH (%) Tout (oC)
1 0.11 22.1 22.9 49.1 26.82 0.12 22.1 22.1 47.4 26.63 0.12 22.2 22.2 48.2 26.64 0.10 22.1 23.2 48.5 26.85 0.21 22.2 22.0 49.9 26.76 0.15 22.2 21.8 48.5 26.6
Average 0.13 22.2 22.3 48.6 26.7
Maximum 0.21 22.2 23.2 49.9 26.8
Minimum 0.10 22.1 21.8 47.4 26.6
Count 6 6 6 6 6
Bias Uncertainty 0.018 0.02 0.23 0.42 0.03
Error (%) 13.39 0.08 1.04 0.87 0.12
Univers
ity of
Mala
ya

328
Table O5 : Bias uncertainty analysis for Lecture Hall E.
Point V (m/s) Tglobe (oC) Tair (
oC) RH (%) Tout (oC)
1 0.16 22.4 21.4 48.1 33.92 0.19 22.3 21.6 48.2 33.93 0.18 22.3 21.8 47.7 34.04 0.17 22.3 21.4 48.5 33.95 0.17 22.4 21.6 49.0 33.96 0.11 22.3 21.0 50.7 33.8
Average 0.16 22.3 21.4 48.7 33.9
Maximum 0.19 22.4 21.8 50.7 34.0
Minimum 0.11 22.3 21.0 47.7 33.8
Count 6 6 6 6 6
Bias Uncertainty 0.013 0.02 0.13 0.50 0.03
Error (%) 8.12 0.07 0.60 1.02 0.10
Table O6 : Bias uncertainty analysis for Lecture Hall F.
Point V (m/s) Tglobe (oC) Tair (
oC) RH (%) Tout (oC)
1 0.10 25.8 24.6 61.4 32.02 0.09 25.6 24.6 61.8 32.03 0.14 25.2 25.0 63.4 32.14 0.10 25.2 25.3 63.8 32.15 0.09 25.3 25.3 62.1 32.26 0.09 25.2 25.3 61.5 32.1
Average 0.10 25.4 25.0 62.3 32.1
Maximum 0.14 25.8 25.3 63.8 32.2
Minimum 0.09 25.2 24.6 61.4 32.0
Count 6 6 6 6 6
Bias Uncertainty 0.008 0.10 0.13 0.40 0.03
Error (%) 8.37 0.39 0.50 0.65 0.10
Univers
ity of
Mala
ya

329
Bibliography
ASHRAE. (1995). Thermal Comfort Tool CD (ASHRAE Item Code 94030). Atlanta USA: American Society Of Heating, Refrigerating and Air-conditioning Engineers.
ANSI/ASHRAE Standard 55. (2004). Thermal environmental conditions for human occupancy. Atlanta: American Society of Heating, Refrigerating and Air-conditioning Engineers.
ASHRAE Applications. (2007). Health Care Facilities. Atlanta USA: American Society Of Heating, Refrigerating and Air-conditioning Engineers.
ASHRAE Fundamentals Handbook. (2005). Thermal Comfort. Atlanta: American Society of Heating, Refrigerating and Air-conditioning Engineers.
ASHRAE Fundamentals Handbook. (2009). Thermal Comfort. Atlanta USA: American Society Of Heating, Refrigerating and Air-conditioning Engineers.
ASHRAE RP- 884. (1997). Developing an adaptive model of thermal comfort and preference. American Society of Heating, Refrigerating and Air Conditioning Engineers, Inc., and Macquarie Research, Ltd.: de Dear, R., Brager, G., & Cooper, D.
Al-Homoud, M. S., Abdou, A. A., & Budaiwi, I. M. (2009). Assessment of monitored energy use and thermal comfort conditions in mosques in hot-humid climates. Energy and Buildings, 41(6), 607-614.
Arens, E., Humphreys, M. A., de Dear, R., & Zhang, H. (2010). Are ‘class A’ temperature requirements realistic or desirable? Building and Environment, 45(1), 4-10.
Atthajariyakul, S., & Leephakpreeda, T. (2004). Real-time determination of optimal indoor-air condition for thermal comfort, air quality and efficient energy usage. Energy and Buildings, 36(7), 720-733.
Atthajariyakul, S., & Lertsatittanakorn, C. (2008). Small fan assisted air conditioner for thermal comfort and energy saving in Thailand. Energy Conversion and Management, 49(10), 2499-2504.
Auliciems, A. (1981). Towards a psycho-physiological model of thermal perception. Biometeorology, 25(2), 109-122.
Univers
ity of
Mala
ya

330
Auliciems, A., & de Dear, R. (1986). Air conditioning in Australia I : Human thermal factors. Architectural Science Review, 29, 67-75.
Barlow, S., & Fiala, D. (2007). Occupant comfort in UK offices—How adaptive comfort theories might influence future low energy office refurbishment strategies. Energy and Buildings, 39(7), 837-846.
Becker, R., & Paciuk, M. (2009). Thermal comfort in residential buildings – Failure to predict by Standard model. Building and Environment, 44(5), 948-960.
Bouden, C., & Ghrab, N. (2005). An adaptive thermal comfort model for the Tunisian context: a field study results. Energy and Buildings, 37(9), 952-963.
Brager, G. S., & de Dear, R. J. (1998). Thermal adaptation in the built environment: a literature review. Energy and Buildings, 27(1), 83-96.
Brager, G. S., Fountain, M. E., Benton, C. C., Arens, E. A., & Bauman, F. S. (1993). A comparison of methods for assessing thermal sensation and acceptability in the field. In Nigel, O. (Ed.), Proceedings of Thermal Comfort: Past, Present and Future (pp. 17-39). Watford, United Kingdom: British Research Establishment.
Buratti, C., & Ricciardi, P. (2009). Adaptive analysis of thermal comfort in university classrooms: Correlation between experimental data and mathematical models. Building and Environment, 44(4), 674-687.
Cena, K., & de Dear, R. (2001). Thermal comfort and behavioural strategies in office buildings located in a hot-arid climate. Journal of Thermal Biology, 26(4-5), 409-414.
Cheong, K. W. D., Djunaedy, E., Chua, Y. L., Tham, K. W., Sekhar, S. C., Wong, N. H., & Ullah, M. B. (2003). Thermal comfort study of an air-conditioned lecture theatre in the tropics. Building and Environment, 38(1), 63-73.
Chun, C., Kwok, A., & Tamura, A. (2004). Thermal comfort in transitional spaces--basic concepts: literature review and trial measurement. Building and Environment, 39(10), 1187-1192.
de Dear, R., & Brager, G. S. (1998). Developing an adaptive model of thermal comfort and preference. ASHRAE Transactions, 104(1), 1-18.
Univers
ity of
Mala
ya

331
de Dear, R. J., & Brager, G. S. (2002). Thermal comfort in naturally ventilated buildings: revisions to ASHRAE Standard 55. Energy and Buildings, 34(6), 549-561.
de Dear, R. J., Leow, K. G., & Foo, S. C. (1991). Thermal comfort in the humid tropics: Field experiments in air conditioned and naturally ventilated buildings in Singapore. International Journal of Biometeorology, 34(4), 259-265.
Deng, S., Li, Z., & Qu, M. (2009). Indoor thermal comfort characteristics under the control of a direct expansion air conditioning unit having a variable-speed compressor and a supply air fan. Applied Thermal Engineering, 29(11-12), 2187-2193.
Fanger, P. O., & Toftum, J. (2002). Extension of the PMV model to non-air-conditioned buildings in warm climates. Energy and Buildings, 34(6), 533-536.
Feriadi, H., & Wong, N. H. (2004). Thermal comfort for naturally ventilated houses in Indonesia. Energy and Buildings, 36(7), 614-626.
Goto, T., Toftum, J., de Dear, R. J., & Fanger, P. O. (2002). Thermal sensation and comfort with transient metabolic rates. In Proceedings of Indoor Air (pp. 1038-1043). Monterey, USA: Indoor Air.
Havenith, G. (2001). Temperature regulation and technology. Gerontechnology, 1(1), 41-49.
Heidari, S., & Sharples, S. (2002). A comparative analysis of short-term and long-term thermal comfort surveys in Iran. Energy and Buildings, 34(6), 607-614.
Humphreys, M. A. (1976). Field studies of thermal comfort compared and applied. Building Services Engineer, 44(1), 5-23.
Humphreys, M. A. (1978). Outdoor temperatures and comfort indoors. Building Research and Practice, 6(2), 92-105.
Humphreys, M. A. (2005). Quantifying occupant comfort: are combined indices of the indoor environment practicable? Building Research & Information, 33(4), 317-325.
Humphreys, M. A., & Hancock, M. (2007). Do people like to feel ‘neutral’?: Exploring the variation of the desired thermal sensation on the ASHRAE scale. Energy and Buildings, 39(7), 867-874.
Univers
ity of
Mala
ya

332
Humphreys, M. A., & Nicol, J. F. (2000). Outdoor temperature and indoor thermal comfort: raising the precision of the relationship for the 1998 ASHRAE database of field studies. ASHRAE Transactions, 206(2), 485–492.
Humphreys, M. A., & Nicol, J. F. (2002). The validity of ISO-PMV for predicting comfort votes in every-day thermal environments. Energy and Buildings, 34(6), 667-684.
Hwang, R. L., Lin, T. P., Cheng, M. J., & Chien, J. H. (2007). Patient thermal comfort requirement for hospital environments in Taiwan. Building and Environment, 42(8), 2980-2987.
Hwang, R. L., Lin, T. P., & Kuo, N. J. (2006). Field experiments on thermal comfort in campus classrooms in Taiwan. Energy and Buildings, 38(1), 53-62.
Karyono, T. H. (2000). Report on thermal comfort and building energy studies in Jakarta—Indonesia. Building and Environment, 35(1), 77-90.
Kavgic, M., Mumovic, D., Stevanovic, Z., & Young, A. (2008). Analysis of thermal comfort and indoor air quality in a mechanically ventilated theatre. Energy and Buildings, 40(7), 1334-1343.
Kongkiatumpai, P. (1999) Study of impact of indoor setpoint temperature on energy consumption of air-conditioner and greenhouse gases emission. A special study report for the Degree of Master Engineering, Thailand, King Mongkut’s University of Technology Thonburi.
Kuchen, E., & Fisch, M. N. (2009). Spot monitoring: Thermal comfort evaluation in 25 office buildings in winter. Building and Environment, 44(4), 839-847.
Kumar, S., & Mahdavi, A. (2001). Integrating thermal comfort field data analysis in a case-based building simulation environment. Building and Environment, 36(6), 711-720.
Masjuki, H. H., Mahlia, T. M. I., & Choudhury, I. A. (2001). Potential electricity savings by implementing minimum energy efficiency standards for room air conditioners in Malaysia. Energy Conversion & Management, 42(4), 439-450.
McQuiston, F. C., Parker, J. D., & Spitler, J. D. (2005). Heating, Ventilating and Air Conditioning, Analysis and Design. United States of America: John Wiley and Sons.
Univers
ity of
Mala
ya

333
Melikov, A. K., Popiolek, Z. J., Silva, M. G., Care, I., & Sefker, T. (2007). Accuracy limitations for low-velocity measurements and draft assessment in rooms. HVAC&R Research, 13(6), 971-986.
Milne, G. R. (1995). The energy implications of a climate-based indoor air temperature standard. In Nicol, F., et al. (Eds.), Standards for Thermal Comfort - Indoor Air Temperature Standards for the 21st Century (pp. 182-189).
Mohamed, S., & Srinavin, K. (2005). Forecasting labor productivity changes in construction using the PMV index. Industrial Ergonomics, 35(4), 345-351.
Mui, K. W. H., & Chan, W. T. D. (2003). Adaptive comfort temperature model of air-conditioned building in Hong Kong. Building and Environment, 38(6), 837-852.
National Research Council of Canada (2003). Fanger’s thermal comfort and draught models. IRC Research Report RR-162: Charles, K. E.
Nicol, F., & Raja, I. A. (1996). Thermal comfort, time and posture: Exploratory studies in the nature of adaptive thermal comfort. Oxford Brookes University: School of Architecture.
Nicol, J. F. (1995). Thermal comfort and temperature standards in Pakistan. In Nicol, F., et al. (Eds.), Standards for Thermal Comfort - Indoor Air Temperature Standards for the 21st Century (pp. 149-157).
Nicol, J. F. (2004). Adaptive thermal comfort standards in the hot–humid tropics. Energy and Buildings, 36(7), 628-637.
Nicol, J. F., & Humphreys, M. A. (2002). Adaptive thermal comfort and sustainable thermal standards for buildings. Energy and Buildings, 34(6), 563-572.
Nicol, J. F., Raja, I. A., Allaudin, A., & Jamy, G. N. (1999). Climatic variations in comfortable temperatures: the Pakistan projects. Energy and Buildings, 30(3), 261-279.
Peter, H. (2002). Different aspects of assessing indoor and outdoor thermal comfort. Energy and Buildings, 34(6), 661-665.
Saidur, R. (2009). Energy consumption, energy savings, and emission analysis in Malaysian office buildings. Energy Policy, 37(10), 4104-4113.
Univers
ity of
Mala
ya
334
Sekhar, S. C., & Ching, C. S. (2002). Indoor air quality and thermal comfort studies of an under-floor air-conditioning system in the tropics. Energy and Buildings, 34(5), 431-444.
Tenaga Nasional Berhad (2012). Pricing and tariff. Retrieved March 14, 2012, from http://www.tnb.com.my/business/for-commercial/pricing-tariff.html.
Thomas, H. K., James, W. R., & James, L. T. (1998). Thermal Environmental Engineering. United States of America: Prentice-Hall, Inc.
van Hoof, J. (2008). Forty years of Fanger’s model of thermal comfort: comfort for all? Indoor Air, 18(3), 182-201.
van Hoof, J., & Hensen, J. L. M. (2006). Thermal comfort and older adults. Gerontechnology, 4(4), 223-228.
van Hoof, J., & Hensen, J. L. M. (2007). Quantifying the relevance of adaptive thermal comfort models in moderate thermal climate zones. Building and Environment, 42(1), 156-170.
Wagner, A., Gossauer, E., Moosmann, C., Gropp, T., & Leonhart, R. (2007). Thermal comfort and workplace occupant satisfaction—Results of field studies in German low energy office buildings. Energy and Buildings, 39(7), 758-769.
Wan, J. W., Yang, K., Zhang, W. J., & Zhang, J. L. (2009). A new method of determination of indoor temperature and relative humidity with consideration of human thermal comfort. Building and Environment, 44(2), 411-417.
Wang, H., Huang, C., Liu, Z., Tang, G., Liu, Y., & Wang, Z. (2006). Dynamic evaluation of thermal comfort environment of air-conditioned buildings. Building and Environment, 41(11), 1522-1529.
Wang, Z. (2006). A field study of the thermal comfort in residential buildings in Harbin. Building and Environment, 41(8), 1034-1039.
Wargocki, P., Bakó-Biró, Z., Clausen, G., & Fanger, P. O. (2002). Air quality in a simulated office environment as a result of reducing pollution sources and increasing ventilation. Energy and Buildings, 34(8), 775-783.
Univers
ity of
Mala
ya

335
Wong, L. T., Mui, K. W., Fong, N. K., & Hui, P. S. (2007). Bayesian adaptive comfort temperature (BACT) of air-conditioning system in subtropical climate. Building and Environment, 42(5), 1983-1988.
Wong, N. H., Feriadi, H., Lim, P. Y., Tham, K. W., Sekhar, C., & Cheong, K. W. (2002). Thermal comfort evaluation of naturally ventilated public housing in Singapore. Building and Environment, 37(12), 1267–1277.
Yang, K. H., & Su, C. H. (1997). An approach to building energy savings using the PMV index. Building and Environment, 32(1), 25-30.
Yao, R., Li, B., & Liu, J. (2009). A theoretical adaptive model of thermal comfort – Adaptive Predicted Mean Vote (aPMV). Building and Environment, 44(10), 2089-2096.
Yau, Y. H. (2004) Energy savings in tropical HVAC systems using heat pipe heat exchangers. PhD in Mechanical Engineering Thesis, New Zealand, University of Canterbury.
Yu, B. F., Hu, Z. B., Liu, M., Yang, H. L., Kong, Q. X., & Liu, Y. H. (2009). Review of research on air-conditioning systems and indoor air quality control for human health. Refrigeration, 32(1), 3-20.
Univers
ity of
Mala
ya