iias int'l seminar on trade and development.ppt
TRANSCRIPT
Professor Yoon Heo (GSIS, Sogang Professor Yoon Heo (GSIS, Sogang University) University)
IEAS (Institute for East Asian Studies)
Date : 21 September 2011Host : IIAS (Institute of International and Area Studies)Venue : K 508, Sogang Univ.
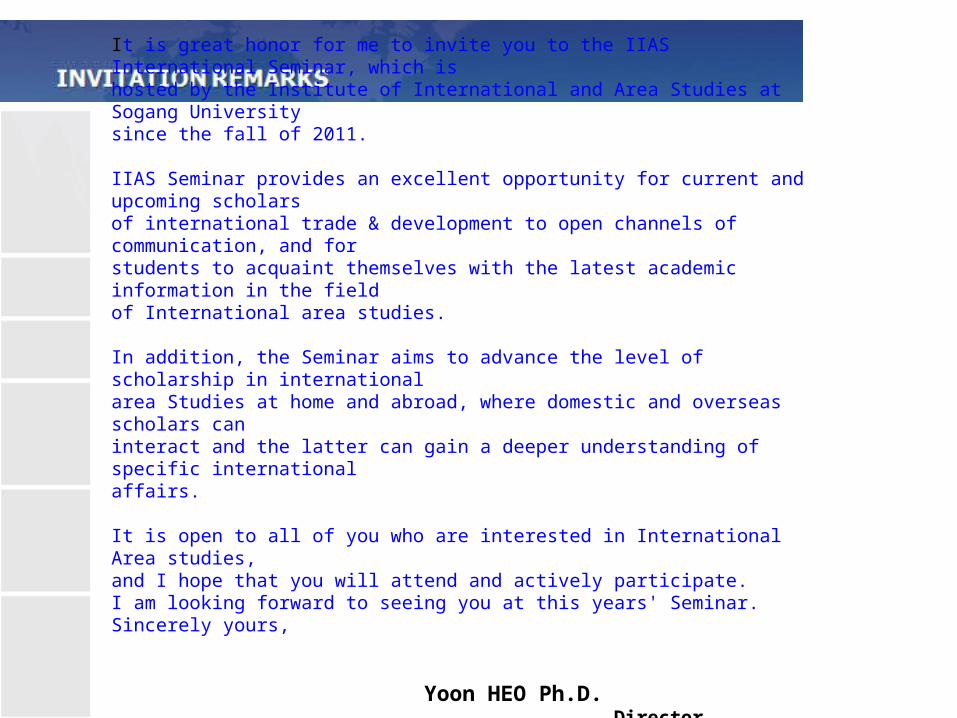
It is great honor for me to invite you to the IIAS International Seminar, which ishosted by the Institute of International and Area Studies at Sogang University since the fall of 2011.
IIAS Seminar provides an excellent opportunity for current and upcoming scholarsof international trade & development to open channels of communication, and for students to acquaint themselves with the latest academic information in the field of International area studies.
In addition, the Seminar aims to advance the level of scholarship in international area Studies at home and abroad, where domestic and overseas scholars can interact and the latter can gain a deeper understanding of specific international affairs.
It is open to all of you who are interested in International Area studies,and I hope that you will attend and actively participate.I am looking forward to seeing you at this years' Seminar. Sincerely yours,
Yoon HEO Ph.D. Director, Institute of International Area Studies
⑪ K (Kim Daegon) Hall 508
Contact : Yun-mok Sohn, Coordinator, IIASTel : 02-705-8235, Mobile : 010-9125-5680 Email : [email protected]
Development Strategy in Korea: Lessons and Implications for Developing Countries
----------------------------------------------------
IIAS Int’l Seminar on Trade and Development
21 Sep. 2011
Professor Yoon HEO (GSIS, Sogang
Univ.)
Contents
1. Policy Changes in Korea
2. Korea's Multilateral Trade Policy
3. East Asian Regionalism
4. Korea's FTA Policy
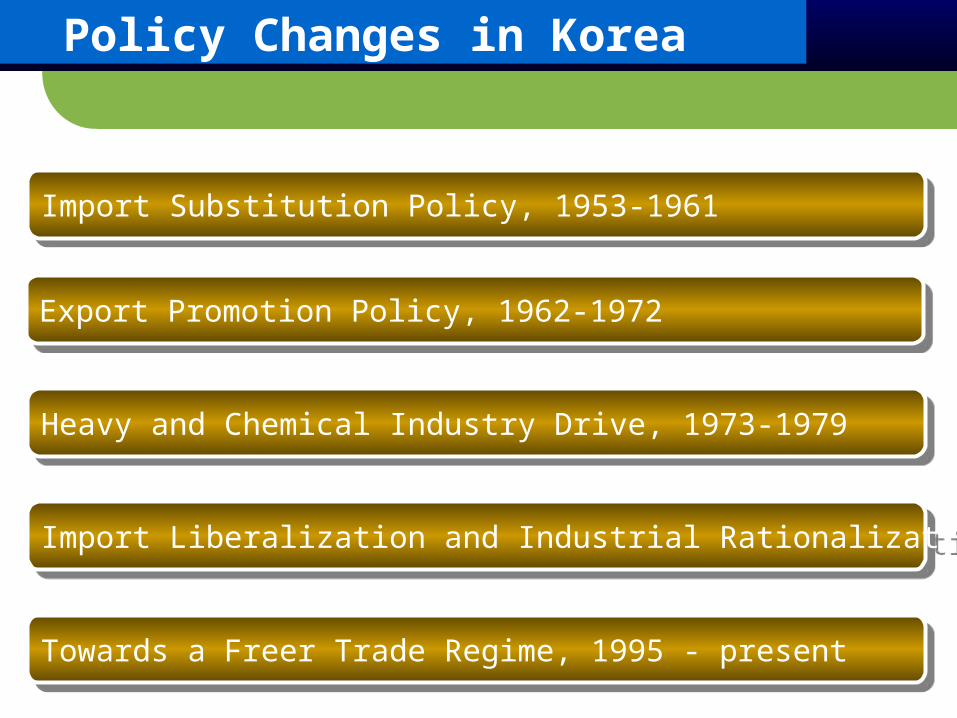
Policy Changes in Korea
Import Substitution Policy, 1953-1961
Export Promotion Policy, 1962-1972
Heavy and Chemical Industry Drive, 1973-1979
Import Liberalization and Industrial Rationalization, 1980-1994
Towards a Freer Trade Regime, 1995 - present
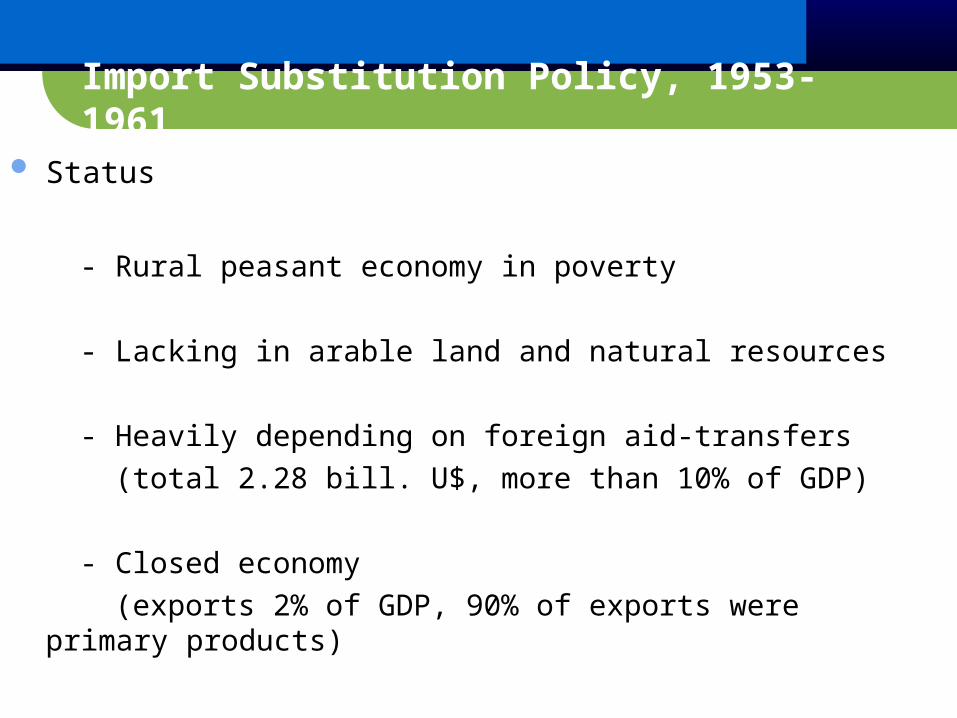
Import Substitution Policy, 1953-1961 Status
- Rural peasant economy in poverty
- Lacking in arable land and natural resources
- Heavily depending on foreign aid-transfers (total 2.28 bill. U$, more than 10% of GDP) - Closed economy (exports 2% of GDP, 90% of exports were primary products)
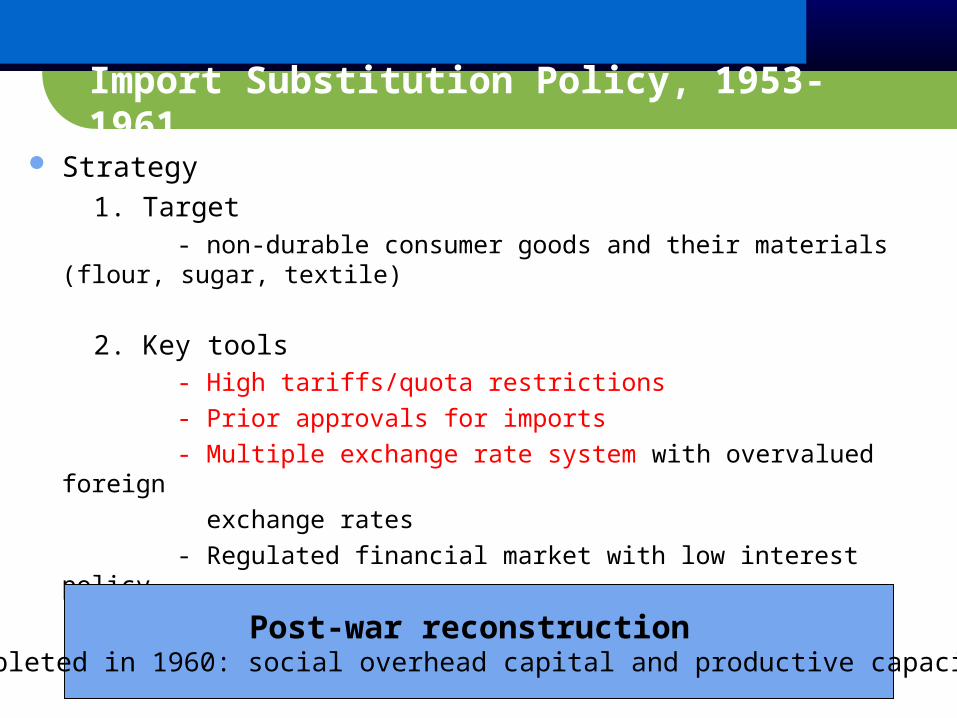
Strategy 1. Target - non-durable consumer goods and their materials (flour, sugar,
textile)
2. Key tools - High tariffs/quota restrictions - Prior approvals for imports - Multiple exchange rate system with overvalued foreign exchange rates - Regulated financial market with low interest policy
Post-war reconstruction (completed in 1960: social overhead capital and productive capacity)
Import Substitution Policy, 1953-1961
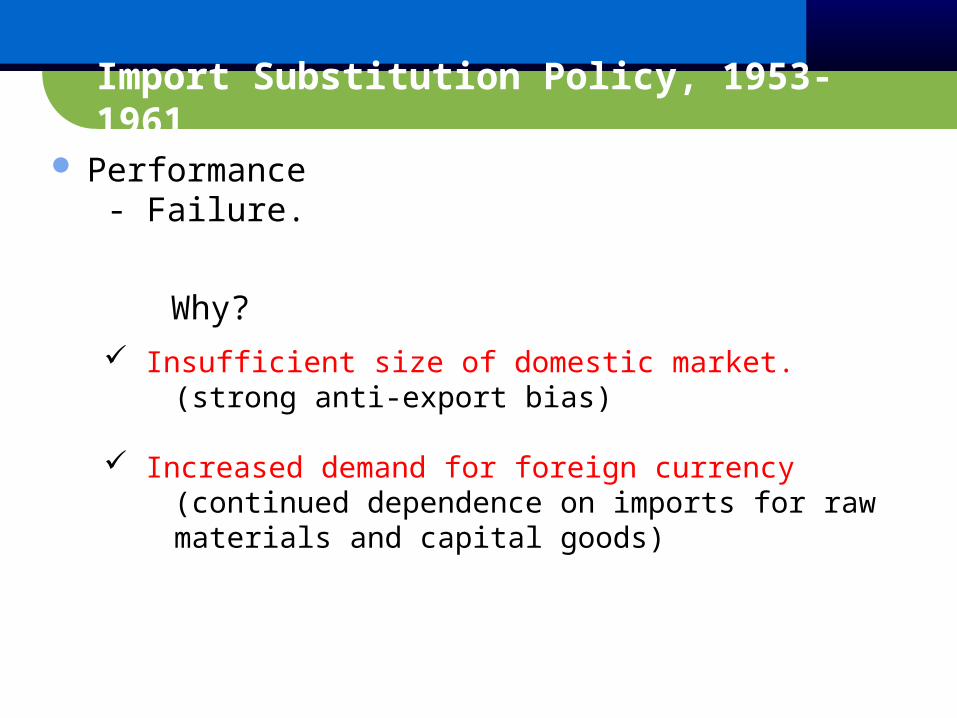
Performance - Failure.
Why?
Insufficient size of domestic market. (strong anti-export bias)
Increased demand for foreign currency (continued dependence on imports for raw materials and capital goods)
Import Substitution Policy, 1953-1961
Export Promotion Policy in the 1960s, 1962-1972 Strategy
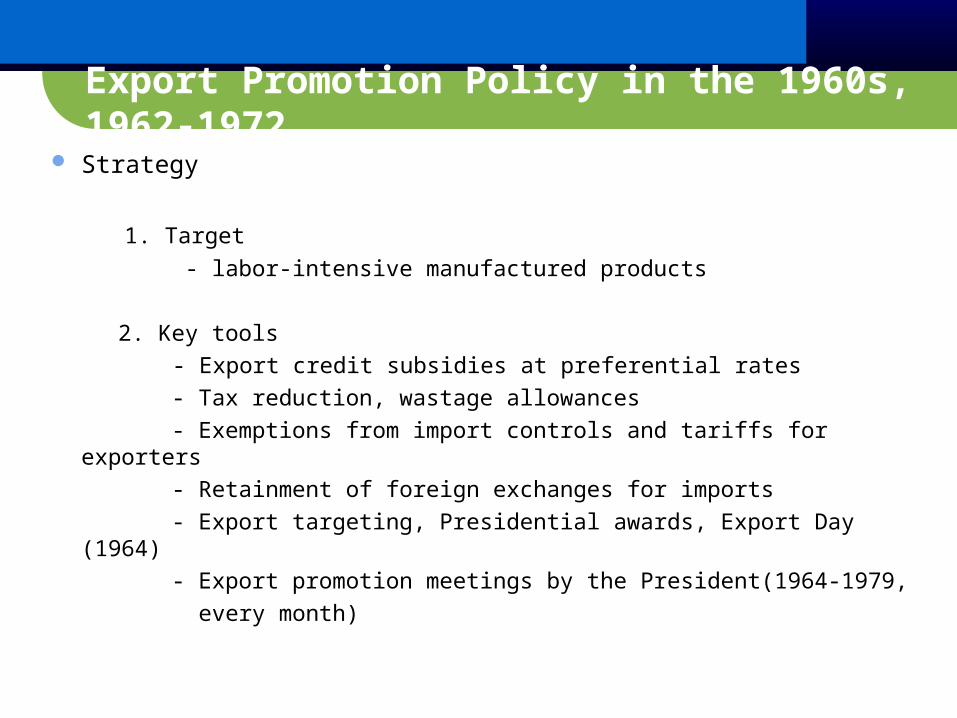
1. Target - labor-intensive manufactured products
2. Key tools - Export credit subsidies at preferential rates - Tax reduction, wastage allowances - Exemptions from import controls and tariffs for exporters - Retainment of foreign exchanges for imports - Export targeting, Presidential awards, Export Day (1964) - Export promotion meetings by the President(1964-1979, every month)
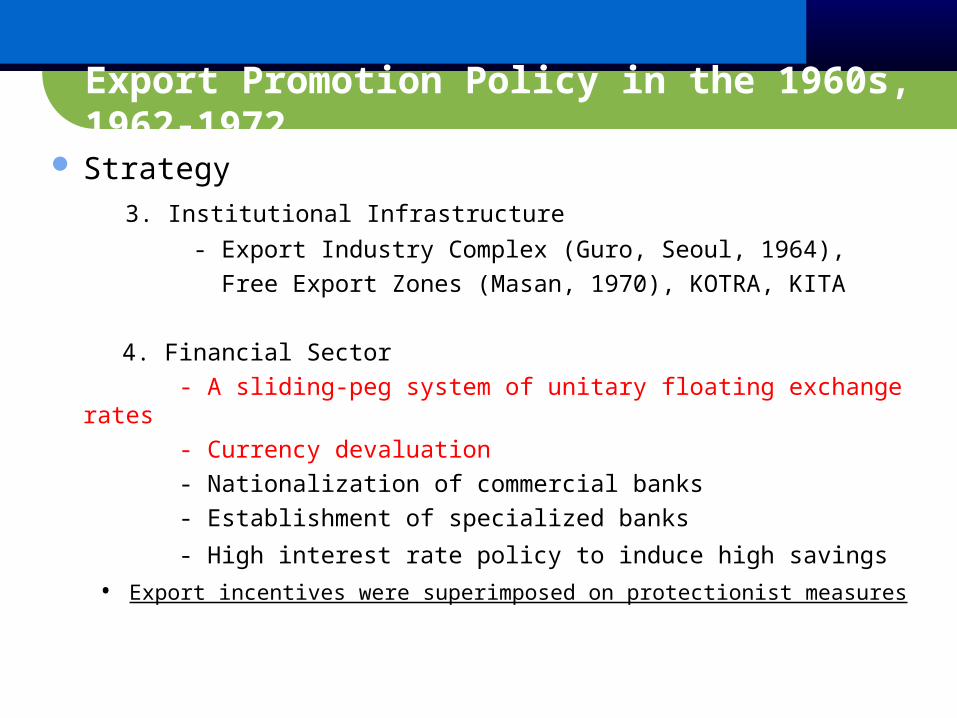
Strategy 3. Institutional Infrastructure - Export Industry Complex (Guro, Seoul, 1964), Free Export Zones (Masan, 1970), KOTRA, KITA
4. Financial Sector - A sliding-peg system of unitary floating exchange rates - Currency devaluation - Nationalization of commercial banks - Establishment of specialized banks - High interest rate policy to induce high savings • Export incentives were superimposed on protectionist measures
Export Promotion Policy in the 1960s, 1962-1972
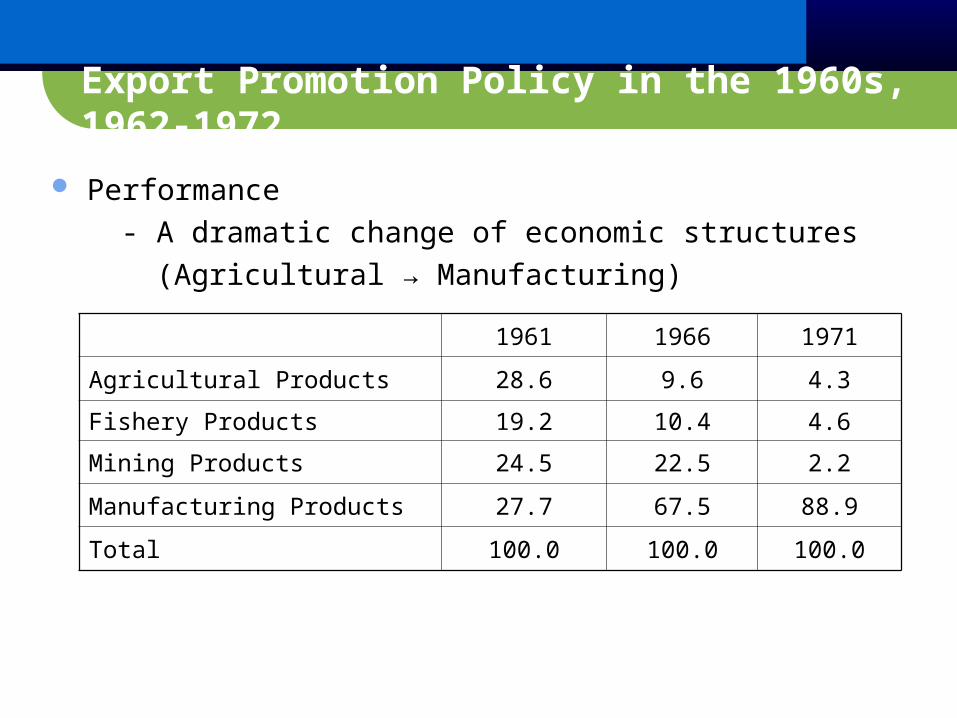
Performance - A dramatic change of economic structures (Agricultural → Manufacturing)
1961 1966 1971
Agricultural Products 28.6 9.6 4.3
Fishery Products 19.2 10.4 4.6
Mining Products 24.5 22.5 2.2
Manufacturing Products 27.7 67.5 88.9
Total 100.0 100.0 100.0
Export Promotion Policy in the 1960s, 1962-1972
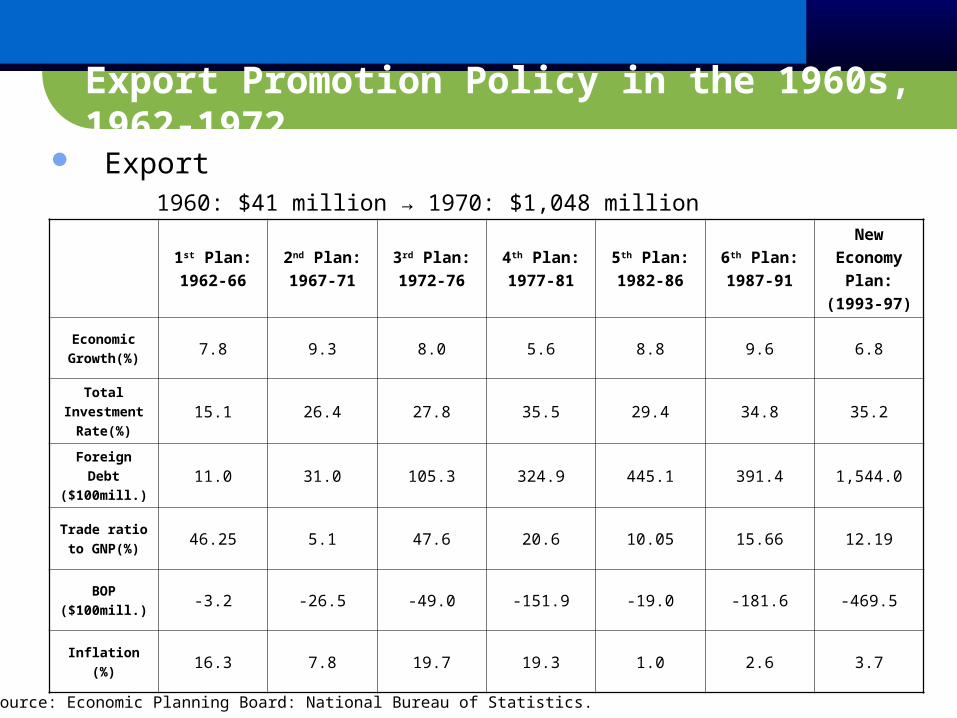
Export 1960: $41 million → 1970: $1,048 million
1st Plan:1962-66
2nd Plan:1967-71
3rd Plan:1972-76
4th Plan:1977-81
5th Plan:1982-86
6th Plan:1987-91
NewEconomy
Plan:(1993-97)
EconomicGrowth(%) 7.8 9.3 8.0 5.6 8.8 9.6 6.8
TotalInvestment
Rate(%)15.1 26.4 27.8 35.5 29.4 34.8 35.2
ForeignDebt
($100mill.)11.0 31.0 105.3 324.9 445.1 391.4 1,544.0
Trade ratioto GNP(%) 46.25 5.1 47.6 20.6 10.05 15.66 12.19
BOP($100mill.) -3.2 -26.5 -49.0 -151.9 -19.0 -181.6 -469.5
Inflation(%) 16.3 7.8 19.7 19.3 1.0 2.6 3.7
Source: Economic Planning Board: National Bureau of Statistics.
Export Promotion Policy in the 1960s, 1962-1972
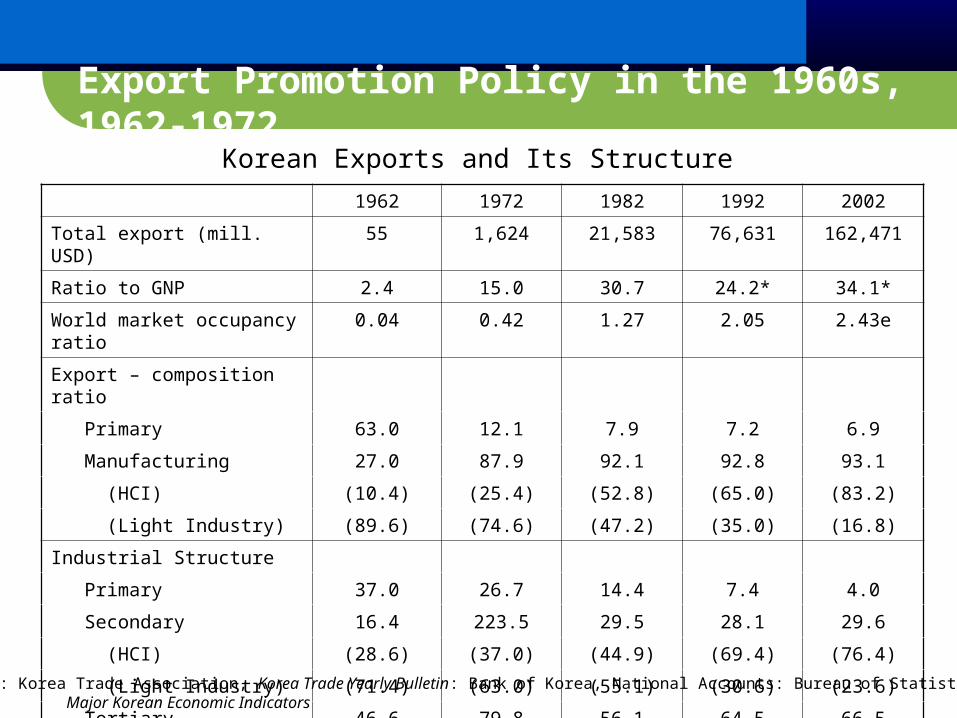
1962 1972 1982 1992 2002
Total export (mill. USD) 55 1,624 21,583 76,631 162,471
Ratio to GNP 2.4 15.0 30.7 24.2* 34.1*
World market occupancy ratio 0.04 0.42 1.27 2.05 2.43e
Export – composition ratio
Primary 63.0 12.1 7.9 7.2 6.9
Manufacturing 27.0 87.9 92.1 92.8 93.1
(HCI) (10.4) (25.4) (52.8) (65.0) (83.2)
(Light Industry) (89.6) (74.6) (47.2) (35.0) (16.8)
Industrial Structure
Primary 37.0 26.7 14.4 7.4 4.0
Secondary 16.4 223.5 29.5 28.1 29.6
(HCI) (28.6) (37.0) (44.9) (69.4) (76.4)
(Light Industry) (71.4) (63.0) (55.1) (30.6) (23.6)
Tertiary 46.6 79.8 56.1 64.5 66.5
Korean Exports and Its Structure
Source: Korea Trade Association, Korea Trade Yearly Bulletin: Bank of Korea, National Accounts: Bureau of Statistics. Major Korean Economic Indicators
Export Promotion Policy in the 1960s, 1962-1972
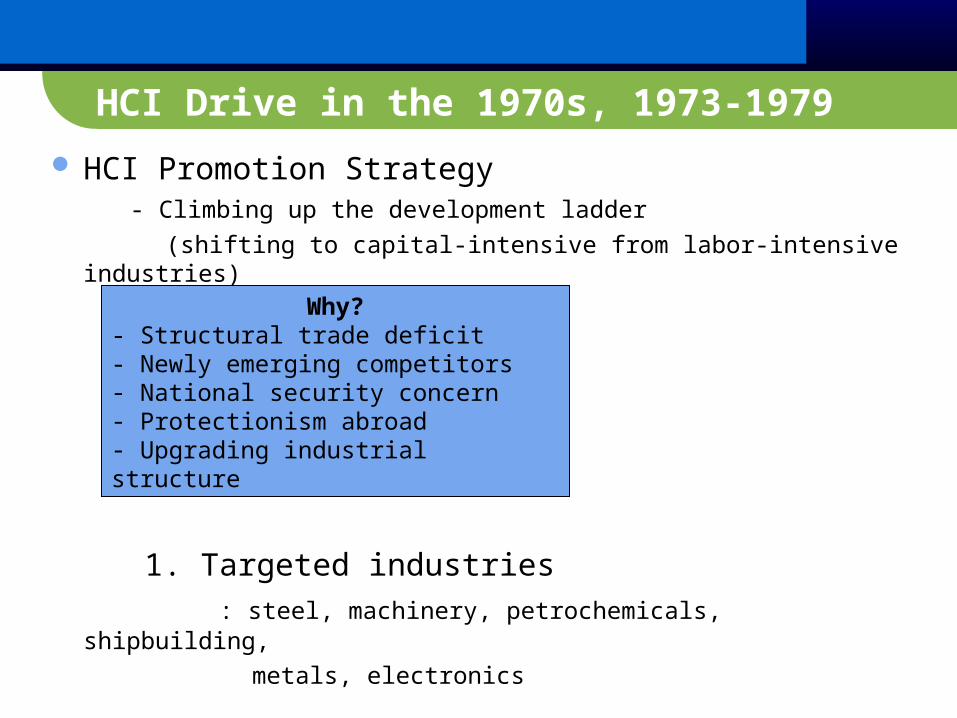
HCI Drive in the 1970s, 1973-1979 HCI Promotion Strategy - Climbing up the development ladder (shifting to capital-intensive from labor-intensive industries)
1. Targeted industries : steel, machinery, petrochemicals, shipbuilding, metals, electronics
Why?- Structural trade deficit- Newly emerging competitors- National security concern - Protectionism abroad - Upgrading industrial structure
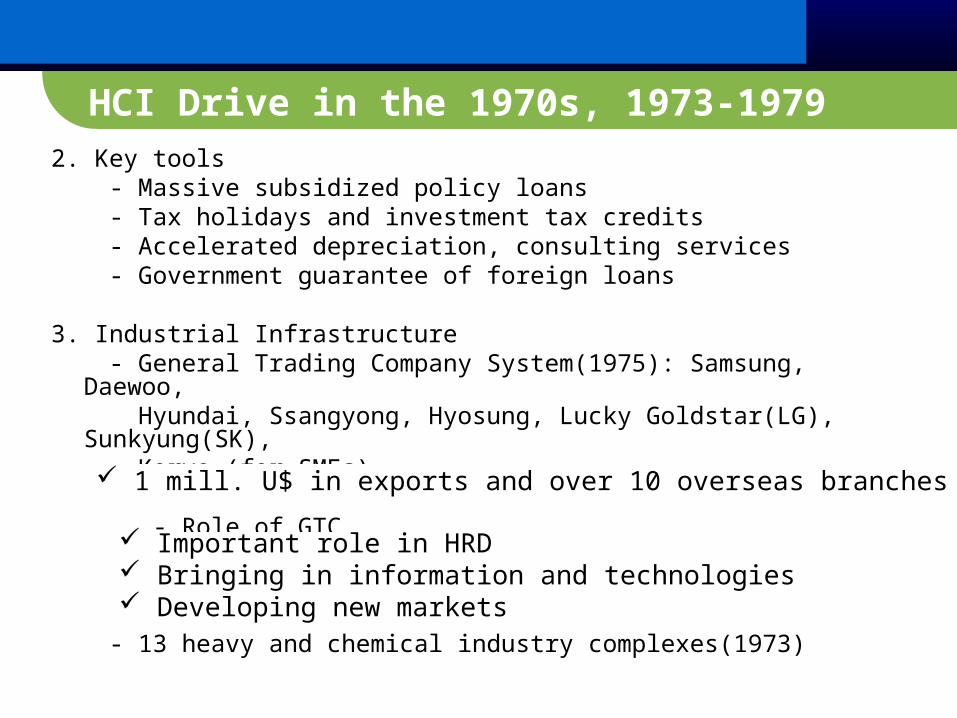
2. Key tools - Massive subsidized policy loans - Tax holidays and investment tax credits - Accelerated depreciation, consulting services - Government guarantee of foreign loans
3. Industrial Infrastructure - General Trading Company System(1975): Samsung, Daewoo, Hyundai, Ssangyong, Hyosung, Lucky Goldstar(LG), Sunkyung(SK), Koryo (for SMEs) - Role of GTC
- 13 heavy and chemical industry complexes(1973)
HCI Drive in the 1970s, 1973-1979
1 mill. U$ in exports and over 10 overseas branches required.
Important role in HRD Bringing in information and technologies Developing new markets
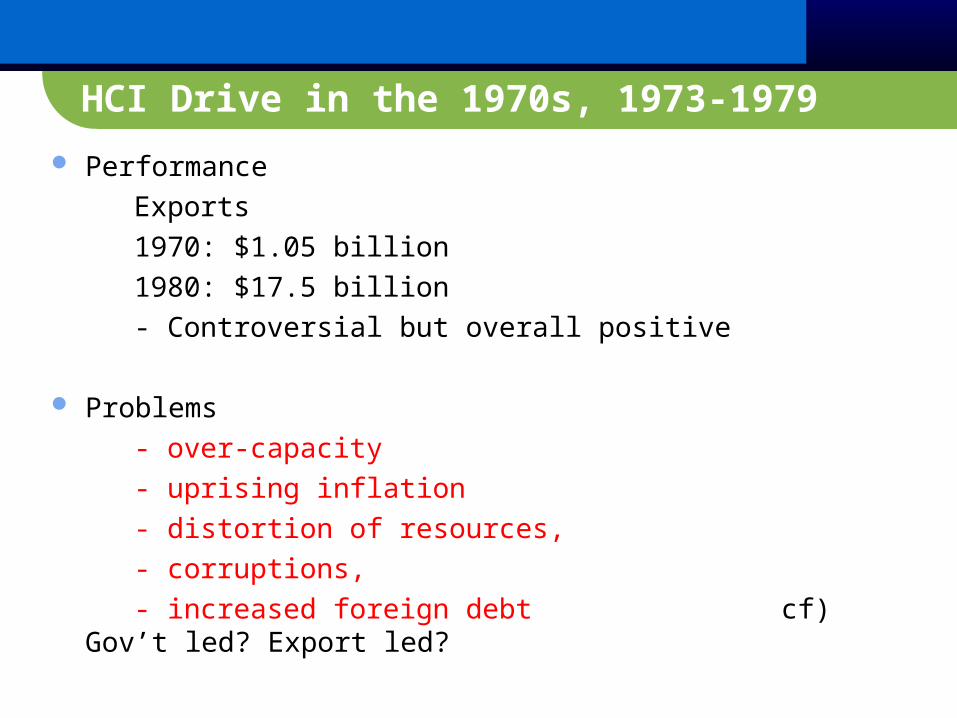
Performance Exports 1970: $1.05 billion 1980: $17.5 billion - Controversial but overall positive
Problems - over-capacity - uprising inflation - distortion of resources, - corruptions, - increased foreign debt cf) Gov’t led? Export led?
HCI Drive in the 1970s, 1973-1979
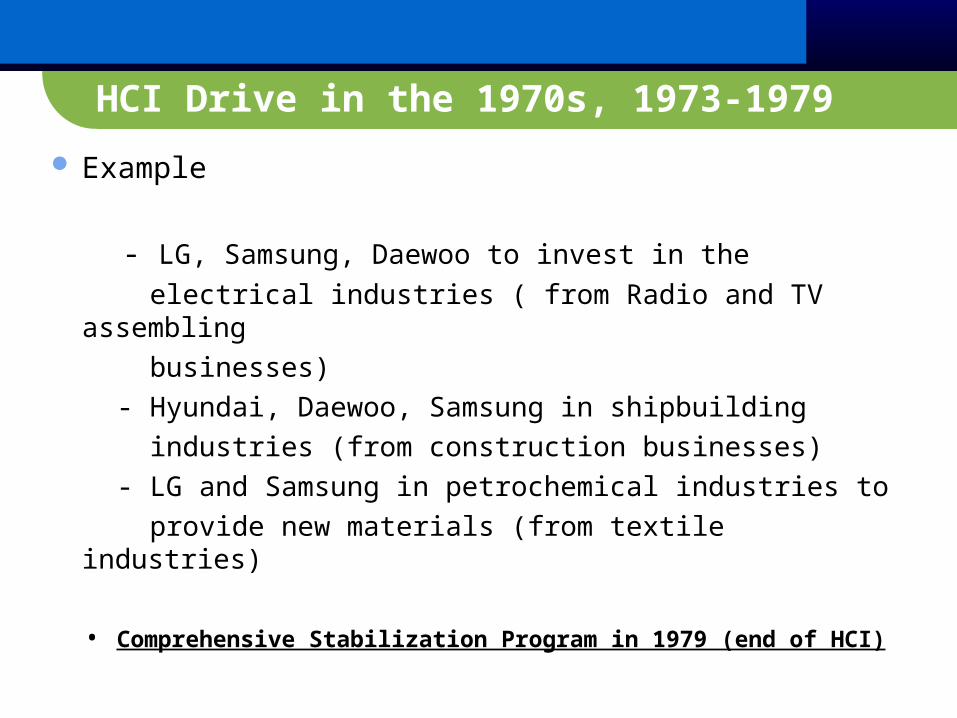
HCI Drive in the 1970s, 1973-1979 Example
- LG, Samsung, Daewoo to invest in the electrical industries ( from Radio and TV assembling businesses) - Hyundai, Daewoo, Samsung in shipbuilding industries (from construction businesses) - LG and Samsung in petrochemical industries to provide new materials (from textile industries)
• Comprehensive Stabilization Program in 1979 (end of HCI)
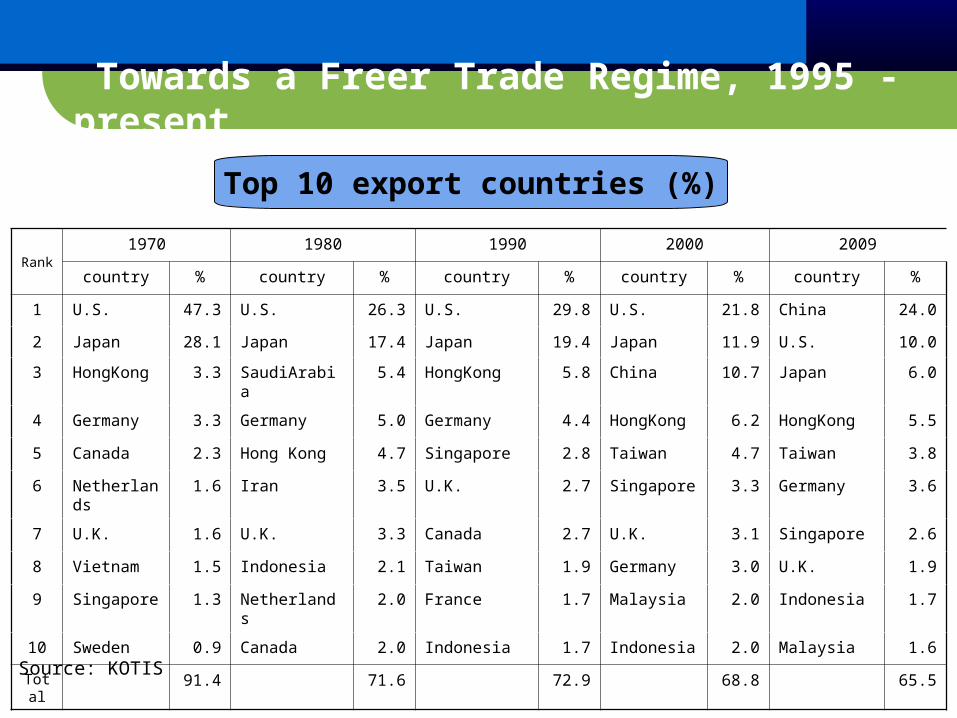
Top 10 export countries (%)
Rank1970 1980 1990 2000 2009
country % country % country % country % country %
1 U.S. 47.3 U.S. 26.3 U.S. 29.8 U.S. 21.8 China 24.0
2 Japan 28.1 Japan 17.4 Japan 19.4 Japan 11.9 U.S. 10.0
3 HongKong 3.3 SaudiArabia 5.4 HongKong 5.8 China 10.7 Japan 6.0
4 Germany 3.3 Germany 5.0 Germany 4.4 HongKong 6.2 HongKong 5.5
5 Canada 2.3 Hong Kong 4.7 Singapore 2.8 Taiwan 4.7 Taiwan 3.8
6 Netherlands 1.6 Iran 3.5 U.K. 2.7 Singapore 3.3 Germany 3.6
7 U.K. 1.6 U.K. 3.3 Canada 2.7 U.K. 3.1 Singapore 2.6
8 Vietnam 1.5 Indonesia 2.1 Taiwan 1.9 Germany 3.0 U.K. 1.9
9 Singapore 1.3 Netherlands 2.0 France 1.7 Malaysia 2.0 Indonesia 1.7
10 Sweden 0.9 Canada 2.0 Indonesia 1.7 Indonesia 2.0 Malaysia 1.6
Total 91.4 71.6 72.9 68.8 65.5
Source: KOTIS
Towards a Freer Trade Regime, 1995 - present
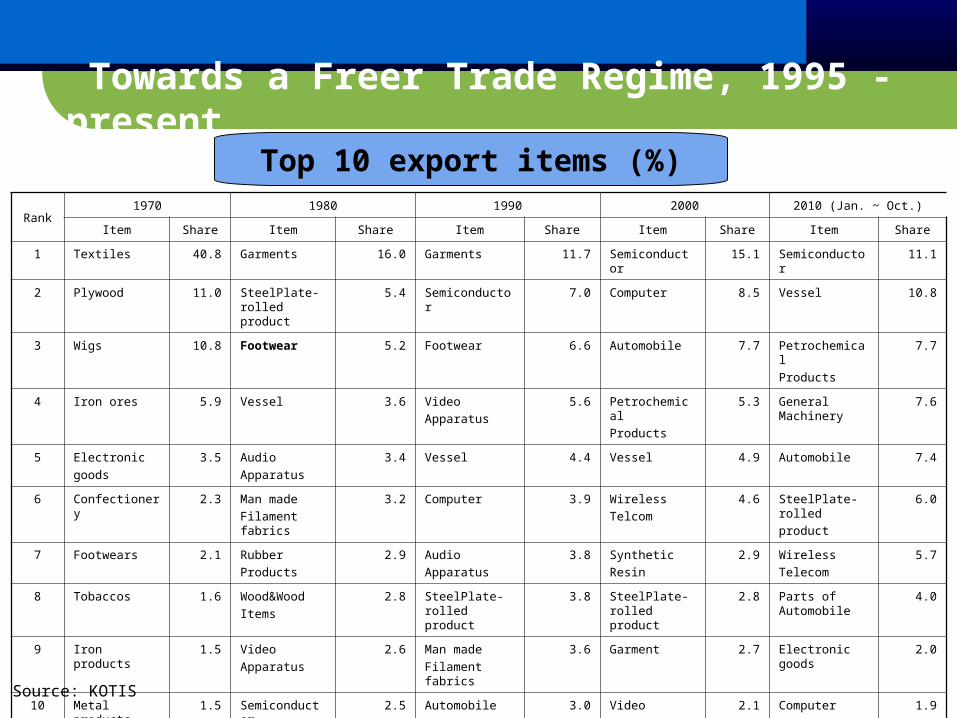
Towards a Freer Trade Regime, 1995 - present Top 10 export items (%)
Rank1970 1980 1990 2000 2010 (Jan. ~ Oct.)
Item Share Item Share Item Share Item Share Item Share
1 Textiles 40.8 Garments 16.0 Garments 11.7 Semiconductor 15.1 Semiconductor 11.1
2 Plywood 11.0 SteelPlate-rolled product
5.4 Semiconductor 7.0 Computer 8.5 Vessel 10.8
3 Wigs 10.8 Footwear 5.2 Footwear 6.6 Automobile 7.7 PetrochemicalProducts
7.7
4 Iron ores 5.9 Vessel 3.6 VideoApparatus
5.6 PetrochemicalProducts
5.3 General Machinery
7.6
5 Electronicgoods
3.5 AudioApparatus
3.4 Vessel 4.4 Vessel 4.9 Automobile 7.4
6 Confectionery 2.3 Man madeFilament fabrics
3.2 Computer 3.9 WirelessTelcom
4.6 SteelPlate-rolledproduct
6.0
7 Footwears 2.1 RubberProducts
2.9 AudioApparatus
3.8 SyntheticResin
2.9 WirelessTelecom
5.7
8 Tobaccos 1.6 Wood&WoodItems
2.8 SteelPlate-rolled product
3.8 SteelPlate-rolled product
2.8 Parts of Automobile
4.0
9 Iron products 1.5 VideoApparatus
2.6 Man madeFilament fabrics
3.6 Garment 2.7 Electronic goods 2.0
10 Metal products 1.5 Semiconductor 2.5 Automobile 3.0 VideoApparatus
2.1 Computer 1.9
Total 81.1 47.6 53.4 56.6 65.1
Source: KOTIS
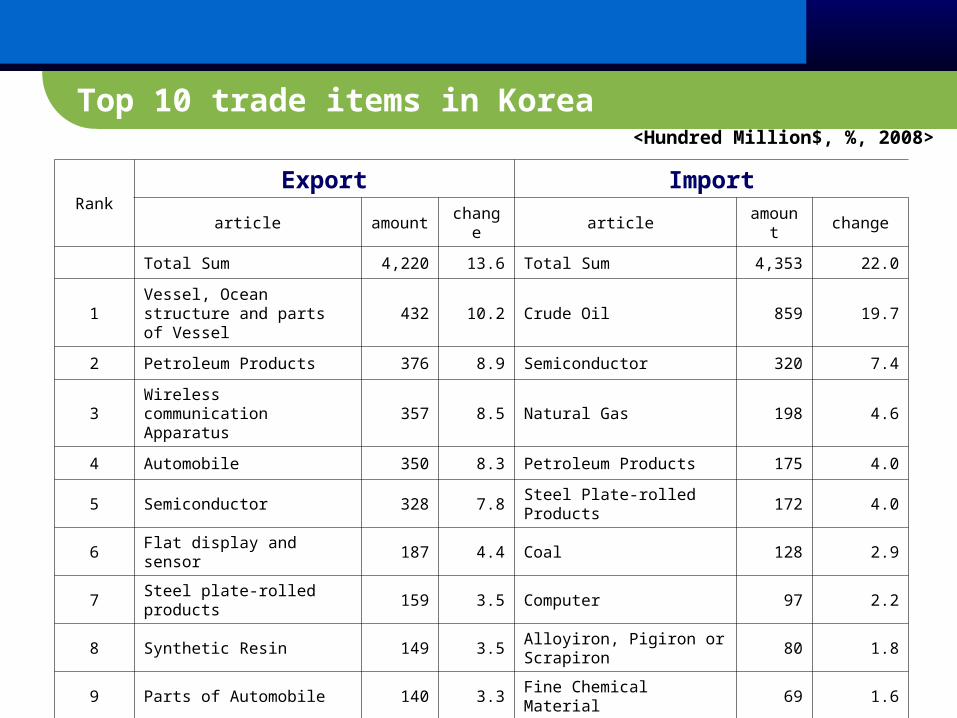
RankExport Import
article amount
change article amoun
t change
Total Sum 4,220 13.6 Total Sum 4,353 22.0
1 Vessel, Ocean structure and parts of Vessel 432 10.2 Crude Oil 859 19.7
2 Petroleum Products 376 8.9 Semiconductor 320 7.4
3 Wireless communication Apparatus 357 8.5 Natural Gas 198 4.6
4 Automobile 350 8.3 Petroleum Products 175 4.0
5 Semiconductor 328 7.8 Steel Plate-rolled Products 172 4.0
6 Flat display and sensor 187 4.4 Coal 128 2.9
7 Steel plate-rolled products 159 3.5 Computer 97 2.2
8 Synthetic Resin 149 3.5 Alloyiron, Pigiron or Scrapiron 80 1.8
9 Parts of Automobile 140 3.3 Fine Chemical Material 69 1.610 Computer 107 2.5 Articles of Copper 63 1.4
<Hundred Million$, %, 2008>Top 10 trade items in Korea
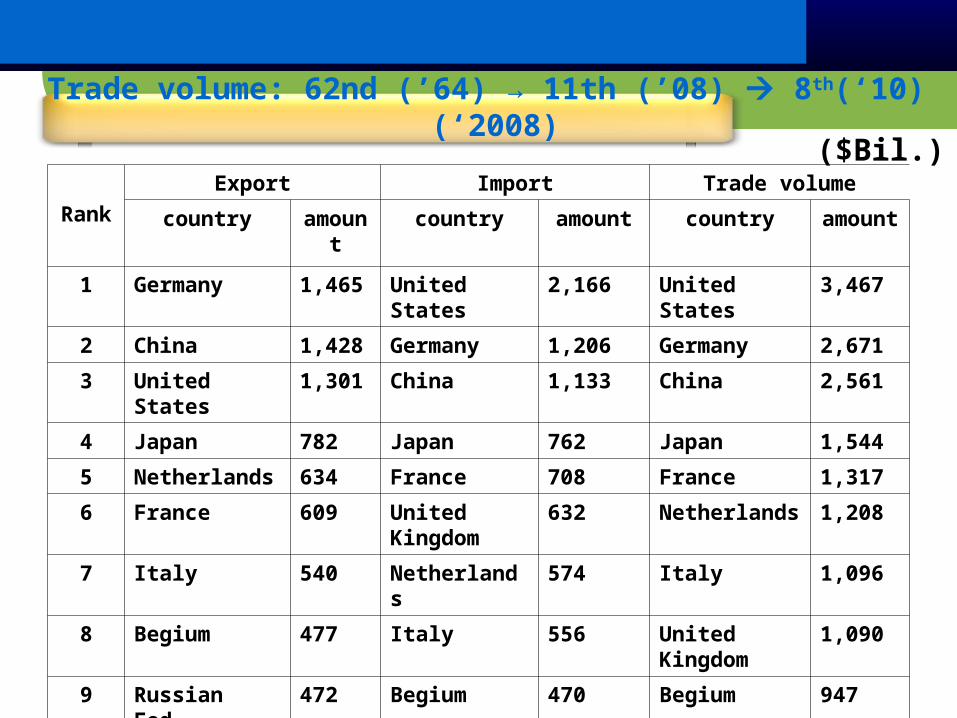
($Bil.)
RankExport Import Trade volume
country amount country amount country amount
1 Germany 1,465 United States 2,166 United States 3,4672 China 1,428 Germany 1,206 Germany 2,6713 United States 1,301 China 1,133 China 2,5614 Japan 782 Japan 762 Japan 1,5445 Netherlands 634 France 708 France 1,3176 France 609 United Kingdom 632 Netherlands 1,2087 Italy 540 Netherlands 574 Italy 1,0968 Begium 477 Italy 556 United Kingdom 1,0909 Russian Fed. 472 Begium 470 Begium 947
10 United Kingdom 458 Korea 435 Canada 87411 Canada 456 Canada 418 Korea 85712 Korea 422 Spain 402 Russian Fed. 764
Trade volume: 62nd (’64) → 11th (’08) 8th(‘10) (‘2008)
Import Liberalization and Industrial Rationalization, 1980-1994
Policies - Market opening (goods and services, FDI, financial markets) - Active participation in bilateral and multilateral trade negotiations - Abolished preferential lending rates - Privatized the commercial banks - Abolished numerous regulations - Promoted semiconductor industry - Enhanced skilled-labor intensive industries (machinery, electrical equipment, automobiles)
Rationalization industries - fabrics, alloyed steel, automobile, diesel engines for ships, heavy electric equipments and fertilizers (limiting additional investment)
Korea Export Insurance Corporation(1992)
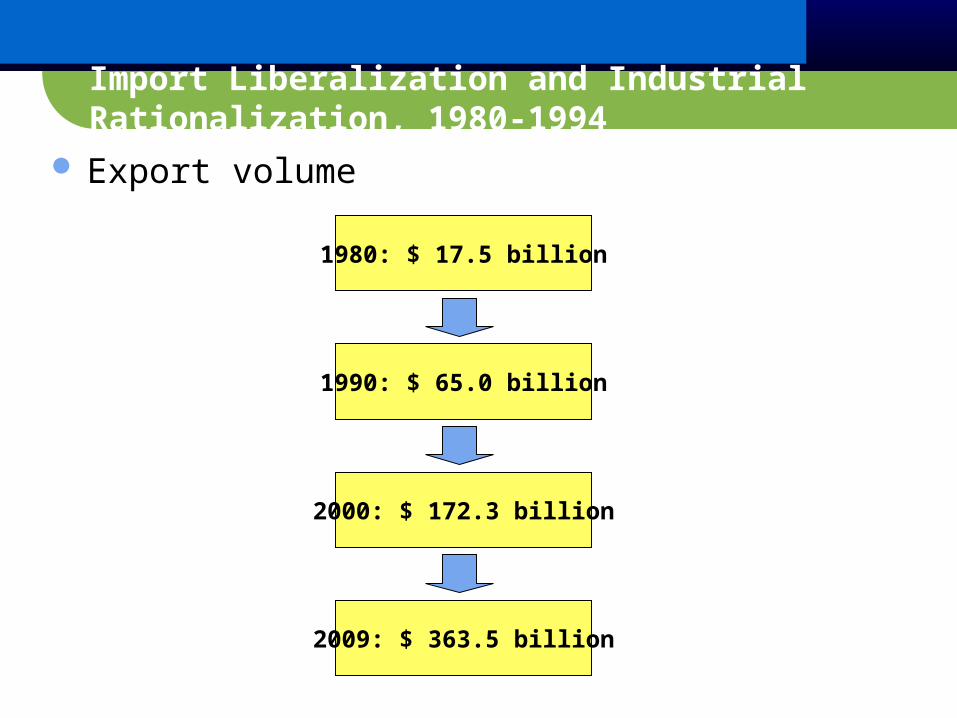
Export volume
1980: $ 17.5 billion
1990: $ 65.0 billion
2000: $ 172.3 billion
2009: $ 363.5 billion
Import Liberalization and Industrial Rationalization, 1980-1994
Towards a Freer Trade Regime, 1995 - present
Implementation of WTO commitments Active participation in the DDA negotiations The first FTA negotiation with Chile started (1999) FTA roadmap adopted (2003) East Asian integration initiatives proliferate Foreign Investment Promotion Act (1998) Abolishment of import diversification policy (1998) Indirect support for exporting sectors Further liberalization in finance, public, corporate sectors
(1998)
Evaluation of Korean Experiences Positive Aspects - Rapid economic growth (GDP, Capital formation) - Remarkable export performance - Constant upgrading of the economic structure - Establishing competitive heavy industrial sectors - Establishing infrastructure for industrial development
Negative Aspects - Price distortions by the government - Distortions in financial sectors (non-performing loans) - Excess capacity in some HCIs - Collusive relations between gov and business - Concentration of Chaebol’s economic power - High debt/equity ratios for Chaebols - Lack of foreign competition in domestic market - Nationalistic sentiments in the general public - Less focus on social welfare and environment protection programs (Labor rights strengthened since 1987)
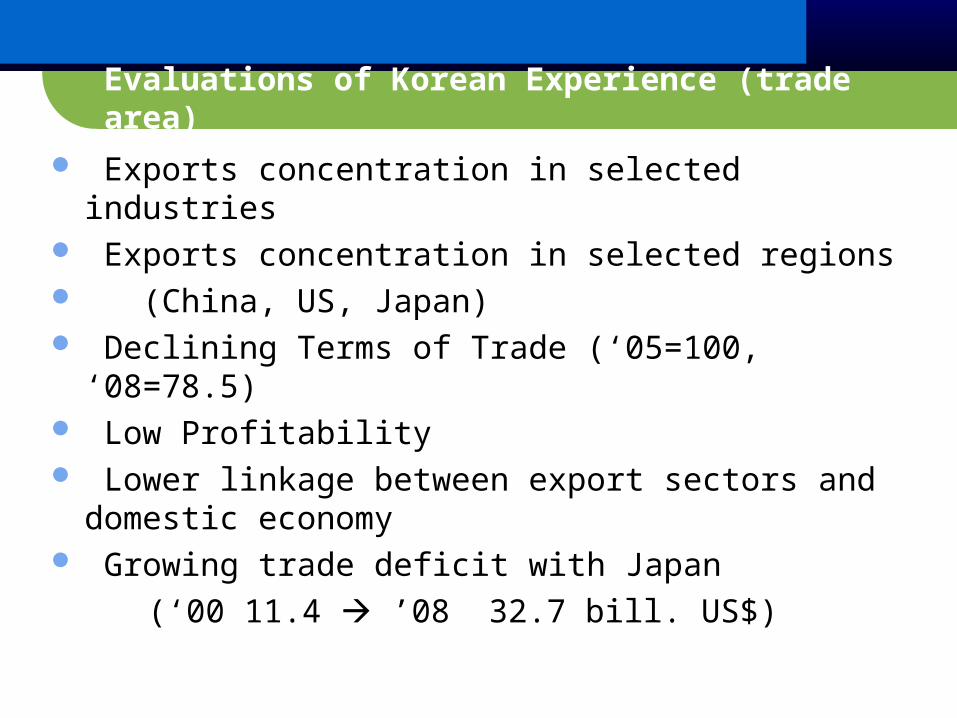
Evaluations of Korean Experience (trade area)
Exports concentration in selected industries Exports concentration in selected regions (China, US, Japan) Declining Terms of Trade (‘05=100, ‘08=78.5) Low Profitability Lower linkage between export sectors and domestic
economy Growing trade deficit with Japan (‘00 11.4 ’08 32.7 bill. US$)
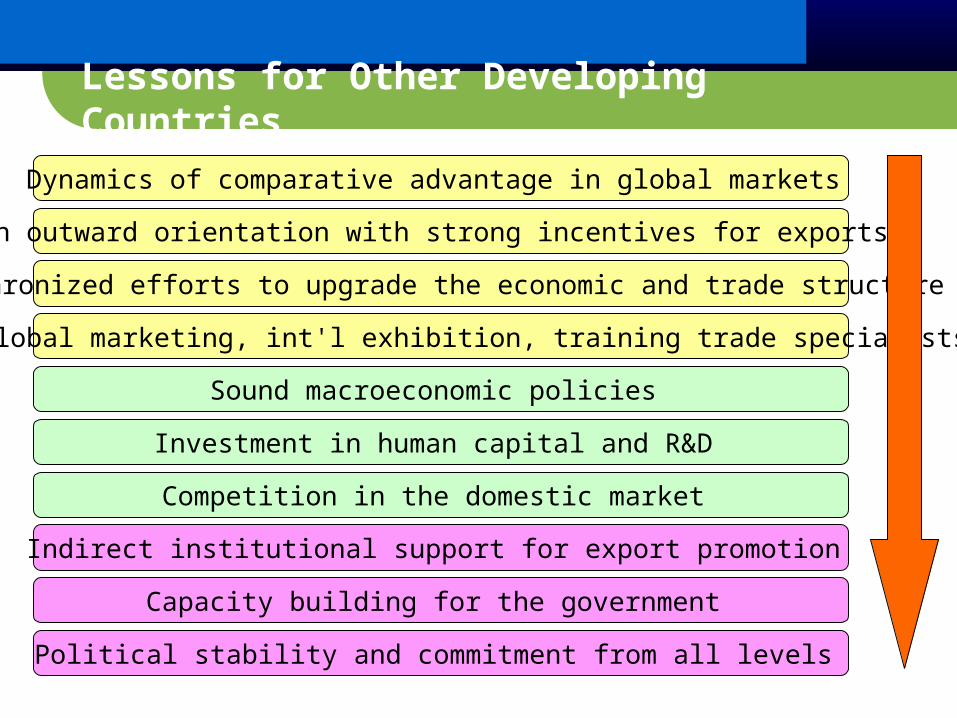
Lessons for Other Developing Countries
Dynamics of comparative advantage in global markets
An outward orientation with strong incentives for exports
Sound macroeconomic policies
Investment in human capital and R&D
Competition in the domestic market
R&D, global marketing, int'l exhibition, training trade specialists
Synchronized efforts to upgrade the economic and trade structure
Political stability and commitment from all levels
Capacity building for the government
Indirect institutional support for export promotion
Korea's Multilateral Trade Policy
Overview: WTO/DDA
Korea's Position on DDA
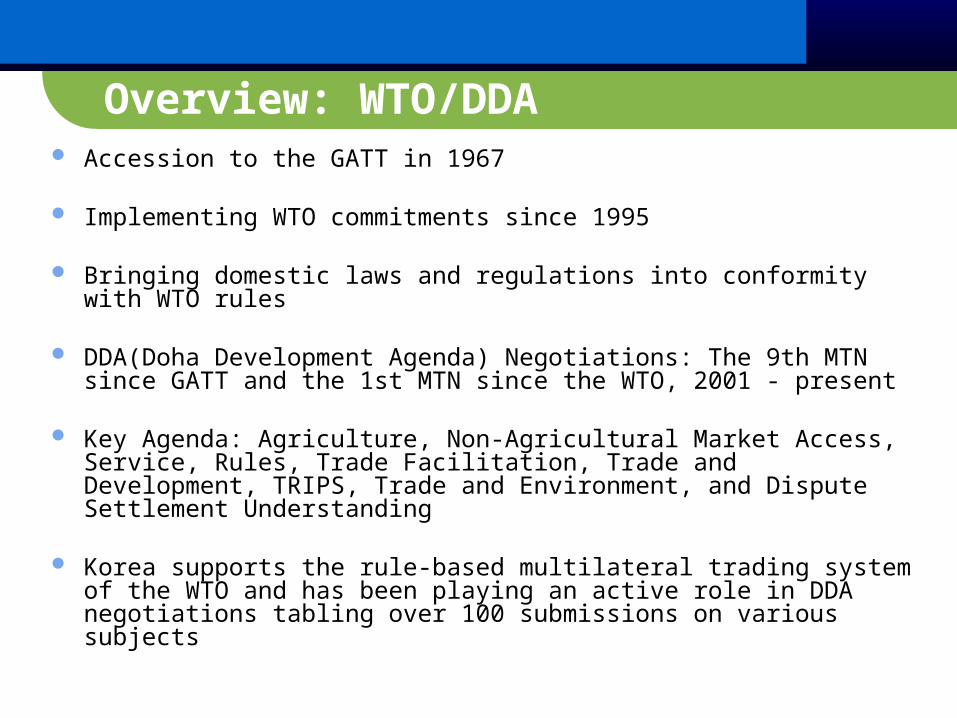
Overview: WTO/DDA Accession to the GATT in 1967
Implementing WTO commitments since 1995
Bringing domestic laws and regulations into conformity with WTO rules
DDA(Doha Development Agenda) Negotiations: The 9th MTN since GATT and the 1st MTN since the WTO, 2001 - present
Key Agenda: Agriculture, Non-Agricultural Market Access, Service, Rules, Trade Facilitation, Trade and Development, TRIPS, Trade and Environment, and Dispute Settlement Understanding
Korea supports the rule-based multilateral trading system of the WTO and has been playing an active role in DDA negotiations tabling over 100 submissions on various subjects
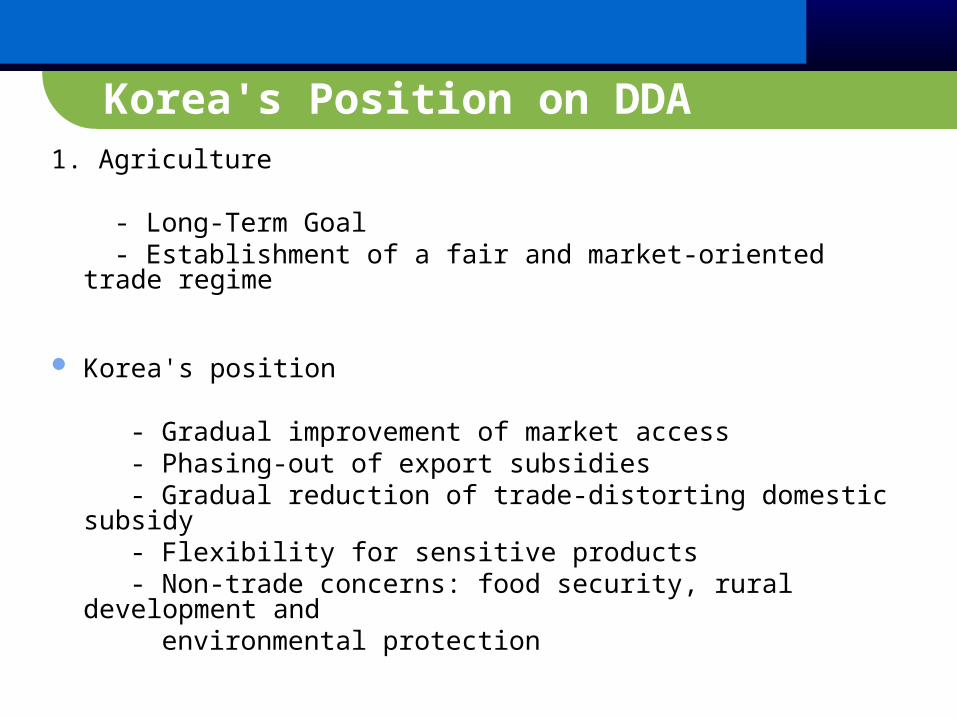
Korea's Position on DDA1. Agriculture
- Long-Term Goal - Establishment of a fair and market-oriented trade regime
Korea's position
- Gradual improvement of market access - Phasing-out of export subsidies - Gradual reduction of trade-distorting domestic subsidy - Flexibility for sensitive products - Non-trade concerns: food security, rural development and environmental protection
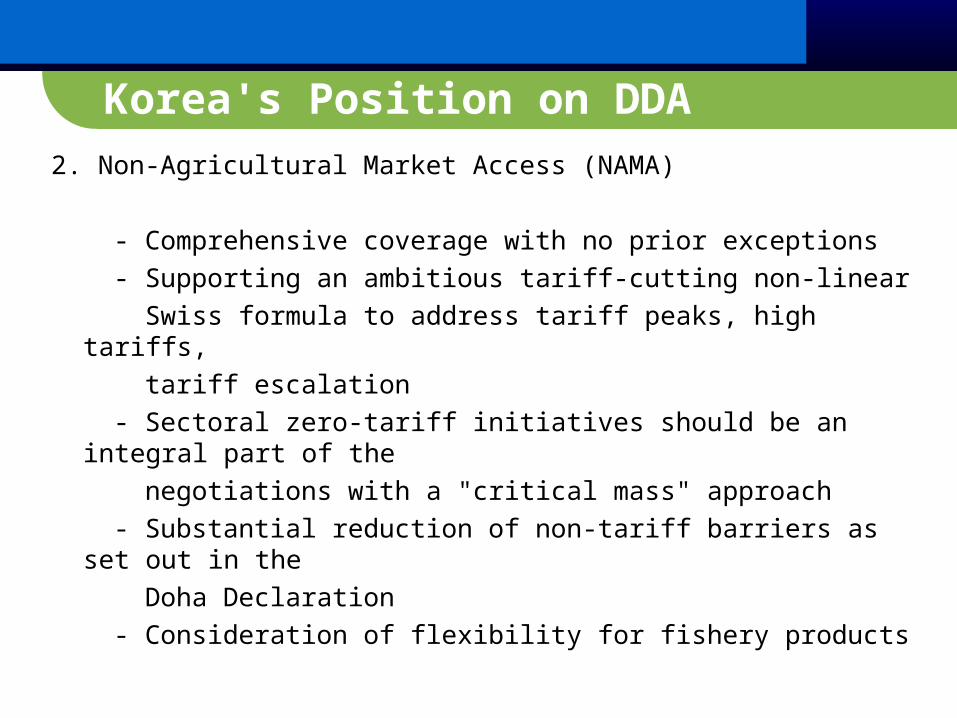
Korea's Position on DDA2. Non-Agricultural Market Access (NAMA)
- Comprehensive coverage with no prior exceptions - Supporting an ambitious tariff-cutting non-linear Swiss formula to address tariff peaks, high tariffs, tariff escalation - Sectoral zero-tariff initiatives should be an integral part of the negotiations with a "critical mass" approach - Substantial reduction of non-tariff barriers as set out in the Doha Declaration - Consideration of flexibility for fishery products

Korea's Position on DDA3. Services
High priority on infrastructure services (competitive areas) - such as telecommunications - distribution - maritime transportation - construction - and financial services
Adjusting speed and scope of audio-visual, legal, and educational services (non-competitive areas)
1st offer (2003.3), 2nd offer(2005.5) - Enhancement of the overall economic competitiveness
Expecting meaningful offers from a majority of WTO members
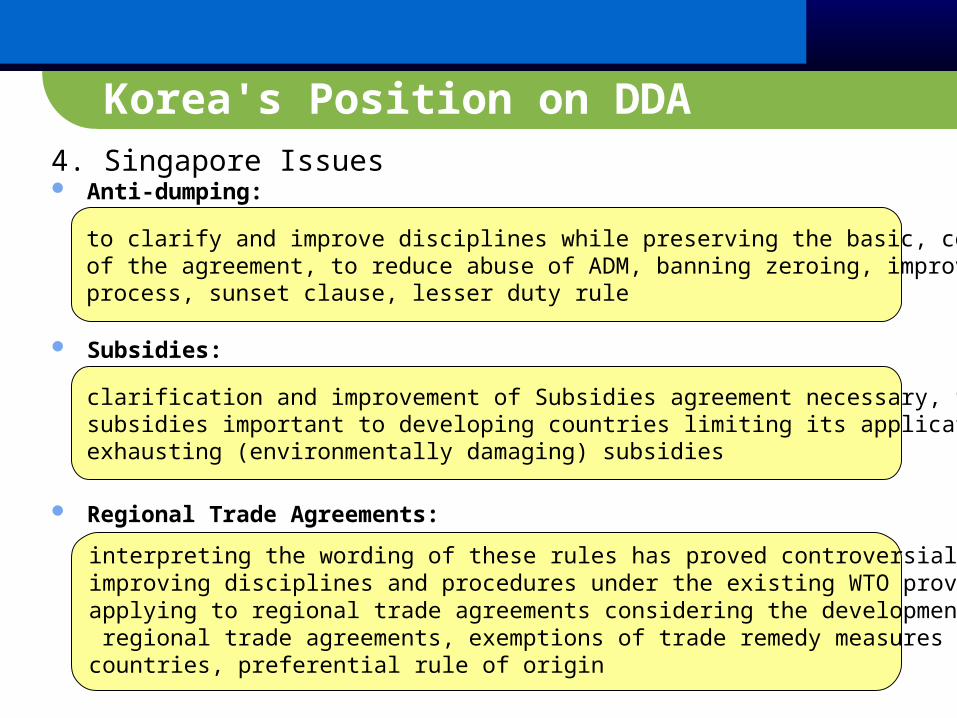
Korea's Position on DDA4. Singapore Issues Anti-dumping:
Subsidies:
Regional Trade Agreements:
to clarify and improve disciplines while preserving the basic, concepts, principles of the agreement, to reduce abuse of ADM, banning zeroing, improving review process, sunset clause, lesser duty rule
clarification and improvement of Subsidies agreement necessary, fisheries subsidies important to developing countries limiting its application to resource-exhausting (environmentally damaging) subsidies
interpreting the wording of these rules has proved controversial, clarifying andimproving disciplines and procedures under the existing WTO provisions applying to regional trade agreements considering the developmental aspects of regional trade agreements, exemptions of trade remedy measures for member countries, preferential rule of origin
East Asian Regionalism
Proliferation of FTAs: Trends
Integration Scenarios Going Forward
Korea's Options
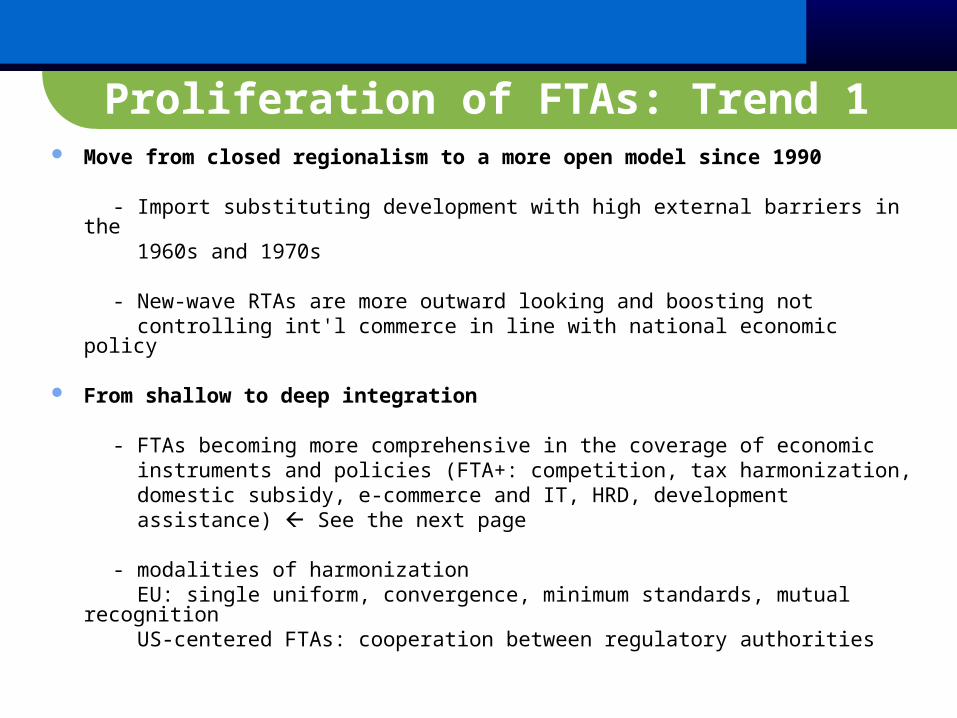
Proliferation of FTAs: Trend 1 Move from closed regionalism to a more open model since 1990
- Import substituting development with high external barriers in the 1960s and 1970s
- New-wave RTAs are more outward looking and boosting not controlling int'l commerce in line with national economic policy
From shallow to deep integration
- FTAs becoming more comprehensive in the coverage of economic instruments and policies (FTA+: competition, tax harmonization, domestic subsidy, e-commerce and IT, HRD, development assistance) See the next page
- modalities of harmonization EU: single uniform, convergence, minimum standards, mutual recognition US-centered FTAs: cooperation between regulatory authorities
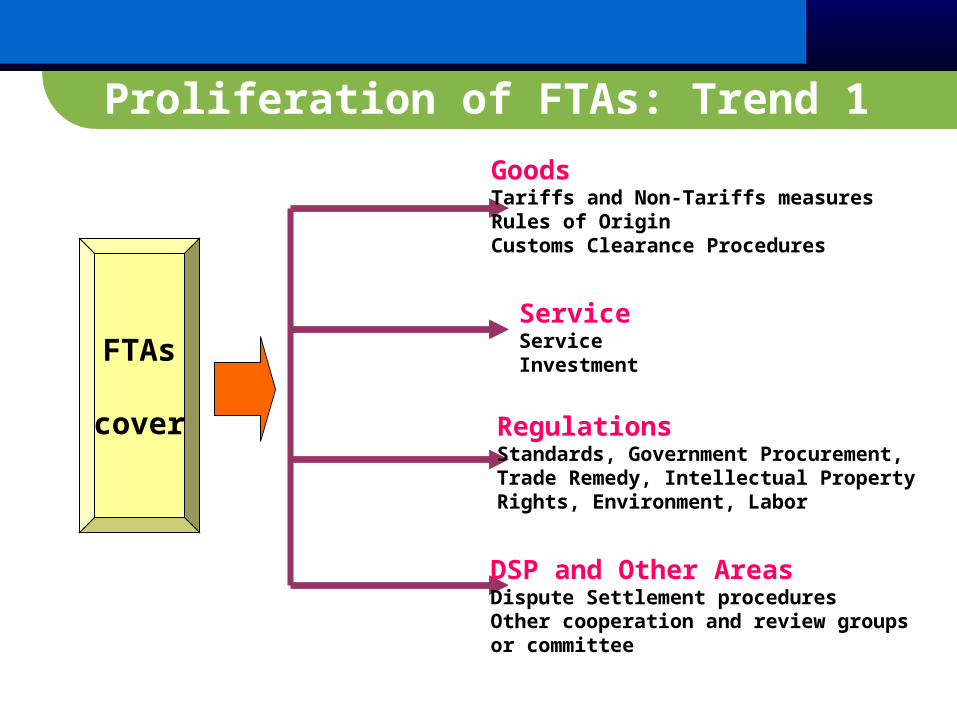
Proliferation of FTAs: Trend 1
FTAs
cover
GoodsTariffs and Non-Tariffs measuresRules of OriginCustoms Clearance Procedures
DSP and Other AreasDispute Settlement proceduresOther cooperation and review groups or committee
ServiceServiceInvestment
RegulationsStandards, Government Procurement,Trade Remedy, Intellectual PropertyRights, Environment, Labor
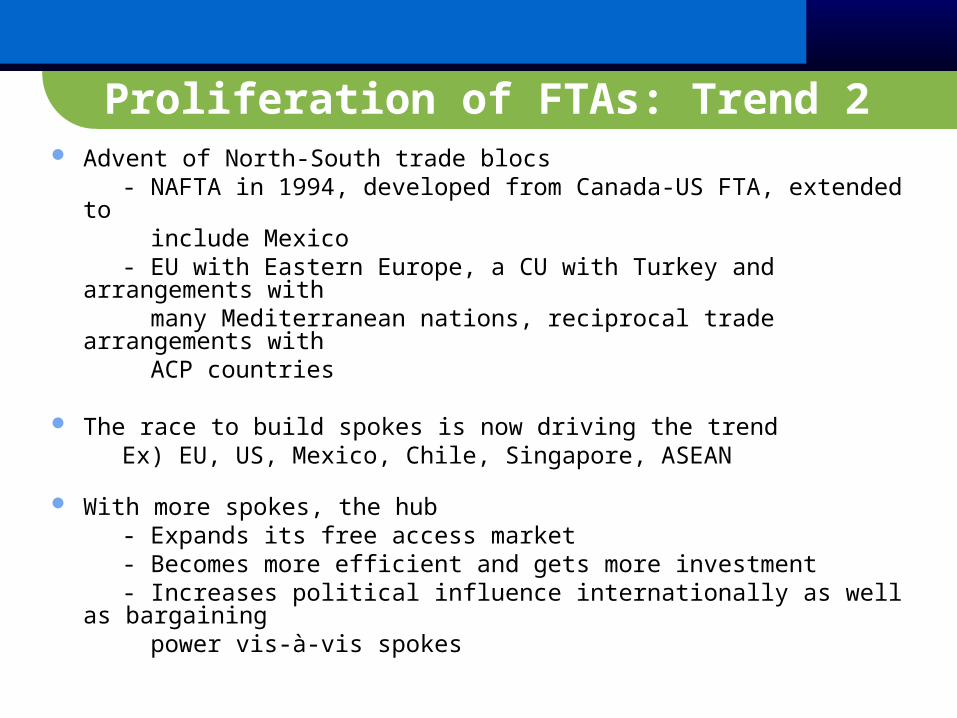
Proliferation of FTAs: Trend 2 Advent of North-South trade blocs - NAFTA in 1994, developed from Canada-US FTA, extended to include Mexico - EU with Eastern Europe, a CU with Turkey and arrangements with many Mediterranean nations, reciprocal trade arrangements with ACP countries
The race to build spokes is now driving the trend Ex) EU, US, Mexico, Chile, Singapore, ASEAN
With more spokes, the hub - Expands its free access market - Becomes more efficient and gets more investment - Increases political influence internationally as well as bargaining power vis-à-vis spokes
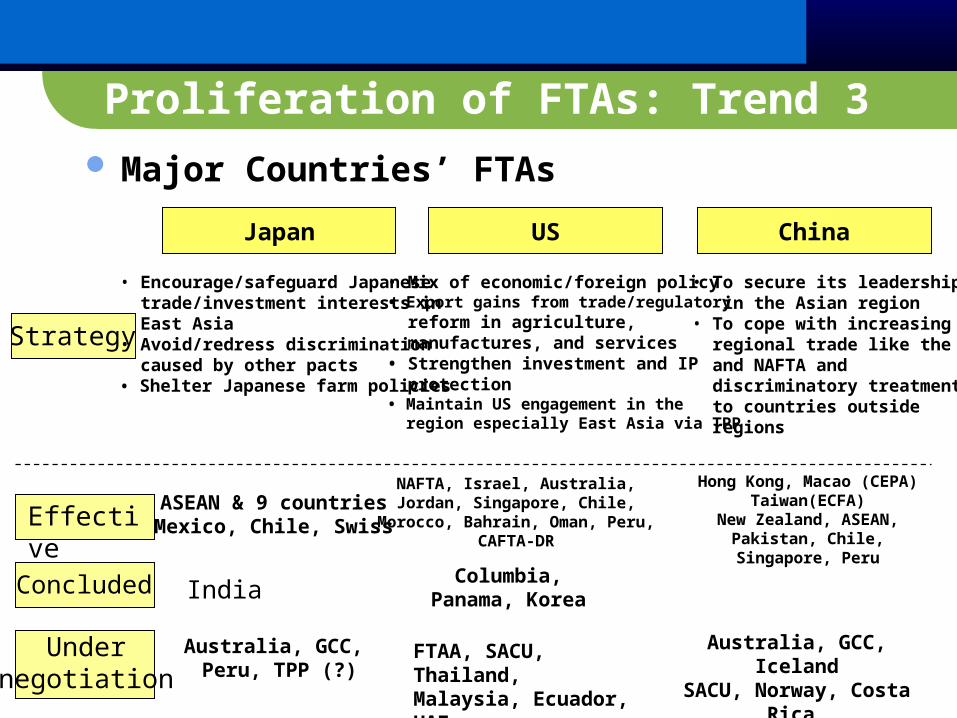
Proliferation of FTAs: Trend 3 Major Countries’ FTAs
Japan US China
• Encourage/safeguard Japanese trade/investment interests in East Asia• Avoid/redress discrimination caused by other pacts• Shelter Japanese farm policies
• Mix of economic/foreign policy• Export gains from trade/regulatory reform in agriculture, manufactures, and services• Strengthen investment and IP protection• Maintain US engagement in the region especially East Asia via TPP
• To secure its leadership in the Asian region • To cope with increasing regional trade like the EU and NAFTA and discriminatory treatment to countries outside regions
Strategy
Effective
Concluded
Undernegotiation
ASEAN & 9 countriesMexico, Chile, Swiss
Australia, GCC, Peru, TPP (?)
NAFTA, Israel, Australia,Jordan, Singapore, Chile,
Morocco, Bahrain, Oman, Peru,CAFTA-DR
Columbia,Panama, Korea
FTAA, SACU, Thailand,Malaysia, Ecuador, UAE
Hong Kong, Macao (CEPA)Taiwan(ECFA)
New Zealand, ASEAN, Pakistan, Chile, Singapore,
Peru
Australia, GCC, IcelandSACU, Norway, Costa Rica
India
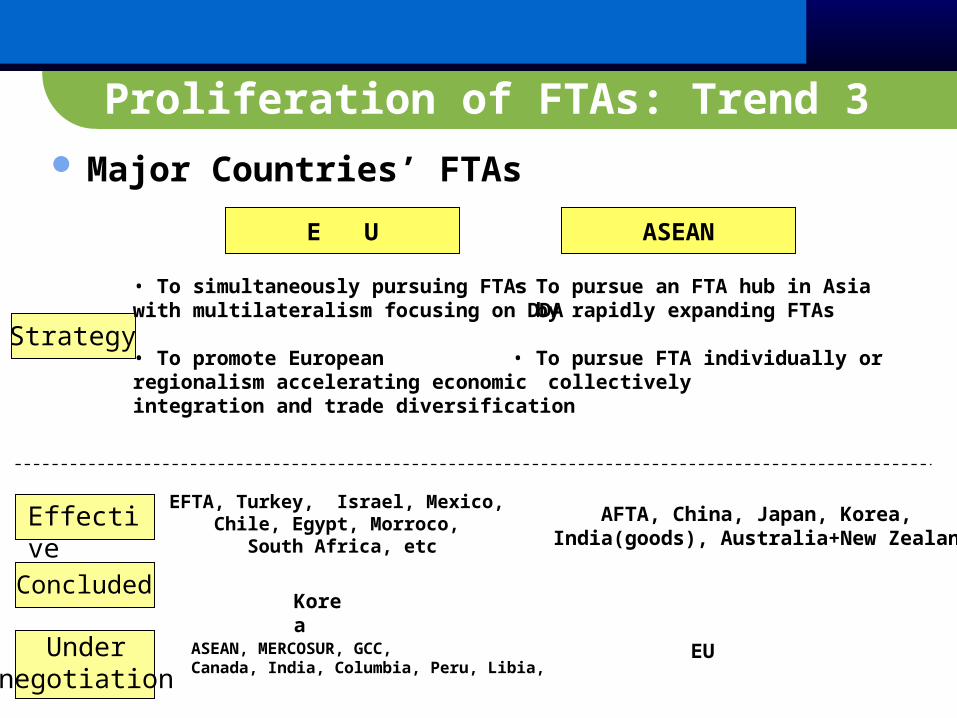
Proliferation of FTAs: Trend 3 Major Countries’ FTAs
E U ASEAN
• To simultaneously pursuing FTAswith multilateralism focusing on DDA
• To promote Europeanregionalism accelerating economic integration and trade diversification
• To pursue an FTA hub in Asia by rapidly expanding FTAs
• To pursue FTA individually or collectively
Strategy
Effective
Concluded
Undernegotiation
EFTA, Turkey, Israel, Mexico, Chile, Egypt, Morroco,
South Africa, etc
Korea
ASEAN, MERCOSUR, GCC,Canada, India, Columbia, Peru, Libia,
AFTA, China, Japan, Korea, India(goods), Australia+New Zealand
EU
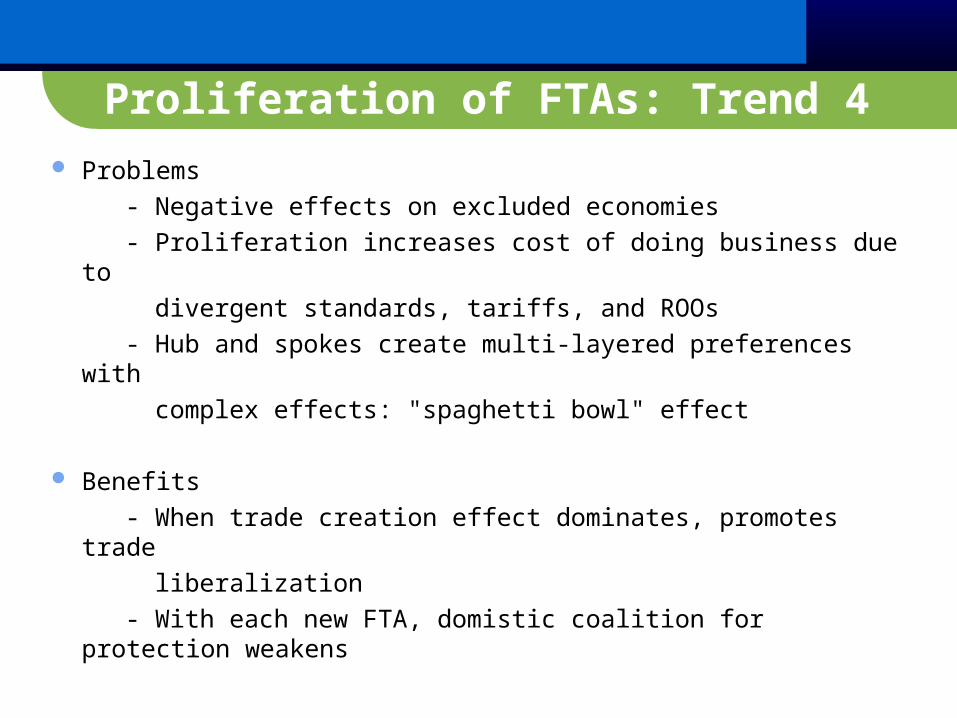
Proliferation of FTAs: Trend 4 Problems - Negative effects on excluded economies - Proliferation increases cost of doing business due to divergent standards, tariffs, and ROOs - Hub and spokes create multi-layered preferences with complex effects: "spaghetti bowl" effect
Benefits - When trade creation effect dominates, promotes trade liberalization - With each new FTA, domistic coalition for protection weakens
Integration Scenarios Going Forward
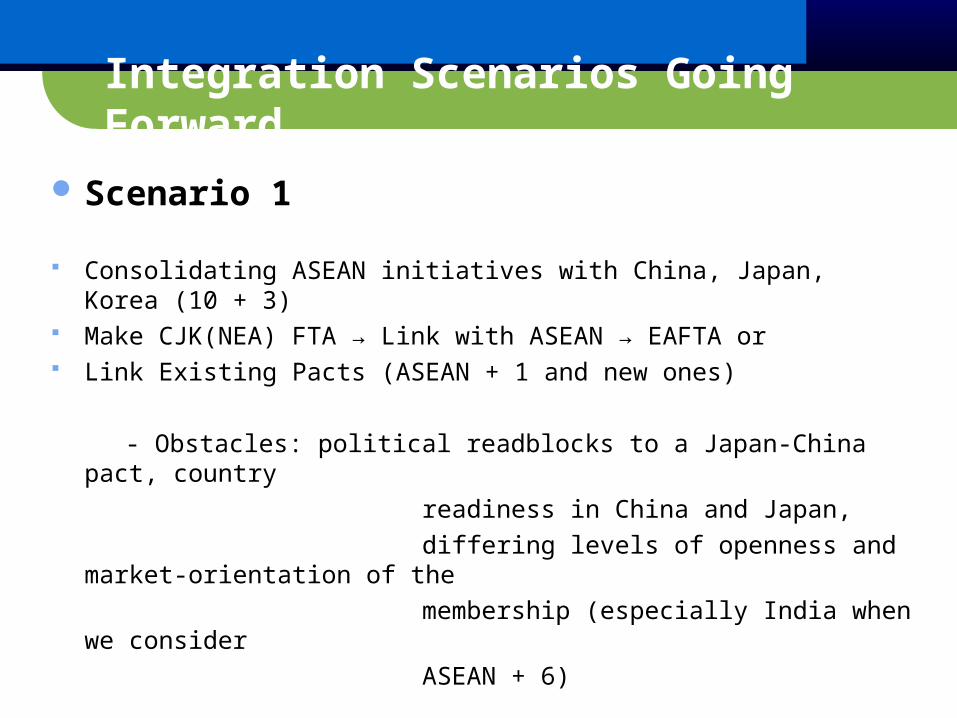
Scenario 1
Consolidating ASEAN initiatives with China, Japan, Korea (10 + 3) Make CJK(NEA) FTA → Link with ASEAN → EAFTA or Link Existing Pacts (ASEAN + 1 and new ones)
- Obstacles: political readblocks to a Japan-China pact, country readiness in China and Japan, differing levels of openness and market-orientation of the membership (especially India when we consider ASEAN + 6)

Integration Scenarios Going Forward Scenario 2
APEC implements the Bogor Goal vision Free Trade Area of the Asia-Pacific
- Obstacles: entrenched protectionism (e.g., agriculture), lack of reciprocity and free-rider problem, no political leadership
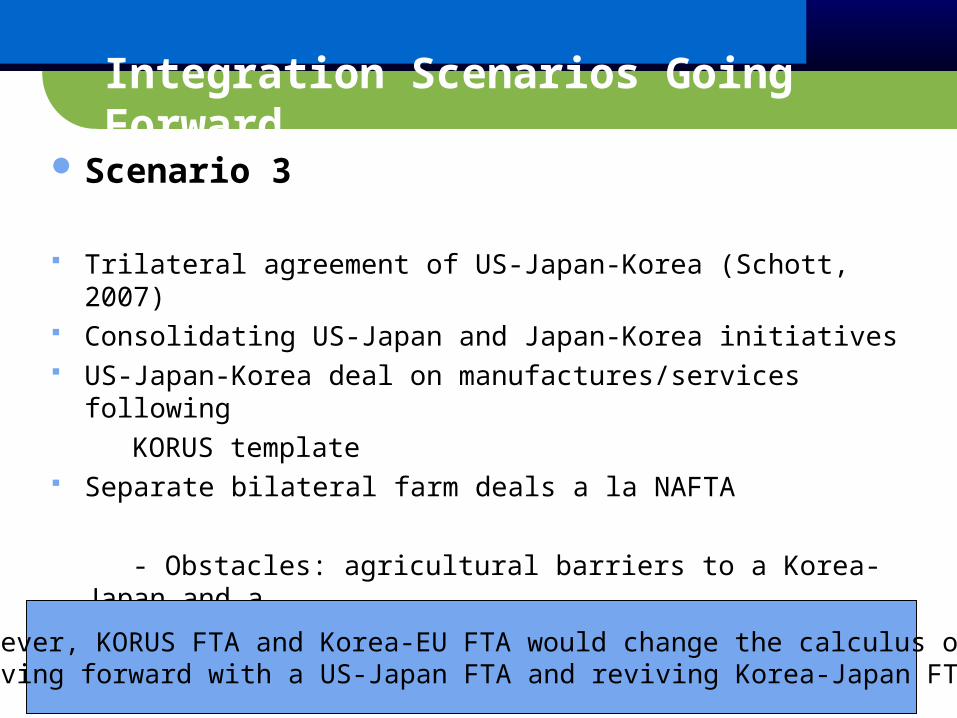
Integration Scenarios Going Forward Scenario 3
Trilateral agreement of US-Japan-Korea (Schott, 2007) Consolidating US-Japan and Japan-Korea initiatives US-Japan-Korea deal on manufactures/services following KORUS template Separate bilateral farm deals a la NAFTA
- Obstacles: agricultural barriers to a Korea-Japan and a US-Japan pact
However, KORUS FTA and Korea-EU FTA would change the calculus of moving forward with a US-Japan FTA and reviving Korea-Japan FTA
Integration Scenarios Going Forward
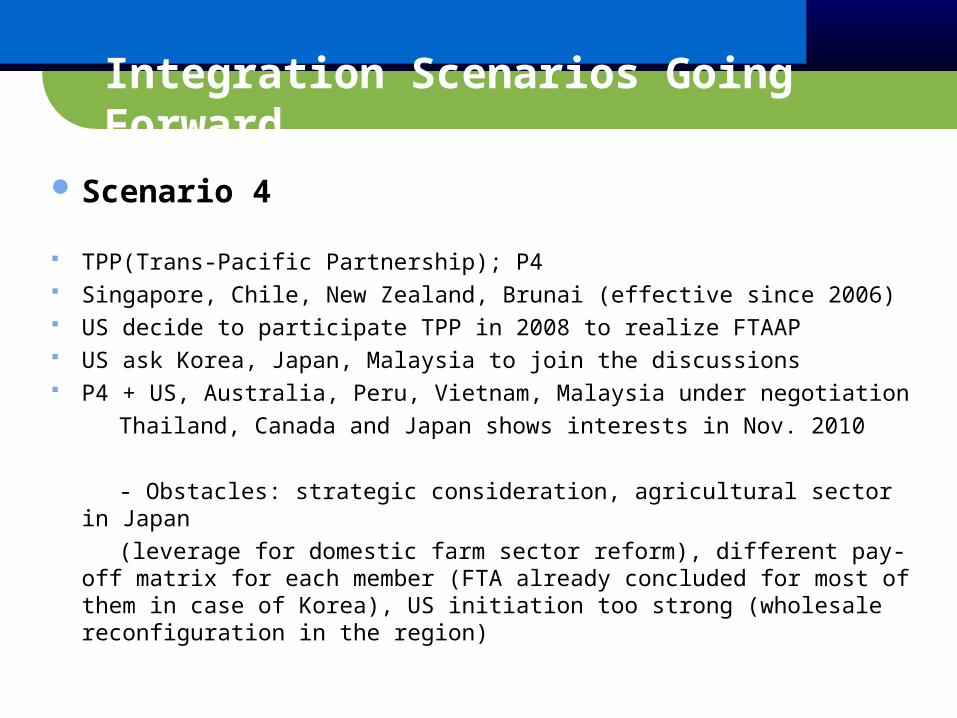
Scenario 4
TPP(Trans-Pacific Partnership); P4 Singapore, Chile, New Zealand, Brunai (effective since 2006) US decide to participate TPP in 2008 to realize FTAAP US ask Korea, Japan, Malaysia to join the discussions P4 + US, Australia, Peru, Vietnam, Malaysia under negotiation Thailand, Canada and Japan shows interests in Nov. 2010
- Obstacles: strategic consideration, agricultural sector in Japan (leverage for domestic farm sector reform), different pay-off matrix for
each member (FTA already concluded for most of them in case of Korea), US initiation too strong (wholesale reconfiguration in the region)
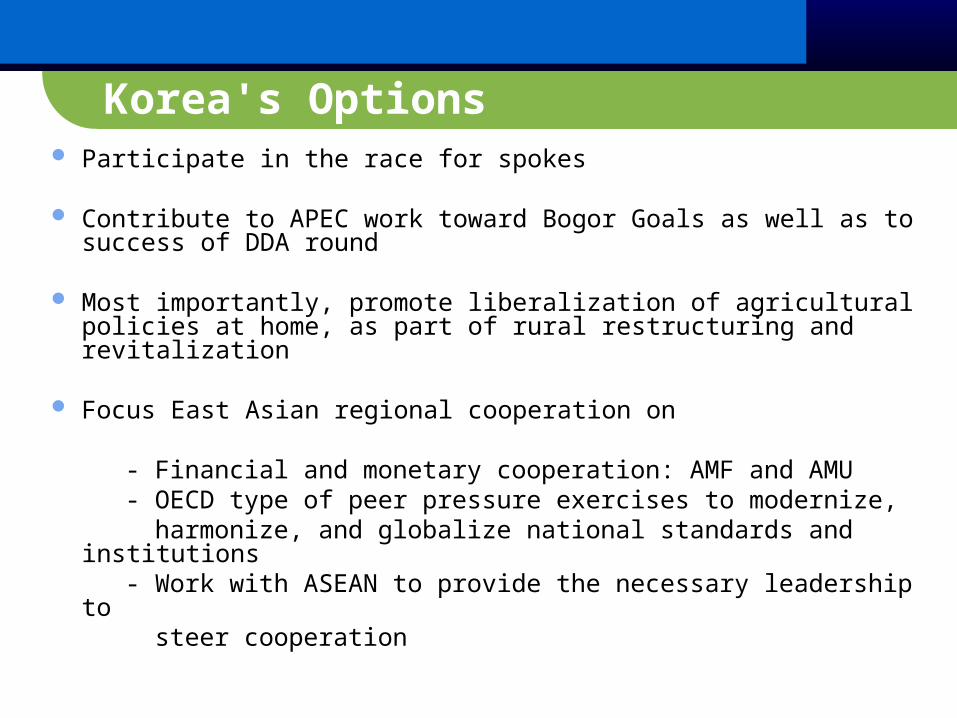
Korea's Options Participate in the race for spokes
Contribute to APEC work toward Bogor Goals as well as to success of DDA round
Most importantly, promote liberalization of agricultural policies at home, as part of rural restructuring and revitalization
Focus East Asian regional cooperation on - Financial and monetary cooperation: AMF and AMU - OECD type of peer pressure exercises to modernize, harmonize, and globalize national standards and institutions - Work with ASEAN to provide the necessary leadership to steer cooperation
Korea's FTA Policy
Future Plan and New Strategies
Selection Criteria of FTA Partners (FTA Roadmap in 2003)
Basic Strategies (FTA Roadmap in 2003)
A Grand Shift to FTA, Why?
Current Status
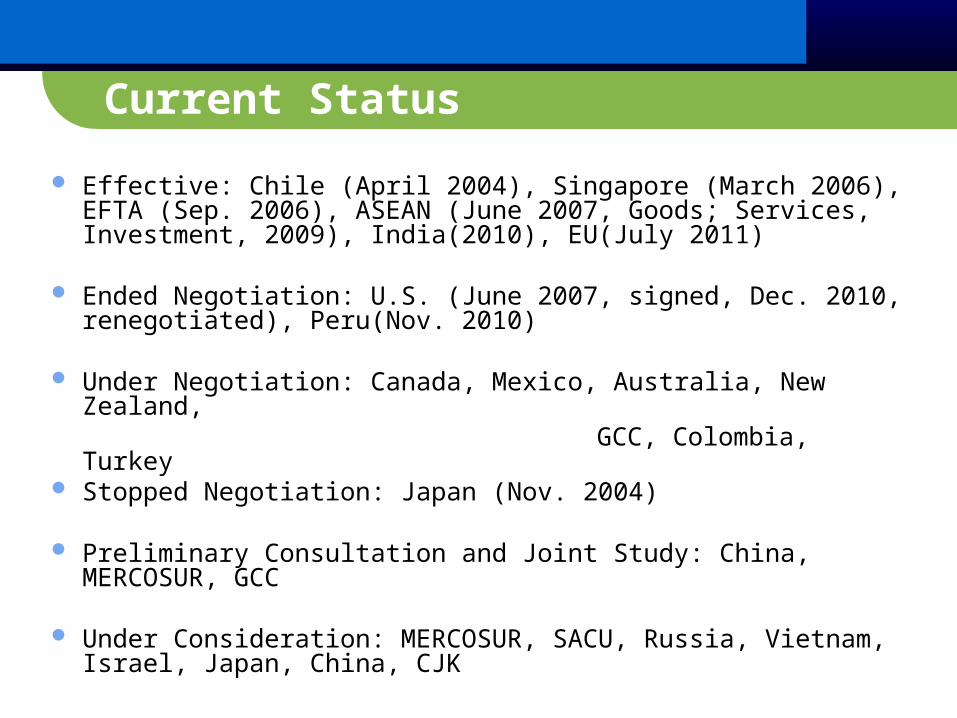
Current Status
Effective: Chile (April 2004), Singapore (March 2006), EFTA (Sep. 2006), ASEAN (June 2007, Goods; Services, Investment, 2009), India(2010), EU(July 2011)
Ended Negotiation: U.S. (June 2007, signed, Dec. 2010,
renegotiated), Peru(Nov. 2010) Under Negotiation: Canada, Mexico, Australia, New Zealand, GCC, Colombia, Turkey Stopped Negotiation: Japan (Nov. 2004)
Preliminary Consultation and Joint Study: China, MERCOSUR, GCC
Under Consideration: MERCOSUR, SACU, Russia, Vietnam, Israel, Japan, China, CJK
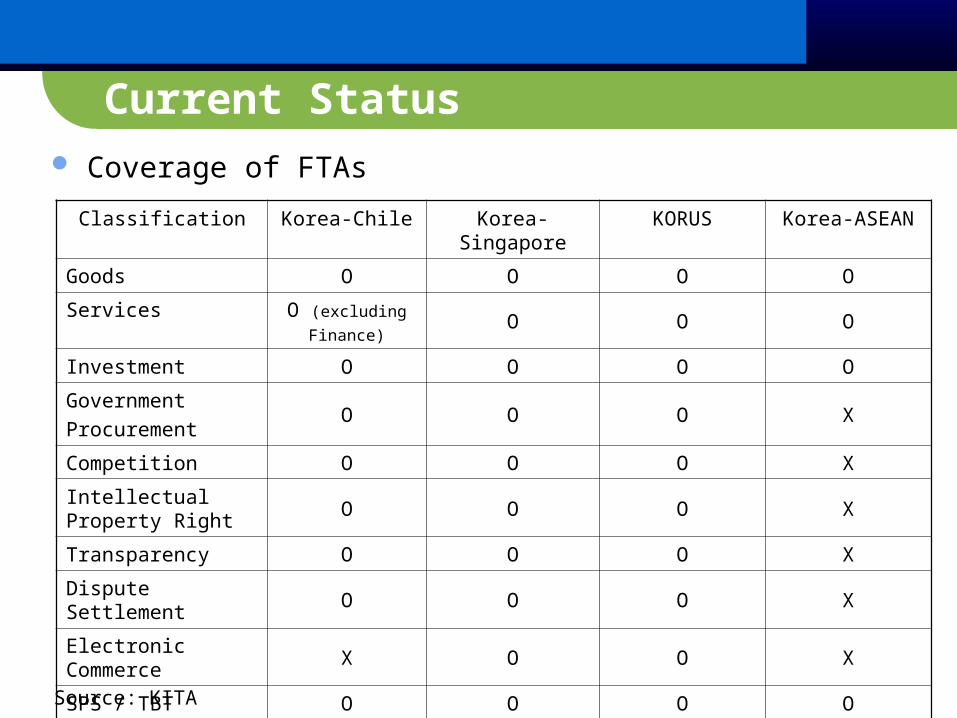
Current Status Coverage of FTAs
Classification Korea-Chile Korea-Singapore KORUS Korea-ASEAN
Goods O O O O
Services O (excludingFinance)
O O O
Investment O O O O
GovernmentProcurement
O O O X
Competition O O O X
Intellectual Property Right O O O X
Transparency O O O X
Dispute Settlement O O O X
Electronic Commerce X O O X
SPS / TBT O O O O
Cooperation X O X O
Source: KITA
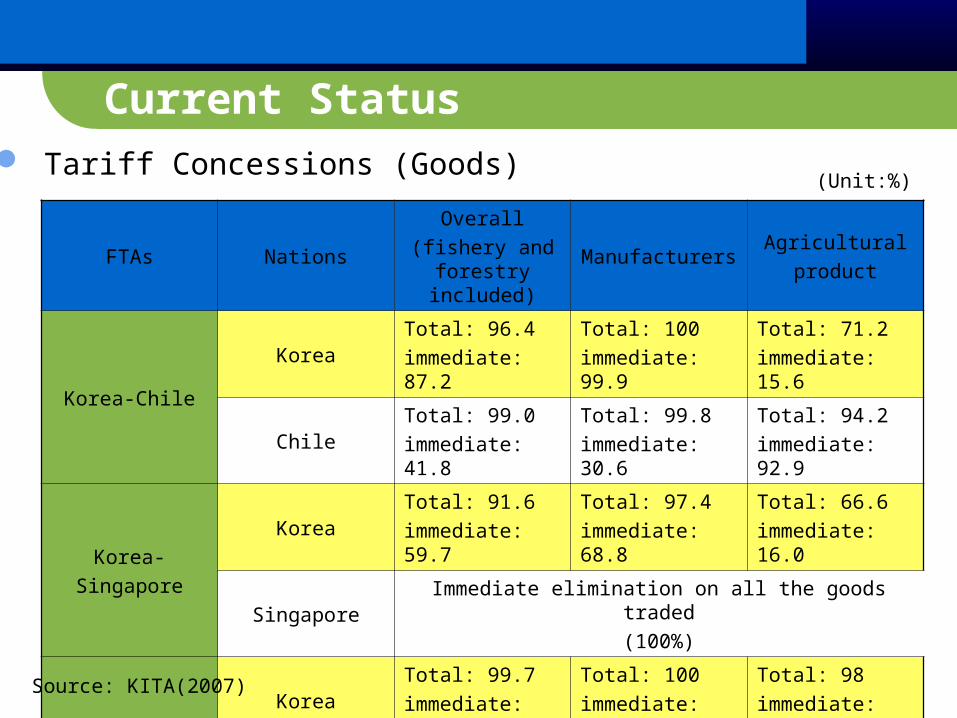
Current Status Tariff Concessions (Goods)
FTAs NationsOverall
(fishery and forestry included)
ManufacturersAgricultural
product
Korea-ChileKorea
Total: 96.4immediate: 87.2
Total: 100immediate: 99.9
Total: 71.2immediate: 15.6
ChileTotal: 99.0immediate: 41.8
Total: 99.8immediate: 30.6
Total: 94.2immediate: 92.9
Korea-Singapore
KoreaTotal: 91.6immediate: 59.7
Total: 97.4immediate: 68.8
Total: 66.6immediate: 16.0
SingaporeImmediate elimination on all the goods traded
(100%)
Korea-USKorea
Total: 99.7immediate: 80.4
Total: 100immediate: 91.6
Total: 98immediate: 38.1
U.S.Total: 100immediate: 82.1
Total: 100immediate: 87.7
Total: 100immediate: 58.7
(Unit:%)
Source: KITA(2007)
A Grand Shift to FTA, Why? Accelerate domestic economic reforms to increase productivity/growth - TFP declining since 1980s, low birth rates with aging population, facility investment↓ since 2001, backward service sector
Reduce barriers to manufactured exports - Securing overseas market is a key factor to success
Induce FDI and promote development of North East Asia economic hub - Inviting needed foreign capital and advanced technology, share of intra-regional trade increases (55%)
Reinforce strategic alliance with key partners - to contribute to the political stabilization of the peninsula
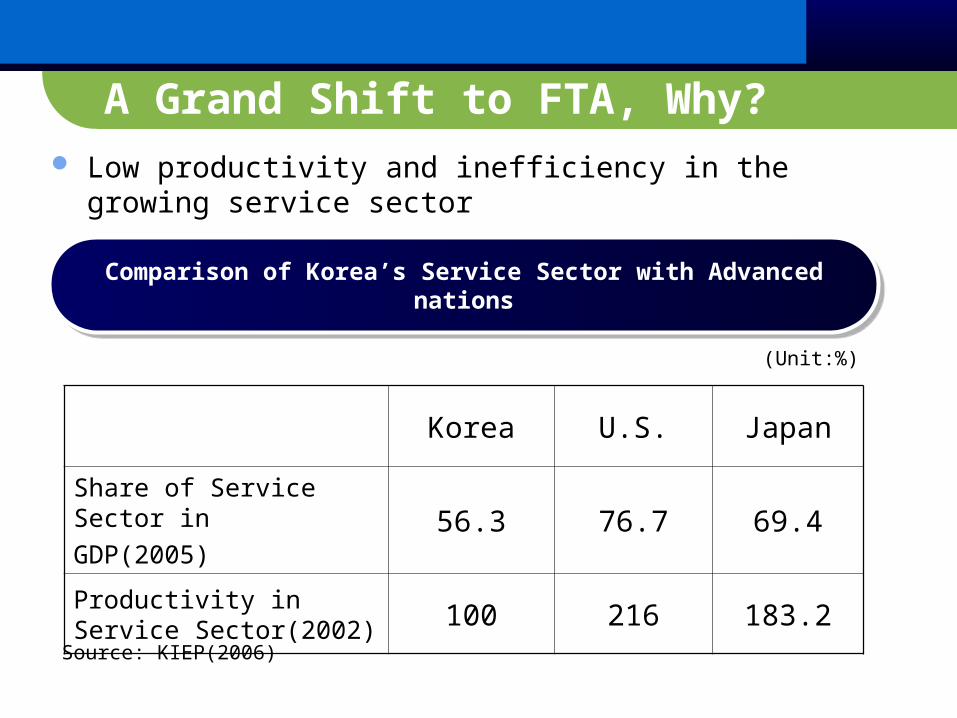
A Grand Shift to FTA, Why? Low productivity and inefficiency in the growing service
sector
Comparison of Korea’s Service Sector with Advanced nations
(Unit:%)
Source: KIEP(2006)
Korea U.S. Japan
Share of Service Sector inGDP(2005)
56.3 76.7 69.4
Productivity in Service Sector(2002) 100 216 183.2
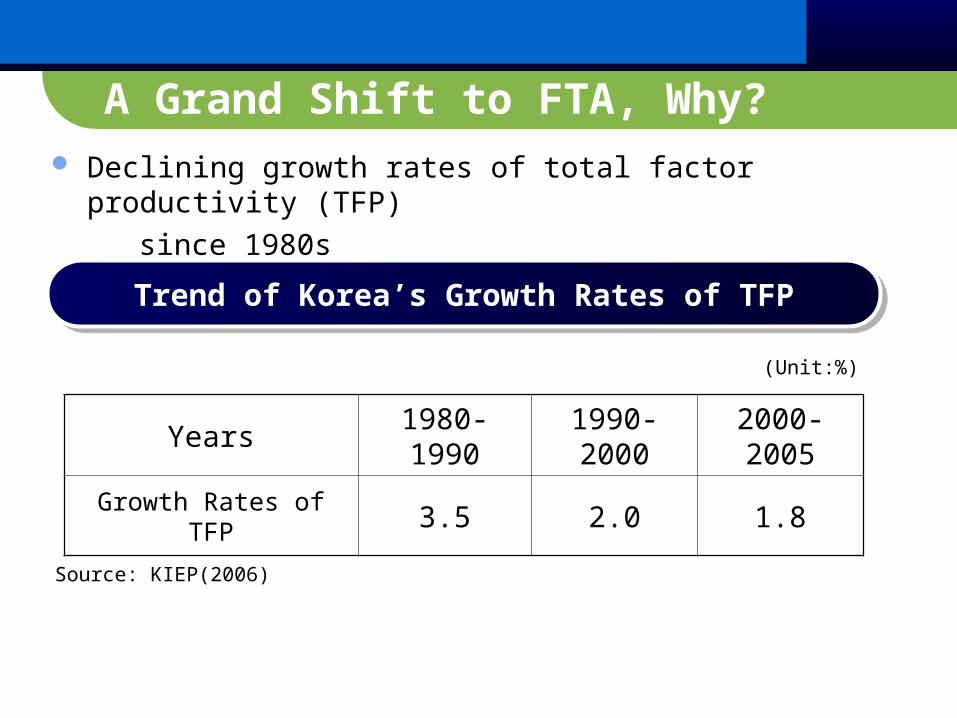
A Grand Shift to FTA, Why? Declining growth rates of total factor productivity (TFP) since 1980s
Trend of Korea’s Growth Rates of TFP
(Unit:%)
Source: KIEP(2006)
Years 1980-1990 1990-2000 2000-2005
Growth Rates of TFP 3.5 2.0 1.8
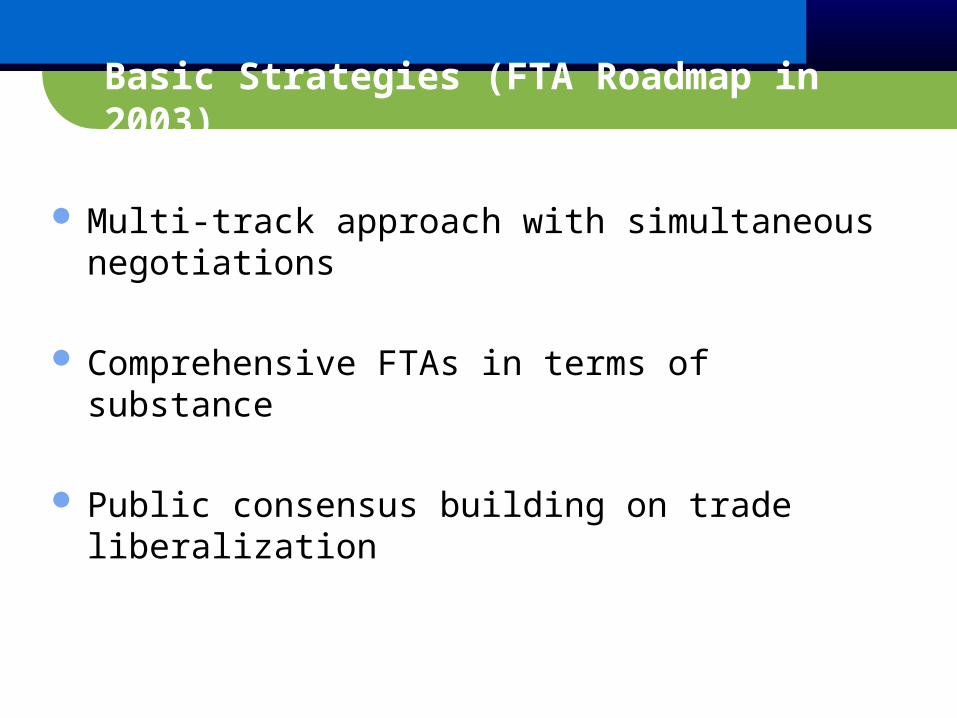
Basic Strategies (FTA Roadmap in 2003)
Multi-track approach with simultaneous negotiations
Comprehensive FTAs in terms of substance
Public consensus building on trade liberalization

Selection Criteria of FTA Partners (FTA Roadmap in 2003)
Economic Benefits Cooperation in security and foreign policy Country readiness: Countries active to have FTA with Korea From regional periphery to core advanced countries
Sequencing Short-term: Japan, Singapore, ASEAN, EFTA, Mexico, Canada, India Mid & long-term: U.S., EU, China, MERCOSUR, NEAFTA Other countries: GCC, Russia, Australia, New Zealand, Peru,
Israel, Morocco, Algeria, SACU
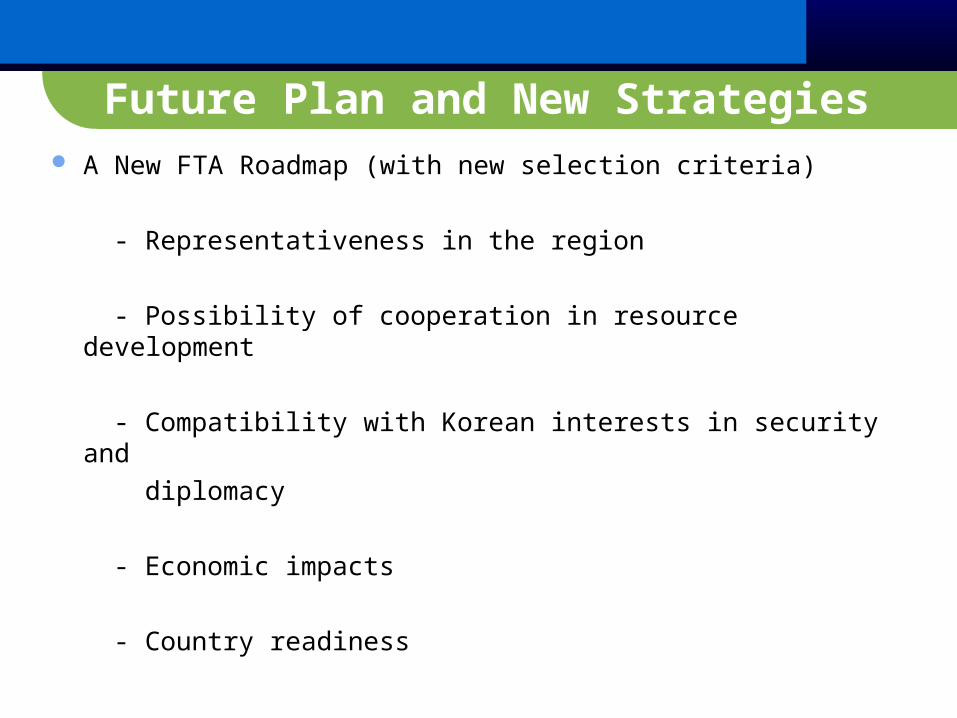
Future Plan and New Strategies A New FTA Roadmap (with new selection criteria)
- Representativeness in the region - Possibility of cooperation in resource development - Compatibility with Korean interests in security and diplomacy - Economic impacts - Country readiness
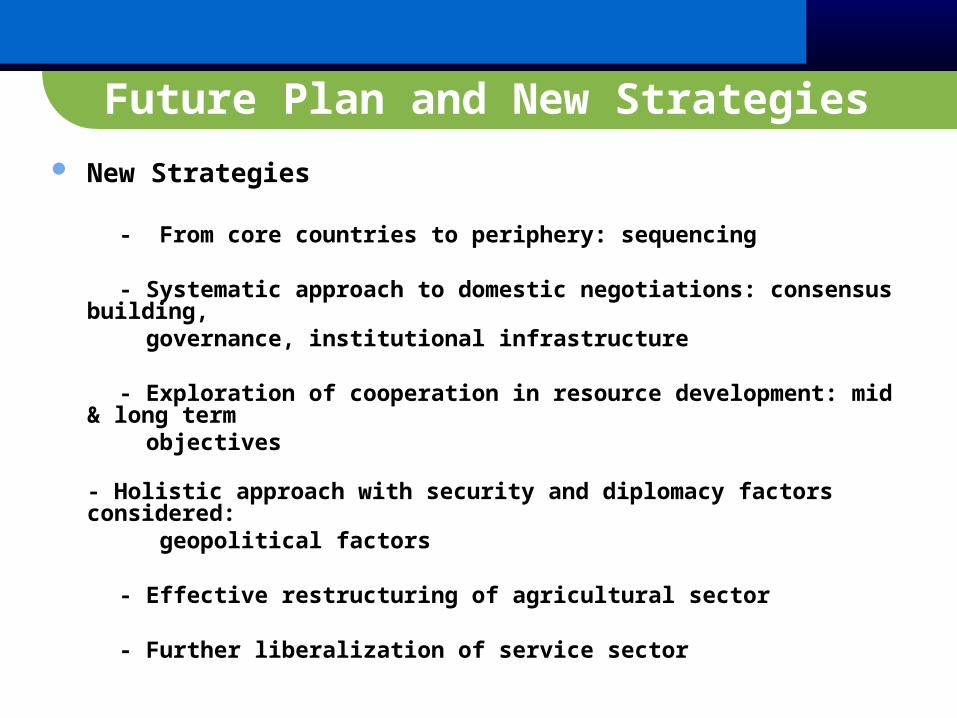
Future Plan and New Strategies New Strategies
- From core countries to periphery: sequencing
- Systematic approach to domestic negotiations: consensus building, governance, institutional infrastructure
- Exploration of cooperation in resource development: mid & long term objectives
- Holistic approach with security and diplomacy factors considered: geopolitical factors
- Effective restructuring of agricultural sector
- Further liberalization of service sector
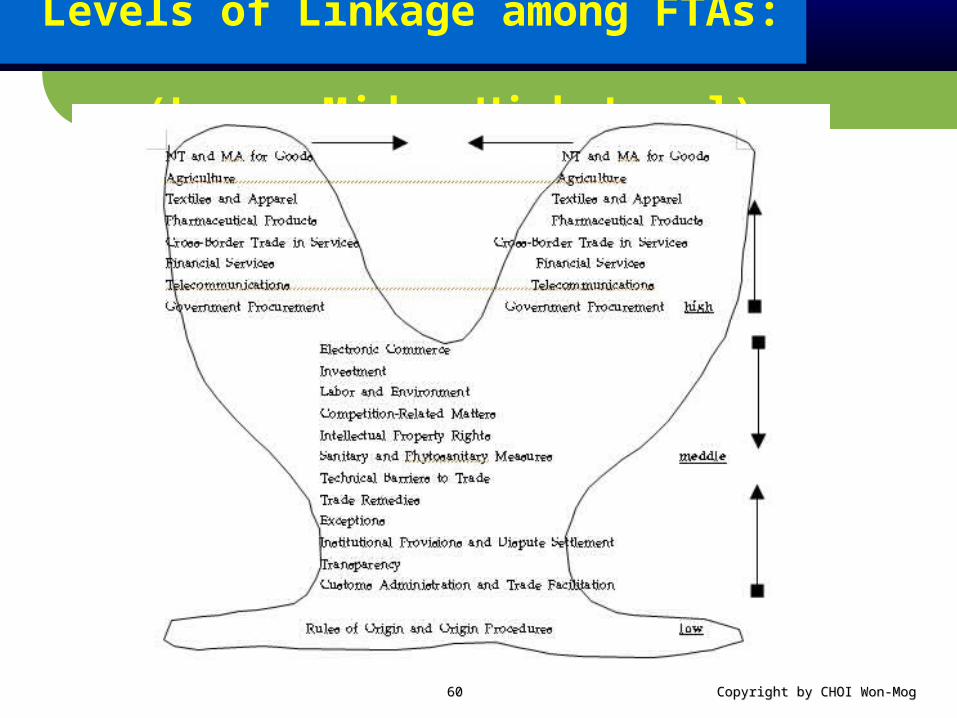
Levels of Linkage among FTAs: (Low – Mid – High Level)
Copyright by CHOI Won-MogCopyright by CHOI Won-Mog6060
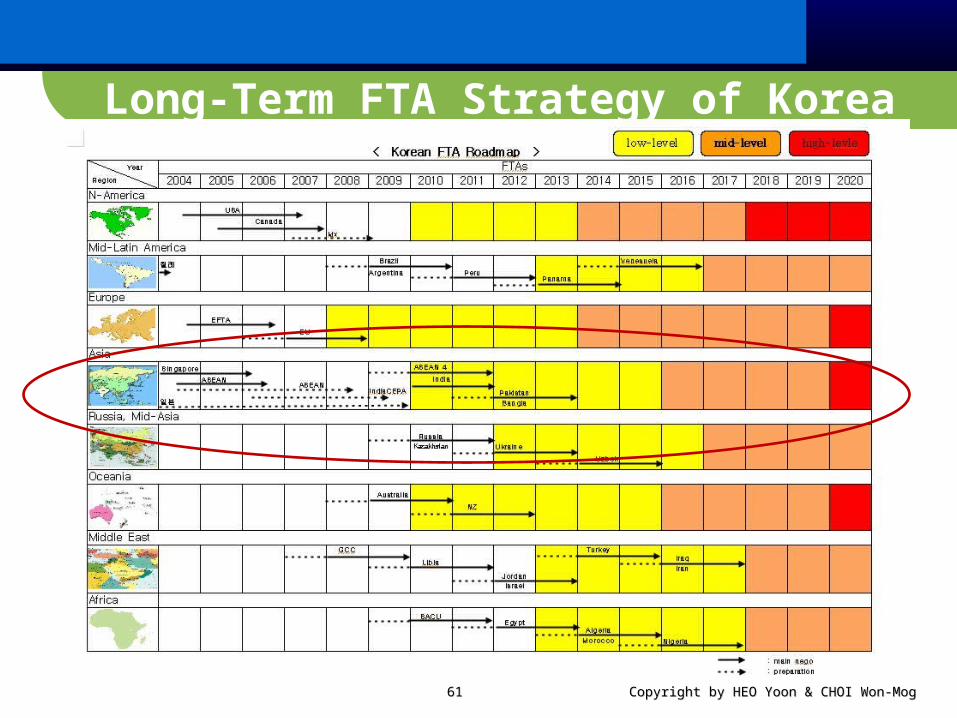
Long-Term FTA Strategy of Korea
Copyright by HEO Yoon & CHOI Won-MogCopyright by HEO Yoon & CHOI Won-Mog6161