ii - .net framework
TRANSCRIPT
II
AFFIN HWANG SELECT OPPORTUNITY FUND
Interim Report and Unaudited Financial Statements For the 6 Months Financial Period Ended 31 January 2021
Contents Page
FUND INFORMATION ............................................................................................................... III
FUND PERFORMANCE DATA ................................................................................................. IV
MANAGER’S REPORT .............................................................................................................. V
TRUSTEE’S REPORT .............................................................................................................. IX
FINANCIAL STATEMENTS
DIRECTORY OF SALES OFFICE
III
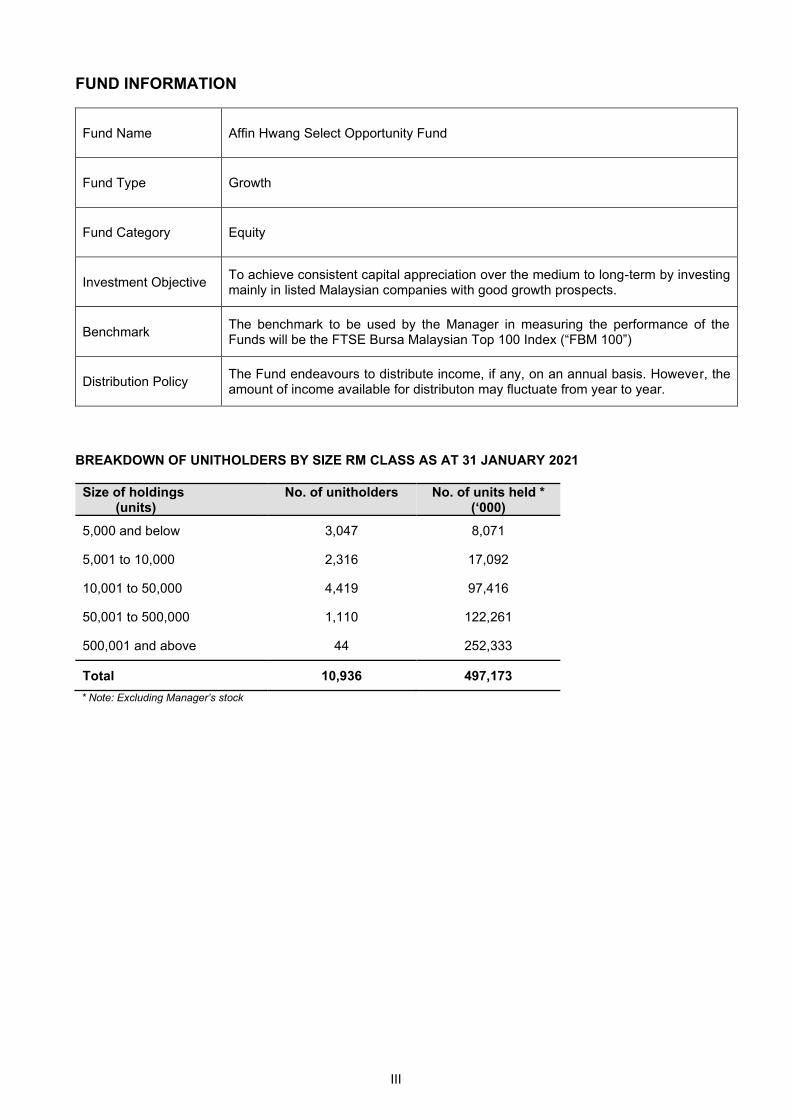
FUND INFORMATION
Fund Name Affin Hwang Select Opportunity Fund
Fund Type Growth
Fund Category Equity
Investment Objective To achieve consistent capital appreciation over the medium to long-term by investing mainly in listed Malaysian companies with good growth prospects.
Benchmark The benchmark to be used by the Manager in measuring the performance of the Funds will be the FTSE Bursa Malaysian Top 100 Index (“FBM 100”)
Distribution Policy The Fund endeavours to distribute income, if any, on an annual basis. However, the amount of income available for distributon may fluctuate from year to year.
BREAKDOWN OF UNITHOLDERS BY SIZE RM CLASS AS AT 31 JANUARY 2021
Size of holdings (units)
No. of unitholders No. of units held * (‘000)
5,000 and below 3,047 8,071
5,001 to 10,000 2,316 17,092
10,001 to 50,000 4,419 97,416
50,001 to 500,000 1,110 122,261
500,001 and above 44 252,333
Total 10,936 497,173
* Note: Excluding Manager’s stock
IV
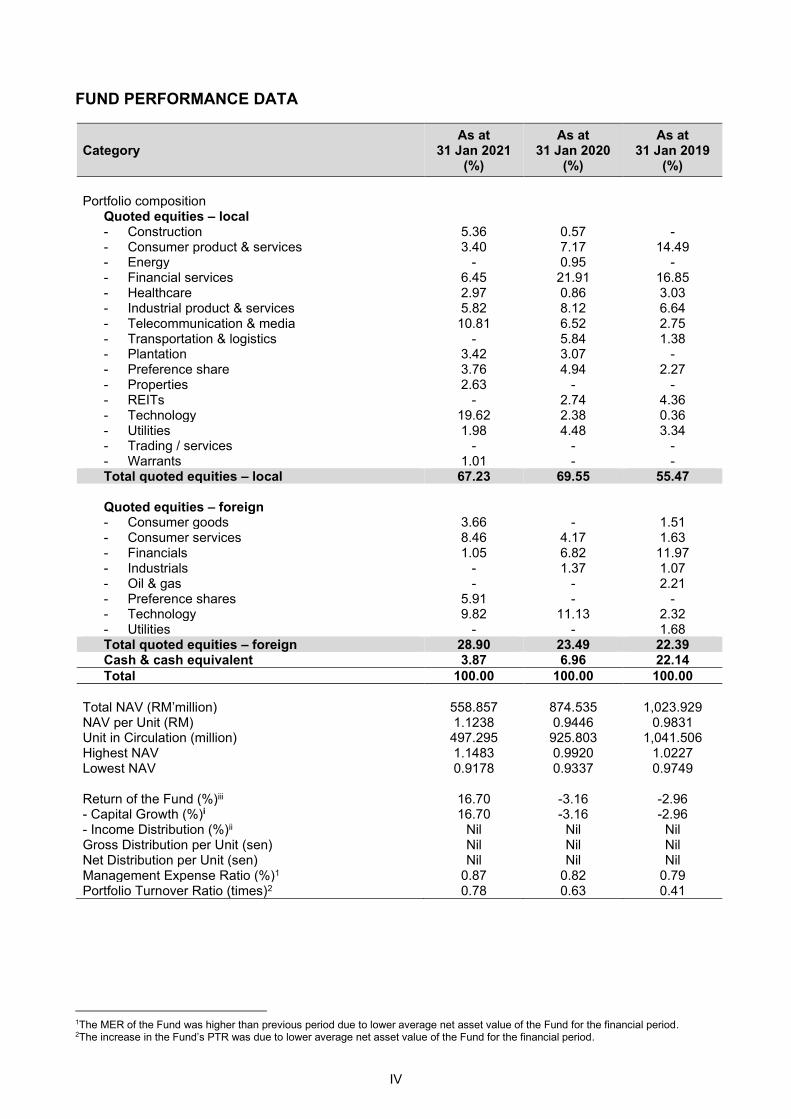
FUND PERFORMANCE DATA
Category As at
31 Jan 2021 (%)
As at 31 Jan 2020
(%)
As at 31 Jan 2019
(%)
Portfolio composition
Quoted equities – local - Construction 5.36 0.57 - - Consumer product & services 3.40 7.17 14.49 - Energy - 0.95 - - Financial services 6.45 21.91 16.85 - Healthcare 2.97 0.86 3.03 - Industrial product & services 5.82 8.12 6.64 - Telecommunication & media 10.81 6.52 2.75 - Transportation & logistics - 5.84 1.38 - Plantation 3.42 3.07 - - Preference share 3.76 4.94 2.27 - Properties 2.63 - - - REITs - 2.74 4.36 - Technology 19.62 2.38 0.36 - Utilities 1.98 4.48 3.34 - Trading / services - - - - Warrants 1.01 - - Total quoted equities – local 67.23 69.55 55.47 Quoted equities – foreign - Consumer goods 3.66 - 1.51 - Consumer services 8.46 4.17 1.63 - Financials 1.05 6.82 11.97 - Industrials - 1.37 1.07 - Oil & gas - - 2.21 - Preference shares 5.91 - - - Technology 9.82 11.13 2.32 - Utilities - - 1.68 Total quoted equities – foreign 28.90 23.49 22.39 Cash & cash equivalent 3.87 6.96 22.14
Total 100.00 100.00 100.00
Total NAV (RM’million) 558.857 874.535 1,023.929 NAV per Unit (RM) 1.1238 0.9446 0.9831 Unit in Circulation (million) 497.295 925.803 1,041.506 Highest NAV 1.1483 0.9920 1.0227 Lowest NAV 0.9178 0.9337 0.9749 Return of the Fund (%)iii 16.70 -3.16 -2.96 - Capital Growth (%)i 16.70 -3.16 -2.96 - Income Distribution (%)ii Nil Nil Nil Gross Distribution per Unit (sen) Nil Nil Nil Net Distribution per Unit (sen) Nil Nil Nil Management Expense Ratio (%)1 0.87 0.82 0.79 Portfolio Turnover Ratio (times)2 0.78 0.63 0.41
1The MER of the Fund was higher than previous period due to lower average net asset value of the Fund for the financial period. 2The increase in the Fund’s PTR was due to lower average net asset value of the Fund for the financial period.
V
Basis of calculation and assumption made in calculating the returns:- The performance figures are a comparison of the growth/decline in NAV for the stipulated period taking into account all the distribution payable (if any) during the stipulated period. An illustration of the above would be as follow:- Capital return = NAV per Unit end / NAV per Unit begin – 1 Income return = Income distribution per Unit / NAV per Unit ex-date Total return = (1+Capital return) x (1+Income return) – 1
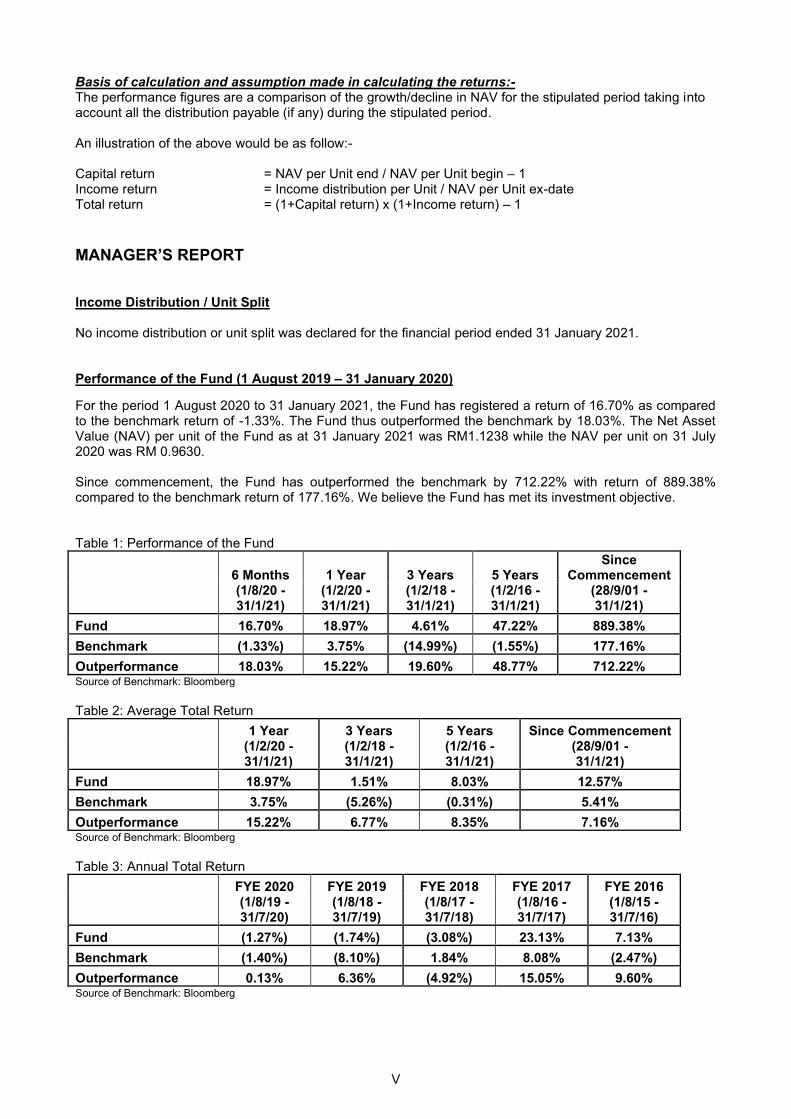
MANAGER’S REPORT Income Distribution / Unit Split No income distribution or unit split was declared for the financial period ended 31 January 2021. Performance of the Fund (1 August 2019 – 31 January 2020) For the period 1 August 2020 to 31 January 2021, the Fund has registered a return of 16.70% as compared to the benchmark return of -1.33%. The Fund thus outperformed the benchmark by 18.03%. The Net Asset Value (NAV) per unit of the Fund as at 31 January 2021 was RM1.1238 while the NAV per unit on 31 July 2020 was RM 0.9630. Since commencement, the Fund has outperformed the benchmark by 712.22% with return of 889.38% compared to the benchmark return of 177.16%. We believe the Fund has met its investment objective. Table 1: Performance of the Fund
6 Months 1 Year 3 Years 5 Years Since
Commencement
(1/8/20 - 31/1/21)
(1/2/20 - 31/1/21)
(1/2/18 - 31/1/21)
(1/2/16 - 31/1/21)
(28/9/01 - 31/1/21)
Fund 16.70% 18.97% 4.61% 47.22% 889.38%
Benchmark (1.33%) 3.75% (14.99%) (1.55%) 177.16%
Outperformance 18.03% 15.22% 19.60% 48.77% 712.22% Source of Benchmark: Bloomberg
Table 2: Average Total Return
1 Year 3 Years 5 Years Since Commencement
(1/2/20 - 31/1/21)
(1/2/18 - 31/1/21)
(1/2/16 - 31/1/21)
(28/9/01 - 31/1/21)
Fund 18.97% 1.51% 8.03% 12.57%
Benchmark 3.75% (5.26%) (0.31%) 5.41%
Outperformance 15.22% 6.77% 8.35% 7.16% Source of Benchmark: Bloomberg
Table 3: Annual Total Return
FYE 2020 FYE 2019 FYE 2018 FYE 2017 FYE 2016
(1/8/19 - 31/7/20)
(1/8/18 - 31/7/19)
(1/8/17 - 31/7/18)
(1/8/16 - 31/7/17)
(1/8/15 - 31/7/16)
Fund (1.27%) (1.74%) (3.08%) 23.13% 7.13%
Benchmark (1.40%) (8.10%) 1.84% 8.08% (2.47%)
Outperformance 0.13% 6.36% (4.92%) 15.05% 9.60% Source of Benchmark: Bloomberg
VI
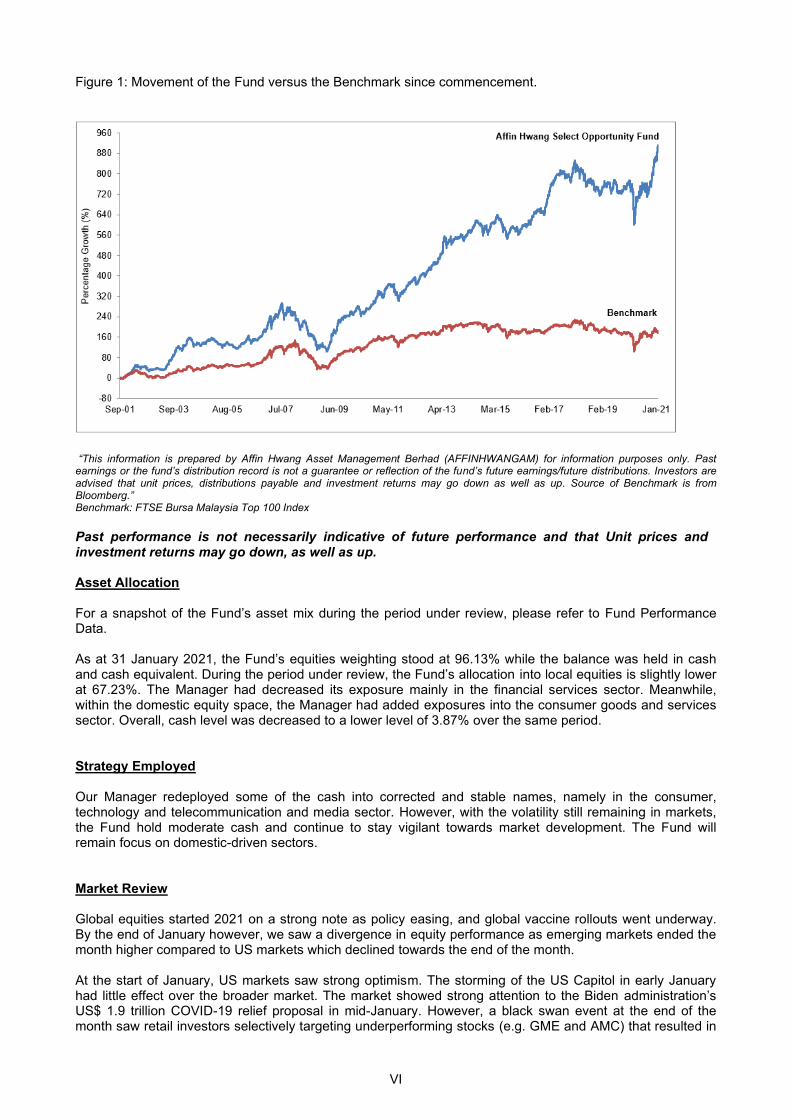
Figure 1: Movement of the Fund versus the Benchmark since commencement.
“This information is prepared by Affin Hwang Asset Management Berhad (AFFINHWANGAM) for information purposes only. Past earnings or the fund’s distribution record is not a guarantee or reflection of the fund’s future earnings/future distributions. Investors are advised that unit prices, distributions payable and investment returns may go down as well as up. Source of Benchmark is from Bloomberg.” Benchmark: FTSE Bursa Malaysia Top 100 Index
Past performance is not necessarily indicative of future performance and that Unit prices and investment returns may go down, as well as up. Asset Allocation For a snapshot of the Fund’s asset mix during the period under review, please refer to Fund Performance Data. As at 31 January 2021, the Fund’s equities weighting stood at 96.13% while the balance was held in cash and cash equivalent. During the period under review, the Fund’s allocation into local equities is slightly lower at 67.23%. The Manager had decreased its exposure mainly in the financial services sector. Meanwhile, within the domestic equity space, the Manager had added exposures into the consumer goods and services sector. Overall, cash level was decreased to a lower level of 3.87% over the same period. Strategy Employed Our Manager redeployed some of the cash into corrected and stable names, namely in the consumer, technology and telecommunication and media sector. However, with the volatility still remaining in markets, the Fund hold moderate cash and continue to stay vigilant towards market development. The Fund will remain focus on domestic-driven sectors. Market Review Global equities started 2021 on a strong note as policy easing, and global vaccine rollouts went underway. By the end of January however, we saw a divergence in equity performance as emerging markets ended the month higher compared to US markets which declined towards the end of the month. At the start of January, US markets saw strong optimism. The storming of the US Capitol in early January had little effect over the broader market. The market showed strong attention to the Biden administration’s US$ 1.9 trillion COVID-19 relief proposal in mid-January. However, a black swan event at the end of the month saw retail investors selectively targeting underperforming stocks (e.g. GME and AMC) that resulted in
VII
a short squeeze and pushing their share prices to new highs. This led to market jitters resulting in the S&P 500 closing 0.63% lower. Asian markets fared better, as the MSCI Asia ex-Japan index was up 4.48% in the month, largely ignoring the US retail frenzy and focusing instead on the region’s improving economic conditions and gradual recovery, stemming from better pandemic controls. Tensions between China and the US remain icy as Biden settles into the White House to handle domestic affairs and China moved forward to impose sanctions on Mike Pompeo and 27 other former officials who worked for the Trump administration. Commodities saw strong returns in the month, buoyed by vaccination programs and normalization of the economy. The commodity market saw four consecutive weeks of increased market inflow, particularly across crude oil, grain & oilseed and livestock markets. With rallying commodity prices, talks about a commodity super cycle in 2021 have surfaced, stemming from increased Chinese demand and supportive stimulus boosting inflation expectations. Malaysia Budget 2021 was announced in November, with an allocated RM 322.5 billion expenditure, with 26.5% of it coming from borrowings and use of government assets. 5.3% of this budget has been devoted to the Covid-19 fund. The KLCI ended 2020 with a 2.4% gain, buoyed by the liquidity-driven rally that was seen throughout the year. Following from 2020’s political overhang, Malaysia’s Yang di-Pertuan Agong issued a Proclamation of Emergency, resulting in the implementation of MCO 2.0 as daily Covid-19 cases rose to four digits. Restrictions on movement were less stringent than the initial MCO from 2020, though inconsistent communication surrounding the restrictions resulted in some public confusion. The PN government unveiled its fifth economic stimulus package, PERMAI, worth RM 15 billion. Market impact was neutral following the announcement, as the package was viewed largely as a safety net aimed at cushioning the downside impact of MCO 2.0’s implementation, especially to more vulnerable sectors. Malaysia’s latest Consumer Price Index (CPI) came in at -1.4%. Despite this, trade numbers have been gradually increasing as global trade picks up. December 2020 saw Malaysia’s exports rise 10.8% y-o-y and imports rebounding for the first time in 9 months by 1.6% y-o-y. The Malaysian bond market saw an unwinding of “rate cut” bets at the end of January following BNM’s announcement to keep interest rates unchanged at 1.75% highlighting that recovery of the local economy was underway. The shorter-end of the MGS curve saw yields rise whilst longer-tenured papers remained resilient. Market is of the expectation that central bank will cut rates in BNM’s next meeting in March, but our in-house view views that the likelihood of a cut has decreased. The primary market continues to see strong interest despite a strong supply outlook, with the auction of a 10-year MGS at a size of RM 4 billion that was 2.0x covered. Corporate issuances were slow in the month, up till the final week which saw Pengurusan Air SPB Berhad raise RM 8000 million across two Sukuk tranches of 7 and 15 years at 3.02% and 3.90% respectively. Both rated AAA. The corporate space is expected to pick up in the following months. Investment Outlook Global markets have rallied sharply from their lowest, supported by fiscal and monetary stimulus. The economy is still recovering, albeit at a slow pace, as consumers’ confidence return following the low death rates despite the rise in infections. With most markets recovering the year’s losses by December coincided with the release of Phase III clinical trial data for the vaccines, there is certainly light at the end of the tunnel for global markets. Recovery plays will be the most obvious theme for the year improving macroeconomic conditions and the inevitable rollout of vaccines has everyone looking to the future and letting go of 2020’s miseries. General market consensus suggests global GDP is down 5% in 2020, with an expected rebound of 5.4% in 2021 with the reopening of economies and growth returns. January 2021’s US employment report was less than stellar as nonfarm payrolls increased only by half of the market’s initial consensus, which is worse when compared to the fact that it had already been revised down by 159,000 two months prior. The US labor market has some ways to go for recovery as Covid-19 cases continue to rise. Valuations in the American market are coming across as stretched as the S&P 500

VIII
surpasses far beyond its historical P/E average of 15x -17x. It would not be far fetched to assume that correction will take place very soon. Earnings momentum will continue in 2021 with earnings growth projected to rise by 38.0% in Asia ex-Japan (ex-Financials) according to estimates by some sell-side analysts. Key sectors leading the recovery include the energy, consumer discretionary and industrials. Though, this is tempered by moderately higher valuations which has creeped up above historical averages .Liquidity conditions remain positive and with earnings visibility from Asian companies that are riding along a China-led economic recovery, Asia continues to be an ocean of growth potential as the region continues to grow. Lack of communication between US and China will only prolong market instability. We expect dialogue to resume shortly but given Biden is taking a more assertive stance, markets will remain largely sensitive to any indication of deteriorating relations. Both countries will have to be pragmatic in their approach as cooler heads prevail. Economic recovery continues to be delayed by Covid-19 as cases surge throughout the country/ From a bottom-up perspective, the domestic focus will be on the recovery beneficiaries and exporters in the technology and EMS segment which have strong earnings visibility in the near term as well increasing demand. Political risk has been delayed with the declaration of state of emergency until August 2021 Fund flows continue to pour in, following 2020’s trend which began in the month of March. In the US. long-term mutual funds and exchange-traded funds picked up US$95 billion in new assets. ESG funds have also been gathering plenty of interest and we will expect this investor shift to ESG-focused funds to be more commonplace across the industry. State of Affairs of the Fund There is neither any significant change to the state affairs of the Fund nor any circumstances that materially affect any interests of the unit holders during the period under review. Soft Commissions received from Brokers As per the requirements of the Securities Commission’s Guidelines on Unit Trust Funds and Guidelines on Compliance Function for Fund Management Companies, soft commissions received from brokers/dealers may be retained by the management company only if the :– (i) goods and services provided are of demonstrable benefit to Unit holders of the Fund; and (ii) goods and services are in the form of research and advisory services that assists in the decision making process. During the financial period under review, the management company had received on behalf of the Fund, soft commissions in the form of research materials, data and quotation services, investment-related publications, market data feed and industry benchmarking agencies which are of demonstrable benefit to Unitholders of the Fund.
Cross Trade No cross trade transactions have been carried out during the reported period.

IX
TRUSTEE’S REPORT TO THE UNITHOLDERS OF AFFIN HWANG SELECT OPPORTUNITY FUND We have acted as Trustee of Affin Hwang Select Opportunity Fund (“the Fund”) for the financial period ended 31 January 2021. To the best of our knowledge, Affin Hwang Asset Management Berhad (“the Management Company”), has operated and managed the Fund in accordance with the following:- a) limitations imposed on the investment powers of the Management Company and the Trustee under the
Deeds, the Securities Commission’s Guidelines on Unit Trust Funds, the Capital Markets and Services Act 2007, and other applicable laws;
b) valuation/pricing is carried out in accordance with the Deeds and any regulatory requirements; and
c) creation and cancellation of units are carried out in accordance with the Deeds and any regulatory
requirements. For HSBC (Malaysia) Trustee Berhad Tan Bee Nie Senior Manager, Investment Compliance Monitoring Kuala Lumpur 15 March 2021

AFFIN HWANG SELECT OPPORTUNITY FUND UNAUDITED INTERIM FINANCIAL STATEMENTS FOR THE 6 MONTHS FINANCIAL PERIOD ENDED 31 JANUARY 2021
3
AFFIN HWANG SELECT OPPORTUNITY FUND UNAUDITED INTERIM FINANCIAL STATEMENTS FOR THE 6 MONTHS FINANCIAL PERIOD ENDED 31 JANUARY 2021 CONTENTS PAGE(S) UNAUDITED INTERIM STATEMENT OF COMPREHENSIVE INCOME 1 UNAUDITED INTERIM STATEMENT OF FINANCIAL POSITION 2 UNAUDITED INTERIM STATEMENT OF CHANGES IN EQUITY 3 UNAUDITED INTERIM STATEMENT OF CASH FLOWS 4 SUMMARY OF SIGNIFICANT ACCOUNTING POLICIES 5 - 10 NOTES TO THE UNAUDITED INTERIM FINANCIAL STATEMENTS 11 - 35 STATEMENT BY THE MANAGER 36
1
AFFIN HWANG SELECT OPPORTUNITY FUND
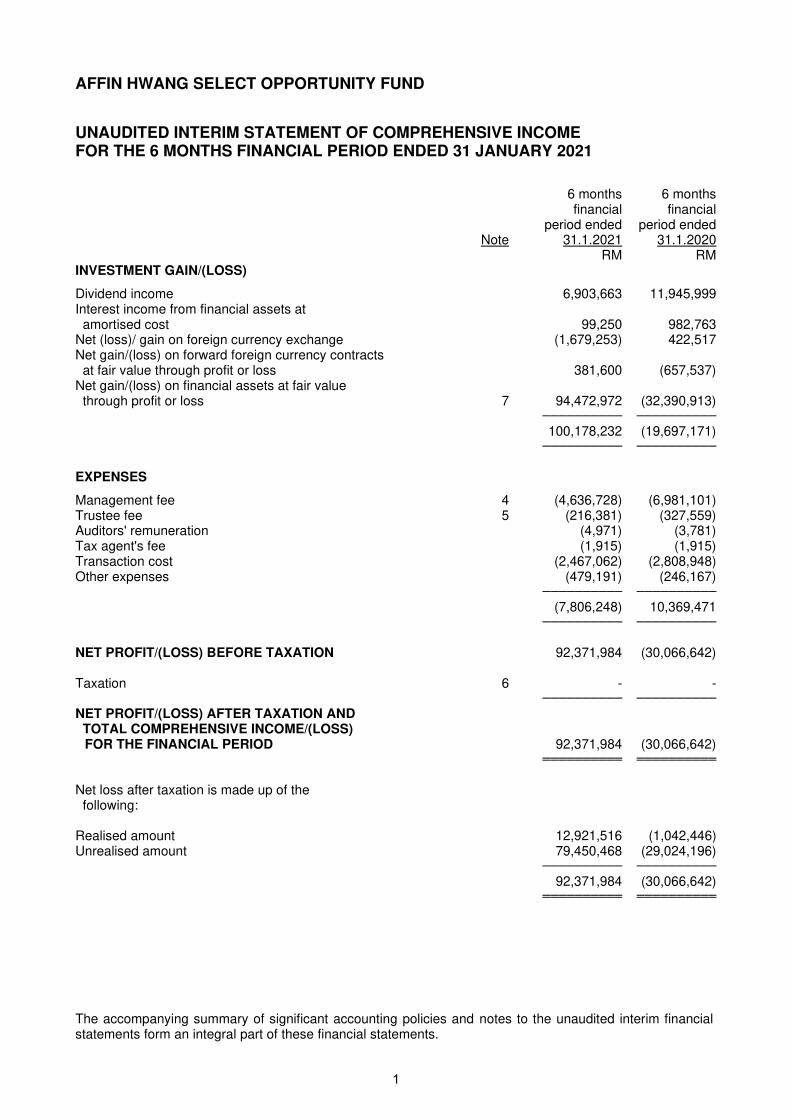
UNAUDITED INTERIM STATEMENT OF COMPREHENSIVE INCOME FOR THE 6 MONTHS FINANCIAL PERIOD ENDED 31 JANUARY 2021
6 months 6 months financial financial period ended period ended Note 31.1.2021 31.1.2020 RM RM INVESTMENT GAIN/(LOSS)
Dividend income 6,903,663 11,945,999 Interest income from financial assets at amortised cost 99,250 982,763 Net (loss)/ gain on foreign currency exchange (1,679,253) 422,517 Net gain/(loss) on forward foreign currency contracts at fair value through profit or loss 381,600 (657,537) Net gain/(loss) on financial assets at fair value through profit or loss 7 94,472,972 (32,390,913) ────────── ──────────
100,178,232 (19,697,171) ────────── ──────────
EXPENSES
Management fee 4 (4,636,728) (6,981,101) Trustee fee 5 (216,381) (327,559) Auditors' remuneration (4,971) (3,781) Tax agent's fee (1,915) (1,915) Transaction cost (2,467,062) (2,808,948) Other expenses (479,191) (246,167) ────────── ──────────
(7,806,248) 10,369,471 ────────── ──────────
NET PROFIT/(LOSS) BEFORE TAXATION 92,371,984 (30,066,642) Taxation 6 - - ────────── ──────────
NET PROFIT/(LOSS) AFTER TAXATION AND TOTAL COMPREHENSIVE INCOME/(LOSS)
FOR THE FINANCIAL PERIOD 92,371,984 (30,066,642) ══════════ ══════════
Net loss after taxation is made up of the following: Realised amount 12,921,516 (1,042,446) Unrealised amount 79,450,468 (29,024,196) ────────── ──────────
92,371,984 (30,066,642) ══════════ ══════════
The accompanying summary of significant accounting policies and notes to the unaudited interim financial statements form an integral part of these financial statements.
2
AFFIN HWANG SELECT OPPORTUNITY FUND
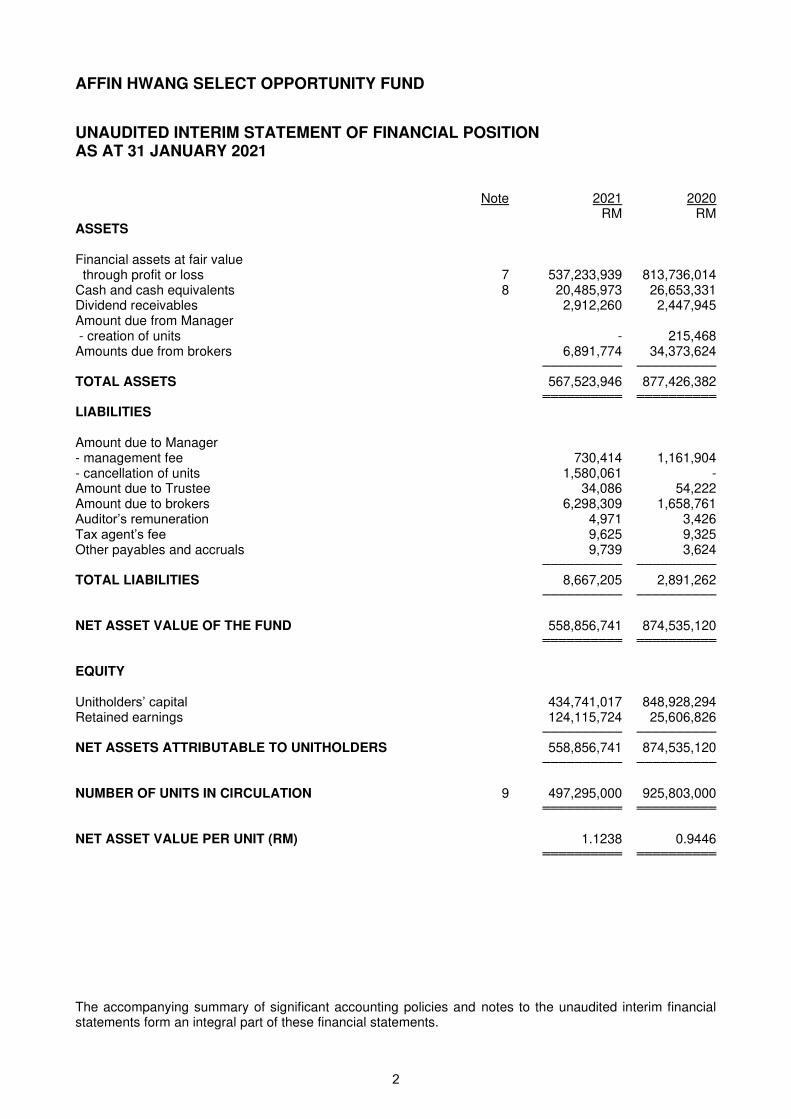
UNAUDITED INTERIM STATEMENT OF FINANCIAL POSITION AS AT 31 JANUARY 2021 Note 2021 2020 RM RM ASSETS Financial assets at fair value through profit or loss 7 537,233,939 813,736,014 Cash and cash equivalents 8 20,485,973 26,653,331 Dividend receivables 2,912,260 2,447,945 Amount due from Manager - creation of units - 215,468 Amounts due from brokers 6,891,774 34,373,624 ────────── ──────────
TOTAL ASSETS 567,523,946 877,426,382 ══════════ ══════════
LIABILITIES Amount due to Manager - management fee 730,414 1,161,904 - cancellation of units 1,580,061 - Amount due to Trustee 34,086 54,222 Amount due to brokers 6,298,309 1,658,761 Auditor’s remuneration 4,971 3,426 Tax agent’s fee 9,625 9,325 Other payables and accruals 9,739 3,624 ────────── ──────────
TOTAL LIABILITIES 8,667,205 2,891,262 ────────── ──────────
NET ASSET VALUE OF THE FUND 558,856,741 874,535,120 ══════════ ══════════
EQUITY Unitholders’ capital 434,741,017 848,928,294 Retained earnings 124,115,724 25,606,826 ────────── ──────────
NET ASSETS ATTRIBUTABLE TO UNITHOLDERS 558,856,741 874,535,120 ────────── ──────────
NUMBER OF UNITS IN CIRCULATION 9 497,295,000 925,803,000 ══════════ ══════════
NET ASSET VALUE PER UNIT (RM) 1.1238 0.9446 ══════════ ══════════
The accompanying summary of significant accounting policies and notes to the unaudited interim financial statements form an integral part of these financial statements.
3
AFFIN HWANG SELECT OPPORTUNITY FUND
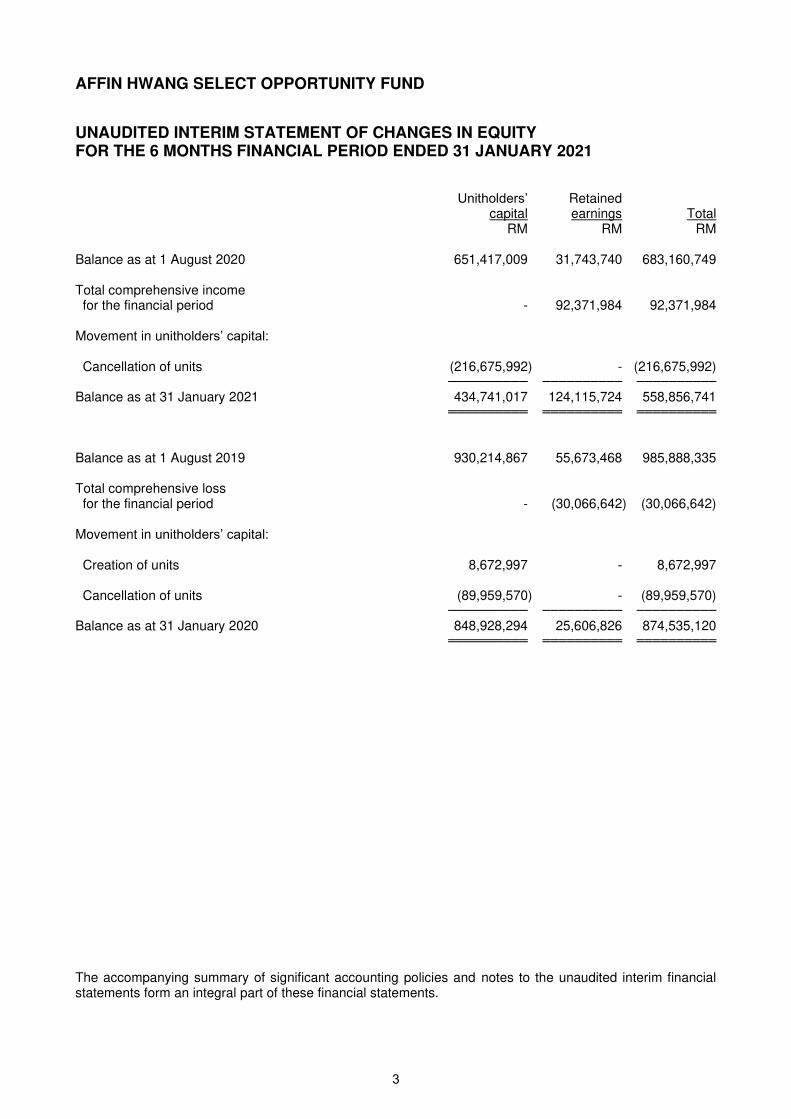
UNAUDITED INTERIM STATEMENT OF CHANGES IN EQUITY FOR THE 6 MONTHS FINANCIAL PERIOD ENDED 31 JANUARY 2021 Unitholders’ Retained capital earnings Total RM RM RM Balance as at 1 August 2020 651,417,009 31,743,740 683,160,749 Total comprehensive income for the financial period - 92,371,984 92,371,984 Movement in unitholders’ capital: Cancellation of units (216,675,992) - (216,675,992) ────────── ────────── ──────────
Balance as at 31 January 2021 434,741,017 124,115,724 558,856,741 ══════════ ══════════ ══════════
Balance as at 1 August 2019 930,214,867 55,673,468 985,888,335 Total comprehensive loss for the financial period - (30,066,642) (30,066,642) Movement in unitholders’ capital: Creation of units 8,672,997 - 8,672,997 Cancellation of units (89,959,570) - (89,959,570) ────────── ────────── ──────────
Balance as at 31 January 2020 848,928,294 25,606,826 874,535,120 ══════════ ══════════ ══════════
The accompanying summary of significant accounting policies and notes to the unaudited interim financial statements form an integral part of these financial statements.
4
AFFIN HWANG SELECT OPPORTUNITY FUND
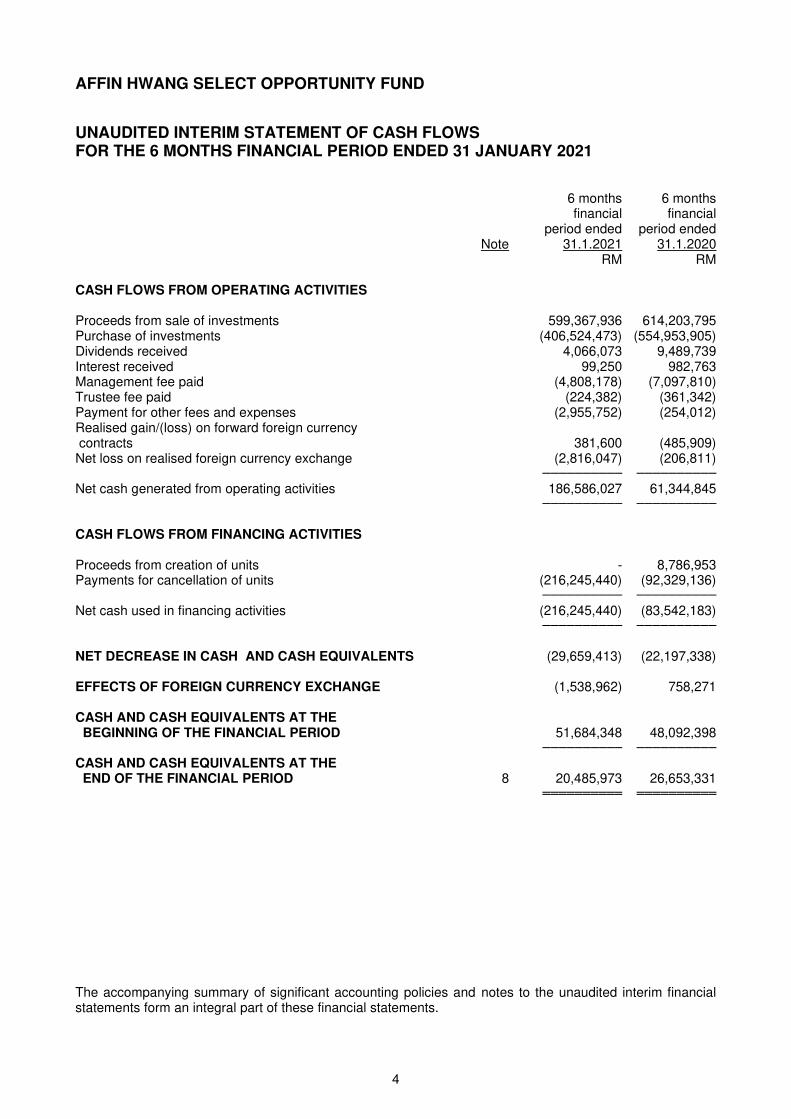
UNAUDITED INTERIM STATEMENT OF CASH FLOWS FOR THE 6 MONTHS FINANCIAL PERIOD ENDED 31 JANUARY 2021 6 months 6 months financial financial period ended period ended Note 31.1.2021 31.1.2020 RM RM CASH FLOWS FROM OPERATING ACTIVITIES Proceeds from sale of investments 599,367,936 614,203,795 Purchase of investments (406,524,473) (554,953,905) Dividends received 4,066,073 9,489,739 Interest received 99,250 982,763 Management fee paid (4,808,178) (7,097,810) Trustee fee paid (224,382) (361,342) Payment for other fees and expenses (2,955,752) (254,012) Realised gain/(loss) on forward foreign currency contracts 381,600 (485,909) Net loss on realised foreign currency exchange (2,816,047) (206,811) ────────── ──────────
Net cash generated from operating activities 186,586,027 61,344,845 ────────── ──────────
CASH FLOWS FROM FINANCING ACTIVITIES Proceeds from creation of units - 8,786,953 Payments for cancellation of units (216,245,440) (92,329,136) ────────── ──────────
Net cash used in financing activities (216,245,440) (83,542,183) ────────── ──────────
NET DECREASE IN CASH AND CASH EQUIVALENTS (29,659,413) (22,197,338) EFFECTS OF FOREIGN CURRENCY EXCHANGE (1,538,962) 758,271 CASH AND CASH EQUIVALENTS AT THE BEGINNING OF THE FINANCIAL PERIOD 51,684,348 48,092,398 ────────── ──────────
CASH AND CASH EQUIVALENTS AT THE END OF THE FINANCIAL PERIOD 8 20,485,973 26,653,331 ══════════ ══════════
The accompanying summary of significant accounting policies and notes to the unaudited interim financial statements form an integral part of these financial statements.

5
AFFIN HWANG SELECT OPPORTUNITY FUND
SUMMARY OF SIGNIFICANT ACCOUNTING POLICIES FOR THE 6 MONTHS FINANCIAL PERIOD ENDED 31 JANUARY 2021 The following accounting policies have been used in dealing with items which are considered material in relation to the financial statements.
A BASIS OF PREPARATION OF THE FINANCIAL STATEMENTS
The financial statements have been prepared under the historical cost convention, except as disclosed in the
summary of significant accounting policies and comply with Malaysian Financial Reporting Standards
(“MFRS”), International Financial Reporting Standards (“IFRS”). The preparation of financial statements in conformity with MFRS and IFRS requires the use of certain critical accounting estimates and assumptions that affect the reported amounts of assets and liabilities and disclosure of contingent assets and liabilities at the date of the financial statements, and the reported amounts of revenues and expenses during the reported financial period. It also requires the Manager to exercise their judgment in the process of applying the Fund’s accounting policies. Although these estimates and judgment are based on the Manager’s best knowledge of current events and actions, actual results may differ. The areas involving a higher degree of judgment or complexity, or areas where assumptions and estimates are significant to the financial statements are disclosed in Note K. (a) Standards, amendments to published standards and interpretations that are effective
• The Conceptual Framework for Financial Reporting (Revised 2018) • Amendments to MFRS 101 and MFRS 108 ‘Definition of Material’
The adoption of the above standards, amendments to standards or interpretations did not have a material effect on the financial statements of the Fund.
(b) Standards and amendments that have been issued but not yet effective
• Amendments to MFRS 3 ‘Reference to Conceptual Framework’ (effective 1 January 2022) replace the reference to Framework for Preparation and Presentation of Financial Statements with 2018 Conceptual Framework.
• Annual Improvements to MFRSs 2018 – 2020 Cycle (effective for annual periods beginning on or after 1 January 2022).
• Amendments to MFRS 137 ‘onerous contracts—cost of fulfilling a contract’ (effective 1 January 2022) clarify that direct costs of fulfilling a contract include both the incremental cost of fulfilling the contract as well as an allocation of other costs directly related to fulfilling contracts.
• Amendments to MFRS 101 ‘Classification of liabilities as current or non-current (effective 1 January 2023) clarify that a liability is classified as non-current if an entity has a substantive right at the end of the reporting period to defer settlement for at least 12 months after the reporting period.
A liability is classified as current if a condition is breached at or before the reporting date and a waiver is obtained after the reporting date.
The adoption of the above standards, amendments to standards or interpretations is not expected to have a material effect on the financial statements of the Fund.
B INCOME RECOGNITION Interest income Interest income from short term deposits with licensed financial institutions are recognised based on effective interest rate method on an accruals basis.
6
AFFIN HWANG SELECT OPPORTUNITY FUND
SUMMARY OF SIGNIFICANT ACCOUNTING POLICIES FOR THE 6 MONTHS FINANCIAL PERIOD ENDED 31 JANUARY 2021 (CONTINUED)
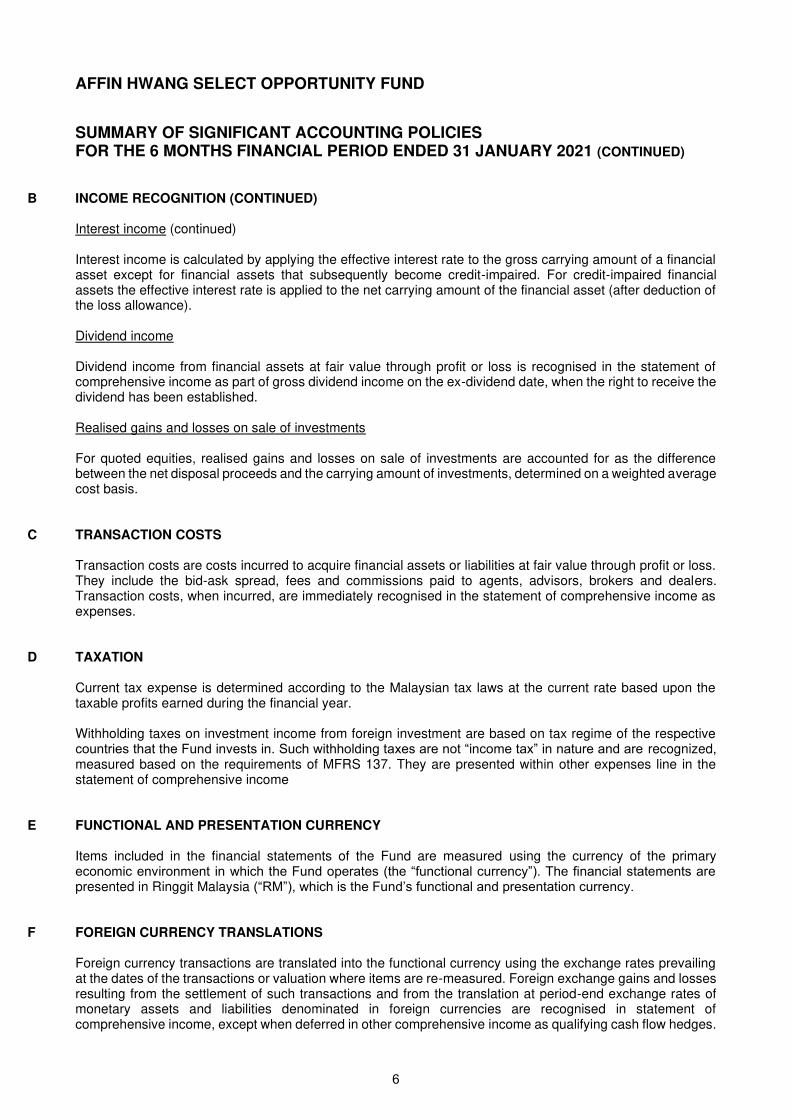
B INCOME RECOGNITION (CONTINUED) Interest income (continued) Interest income is calculated by applying the effective interest rate to the gross carrying amount of a financial asset except for financial assets that subsequently become credit-impaired. For credit-impaired financial assets the effective interest rate is applied to the net carrying amount of the financial asset (after deduction of the loss allowance). Dividend income Dividend income from financial assets at fair value through profit or loss is recognised in the statement of comprehensive income as part of gross dividend income on the ex-dividend date, when the right to receive the dividend has been established. Realised gains and losses on sale of investments For quoted equities, realised gains and losses on sale of investments are accounted for as the difference between the net disposal proceeds and the carrying amount of investments, determined on a weighted average cost basis.
C TRANSACTION COSTS Transaction costs are costs incurred to acquire financial assets or liabilities at fair value through profit or loss. They include the bid-ask spread, fees and commissions paid to agents, advisors, brokers and dealers. Transaction costs, when incurred, are immediately recognised in the statement of comprehensive income as expenses.
D TAXATION Current tax expense is determined according to the Malaysian tax laws at the current rate based upon the taxable profits earned during the financial year. Withholding taxes on investment income from foreign investment are based on tax regime of the respective countries that the Fund invests in. Such withholding taxes are not “income tax” in nature and are recognized, measured based on the requirements of MFRS 137. They are presented within other expenses line in the statement of comprehensive income
E FUNCTIONAL AND PRESENTATION CURRENCY Items included in the financial statements of the Fund are measured using the currency of the primary economic environment in which the Fund operates (the “functional currency”). The financial statements are presented in Ringgit Malaysia (“RM”), which is the Fund’s functional and presentation currency.
F FOREIGN CURRENCY TRANSLATIONS Foreign currency transactions are translated into the functional currency using the exchange rates prevailing at the dates of the transactions or valuation where items are re-measured. Foreign exchange gains and losses resulting from the settlement of such transactions and from the translation at period-end exchange rates of monetary assets and liabilities denominated in foreign currencies are recognised in statement of comprehensive income, except when deferred in other comprehensive income as qualifying cash flow hedges.

7
AFFIN HWANG SELECT OPPORTUNITY FUND
SUMMARY OF SIGNIFICANT ACCOUNTING POLICIES FOR THE 6 MONTHS FINANCIAL PERIOD ENDED 31 JANUARY 2021 (CONTINUED)
G FINANCIAL ASSETS AND FINANCIAL LIABILITIES (i) Classification
The Fund classifies its financial assets in the following measurement categories: • those to be measured at fair value through profit or loss, and • those to be measured at amortised cost The Fund classifies its investments based on both the Fund’s business model for managing those financial assets and the contractual cash flow characteristics of the financial assets. The portfolio of financial assets is managed and performance is evaluated on a fair value basis. The Fund is primarily focused on fair value information and uses that information to assess the assets’ performance and to make decisions. The Fund has not taken the option to irrevocably designate any equity securities as fair value through other comprehensive income. The contractual cash flows of the Fund’s debt securities are solely principal and interest, however, these securities are neither held for the purpose of collecting contractual cash flows nor held both for collecting contractual cash flows and for sale. The collection of contractual cash flows is only incidental to achieving the Fund’s business model’s objective. Consequently, all investments are measured at fair value through profit or loss The Fund classifies cash and cash equivalents, amount due from Manager, amount due from brokers and dividend receivable as financial assets at amortised cost as these financial assets are held to collect contractual cash flows consisting of the amount outstanding. The Fund classifies amount due to Manager, amount due to Trustee, amount due to brokers, auditors’ remuneration, tax agent’s fee and other payables and accruals as financial liabilities measured at amortised cost.
(ii) Recognition and measurement Regular purchases and sales of financial assets are recognised on the trade-date – the date on which the Fund commits to purchase or sell the asset. Investments are initially recognised at fair value. Transaction costs are expensed in the statement of comprehensive income. Financial liabilities, within the scope of MFRS 9, are recognised in the statement of financial position when, and only when, the Fund becomes a party to the contractual provisions of the financial instrument. Financial assets are derecognised when the rights to receive cash flows from the investments have expired or have been transferred and the Fund has transferred substantially all risks and rewards of ownership. Financial liabilities are derecognised when it is extinguished, i.e. when the obligation specified in the contract is discharged or cancelled or expired. Gains or losses arising from changes in the fair value of the ‘financial assets at fair value through profit or loss’ category including the effects of foreign transactions are presented in the statement of comprehensive income within ‘net gain/(loss) on financial assets at fair value through profit or loss’ in the year which they arise.

8
AFFIN HWANG SELECT OPPORTUNITY FUND
SUMMARY OF SIGNIFICANT ACCOUNTING POLICIES FOR THE 6 MONTHS FINANCIAL PERIOD ENDED 31 JANUARY 2021 (CONTINUED)
G FINANCIAL ASSETS AND FINANCIAL LIABILITIES (CONTINUED)
(ii) Recognition and measurement (continued) If a valuation based on the market price does not represent the fair value of the securities, for example during abnormal market conditions or when no market price is available, including in the event of a suspension in the quotation of the securities for a period exceeding 14 days, or such shorter period as agreed by the Trustee, then the securities are valued as determined in good faith by the Manager, based on the methods or basis approved by the Trustee after appropriate technical consultation Financial assets at amortised cost and other financial liabilities are subsequently carried at amortised cost using the effective interest method.
(iii) Impairment The Fund measures credit risk and expected credit losses using probability of default, exposure at default and loss given default. Management consider both historical analysis and forward looking information in determining any expected credit loss. Management consider the probability of default to be close to zero as these instruments have a low risk of default and the counterparties have a strong capacity to meet their contractual obligations in the near term. As a result, no loss allowance has been recognised based on 12 month expected credit losses as any such impairment would be wholly insignificant to the Fund. Significant increase in credit risk A significant increase in credit risk is defined by management as any contractual payment which is more than 30 days past due. Definition of default and credit-impaired financial assets The Fund defines a financial instrument as default, which is fully aligned with the definition of credit-impaired, when it meets one or more of the following criteria: Quantitative criteria: Any contractual payment which is more than 90 days past due is considered credit impaired. Qualitative criteria: The debtor meets unlikeliness to pay criteria, which indicates the debtor is in significant financial difficulty. The Fund considers the following instances: • the debtor is in breach of financial covenants • concessions have been made by the lender relating to the debtor’s financial difficulty • it is becoming probable that the debtor will enter bankruptcy or other financial reorganisation • the debtor is insolvent Financial instruments that are credit-impaired are assessed on individual basis.
9
AFFIN HWANG SELECT OPPORTUNITY FUND
SUMMARY OF SIGNIFICANT ACCOUNTING POLICIES FOR THE 6 MONTHS FINANCIAL PERIOD ENDED 31 JANUARY 2020 (CONTINUED)
G FINANCIAL ASSETS AND FINANCIAL LIABILITIES (CONTINUED)
(iii) Impairment (continued)
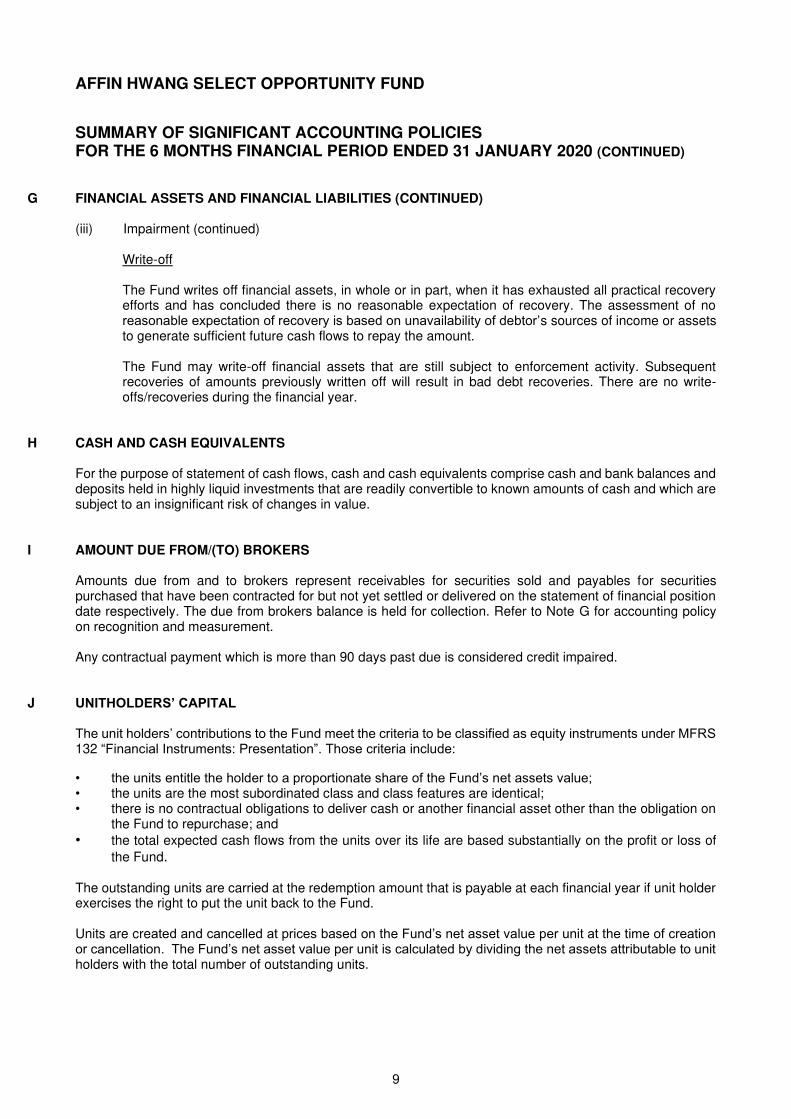
Write-off The Fund writes off financial assets, in whole or in part, when it has exhausted all practical recovery efforts and has concluded there is no reasonable expectation of recovery. The assessment of no reasonable expectation of recovery is based on unavailability of debtor’s sources of income or assets to generate sufficient future cash flows to repay the amount. The Fund may write-off financial assets that are still subject to enforcement activity. Subsequent recoveries of amounts previously written off will result in bad debt recoveries. There are no write-offs/recoveries during the financial year.
H CASH AND CASH EQUIVALENTS For the purpose of statement of cash flows, cash and cash equivalents comprise cash and bank balances and deposits held in highly liquid investments that are readily convertible to known amounts of cash and which are subject to an insignificant risk of changes in value.
I AMOUNT DUE FROM/(TO) BROKERS Amounts due from and to brokers represent receivables for securities sold and payables for securities purchased that have been contracted for but not yet settled or delivered on the statement of financial position date respectively. The due from brokers balance is held for collection. Refer to Note G for accounting policy on recognition and measurement. Any contractual payment which is more than 90 days past due is considered credit impaired.
J UNITHOLDERS’ CAPITAL The unit holders’ contributions to the Fund meet the criteria to be classified as equity instruments under MFRS 132 “Financial Instruments: Presentation”. Those criteria include:
• the units entitle the holder to a proportionate share of the Fund’s net assets value; • the units are the most subordinated class and class features are identical; • there is no contractual obligations to deliver cash or another financial asset other than the obligation on
the Fund to repurchase; and
• the total expected cash flows from the units over its life are based substantially on the profit or loss of
the Fund. The outstanding units are carried at the redemption amount that is payable at each financial year if unit holder exercises the right to put the unit back to the Fund. Units are created and cancelled at prices based on the Fund’s net asset value per unit at the time of creation or cancellation. The Fund’s net asset value per unit is calculated by dividing the net assets attributable to unit holders with the total number of outstanding units.

10
AFFIN HWANG SELECT OPPORTUNITY FUND
SUMMARY OF SIGNIFICANT ACCOUNTING POLICIES FOR THE 6 MONTHS FINANCIAL PERIOD ENDED 31 JANUARY 2021 (CONTINUED)
K CRITICAL ACCOUNTING ESTIMATES AND JUDGMENTS IN APPLYING ACCOUNTING POLICIES The Fund makes estimates and assumptions concerning the future. The resulting accounting estimates will, by definition, rarely equal the related actual results. To enhance the information contents on the estimates, certain key variables that are anticipated to have material impacts to the Fund’s results and financial position are tested for sensitivity to changes in the underlying parameters. Estimates and judgments are continually evaluated by the Manager and are based on historical experience and other factors, including expectations of future events that are believed to be reasonable under the circumstances. However, the Manager is of the opinion that there are no accounting policies which require significant judgement to be exercised. In undertaking any of the Fund’s investment, the Manager will ensure that all assets of the Fund under management will be valued appropriately, that is at fair value and in compliance with the SC Guidelines on Unit Trust Funds.
L REALISED AND UNREALISED PORTIONS OF PROFIT OR LOSS AFTER TAX The analysis of realised and unrealised profit or loss after tax as presented on the statement of comprehensive income is prepared in accordance with SC’s Guidelines on Unit Trust Funds.
11
AFFIN HWANG SELECT OPPORTUNITY FUND
NOTES TO THE UNAUDITED INTERIM FINANCIAL STATEMENTS FOR THE 6 MONTHS FINANCIAL PERIOD ENDED 31 JANUARY 2021
1 INFORMATION ON THE FUND
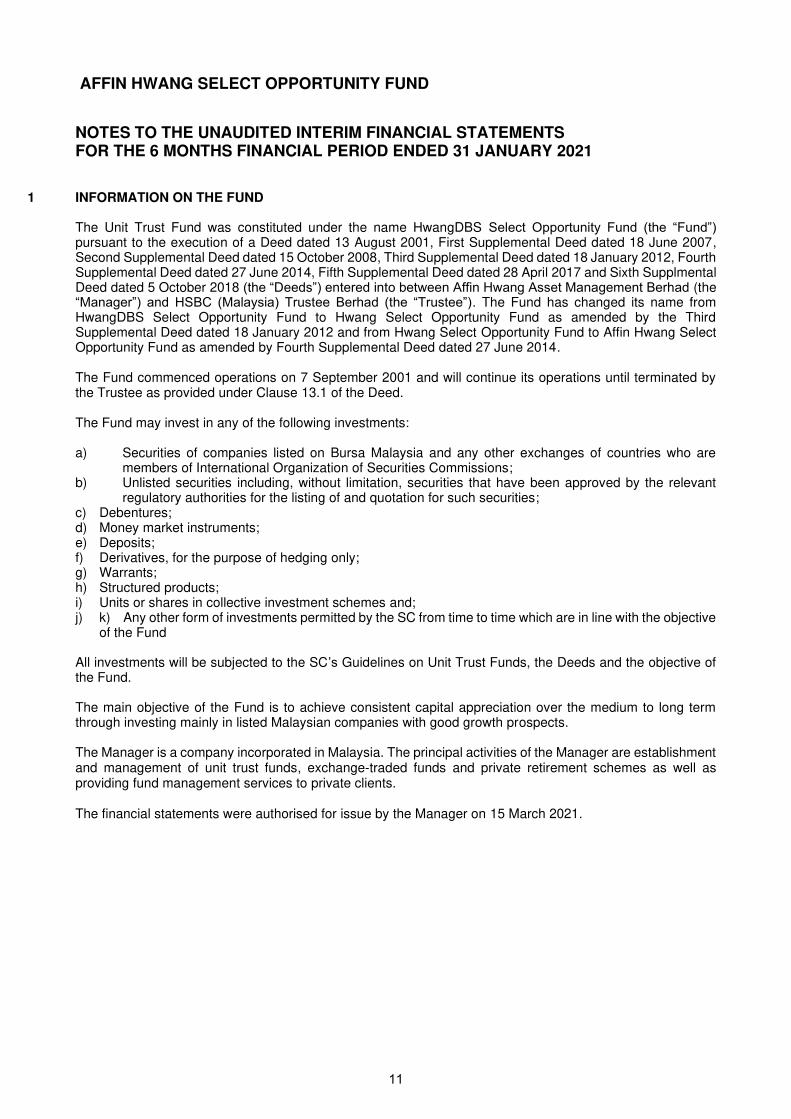
The Unit Trust Fund was constituted under the name HwangDBS Select Opportunity Fund (the “Fund”) pursuant to the execution of a Deed dated 13 August 2001, First Supplemental Deed dated 18 June 2007, Second Supplemental Deed dated 15 October 2008, Third Supplemental Deed dated 18 January 2012, Fourth Supplemental Deed dated 27 June 2014, Fifth Supplemental Deed dated 28 April 2017 and Sixth Supplmental Deed dated 5 October 2018 (the “Deeds”) entered into between Affin Hwang Asset Management Berhad (the “Manager”) and HSBC (Malaysia) Trustee Berhad (the “Trustee”). The Fund has changed its name from HwangDBS Select Opportunity Fund to Hwang Select Opportunity Fund as amended by the Third Supplemental Deed dated 18 January 2012 and from Hwang Select Opportunity Fund to Affin Hwang Select Opportunity Fund as amended by Fourth Supplemental Deed dated 27 June 2014.
The Fund commenced operations on 7 September 2001 and will continue its operations until terminated by the Trustee as provided under Clause 13.1 of the Deed.
The Fund may invest in any of the following investments: a) Securities of companies listed on Bursa Malaysia and any other exchanges of countries who are
members of International Organization of Securities Commissions; b) Unlisted securities including, without limitation, securities that have been approved by the relevant
regulatory authorities for the listing of and quotation for such securities; c) Debentures; d) Money market instruments; e) Deposits; f) Derivatives, for the purpose of hedging only; g) Warrants; h) Structured products; i) Units or shares in collective investment schemes and; j) k) Any other form of investments permitted by the SC from time to time which are in line with the objective
of the Fund All investments will be subjected to the SC’s Guidelines on Unit Trust Funds, the Deeds and the objective of the Fund.
The main objective of the Fund is to achieve consistent capital appreciation over the medium to long term through investing mainly in listed Malaysian companies with good growth prospects. The Manager is a company incorporated in Malaysia. The principal activities of the Manager are establishment and management of unit trust funds, exchange-traded funds and private retirement schemes as well as providing fund management services to private clients.
The financial statements were authorised for issue by the Manager on 15 March 2021.

12
AFFIN HWANG SELECT OPPORTUNITY FUND
NOTES TO THE UNAUDITED INTERIM FINANCIAL STATEMENTS FOR THE 6 MONTHS FINANCIAL PERIOD ENDED 31 JANUARY 2021 (CONTINUED)
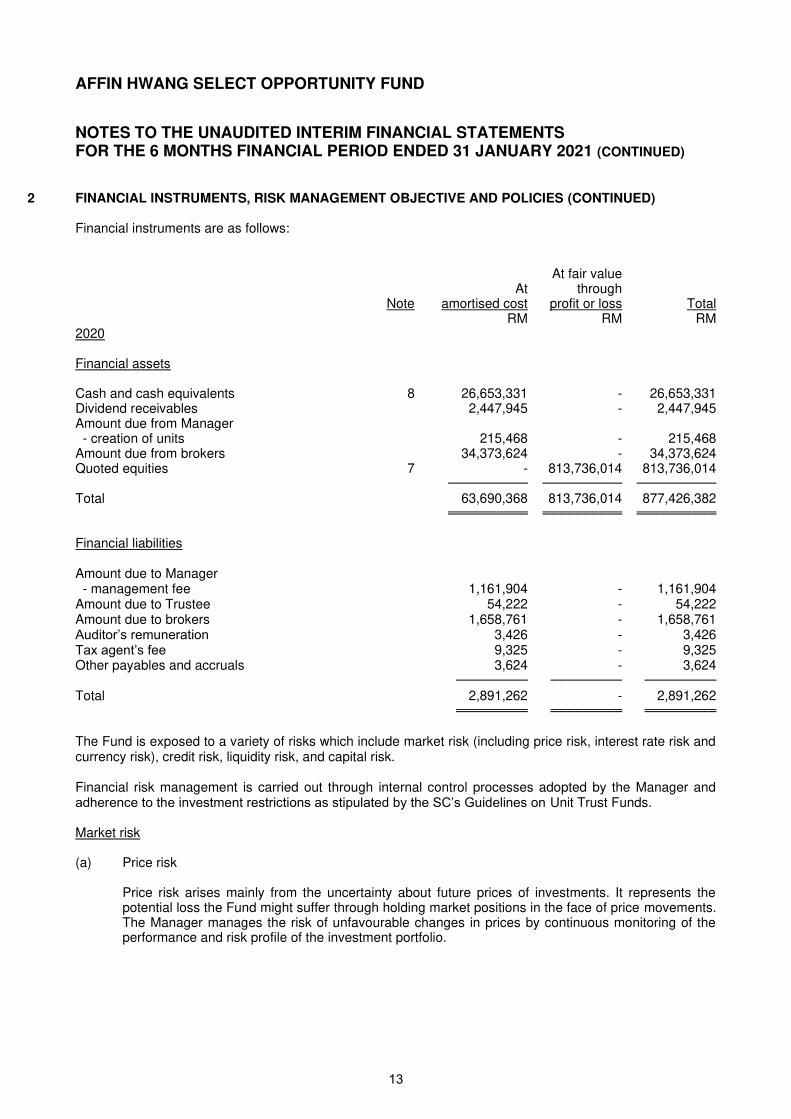
2 FINANCIAL INSTRUMENTS, RISK MANAGEMENT OBJECTIVE AND POLICIES Financial instruments are as follows:
At fair value At through Note amortised cost profit or loss Total RM RM RM
2021 Financial assets
Cash and cash equivalents 8 20,485,973 - 20,485,973 Dividend receivables 2,912,260 - 2,912,260 Amount due from brokers 6,891,774 - 6,891,774 Quoted equities 7 - 537,233,939 537,233,939
────────── ────────── ──────────
Total 30,290,007 537,233,939 567,523,946 ══════════ ══════════ ══════════
Financial liabilities Amount due to Manager - management fee 730,414 - 730,414 - cancellation of units 1,580,061 - 1,580,061 Amount due to Trustee 34,086 - 34,086 Amount due to brokers 6,298,309 - 6,298,309 Auditor’s remuneration 4,971 - 4,971 Tax agent’s fee 9,625 - 9,625 Other payables and accruals 9,739 - 9,739 ───────── ───────── ─────────
Total 8,667,205 - 8,667,205 ═════════ ═════════ ═════════
13
AFFIN HWANG SELECT OPPORTUNITY FUND
NOTES TO THE UNAUDITED INTERIM FINANCIAL STATEMENTS FOR THE 6 MONTHS FINANCIAL PERIOD ENDED 31 JANUARY 2021 (CONTINUED)
2 FINANCIAL INSTRUMENTS, RISK MANAGEMENT OBJECTIVE AND POLICIES (CONTINUED) Financial instruments are as follows:
At fair value At through Note amortised cost profit or loss Total RM RM RM
2020 Financial assets
Cash and cash equivalents 8 26,653,331 - 26,653,331 Dividend receivables 2,447,945 - 2,447,945 Amount due from Manager
- creation of units 215,468 - 215,468 Amount due from brokers 34,373,624 - 34,373,624 Quoted equities 7 - 813,736,014 813,736,014
────────── ────────── ──────────
Total 63,690,368 813,736,014 877,426,382 ══════════ ══════════ ══════════
Financial liabilities Amount due to Manager - management fee 1,161,904 - 1,161,904 Amount due to Trustee 54,222 - 54,222 Amount due to brokers 1,658,761 - 1,658,761 Auditor’s remuneration 3,426 - 3,426 Tax agent’s fee 9,325 - 9,325 Other payables and accruals 3,624 - 3,624 ───────── ───────── ─────────
Total 2,891,262 - 2,891,262 ═════════ ═════════ ═════════
The Fund is exposed to a variety of risks which include market risk (including price risk, interest rate risk and currency risk), credit risk, liquidity risk, and capital risk. Financial risk management is carried out through internal control processes adopted by the Manager and adherence to the investment restrictions as stipulated by the SC’s Guidelines on Unit Trust Funds.
Market risk (a) Price risk
Price risk arises mainly from the uncertainty about future prices of investments. It represents the potential loss the Fund might suffer through holding market positions in the face of price movements. The Manager manages the risk of unfavourable changes in prices by continuous monitoring of the performance and risk profile of the investment portfolio.
14
AFFIN HWANG SELECT OPPORTUNITY FUND
NOTES TO THE UNAUDITED INTERIM FINANCIAL STATEMENTS FOR THE 6 MONTHS FINANCIAL PERIOD ENDED 31 JANUARY 2021 (CONTINUED)
2 FINANCIAL INSTRUMENTS, RISK MANAGEMENT OBJECTIVE AND POLICIES (CONTINUED)
Market risk (continued) (a) Price risk (continued)
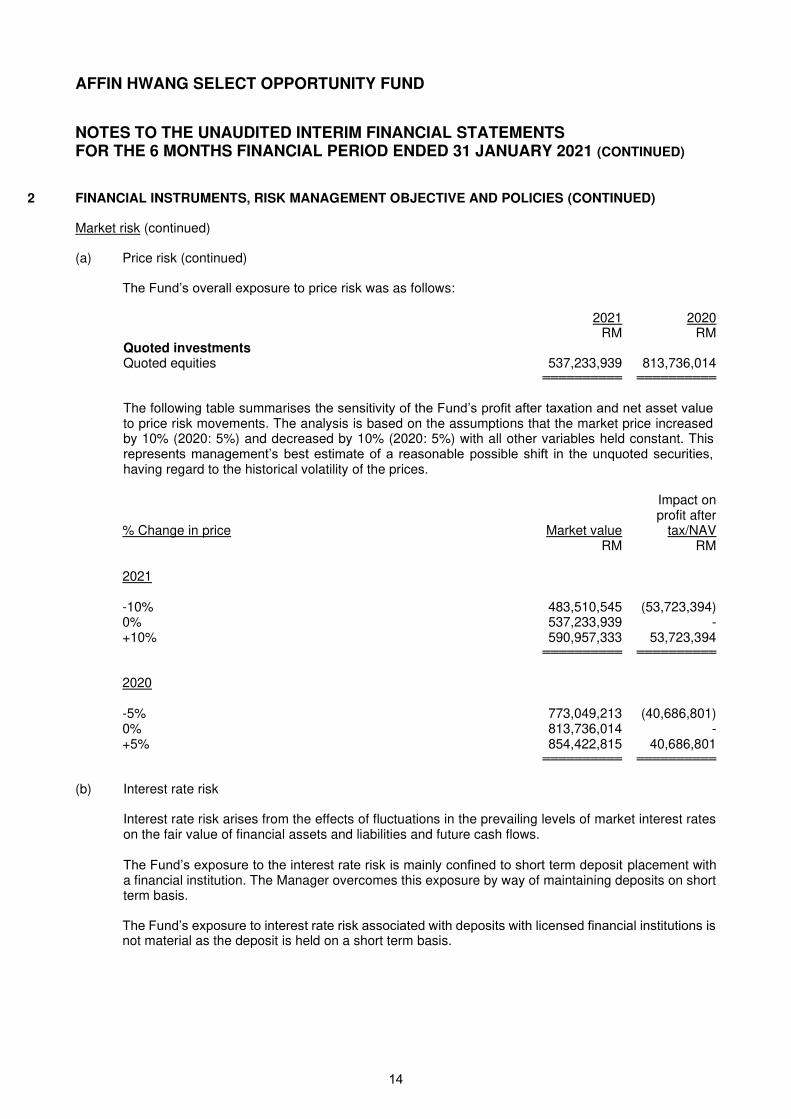
The Fund’s overall exposure to price risk was as follows:
2021 2020
RM RM Quoted investments
Quoted equities 537,233,939 813,736,014 ══════════ ══════════
The following table summarises the sensitivity of the Fund’s profit after taxation and net asset value to price risk movements. The analysis is based on the assumptions that the market price increased by 10% (2020: 5%) and decreased by 10% (2020: 5%) with all other variables held constant. This represents management’s best estimate of a reasonable possible shift in the unquoted securities, having regard to the historical volatility of the prices.
Impact on profit after
% Change in price Market value tax/NAV RM RM 2021 -10% 483,510,545 (53,723,394) 0% 537,233,939 - +10% 590,957,333 53,723,394 ══════════ ══════════
2020 -5% 773,049,213 (40,686,801) 0% 813,736,014 - +5% 854,422,815 40,686,801 ══════════ ══════════
(b) Interest rate risk Interest rate risk arises from the effects of fluctuations in the prevailing levels of market interest rates
on the fair value of financial assets and liabilities and future cash flows. The Fund’s exposure to the interest rate risk is mainly confined to short term deposit placement with
a financial institution. The Manager overcomes this exposure by way of maintaining deposits on short term basis.
The Fund’s exposure to interest rate risk associated with deposits with licensed financial institutions is not material as the deposit is held on a short term basis.
15
AFFIN HWANG SELECT OPPORTUNITY FUND
NOTES TO THE UNAUDITED INTERIM FINANCIAL STATEMENTS FOR THE 6 MONTHS FINANCIAL PERIOD ENDED 31 JANUARY 2021 (CONTINUED)
2 FINANCIAL INSTRUMENTS, RISK MANAGEMENT OBJECTIVE AND POLICIES (CONTINUED) Market risk (continued) (c) Currency risk
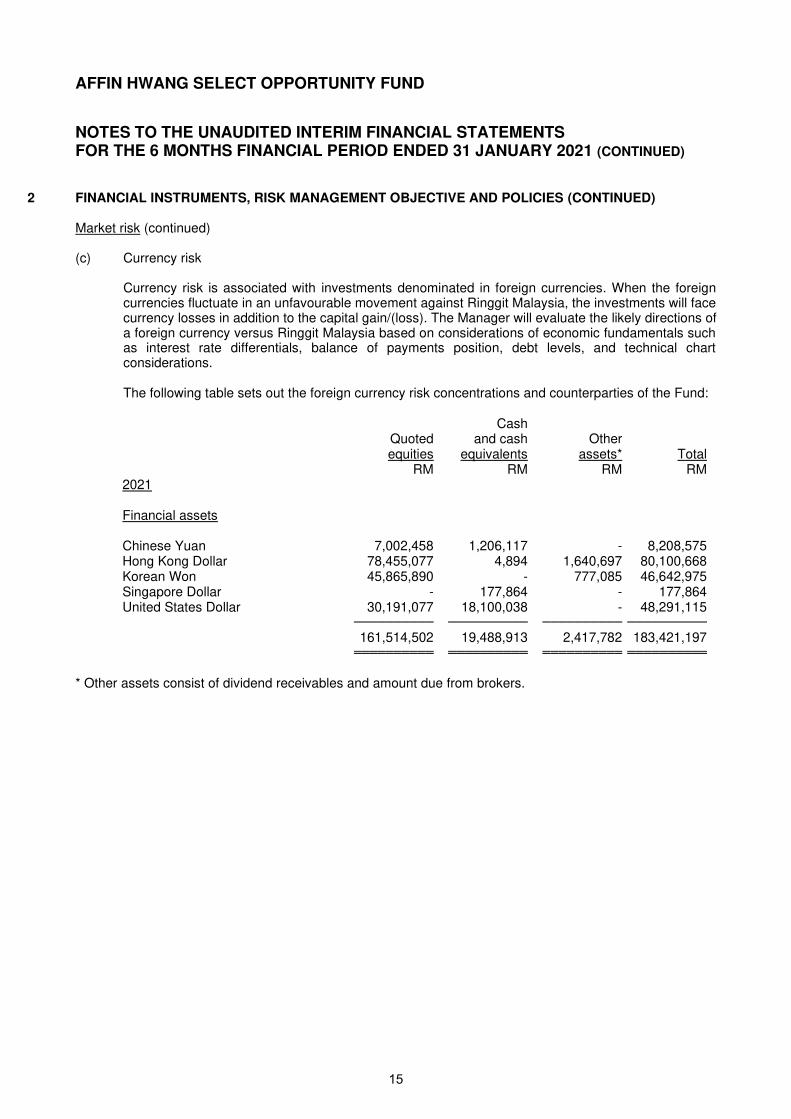
Currency risk is associated with investments denominated in foreign currencies. When the foreign currencies fluctuate in an unfavourable movement against Ringgit Malaysia, the investments will face currency losses in addition to the capital gain/(loss). The Manager will evaluate the likely directions of a foreign currency versus Ringgit Malaysia based on considerations of economic fundamentals such as interest rate differentials, balance of payments position, debt levels, and technical chart considerations.
The following table sets out the foreign currency risk concentrations and counterparties of the Fund: Cash Quoted and cash Other equities equivalents assets* Total RM RM RM RM
2021 Financial assets Chinese Yuan 7,002,458 1,206,117 - 8,208,575 Hong Kong Dollar 78,455,077 4,894 1,640,697 80,100,668 Korean Won 45,865,890 - 777,085 46,642,975 Singapore Dollar - 177,864 - 177,864 United States Dollar 30,191,077 18,100,038 - 48,291,115 ────────── ────────── ────────── ──────────
161,514,502 19,488,913 2,417,782 183,421,197 ══════════ ══════════ ══════════ ══════════
* Other assets consist of dividend receivables and amount due from brokers.
16
AFFIN HWANG SELECT OPPORTUNITY FUND
NOTES TO THE UNAUDITED INTERIM FINANCIAL STATEMENTS FOR THE 6 MONTHS FINANCIAL PERIOD ENDED 31 JANUARY 2021 (CONTINUED)
2 FINANCIAL INSTRUMENTS, RISK MANAGEMENT OBJECTIVE AND POLICIES (CONTINUED) Market risk (continued) (c) Currency risk (continued)
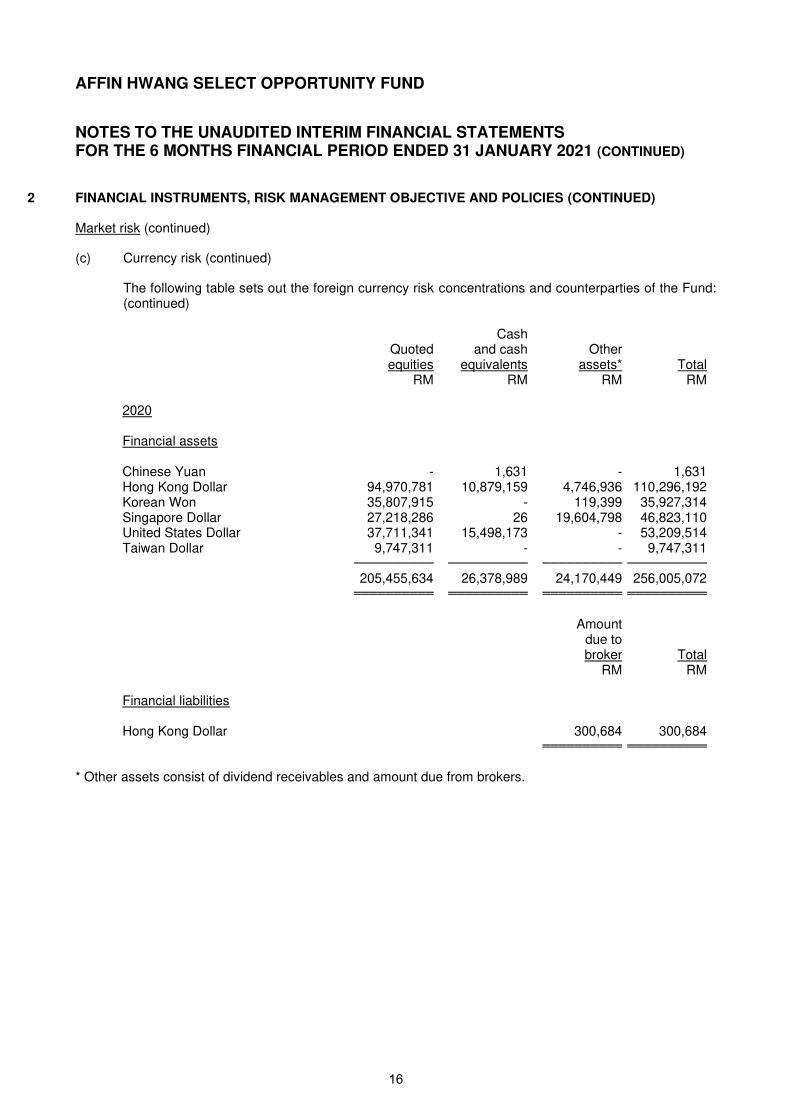
The following table sets out the foreign currency risk concentrations and counterparties of the Fund:
(continued) Cash Quoted and cash Other equities equivalents assets* Total RM RM RM RM
2020 Financial assets Chinese Yuan - 1,631 - 1,631 Hong Kong Dollar 94,970,781 10,879,159 4,746,936 110,296,192 Korean Won 35,807,915 - 119,399 35,927,314 Singapore Dollar 27,218,286 26 19,604,798 46,823,110 United States Dollar 37,711,341 15,498,173 - 53,209,514 Taiwan Dollar 9,747,311 - - 9,747,311 ────────── ────────── ────────── ──────────
205,455,634 26,378,989 24,170,449 256,005,072 ══════════ ══════════ ══════════ ══════════
Amount due to broker Total RM RM
Financial liabilities Hong Kong Dollar 300,684 300,684 ══════════ ══════════
* Other assets consist of dividend receivables and amount due from brokers.
17
AFFIN HWANG SELECT OPPORTUNITY FUND
NOTES TO THE UNAUDITED INTERIM FINANCIAL STATEMENTS FOR THE 6 MONTHS FINANCIAL PERIOD ENDED 31 JANUARY 2021 (CONTINUED)
2 FINANCIAL INSTRUMENTS, RISK MANAGEMENT OBJECTIVE AND POLICIES (CONTINUED) Market risk (continued) (c) Currency risk (continued)
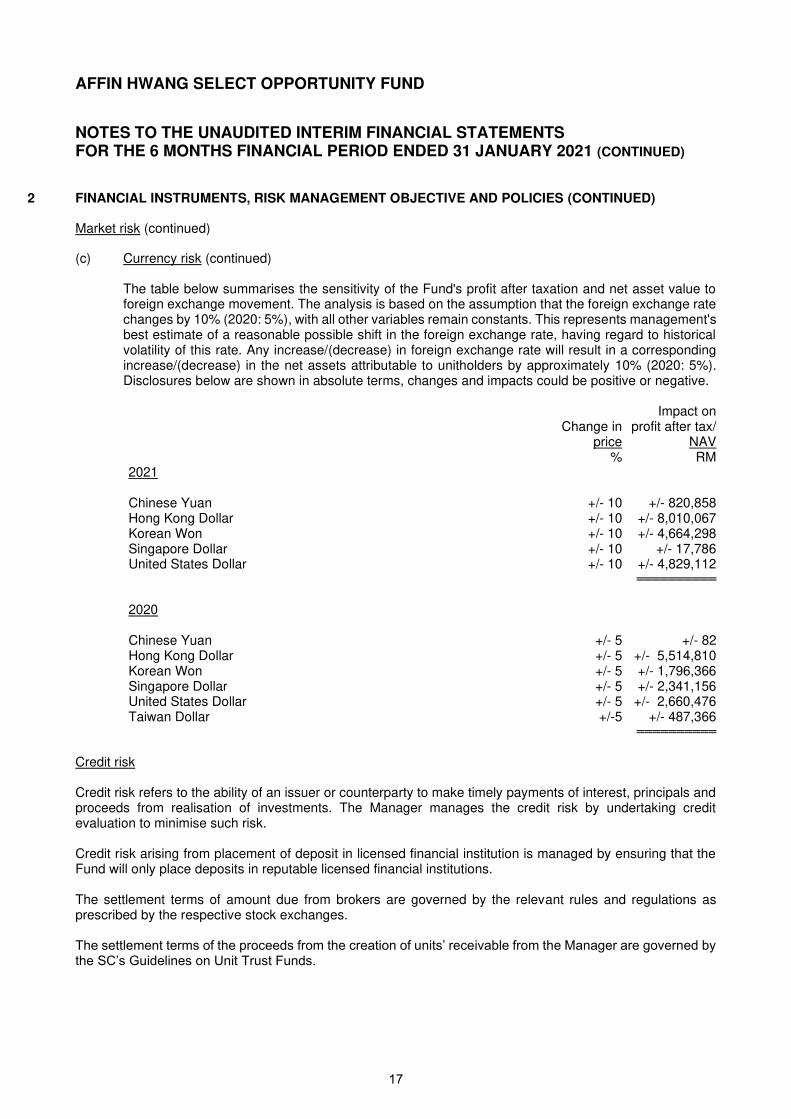
The table below summarises the sensitivity of the Fund's profit after taxation and net asset value to foreign exchange movement. The analysis is based on the assumption that the foreign exchange rate changes by 10% (2020: 5%), with all other variables remain constants. This represents management's best estimate of a reasonable possible shift in the foreign exchange rate, having regard to historical volatility of this rate. Any increase/(decrease) in foreign exchange rate will result in a corresponding increase/(decrease) in the net assets attributable to unitholders by approximately 10% (2020: 5%). Disclosures below are shown in absolute terms, changes and impacts could be positive or negative. Impact on Change in profit after tax/ price NAV % RM 2021 Chinese Yuan +/- 10 +/- 820,858 Hong Kong Dollar +/- 10 +/- 8,010,067 Korean Won +/- 10 +/- 4,664,298 Singapore Dollar +/- 10 +/- 17,786 United States Dollar +/- 10 +/- 4,829,112
══════════
2020 Chinese Yuan +/- 5 +/- 82 Hong Kong Dollar +/- 5 +/- 5,514,810 Korean Won +/- 5 +/- 1,796,366 Singapore Dollar +/- 5 +/- 2,341,156 United States Dollar +/- 5 +/- 2,660,476 Taiwan Dollar +/-5 +/- 487,366
══════════
Credit risk
Credit risk refers to the ability of an issuer or counterparty to make timely payments of interest, principals and proceeds from realisation of investments. The Manager manages the credit risk by undertaking credit evaluation to minimise such risk. Credit risk arising from placement of deposit in licensed financial institution is managed by ensuring that the Fund will only place deposits in reputable licensed financial institutions. The settlement terms of amount due from brokers are governed by the relevant rules and regulations as prescribed by the respective stock exchanges. The settlement terms of the proceeds from the creation of units’ receivable from the Manager are governed by the SC’s Guidelines on Unit Trust Funds.

18
AFFIN HWANG SELECT OPPORTUNITY FUND
NOTES TO THE UNAUDITED INTERIM FINANCIAL STATEMENTS FOR THE 6 MONTHS FINANCIAL PERIOD ENDED 31 JANUARY 2021 (CONTINUED)
2 FINANCIAL INSTRUMENTS, RISK MANAGEMENT OBJECTIVE AND POLICIES (CONTINUED) Credit risk (continued)
The following table sets out the credit risk concentrations and counterparties of the Fund:
Cash and cash Other equivalents assets* Total RM RM RM
2021
Financials - AAA 20,485,973 - 20,485,973 - NR - 2,124,577 2,124,577 Healthcare - NR - 5,251,077 5,251,077 Technology - NR - 777,085 777,085 Preference Shares - NR - 1,083,295 1,083,295 Property - NR - 568,000 568,000 ───────── ───────── ─────────
20,485,973 9,804,034 30,290,007 ═════════ ═════════ ═════════
2020
Consumers Products & Services - NR - 165,924 165,924 Energy - NR - 916,681 916,681 Financials - AAA 26,653,331 - 26,653,331 - NR - 21,960,326 21,960,326 Plantations - NR - 3,985,337 3,985,337 Preference Shares - NR - 1,214,037 1,214,037 Technology - NR - 119,399 119,399 Tecommunications & Media - NR - 3,412,928 3,412,928 Other - NR - 5,262,405 5,262,405 ───────── ───────── ─────────
26,653,331 37,037,037 63,690,368 ═════════ ═════════ ═════════
* Other assets consist of dividend receivables, amount due from brokers and amount due from Manager.

19
AFFIN HWANG SELECT OPPORTUNITY FUND
NOTES TO THE UNAUDITED INTERIM FINANCIAL STATEMENTS FOR THE 6 MONTHS FINANCIAL PERIOD ENDED 31 JANUARY 2021 (CONTINUED)
2 FINANCIAL INSTRUMENTS, RISK MANAGEMENT OBJECTIVE AND POLICIES (CONTINUED)
Liquidity risk Liquidity risk is the risk that the Fund will encounter difficulty in meeting its financial obligations. The Manager manages this risk by maintaining sufficient level of liquid assets to meet anticipated payments and cancellations of units by unitholders. Liquid assets comprise cash, deposits with licensed financial institutions and other instruments, which are capable of being converted into cash within 7 days. The table below analyses the Fund's financial liabilities into relevant maturity groupings based on the remaining period at the statement of financial position date to the contractual maturity date. The amounts in the table below are the contractual undiscounted cash flows.
Between Within one month one month to one year Total RM RM RM 2021
Amount due to Manager - management fee 730,414 - 730,414 - creation of units 1,580,061 - 1,580,061 Amount due to Trustee 34,086 - 34,086 Amount due to brokers 6,298,309 - 6,298,309 Auditors’ remuneration - 4,971 4,971 Tax agent’s fee - 9,625 9,625 Other payables and accruals - 9,739 9,739
───────── ───────── ─────────
8,642,870 24,335 8,667,205 ═════════ ═════════ ═════════
2020
Amount due to Manager - management fee 1,161,904 - 1,161,904 Amount due to Trustee 54,222 - 54,222 Amount due to brokers 1,658,761 - 1,658,761 Auditors’ remuneration - 3,426 3,426 Tax agent’s fee - 9,325 9,325 Other payables and accruals - 3,624 3,624
───────── ───────── ─────────
2,874,887 16,375 2,891,262 ═════════ ═════════ ═════════
Capital risk
The capital of the Fund is represented by equity consisting of unitholders’ capital and retained earnings. The amount of equity can change significantly on a daily basis as the Fund is subject to daily subscriptions and redemptions at the discretion of unitholders. The Fund’s objective when managing capital is to safeguard the Fund’s ability to continue as a going concern in order to provide returns for unitholders and benefits for other stakeholders and to maintain a strong capital base to support the development of the investment activities of the Fund.
20
AFFIN HWANG SELECT OPPORTUNITY FUND
NOTES TO THE UNAUDITED INTERIM FINANCIAL STATEMENTS FOR THE 6 MONTHS FINANCIAL PERIOD ENDED 31 JANUARY 2021 (CONTINUED)
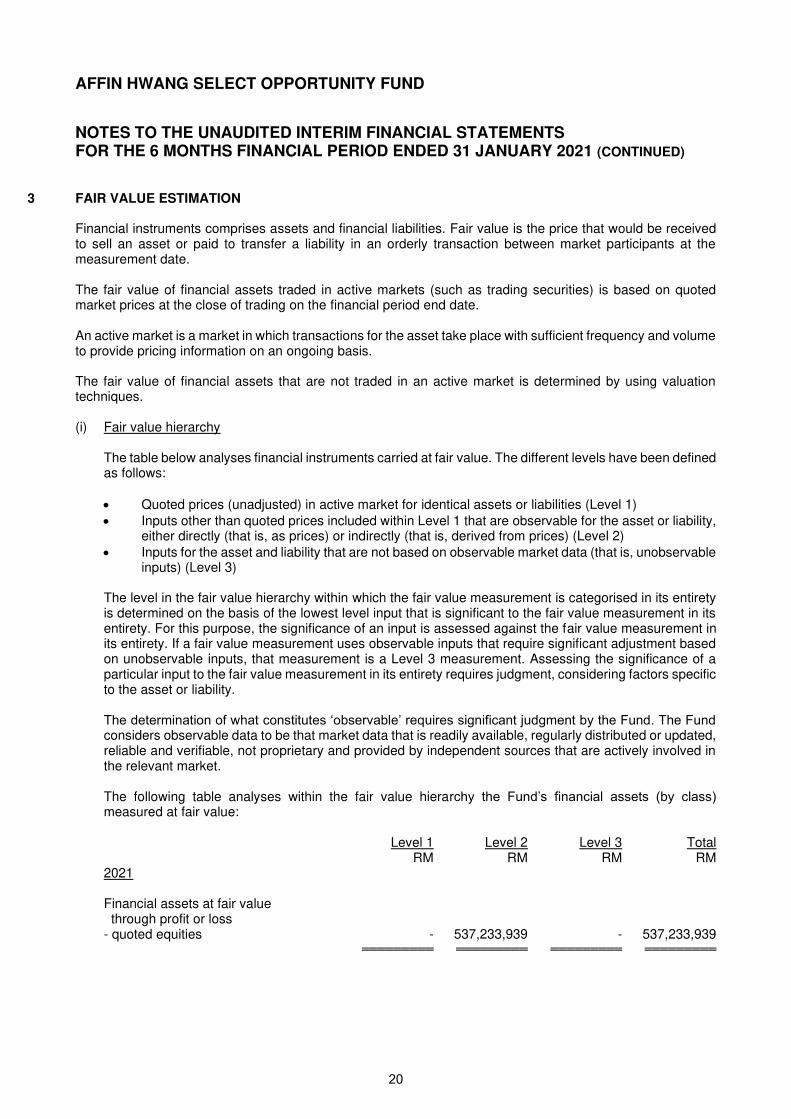
3 FAIR VALUE ESTIMATION Financial instruments comprises assets and financial liabilities. Fair value is the price that would be received to sell an asset or paid to transfer a liability in an orderly transaction between market participants at the measurement date. The fair value of financial assets traded in active markets (such as trading securities) is based on quoted market prices at the close of trading on the financial period end date. An active market is a market in which transactions for the asset take place with sufficient frequency and volume to provide pricing information on an ongoing basis. The fair value of financial assets that are not traded in an active market is determined by using valuation techniques. (i) Fair value hierarchy
The table below analyses financial instruments carried at fair value. The different levels have been defined as follows:
• Quoted prices (unadjusted) in active market for identical assets or liabilities (Level 1)
• Inputs other than quoted prices included within Level 1 that are observable for the asset or liability, either directly (that is, as prices) or indirectly (that is, derived from prices) (Level 2)
• Inputs for the asset and liability that are not based on observable market data (that is, unobservable inputs) (Level 3)
The level in the fair value hierarchy within which the fair value measurement is categorised in its entirety is determined on the basis of the lowest level input that is significant to the fair value measurement in its entirety. For this purpose, the significance of an input is assessed against the fair value measurement in its entirety. If a fair value measurement uses observable inputs that require significant adjustment based on unobservable inputs, that measurement is a Level 3 measurement. Assessing the significance of a particular input to the fair value measurement in its entirety requires judgment, considering factors specific to the asset or liability. The determination of what constitutes ‘observable’ requires significant judgment by the Fund. The Fund considers observable data to be that market data that is readily available, regularly distributed or updated, reliable and verifiable, not proprietary and provided by independent sources that are actively involved in the relevant market. The following table analyses within the fair value hierarchy the Fund’s financial assets (by class) measured at fair value:
Level 1 Level 2 Level 3 Total RM RM RM RM
2021
Financial assets at fair value through profit or loss - quoted equities - 537,233,939 - 537,233,939
═════════ ═════════ ═════════ ═════════

21
AFFIN HWANG SELECT OPPORTUNITY FUND
NOTES TO THE UNAUDITED INTERIM FINANCIAL STATEMENTS FOR THE 6 MONTHS FINANCIAL PERIOD ENDED 31 JANUARY 2021 (CONTINUED)
3 FAIR VALUE ESTIMATION (CONTINUED) (i) Fair value hierarchy (continued)
The following table analyses within the fair value hierarchy the Fund’s financial assets (by class) measured at fair value: (continued)
Level 1 Level 2 Level 3 Total RM RM RM RM
2020
Financial assets at fair value through profit or loss - quoted equities - 813,736,014 - 813,736,014
═════════ ═════════ ═════════ ═════════
Investments whose values are based on quoted market prices in active markets, and are therefore classified within Level 1, include active listed equities The Fund does not adjust the quoted prices for these instruments. Financial instruments that trade in markets that are not considered to be active but are valued based on quoted market prices, dealer quotations or alternative pricing sources supported by observable inputs are classified within Level 2. These include forward foreign currency contracts. As Level 2 instruments include positions that are not traded in active markets and/or are subject to transfer restrictions, valuations may be adjusted to reflect illiquidity and/or non-transferability, which are generally based on available market information.
(ii) The carrying value of cash and cash equivalents, dividend receivables, amount due from Manager, amount due from brokers and all current liabilities are a reasonable approximation of the fair values due to their short term nature.
4 MANAGEMENT FEE
In accordance with the Deed, the Manager is entitled to a management fee at a rate not exceeding 3.00% per annum on the NAV of the Fund calculated on daily basis.
For the 6 months financial period ended 31 January 2021, the management fee is recognised at a rate of 1.50% (2020: 1.50%) per annum on the NAV of the Fund calculated on daily basis as stated in the Prospectus.
There will be no further liability to the Manager in respect of management fee other than the amounts recognised above.
22
AFFIN HWANG SELECT OPPORTUNITY FUND
NOTES TO THE UNAUDITED INTERIM FINANCIAL STATEMENTS FOR THE 6 MONTHS FINANCIAL PERIOD ENDED 31 JANUARY 2021 (CONTINUED)
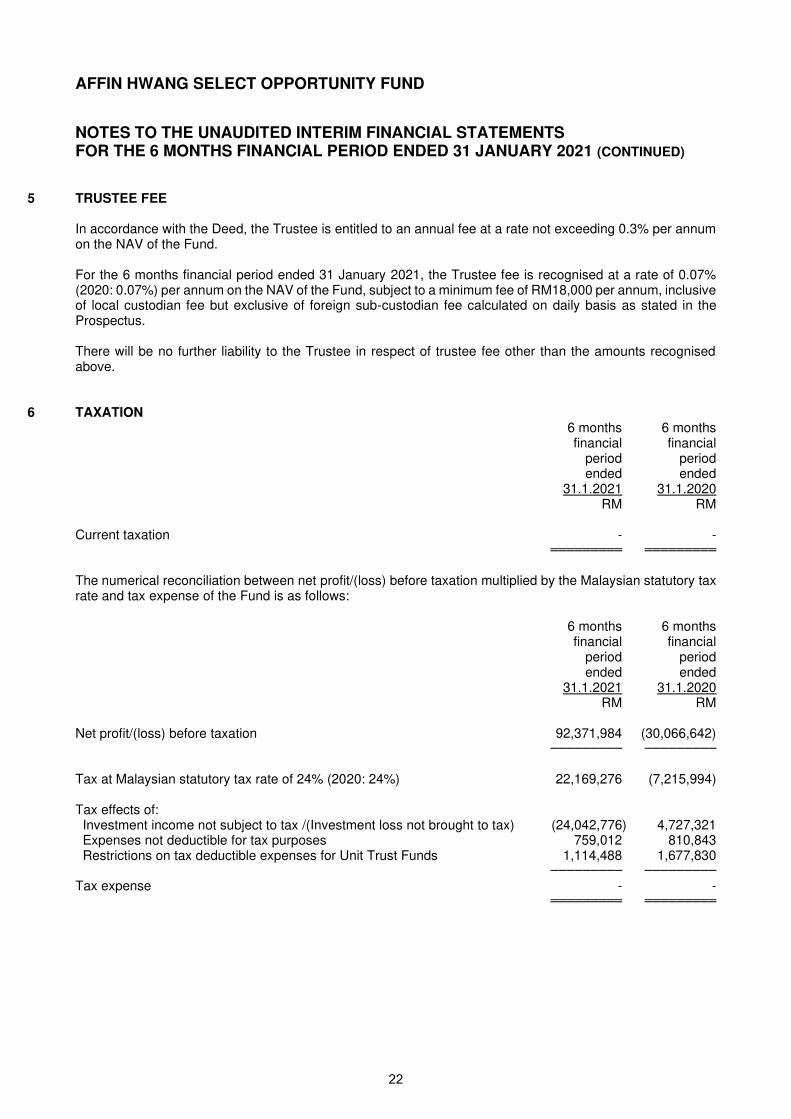
5 TRUSTEE FEE
In accordance with the Deed, the Trustee is entitled to an annual fee at a rate not exceeding 0.3% per annum on the NAV of the Fund.
For the 6 months financial period ended 31 January 2021, the Trustee fee is recognised at a rate of 0.07% (2020: 0.07%) per annum on the NAV of the Fund, subject to a minimum fee of RM18,000 per annum, inclusive of local custodian fee but exclusive of foreign sub-custodian fee calculated on daily basis as stated in the Prospectus.
There will be no further liability to the Trustee in respect of trustee fee other than the amounts recognised above.
6 TAXATION 6 months 6 months financial financial period period ended ended 31.1.2021 31.1.2020
RM RM Current taxation - - ═════════ ═════════
The numerical reconciliation between net profit/(loss) before taxation multiplied by the Malaysian statutory tax rate and tax expense of the Fund is as follows: 6 months 6 months financial financial period period ended ended 31.1.2021 31.1.2020
RM RM Net profit/(loss) before taxation 92,371,984 (30,066,642) ───────── ─────────
Tax at Malaysian statutory tax rate of 24% (2020: 24%) 22,169,276 (7,215,994) Tax effects of: Investment income not subject to tax /(Investment loss not brought to tax) (24,042,776) 4,727,321 Expenses not deductible for tax purposes 759,012 810,843 Restrictions on tax deductible expenses for Unit Trust Funds 1,114,488 1,677,830 ───────── ─────────
Tax expense - - ═════════ ═════════
23
AFFIN HWANG SELECT OPPORTUNITY FUND
NOTES TO THE UNAUDITED INTERIM FINANCIAL STATEMENTS FOR THE 6 MONTHS FINANCIAL PERIOD ENDED 31 JANUARY 2021 (CONTINUED)
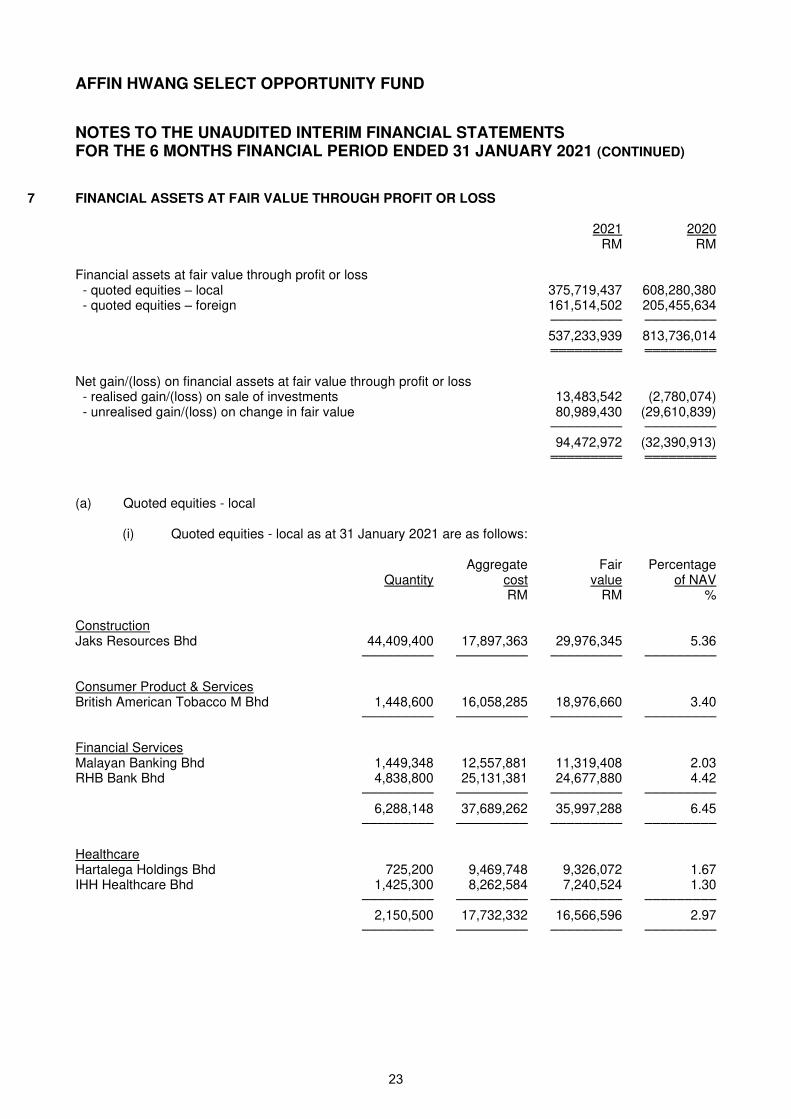
7 FINANCIAL ASSETS AT FAIR VALUE THROUGH PROFIT OR LOSS 2021 2020 RM RM Financial assets at fair value through profit or loss - quoted equities – local 375,719,437 608,280,380 - quoted equities – foreign 161,514,502 205,455,634 ───────── ─────────
537,233,939 813,736,014 ═════════ ═════════
Net gain/(loss) on financial assets at fair value through profit or loss - realised gain/(loss) on sale of investments 13,483,542 (2,780,074) - unrealised gain/(loss) on change in fair value 80,989,430 (29,610,839) ───────── ─────────
94,472,972 (32,390,913) ═════════ ═════════
(a) Quoted equities - local
(i) Quoted equities - local as at 31 January 2021 are as follows:
Aggregate Fair Percentage Quantity cost value of NAV RM RM % Construction Jaks Resources Bhd 44,409,400 17,897,363 29,976,345 5.36 ───────── ───────── ───────── ─────────
Consumer Product & Services British American Tobacco M Bhd 1,448,600 16,058,285 18,976,660 3.40 ───────── ───────── ───────── ─────────
Financial Services Malayan Banking Bhd 1,449,348 12,557,881 11,319,408 2.03 RHB Bank Bhd 4,838,800 25,131,381 24,677,880 4.42 ───────── ───────── ───────── ─────────
6,288,148 37,689,262 35,997,288 6.45 ───────── ───────── ───────── ─────────
Healthcare Hartalega Holdings Bhd 725,200 9,469,748 9,326,072 1.67 IHH Healthcare Bhd 1,425,300 8,262,584 7,240,524 1.30 ───────── ───────── ───────── ─────────
2,150,500 17,732,332 16,566,596 2.97 ───────── ───────── ───────── ─────────

24
AFFIN HWANG SELECT OPPORTUNITY FUND
NOTES TO THE UNAUDITED INTERIM FINANCIAL STATEMENTS FOR THE 6 MONTHS FINANCIAL PERIOD ENDED 31 JANUARY 2021 (CONTINUED)
7 FINANCIAL ASSETS AT FAIR VALUE THROUGH PROFIT OR LOSS (CONTINUED) (a) Quoted equities - local (continued)
(i) Quoted equities - local as at 31 January 2021 are as follows: (continued)
Aggregate Fair Percentage Quantity cost value of NAV RM RM % Industrial Products & Services Sunway Bhd 10,667,440 16,552,814 16,001,160 2.86 Supercomnet Technologies Bhd 9,305,900 18,146,505 16,564,502 2.96 ───────── ───────── ───────── ─────────
19,973,340 34,699,319 32,565,662 5.82 ───────── ───────── ───────── ─────────
Plantations Kuala Lumpur Kepong Bhd 822,700 19,591,869 19,103,094 3.42 ───────── ───────── ───────── ─────────
Property Eco World Development Grp Bhd 30,000,000 15,508,227 14,700,000 2.63 ───────── ───────── ───────── ─────────
Preference Shares Allianz Malaysia Bhd -PA 1,556,458 6,898,365 21,012,183 3.76 ───────── ───────── ───────── ─────────
Technology Datasonic Group Bhd 15,337,200 8,617,559 7,361,856 1.32 Frontken Corp Bhd 4,076,200 14,163,393 18,995,092 3.40 Greatech Technology Bhd 5,900,800 19,000,679 33,162,496 5.93 Inari Amertron Bhd 7,538,200 13,762,888 25,479,116 4.56 My EG Services Bhd 12,916,310 17,620,806 24,670,152 4.41 ───────── ───────── ───────── ─────────
45,768,710 73,165,325 109,668,712 19.62 ───────── ───────── ───────── ─────────
Telecommunications & Media Telekom Malaysia Bhd 5,737,900 26,742,320 36,320,907 6.50 TIME dotCom Bhd 1,767,500 16,326,681 24,108,700 4.31 ───────── ───────── ───────── ─────────
7,505,400 43,069,001 60,429,607 10.81 ───────── ───────── ───────── ─────────

25
AFFIN HWANG SELECT OPPORTUNITY FUND
NOTES TO THE UNAUDITED INTERIM FINANCIAL STATEMENTS FOR THE 6 MONTHS FINANCIAL PERIOD ENDED 31 JANUARY 2021 (CONTINUED)
7 FINANCIAL ASSETS AT FAIR VALUE THROUGH PROFIT OR LOSS (CONTINUED) (a) Quoted equities - local (continued)
(i) Quoted equities - local as at 31 January 2021 are as follows (continued):
Aggregate Fair Percentage Quantity cost value of NAV RM RM % Warrants Jaks Resources Bhd - Warrant 14,350,000 - 5,668,250 1.01 ───────── ───────── ───────── ─────────
Utilities Tenaga Nasional Bhd 1,145,600 14,545,950 11,055,040 1.98 ───────── ───────── ───────── ─────────
Total quoted equities – local 175,418,856 296,855,298 375,719,437 67.23 ═════════ ═════════ ═════════
Accumulated unrealised gain on quoted equities – local 78,864,139 ─────────
Total quoted equities – local 375,719,437 ═════════

26
AFFIN HWANG SELECT OPPORTUNITY FUND
NOTES TO THE UNAUDITED INTERIM FINANCIAL STATEMENTS FOR THE 6 MONTHS FINANCIAL PERIOD ENDED 31 JANUARY 2021 (CONTINUED)
7 FINANCIAL ASSETS AT FAIR VALUE THROUGH PROFIT OR LOSS (CONTINUED) (a) Quoted equities - local (continued)
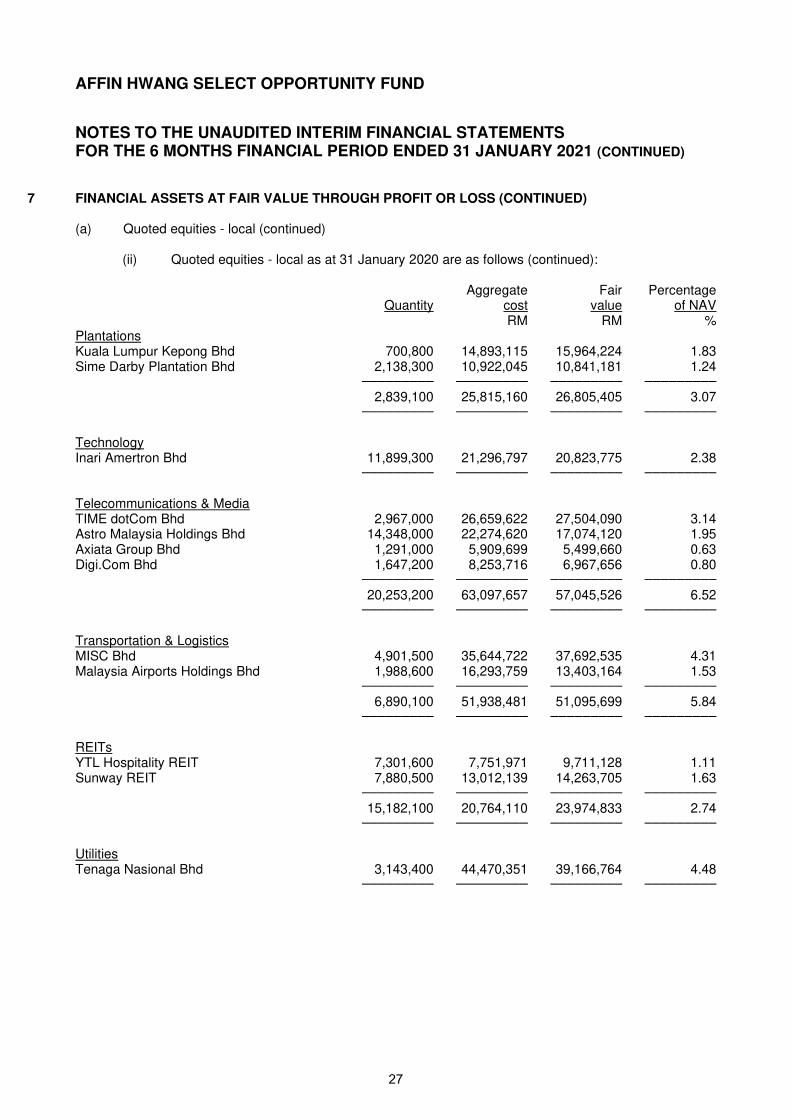
(ii) Quoted equities - local as at 31 January 2020 are as follows: Aggregate Fair Percentage Quantity cost value of NAV RM RM % Construction Widad Group Bhd 10,000,000 4,700,000 5,000,000 0.57 ───────── ───────── ───────── ─────────
Consumer Product & Services Fraser & Neave Holdings Bhd 502,800 15,254,303 16,522,008 1.89 British American Tobacco M Bhd 800,000 9,628,317 9,168,000 1.05 Mynews Holdings Bhd 12,470,200 8,812,419 10,849,074 1.24 Petronas Dagangan Bhd 573,300 14,682,751 12,704,328 1.45 Aeon Company (M) Bhd 9,866,700 20,980,438 13,418,712 1.54 ───────── ───────── ───────── ─────────
24,213,000 69,358,228 62,662,122 7.17 ───────── ───────── ───────── ─────────
Energy Perdana Petroleum Bhd 38,738,900 6,364,199 8,338,810 0.95 ───────── ───────── ───────── ─────────
Financial Services CIMB Group Holdings Bhd 8,800,378 52,223,257 43,209,856 4.94 Hong Leong Financial Group Bhd 2,075,300 38,296,127 33,495,342 3.83 Malayan Banking Bhd 8,581,843 77,890,193 72,344,936 8.27 Allianz Malaysia Bhd 1,053,900 11,405,643 15,134,004 1.73 Bursa Malaysia Bhd 3,168,800 22,284,971 17,555,152 2.01 Hong Leong Bank Bhd 617,500 10,073,074 9,855,300 1.13 ───────── ───────── ───────── ─────────
24,297,721 212,173,265 191,594,590 21.91 ───────── ───────── ───────── ─────────
Healthcare IHH Healthcare Bhd 1,324,800 7,683,194 7,551,360 0.86 ───────── ───────── ───────── ─────────
Industrial Products & Services Petronas Chemicals Group Bhd 1,300,000 9,211,540 8,047,000 0.92 Sunway Bhd 21,732,040 33,634,200 38,900,352 4.45 ATA IMS Bhd 14,158,000 22,392,034 24,068,600 2.75 ───────── ───────── ───────── ─────────
37,190,040 65,237,774 71,015,952 8.12 ───────── ───────── ───────── ─────────
27
AFFIN HWANG SELECT OPPORTUNITY FUND
NOTES TO THE UNAUDITED INTERIM FINANCIAL STATEMENTS FOR THE 6 MONTHS FINANCIAL PERIOD ENDED 31 JANUARY 2021 (CONTINUED)
7 FINANCIAL ASSETS AT FAIR VALUE THROUGH PROFIT OR LOSS (CONTINUED) (a) Quoted equities - local (continued)
(ii) Quoted equities - local as at 31 January 2020 are as follows (continued):
Aggregate Fair Percentage Quantity cost value of NAV RM RM % Plantations Kuala Lumpur Kepong Bhd 700,800 14,893,115 15,964,224 1.83 Sime Darby Plantation Bhd 2,138,300 10,922,045 10,841,181 1.24 ───────── ───────── ───────── ─────────
2,839,100 25,815,160 26,805,405 3.07 ───────── ───────── ───────── ─────────
Technology Inari Amertron Bhd 11,899,300 21,296,797 20,823,775 2.38 ───────── ───────── ───────── ─────────
Telecommunications & Media TIME dotCom Bhd 2,967,000 26,659,622 27,504,090 3.14 Astro Malaysia Holdings Bhd 14,348,000 22,274,620 17,074,120 1.95 Axiata Group Bhd 1,291,000 5,909,699 5,499,660 0.63 Digi.Com Bhd 1,647,200 8,253,716 6,967,656 0.80 ───────── ───────── ───────── ─────────
20,253,200 63,097,657 57,045,526 6.52 ───────── ───────── ───────── ─────────
Transportation & Logistics MISC Bhd 4,901,500 35,644,722 37,692,535 4.31 Malaysia Airports Holdings Bhd 1,988,600 16,293,759 13,403,164 1.53 ───────── ───────── ───────── ─────────
6,890,100 51,938,481 51,095,699 5.84 ───────── ───────── ───────── ─────────
REITs YTL Hospitality REIT 7,301,600 7,751,971 9,711,128 1.11 Sunway REIT 7,880,500 13,012,139 14,263,705 1.63 ───────── ───────── ───────── ─────────
15,182,100 20,764,110 23,974,833 2.74 ───────── ───────── ───────── ─────────
Utilities Tenaga Nasional Bhd 3,143,400 44,470,351 39,166,764 4.48 ───────── ───────── ───────── ─────────

28
AFFIN HWANG SELECT OPPORTUNITY FUND
NOTES TO THE UNAUDITED INTERIM FINANCIAL STATEMENTS FOR THE 6 MONTHS FINANCIAL PERIOD ENDED 31 JANUARY 2021 (CONTINUED)
7 FINANCIAL ASSETS AT FAIR VALUE THROUGH PROFIT OR LOSS (CONTINUED) (a) Quoted equities - local (continued)
(ii) Quoted equities - local as at 31 January 2020 are as follows (continued):
Aggregate Fair Percentage Quantity cost value of NAV RM RM % Preference Shares Allianz Malaysia Bhd -PA 1,556,458 6,898,365 21,198,958 2.42 Perdana Petroleum Bhd - RCPS 24,766,900 15,203,958 19,249,767 2.20 SP Setia Bhd Group - RCPS-i B 3,382,600 2,976,688 2,756,819 0.32 ───────── ───────── ───────── ─────────
29,705,958 25,079,011 43,205,544 4.94 ───────── ───────── ───────── ─────────
Total quoted equities – local 225,677,619 617,978,227 608,280,380 69.55 ═════════ ═════════ ═════════
Accumulated unrealised loss on quoted equities – local (9,697,847) ─────────
Total quoted equities – local 608,280,380 ═════════
(b) Quoted equities – foreign
(i) Quoted equities - foreign as at 31 January 2021 are as follows:
Aggregate Fair Percentage Quantity cost value of NAV RM RM % China Consumer Services China Intl Travel Service Corp Ltd 37,981 4,903,511 7,002,458 1.25 ───────── ───────── ───────── ─────────
Hong Kong Consumer Goods China Feihe Ltd 592,000 6,295,406 7,138,830 1.28 Haier Smart Home Co Ltd 367,200 6,054,330 6,139,911 1.10 ───────── ───────── ───────── ─────────
959,200 12,349,736 13,278,741 2.38 ───────── ───────── ───────── ─────────
Consumer Services Alibaba Group Holding Ltd 147,800 14,581,514 18,985,492 3.40 JD.com Inc 51,000 7,265,249 9,181,175 1.64 ───────── ───────── ───────── ─────────
198,800 21,846,763 28,166,667 5.04 ───────── ───────── ───────── ─────────
29
AFFIN HWANG SELECT OPPORTUNITY FUND
NOTES TO THE UNAUDITED INTERIM FINANCIAL STATEMENTS FOR THE 6 MONTHS FINANCIAL PERIOD ENDED 31 JANUARY 2021 (CONTINUED)
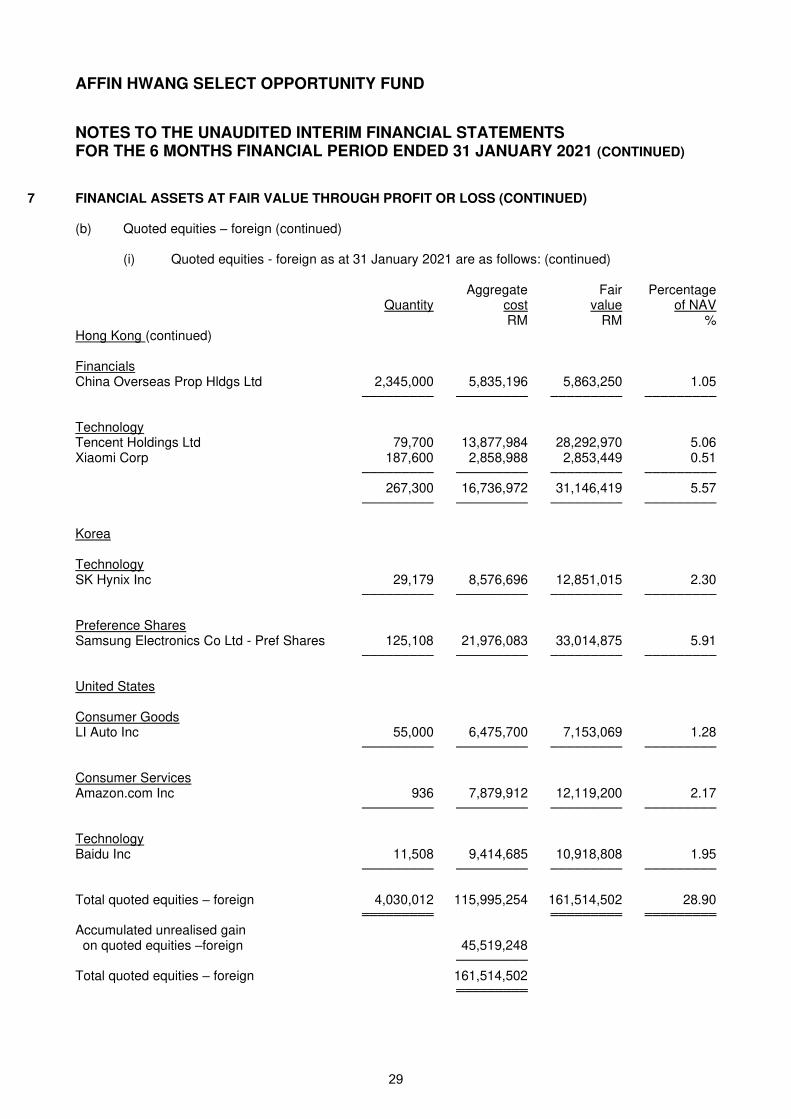
7 FINANCIAL ASSETS AT FAIR VALUE THROUGH PROFIT OR LOSS (CONTINUED) (b) Quoted equities – foreign (continued)
(i) Quoted equities - foreign as at 31 January 2021 are as follows: (continued)
Aggregate Fair Percentage Quantity cost value of NAV RM RM % Hong Kong (continued) Financials China Overseas Prop Hldgs Ltd 2,345,000 5,835,196 5,863,250 1.05 ───────── ───────── ───────── ─────────
Technology Tencent Holdings Ltd 79,700 13,877,984 28,292,970 5.06 Xiaomi Corp 187,600 2,858,988 2,853,449 0.51 ───────── ───────── ───────── ─────────
267,300 16,736,972 31,146,419 5.57 ───────── ───────── ───────── ─────────
Korea Technology SK Hynix Inc 29,179 8,576,696 12,851,015 2.30 ───────── ───────── ───────── ─────────
Preference Shares Samsung Electronics Co Ltd - Pref Shares 125,108 21,976,083 33,014,875 5.91 ───────── ───────── ───────── ─────────
United States Consumer Goods LI Auto Inc 55,000 6,475,700 7,153,069 1.28 ───────── ───────── ───────── ─────────
Consumer Services Amazon.com Inc 936 7,879,912 12,119,200 2.17 ───────── ───────── ───────── ─────────
Technology Baidu Inc 11,508 9,414,685 10,918,808 1.95 ───────── ───────── ───────── ─────────
Total quoted equities – foreign 4,030,012 115,995,254 161,514,502 28.90 ═════════ ═════════ ═════════
Accumulated unrealised gain on quoted equities –foreign 45,519,248 ─────────
Total quoted equities – foreign 161,514,502 ═════════

30
AFFIN HWANG SELECT OPPORTUNITY FUND
NOTES TO THE UNAUDITED INTERIM FINANCIAL STATEMENTS FOR THE 6 MONTHS FINANCIAL PERIOD ENDED 31 JANUARY 2021 (CONTINUED)
7 FINANCIAL ASSETS AT FAIR VALUE THROUGH PROFIT OR LOSS (CONTINUED)
(b) Quoted equities – foreign
(ii) Quoted equities - foreign as at 31 January 2020 are as follows: Aggregate Fair Percentage Quantity cost value of NAV RM RM % Hong Kong Consumer Services Alibaba Group Holding Ltd 104,000 8,488,967 10,996,028 1.26 ───────── ───────── ───────── ─────────
Financials Ping An Insurance Grp Co China 587,500 25,648,932 27,493,896 3.14 AIA Group Ltd 222,000 9,871,468 9,106,640 1.04 CIFI Holdings Group Co Ltd 2,741,000 8,942,942 7,838,142 0.90 ───────── ───────── ───────── ─────────
3,550,500 44,463,342 44,438,678 5.08 ───────── ───────── ───────── ─────────
Technology Tencent Holdings Ltd 200,900 34,982,271 39,536,075 4.52 ───────── ───────── ───────── ─────────
Korea Technology SK Hynix Inc 47,691 14,220,408 15,325,956 1.75 Samsung Electronics Co Ltd 125,458 19,130,329 20,481,959 2.34 ───────── ───────── ───────── ─────────
173,149 33,350,737 35,807,915 4.09 ───────── ───────── ───────── ─────────
Singapore Industrials Singapore Tech Engineering Ltd 973,000 10,363,641 11,979,469 1.37 ───────── ───────── ───────── ─────────
Financials CapitaLand Retail China Trust 3,274,000 14,494,889 15,238,817 1.74 ───────── ───────── ───────── ─────────
31
AFFIN HWANG SELECT OPPORTUNITY FUND
NOTES TO THE UNAUDITED INTERIM FINANCIAL STATEMENTS FOR THE 6 MONTHS FINANCIAL PERIOD ENDED 31 JANUARY 2021 (CONTINUED)
7 FINANCIAL ASSETS AT FAIR VALUE THROUGH PROFIT OR LOSS (CONTINUED)
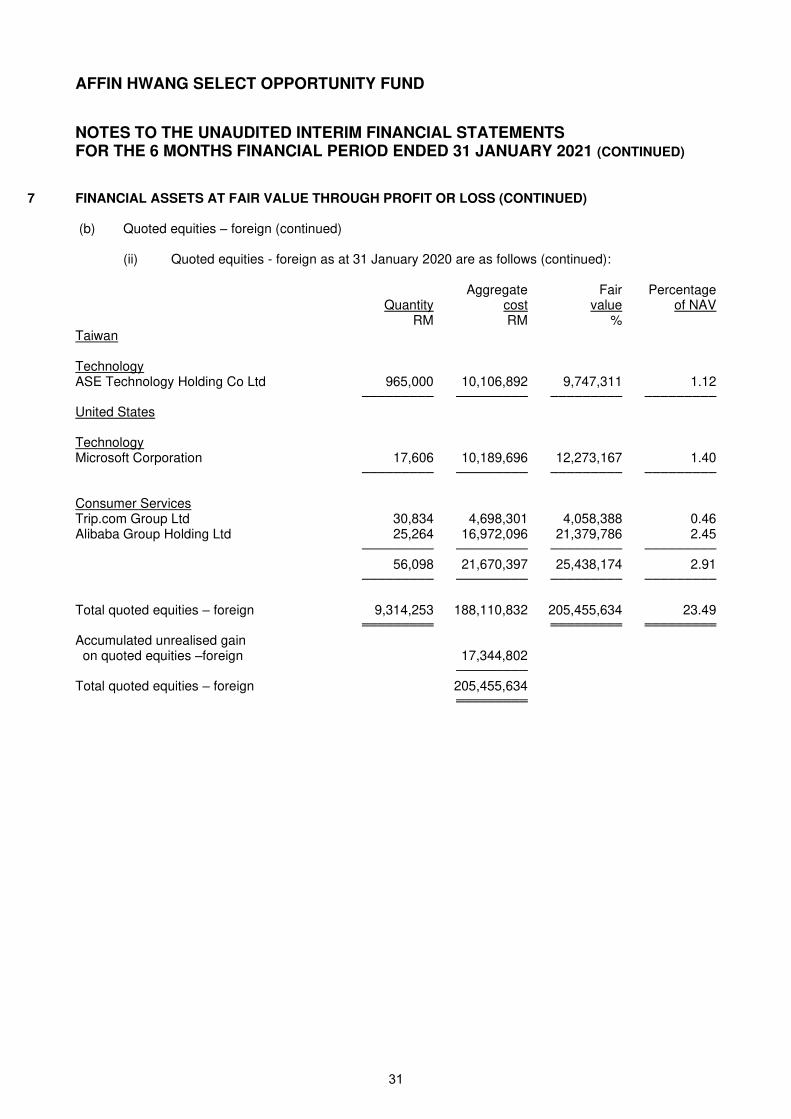
(b) Quoted equities – foreign (continued)
(ii) Quoted equities - foreign as at 31 January 2020 are as follows (continued): Aggregate Fair Percentage Quantity cost value of NAV RM RM % Taiwan Technology ASE Technology Holding Co Ltd 965,000 10,106,892 9,747,311 1.12 ───────── ───────── ───────── ─────────
United States Technology Microsoft Corporation 17,606 10,189,696 12,273,167 1.40 ───────── ───────── ───────── ─────────
Consumer Services Trip.com Group Ltd 30,834 4,698,301 4,058,388 0.46 Alibaba Group Holding Ltd 25,264 16,972,096 21,379,786 2.45 ───────── ───────── ───────── ─────────
56,098 21,670,397 25,438,174 2.91 ───────── ───────── ───────── ─────────
Total quoted equities – foreign 9,314,253 188,110,832 205,455,634 23.49 ═════════ ═════════ ═════════
Accumulated unrealised gain on quoted equities –foreign 17,344,802 ─────────
Total quoted equities – foreign 205,455,634 ═════════

32
AFFIN HWANG SELECT OPPORTUNITY FUND
NOTES TO THE UNAUDITED INTERIM FINANCIAL STATEMENTS FOR THE 6 MONTHS FINANCIAL PERIOD ENDED 31 JANUARY 2021 (CONTINUED)
8 CASH AND CASH EQUIVALENTS 2021 2020 RM RM
Cash and bank balances 19,565,841 26,405,243 Deposit with a licensed financial institution 920,132 248,088 ───────── ─────────
20,485,973 26,653,331 ═════════ ═════════
Weighted average effective interest rates per annum of deposit with a licensed financial institution are as follows: 2021 2020
% % Deposit with a licensed financial institution 1.75 2.75 ═════════ ═════════
Deposits with a licensed financial institution have an average maturity of 2 days (2020: 3 days).
9 NUMBER OF UNITS IN CIRCULATION 2021 2020 No. of units No. of units At beginning of the financial period 709,418,000 1,010,770,000 Creation of units - 9,036,000
Cancellation of units (212,123,000) (94,003,000) ────────── ──────────
At the end of the financial period 497,295,000 925,803,000 ══════════ ══════════

33
AFFIN HWANG SELECT OPPORTUNITY FUND
NOTES TO THE UNAUDITED INTERIM FINANCIAL STATEMENTS FOR THE 6 MONTHS FINANCIAL PERIOD ENDED 31 JANUARY 2021 (CONTINUED)
10 TRANSACTIONS WITH BROKERS (i) Details of transactions with the top 10 brokers for the financial period ended 31 January 2021 are as
follows: Percentage Percentage of Brokerage of total Name of brokers Value of trade total trade fees brokerage RM % RM % Affin Hwang Investment Bank Bhd# 157,947,185 16.40 392,888 18.64 HLG Securities Sdn Bhd 60,073,276 6.24 150,183 7.12 CLSA Securities (M) Sdn Bhd 58,686,660 6.09 121,086 5.74 Credit Suisse Securities (M) Sdn Bhd 56,327,322 5.85 140,818 6.68 UOB Kay Hian Securities (M) Sdn Bhd 52,745,928 5.47 131,865 6.26 Public Investment Bank Bhd 36,017,178 3.74 90,043 4.27 UBS Securities (M) Sdn Bhd 35,986,176 3.74 89,965 4.27 Robert W.Baird & Co.Inc. NY 34,248,512 3.56 3,163 0.15 Maybank Investment Bank Bhd 32,286,929 3.35 78,560 3.73 China International Co HK Sec Ltd 30,099,810 3.12 9,698 0.46 Others 408,844,231 42.44 899,818 42.68 ───────── ───────── ───────── ─────────
963,263,207 100.00 2,108,087 100.00 ═════════ ═════════ ═════════ ═════════
(ii) Details of transactions with the top 10 brokers for the financial period ended 31 January 2020 are as
follows: Percentage Percentage of Brokerage of total Name of brokers Value of trade total trade fees brokerage RM % RM % Affin Hwang Investment Bank Bhd# 229,676,632 20.27 574,192 24.11 CLSA Security Malaysia Sdn Bhd 109,583,623 9.67 124,955 5.25 Macquarie Bank Ltd HK 90,360,436 7.97 142,429 5.98 Robert W.Baird & Co.Incorporation 83,364,641 7.36 10,588 0.44 JP Morgan Securities (Asia Pacific) Ltd HK 66,516,412 5.87 381,776 16.03 Citigroup Global Markets Ltd 63,344,424 5.59 142,864 6.00 UOB Kay Hian Securotiess (M) Sdn Bhd 52,014,378 4.59 120,636 5.07 CCB International Securities Ltd 39,120,776 3.45 75,274 3.16 CLSA Singapore Pte Ltd 33,491,587 2.96 83,729 3.52 Macquarie Securities Ltd 33,350,736 2.94 35,680 1.50 Others 332,328,460 29.33 689,224.00 28.94 ───────── ───────── ───────── ─────────
1,133,152,105 100.00 2,381,347 100.00 ═════════ ═════════ ═════════ ═════════

34
AFFIN HWANG SELECT OPPORTUNITY FUND
NOTES TO THE UNAUDITED INTERIM FINANCIAL STATEMENTS FOR THE 6 MONTHS FINANCIAL PERIOD ENDED 31 JANUARY 2021 (CONTINUED)
10 TRANSACTIONS WITH BROKERS (CONTINUED) #Included in transactions with broker are trades with Affin Hwang Investment Bank Bhd, a company related
to the Manager amounting RM157,947,185 (2020: RM229,676,632). The Manager is of the opinion that all transactions with the related companies have been entered into at agreed terms between the related parties.
11 UNITS HELD BY THE MANAGER AND PARTIES RELATED TO THE MANAGER The related parties of and their relationship with the Fund are as follows: Related parties Relationship Affin Hwang Asset Management Berhad The Manager Affin Hwang Investment Bank Berhad Holding company of the Manager Affin Bank Berhad (“ABB”) Ultimate holding company of the Manager Director of Affin Hwang Asset Management Director of the Manager
Berhad The units held by the Manager and party related to the Manager as at the end of the financial period are as
follows;
2021 2020 No. of Units RM No. of. Units RM The Manager: Affin Hwang Asset Management Berhad (The unit are held legally for booking purpose) 122,684 137,872 301,489 284,787 ═════════ ═════════ ═════════ ═════════
Director of the Manager: Director of Affin Hwang Asset Management Berhad (The units are held beneficially) - - 406,383 383,869 ═════════ ═════════ ═════════ ═════════
AXA Affin Life Insurance Berhad (The units are held beneficially) 1,713,657 1,925,808 623,454 588,915 ═════════ ═════════ ═════════ ═════════
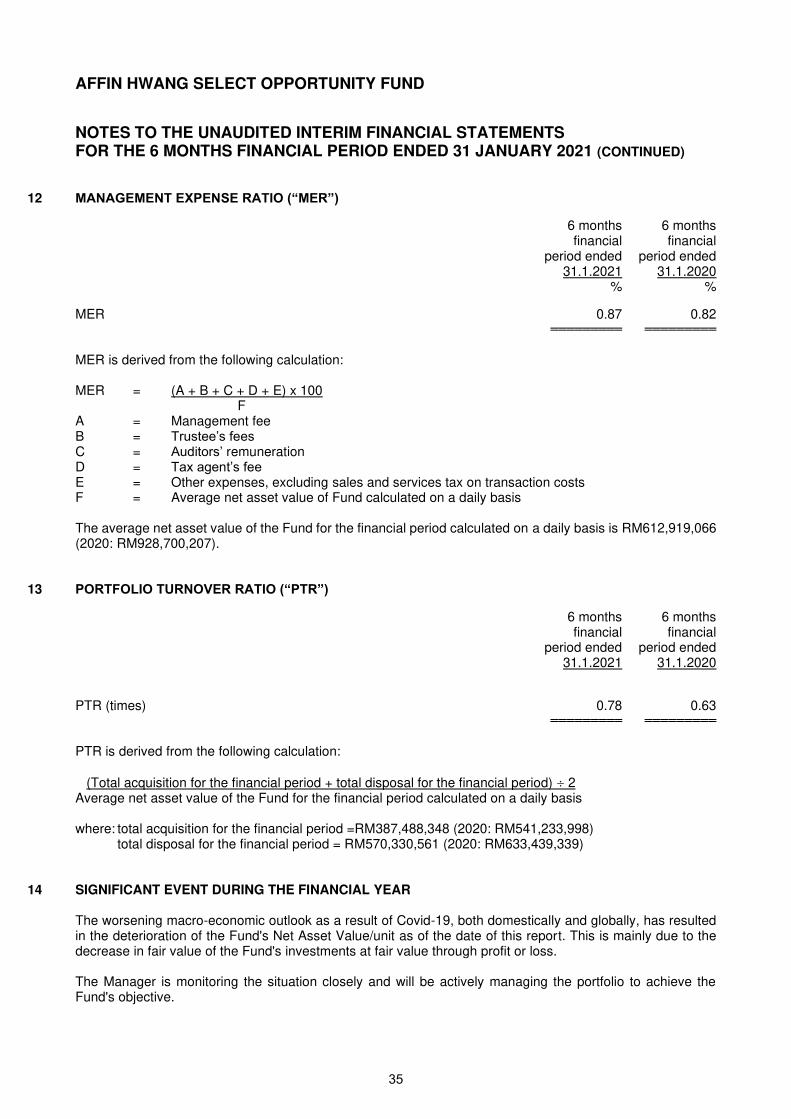
35
AFFIN HWANG SELECT OPPORTUNITY FUND
NOTES TO THE UNAUDITED INTERIM FINANCIAL STATEMENTS FOR THE 6 MONTHS FINANCIAL PERIOD ENDED 31 JANUARY 2021 (CONTINUED)
12 MANAGEMENT EXPENSE RATIO (“MER”)
6 months 6 months financial financial period ended period ended 31.1.2021 31.1.2020
% %
MER 0.87 0.82 ═════════ ═════════
MER is derived from the following calculation: MER = (A + B + C + D + E) x 100 F A = Management fee B = Trustee’s fees C = Auditors’ remuneration D = Tax agent’s fee E = Other expenses, excluding sales and services tax on transaction costs F = Average net asset value of Fund calculated on a daily basis The average net asset value of the Fund for the financial period calculated on a daily basis is RM612,919,066
(2020: RM928,700,207).
13 PORTFOLIO TURNOVER RATIO (“PTR”)
6 months 6 months financial financial period ended period ended 31.1.2021 31.1.2020
PTR (times) 0.78 0.63 ═════════ ═════════
PTR is derived from the following calculation:
(Total acquisition for the financial period + total disposal for the financial period) 2 Average net asset value of the Fund for the financial period calculated on a daily basis where: total acquisition for the financial period =RM387,488,348 (2020: RM541,233,998) total disposal for the financial period = RM570,330,561 (2020: RM633,439,339)
14 SIGNIFICANT EVENT DURING THE FINANCIAL YEAR The worsening macro-economic outlook as a result of Covid-19, both domestically and globally, has resulted in the deterioration of the Fund's Net Asset Value/unit as of the date of this report. This is mainly due to the decrease in fair value of the Fund's investments at fair value through profit or loss. The Manager is monitoring the situation closely and will be actively managing the portfolio to achieve the Fund's objective.
36
AFFIN HWANG SELECT OPPORTUNITY FUND
STATEMENT BY THE MANAGER I, Teng Chee Wai, for and on behalf of the board of directors of the Manager, Affin Hwang Asset Management Berhad, do hereby state that in the opinion of the Manager, the financial statements set out on pages 1 to 35 are drawn up in accordance with the provisions of the Deeds and give a true and fair view of the financial position of the Fund as at 31 January 2021 and of its financial performance, changes in equity and cash flows for the financial period ended 31 January 2021 in accordance with Malaysian Financial Reporting Standards and International Financial Reporting Standards. For and on behalf of the Manager, AFFIN HWANG ASSET MANAGEMENT BERHAD TENG CHEE WAI EXECUTIVE DIRECTOR/MANAGING DIRECTOR Kuala Lumpur 15 March 2021

DIRECTORY OF SALES OFFICE HEAD OFFICE Affin Hwang Asset Management Berhad Ground Floor Tel : 03 – 2116 6000 Menara Boustead Fax : 03 – 2116 6100 69, Jalan Raja Chulan Toll free no : 1-800-88-7080 50200 Kuala Lumpur Email:[email protected] PENANG Affin Hwang Asset Management Berhad No. 10-C-24 Precinct 10 Jalan Tanjung Tokong Tel : 04 – 899 8022 10470 Penang Fax : 04 – 899 1916 PERAK Affin Hwang Asset Management Berhad 1, Persiaran Greentown 6 Greentown Business Centre Tel : 05 – 241 0668 30450 Ipoh Perak Fax : 05 – 255 9696 MELAKA Affin Hwang Asset Management Berhad Ground Floor, No. 584, Jalan Merdeka Taman Melaka Raya Tel : 06 – 281 2890 / 3269 75000 Melaka Fax : 06 – 281 2937 JOHOR Affin Hwang Asset Management Berhad Unit 22-05, Level 22 Menara Landmark No. 12, Jalan Ngee Heng 80000 Johor Bahru Tel : 07 – 227 8999 Johor Darul Takzim Fax : 07 – 223 8998 SABAH Affin Hwang Asset Management Berhad Lot No. B-2-09, 2nd Floor Block B, Warisan Square Jalan Tun Fuad Stephens 88000 Kota Kinabalu Tel : 088 – 252 881 Sabah Fax : 088 – 288 803

DIRECTORY OF SALES OFFICE (CONTINUED) SARAWAK Affin Hwang Asset Management Berhad Ground Floor, No. 69 Block 10, Jalan Laksamana Cheng Ho 93200 Kuching Tel : 082 – 233 320 Sarawak Fax : 082 – 233 663 Affin Hwang Asset Management Berhad 1st Floor, Lot 1291 Jalan Melayu, MCLD 98000 Miri Tel : 085 – 418 403 Sarawak Fax : 085 – 418 372