ii. materials and methods - shodhgangashodhganga.inflibnet.ac.in/bitstream/10603/371/9/09_chapter...
TRANSCRIPT

II. MATERIALS AND METHODS

- - MATERIALS AND METHODS
The test organisms selected for the present investigation include five
fresh water microalgae viz. (;hlorella ellipsoidea Gerneck, C:hlorococum humicola
(Naeg.) Rabenhorst, Scenedesmus bijuga (Turp.) Lagerheim, Ankistrodesmus
falcatus (Corda.) Ralfs and Haematococcus laccustris (Girod.) Rostafinski- all
belonging to the class Chlorophyceae.
2.1 Isolation of pure cultures of test organisms
The pure cultures of the test organisms were isolated from water samples
collected from different freshwater ponds in and around Kotlayam. Small quantities
of water samples were kept in sterilized petridishes enriched with a pinch of KNO,.
The samples were exposed to fluorescent light for incubation without any
disturbance. The isolation methods were based on bacteriological techniques (Stein,
1973; Gopinathan, 1982; APHA, 1980). The algal colonies were examined under
light microscope and identified with the help of morphological descriptions given by

Fritsch (1935) and Prescott (1982). The pure cultures of algae obtained were used
to establish stock cultures.
Systematic positions of the isolated algae (Fritsch, 1935) are as follows:
Chlorella ellipsoidea Gerneck
Division - Chlorophyta
Class - Chlorophyceae
Order - Chiorococcales
Family - Chlorellaceae
Chlorococcum humicola (Naeg.) Rabenhorst
Division - Chlorophyta
Class - Chlorophyceae
Order - Chlorococcales
Family - Chlorococcaceae
Scenedesmus bijuga (Turp.) Lagerheirn
Divls~on - Chlorophyta
Class - Chlorophyceae
Order - C.hlorococcales
Family - Coelastraceae
Ankistrodesmus falcatus (Corda.) Ralfs
Dlvlsion - C;hlorophyta
Class - C:hlorophyceae
: 19 ::

Order - ChYorococcales
Family - Selenastraceae.
Haematococcus laccustris (Girod.) Rostafinski
Division - Chlorophyta
Class - Chlorophyceae
Order - Volvocales
Family - Selenastraceae
2.2 Culture conditions
Different culture media like Miquel's medium (Miquel, 1980), Walne's
medium (Walne, 1974) and Ward and Parish medium (Ward and Parish, 1982)
were tried for culturing the test algae. Of these, Ward and Parish medium was
found to be most suitable for the algal growth and hence both mother cultures and
experimental cultures were ra~sed in this medium.
The composition of Ward and Parish medium is as follows:
Macronutrients
1. NaNO 3 - 25.5 glL
2. MgCI,. 6H,O - 12.2 g/L
3. Mg S0,.7H20 - 14.7 glL
4. Ca CI2.2H,O - 4.41 g/L
5. NaHCO, - 15.OglL
6. K,H PO, - 1.044 g/L

Micronutrients
1. COCI, - 0.78glL
2. CuCI, - 0.9 gI100 ml. Dilute 1 ml of this solution to one
litre for making stock solution.
3. a. H,BO, - 0.1855g
b. MnCI, - 0.26439
c. ZnCI, - 0.327g
d. Na, MOO,. H 0 2
- 0.00739
e. FeCI, - 0.0960g
f . Na,EDTA - 0.300 g
g. Micronulrient solution 1 and 2 - 1 ml each
h. Distilled water - 1 litre
The maintenance and test medium were prepared by adding one millilitre
of each macronutrient solution and one millilitre of micronutrient stock solution to
one litre double distilled deionised water. Both the stock cultures and experimental
cultures were marntained in "Borosil" conical flasks plugged with sterilized non-
absorbant cotton (plate2la). The stock cultures were recultured fortnightly. All the
cultures were illuminated with daylight fluorescent tubes with an intensity of 2000
lux. The ambient temperature ranged from 28 OC to 32 OC. The duration of light and
dark period was 10:14 hours. The cultures were shaken manually three to four
times a day to provide a uniform suspension.
2.3 Effluents
The effluents used for the exper~ments were collected from the following
factories.
21

1. Hindustan Newsprint Limited, Velloor, Kottayam.
2. Hindustan Organic Chemicals Limited, Irumpanam, Ernakulam and
3. Mc Dowells Distilleries, Varanad, Cherthala.
The selected algae were treated with different concentrations of the
effluents (0.05%, 0.1%, 0.2!i0/0, 0.5%, 0.75%, I .0% and 1.5%).
2.4 Algal bioassay procedures
Different species of algae were exposed to different concentrations of
effluents to study their effect on each alga. The bioassays were always of the static
type (Reish and Oshida, 1986).
Initially a range-finding test was conducted to determine the
concentrations of the test materials to be used in the definitive tests (Ward and
Parish, 1982 and Reish and Oshida, 1986). The concentrations selected for the
range - finding tests were 0.1%, I%, 10% and 100% of effluents and a control with
out the effluents. Each flask was inoculated with equal quantity of algal cells and
incubated for 96 hours. The growth in each test flask was compared with that
occurred in the control flask. Definitive tests were conducted using concentrations
selected from the results of the range - finding tests (Ward and Parish, 1982; APHA, 1980).
Clean, sterilized '1000 ml "Borosil" conical flasks were filled with 400ml
culture medium. Required volume of effluent was added to the medium with the
help of micropipettes. A known number of microalgal cells was inoculated from a
stock culture kept in exponential growth phase. The flasks were shaken thoroughly
and incubated. All the experimental concentrations and control were maintained in

triplicate. All the cultures were hand shaken to keep the cells in suspension. Duration
of the experiment was 21 days. Cell counts were made on alternate days and other
parameters were measured at 4 -day intervals. Experimental set up is as shown in
Plate 2.1 b.
2.5 Growth measurements
2.5.1 Cell number
To determine the growth in terms of cell number, 1 ml of sample was
taken from each conical flask. The cells were fixed in Lugol's iodine solution and
counted with a calibrated haemocytometer. Four counts were made from each
sample and the mean value was taken
2.5.2 Productivity
Primary production or productivity was estimated using light anddark
bottle method (Gaarder and Gran, 1927). Three samples - initial, light and dark
were taken from each flask and were analysed for the dissolved oxygen content
using Winkler method. The oxygen values were converted into their carbon
equivalents, using the following formula :
\JLB - VDB x 0.536 GPP (mg C IL ih) =
NPP (mg CIL Ih) = - PQ x N
VLB. VDB & VIB I= quantity of Na2S20, titrate values obtained from
titration of light, dark and initial bottles respectively,

N = incubation period
PQ = Photosynthetic quotient (1.25)
0.536 = Factor to convert mg of oxygen to mg of carbon
2.5.3 Pigment analysis
Determination of quantitative variation of algal pigments was done by
spectrophotometric analysis (Parsons eta/. , 1984).
10ml samples from the control and othertest concentrations were taken.
To the algal pellet 90% acetone was added and kept in dark in a refrigerator for 20
hours for the completion of p~gment extraction. Prior to spectrophotometric analysis,
all extracts were centrifuged for 10-15 minutes at 4000 rpm.
The absorbance of the clear pigment extract was measured against blank
at different wavelengths such as 480, 510, 630, 647, 664 and 750 nm. The
concentrations of various pigments were then calculated using the equation given
by Parsons et a/. (1 984).
2.5.4 Estimation of biochemical compounds
2.5.4.a Protein
The protein was estimated by heated biuret folin method (Dorsey et al.,
1978). This method consistently measures 90% of the total nitrogen of filtered algal
samples as protein - nitrogen without the need of mechanical disruption, as long as
the heating period in biuret is 100 minutes at 100°C.
The algal cells were concentrated by centrifugation. 'The volumes of the
reagents added were as per VVinkfors eta/. , (1984). The protein was extracted with
24 : :

appropriate reagents at 100°C in a water bath for 100 minutes. The intensity of
colour was measured at 660 nm. Protein - nitrogen values were reckoned by
interpolations from a standard graph, prepared with different concentrations of
Bovine Serum Albumin. The protein was then calculated by using a conversion
factor 6.58 generally accepted for most algal species (Dorsey eta/. 1978).
2.5.4.b. Carbohydrate
Carbohydrate determination was made using phenol-sulphuric acid
method reported by Kochert (1978) based on the procedure developed by Dubois
et a/. (1956).
10 ml of the sample was centrifuged and the algal pellet was homogenized
in one ml of 80% sulphuric acid (Myklestad and Haug, 1972) and the total amount
of carbohydrate in the solution was measured by phenol sulphuric acid method.
The absorbance was read at 485 nm. Standard curve was prepared with glucose
solution of known concentrations, by which unknown concentration of carbohydrate
was calculated.
2.5.5 Photomicrography
In order to visualize the morphological changes occurred in the algal
cells, which were exposed to effluents, photomicrographs of all the test species
were taken, using an inverted microscope (Leica, Germany) with Kodak 200 COlOUrfilm~.
2.5.6 Statistical analysis
Statlstlcal analys~s of the data was carried out by 3-way ANOVA to
compare the s~gniflcance in different parameters between species, between different
25

concentrations of the effluent and between different days and the first order
interaction in pairs of the three factors viz. species, concentration levels and days
(Snedecor and Cochran, 1967; Jayalakshmi, 1998). Student's t - test was applied
to compare the significance of difference between species in pairs, between days
in pairs and between concentrations in pairs for the different parameters (Fisher
and Yates, 1963; Sokel and Roholf, 1981). Trelli's diagram was used for the graphic
representation of the significance of observed differences in terms of t- statistic
values (Sanders, 1968).
Arithmetic method, Logarithmic method and Probit method were used to
calculate 96 hour EC,,values. Probit method was used to compute confidence limit
(Reish and Oshida, 1986).
2.6 Physico-chemical characteristics of water in the studied sites
With a view to understand the effect of effluents on phytoplankton in the
natural water sources, water samples were collected from three different study
areas. The study areas were designed on the basis of discharge of effluents from
factories Into the natural water sources.
Hindustan Newsprint Limited, Velloor, situated on the banks of
Muvattupuzha river, is discharging its effluent into the same (Plate 2.2). Hindustan
Organic Chemicals Limited Irumpanam, which is manufacturing phenol and acetone,
is giving out the effluent into Chitrapuzha river (Plate 2.3). The effluent from
Mc Dowells Distilleries, Varanad is sending out the effluent into Vembanad estuary
(Plate 2.4). In all the above study areas, four stations were fixed for the collection
of water samples (Fig 2.1 to 2.4).

The present study ,was conducted for a period of 'twelve months from
January 2001 to December 2001. In order to find out the seasonal variations, the
study period was categorized into three seasons viz. pre-monsoon (February to
May), monsoon (June to September) and post monsoon (October to January). The
samples were collected once in every fortnight and average values reckoned in
presenting the results.
Water samples were collected from the surface layers from the different
sampling stations. Samples were collected in polyethylene bottles, after washing
the bottles with the same water. The sampling was done uniformly between 07.00
hours to 09.00 hours.
2.6.1 Water temperature
The temperature of the water samples was measured using a centigrade
thermometer graduated from 0 to 50°C. Immediately after collecting the water sample
in a narrow mouthed polyethylene bottle, the thermometerwas introduced into the
water column up to 5cm.
Hydrogen ion concentration of the water sample was recorded
immediately after collecting the sample with a pH meter.
2.6.3 Dissolved Oxygen
The dissolved oxygen was estimated by Winkler method (Strickland and
Parsons, 1968). The dissolved oxygen was fixed with manganous sulphate solution
and alkali iodide azide reagent immediately after the collection of water samples.

2.6.4 Free CO,
Free CO, was determined with NaOH reagent and phenolphthalein
indicator (Golterman et al., 1978). 3-4 drops of phenolphthalein indicator was added
to the sample and titrated with NaOH till the appearance of a pink colour.
2.6.5 Alkalinity
The amount of acid required to titrate the bases of the given watersample
is a measure of its alkalinity. Bicarbonates, carbonates, and sodium hydroxides are
considered to be the chief bases in natural water. Alkalinity was determined based
on the procedure of Golterman eta/., (1978). The titration was conducted in two
steps with phenolphthalein and methyl orange indicators. Total alkalinity was
determined from the above titre values.
2.6.6 Hardness
The concentration of calcium and magnesium expressed as equivalent
to CaCO, is considered as a measure of total hardness and it was calculated
following APHA (1979). The calcium and magnesium ions of the samples were
titrated with ethylene diamine tetra-acetic acid disodium salt to form the stable Ca
EDTA, Mg EDTA. A small quantity of Eriochrome black-T added to the water sample
would lead to a soluble wine red complex with some of calcium and magnesium
ions. During titration EDTA will complex all of the Ca2+ and the solution will turn blue
at the end point.
2.6.7 Chloride
The chloride content of the water samples combines with the silver of
the silver nitrate reagent leading to a white precipitate of silver chloride. When all
: 28 ::

the chlorides are used up, the excess silver combines with chromate indicator to
produce a pinkish orange coloured silver chromate. The analysis was based on
Golterman eta/.. (1978).
2.6.8 Nitrite
Nitrite was estimated by Azo dye method (Bendschneider and Robinson,
1952). The determination is based on the classical Griess's reaction in which the
nitrification at pH 1.5 to 2.0 i s diazotised with sulphanilamide resulting in diazo
compound which is allowed to react with N-I-naphthyl ethylene diamine (NNED) to
form high coloured azo-dye as end product. The extinction of the end product is
measured at 543 nm in the spectrophotometer.
2.6.9 Nitrate
Nitrate was estimated following the method of Mullin and Riley (1955).
The nitrate present in the water is reduced quantitatively into nitrite by hydrazine in
the presence of copper ion as catalyst. The nitrite thus produced is determined by
diazotizing with sulphanilamide and coupling with NNED to form a highly coloured
azodye as an end product. The extinction of the end product is measured at 543 nm
in the spectrophotorneter~
2.6.10 Phosphate
The method of ph~~sphate estimation described by Murphy and Riley
(1962) and followed by Strickland and Parsons (1968) was used for the analysis.
The phosphate in the sample was allowed to react with a minimum molybdate forming
a complex hetropoly acid compound. The compound, reduced by ascorbic acid in the
29 :

presence of antimony1 tartarate as catalyst, produces a blue colour at the end point.
The absorbance of the final product was measured using a spectrophotometer
at 885 nm.
2.6.11 Silicate
Silicate was determined following the method described by Strickland
and Parsons (1968). The water sample was allowed to react with acid molybdate
solution, which resulted in the formation of silicomolybdate, phosphomolybdate and
arsenomolybdate complex. A reducing solution containing rnetol and oxalic acid
was added which subsequently reduced the silicomolybdate complex to produce
blue colour compound as end product.
2.6.12 Primary production
Primary production was estimated following the technique of light and
dark bottle method (Gaarder and Gran, 1927).
2.6.13. Total dissolved and suspended solids
The quantity of total dissolved solids is an estimate of dissolved organic
and inorganic matter in the sample. To determine the total dissolved solids, the
sample was filtered through a glass fibre filter to remove the particulate matter, and
the filtrate was evaporated. The weight of the residue was then calculated. In order
to estimate the total suspended solids, the glass fibre filter used in the previous
experiment was weighed after drying in an oven at 105'~.

, .. -..
i - I ' -. . .
2.6.14 Biochemical Oxygen Demand (BOD) . . , . , \. ~'~
, ,.. , " . * , '.<
-._ .,;.
Five day biochemical oxygen demand test was done follow;^ t?i&'i&ih&
of Young etal. (1 981). The dissolved oxygen of the sample was determined before
and after 5 days of incubation (Strickland and Parsons, 1968).
2.6.15 Chemical Oxygen Demand (COD)
The chemical oxygen demand is a measure of the total amount of oxygen,
which is required to completely oxidise all the oxygen matter in a sample to CO,
and H,O. It is based on the principle that almost all organic compounds in water
can be oxidised to CO, and water by the action of strong oxidising agents under
acid conditions. The excess chromate can be measured by back titration with ferrous
ammonium sulphate using ferroin indicator to detect the end point (Ruttanagosrigit
and Boyd, 1989).
2.6.16 Phytoplankton count
The samples were kept undisturbed for one day in darkness for
sedimentation. The supernatant was decanted. The sedimented portion was shaken
well and transfered carefully to a lOOml beaker. This was left undisturbed overnight.
The beaker was covered with an aluminium foil. The supernatant was poured into
another beaker (100ml) and was observed under light microscope.

PLATE - 2.1
a. Stock cultures of test organisms
A. Chlorella ellil~soidea Gerneck
B. Ankistrodesmus falcatus (Corda.) Ralfs
C . Scenedesrnus bijuga (Turp.) Lageheim
D. Haematococcus laccustris (Giropd.) Rostafinski
E . Chlorococcum humicola (Naeg.) Rabenhorslt
b. Experimental set up
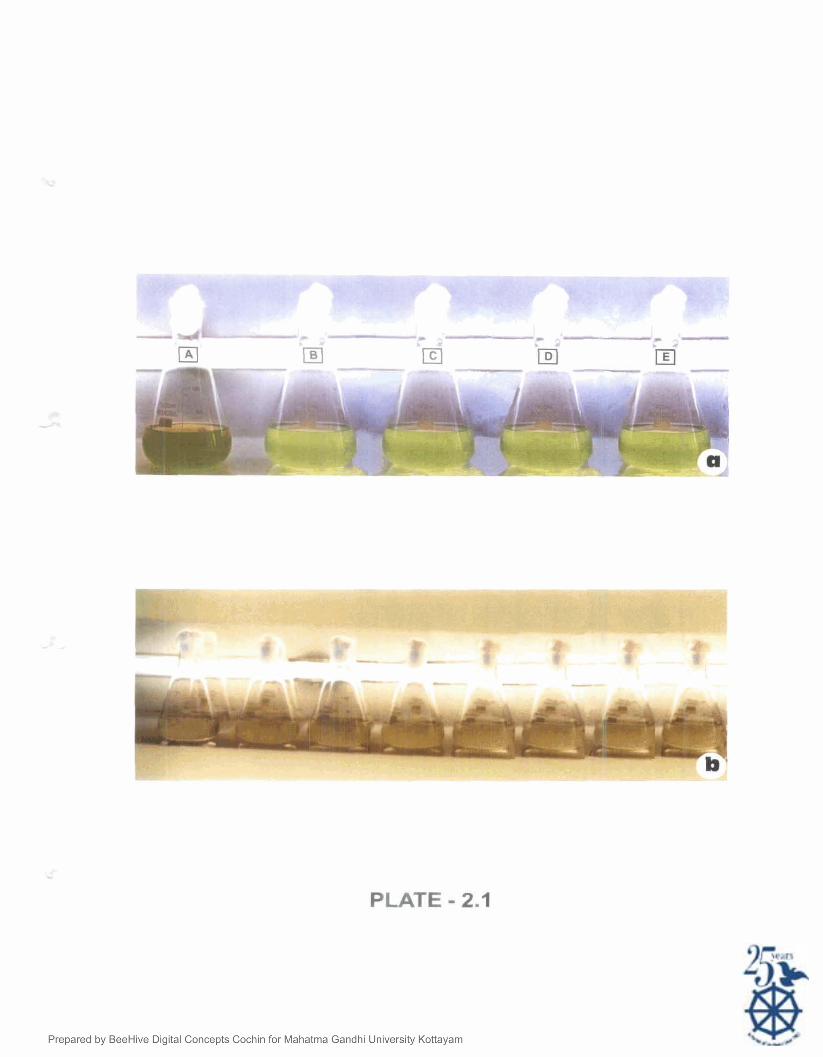
PLATE - 2.1

PLATE - 2.2
a. Muvattupuzha river
b. Pulp-paper mill fasctory (Hindustan Newsprint Limited)

PLATE - 2.2

PLATE - 2.3
b. Chitrapuzha river
a Petrochemical factory (Hindustan Organic Chemicals Limited)
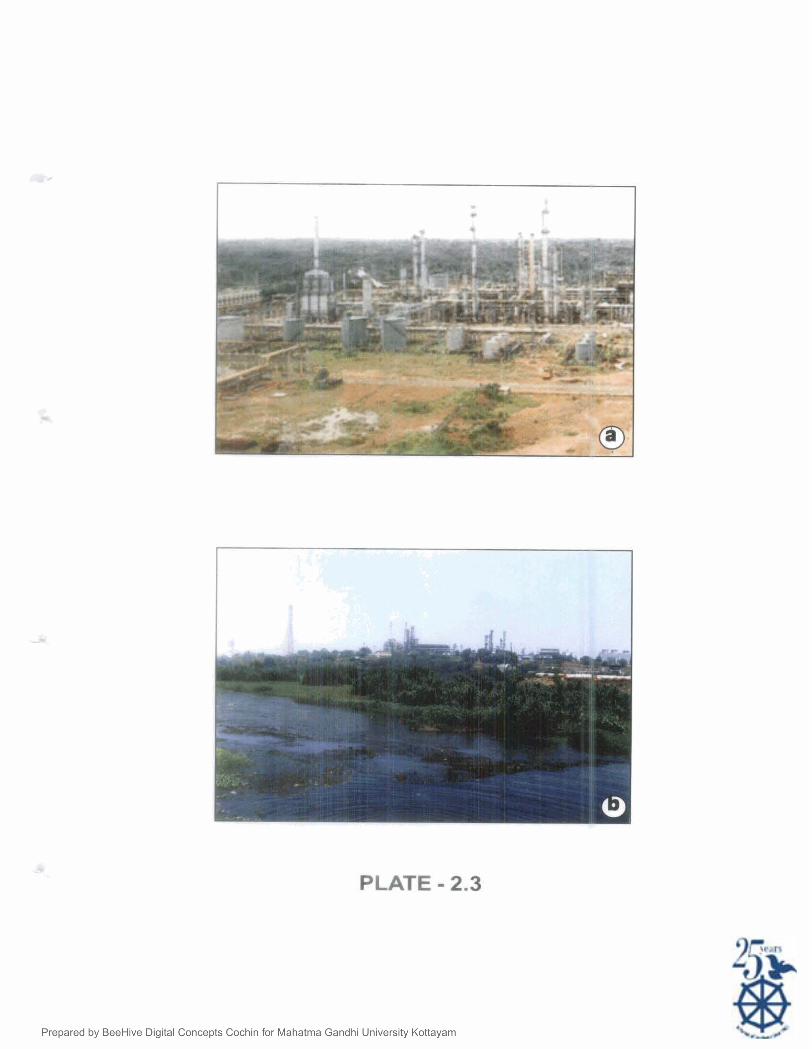
PLATE - 2.3

PLATE - 2.4
a. Cochin estuary
b. Distillery (Mc Dowells Distillery)

PLATE - 2.4

Fig. 2.1 Cochin estuary

Fig. 2.2 Muvattupuzha river showing sampling stations

