ii. analysis using - minister of economy, trade and industry · ii. analysis using updated...
TRANSCRIPT

- 1 -
II. Analysis using Updated Input-Output Tables
1. Impact of Japanese exports' structural change on domestic production
With increased economic globalization, the economic interdependence between Japan and other countries—
especially China and the U.S.—has been growing through trade. How are these shifts and developments in the
structure of exports impacting Japanese domestic production?
First, we use the Trade Statistics to gain an overview of the changes in the value of Japanese exports and shifts in
its structure between 2000 and 2012. We then conduct a detailed analysis of these changes, using mainly the 2010
Updated Input-Output Table (at constant price) we created (hereafter referred to as the 2010 Updated Table) to
understand their impact on domestic production.
Specifically, by capturing the structure of Japanese exports in terms of the composition of destinations (exports by
destination) and the composition of commodity exports (exports by sector), we will conduct an analysis that includes
the following steps:
(i) Use the composition of destinations and the composition of commodity exports in the Trade Statistics to
understand the changes in the value of Japanese exports and the shifts in its structure.
(ii) In order to assess the impact of exports' structural change on domestic production, calculate export ratios, the
value of domestic production induced by exports, the production inducement dependency on individual final
demand items, and the production inducement coefficient for exports, using data from the 2010 Updated Table,
the 2005 Input-Output Table (Basic Table) and the 1995-2000-2005 Linked Input-Output Table, and analyze
factors contributing to variations in domestic production induced by exports and production inducement
dependency on exports.
In an analysis by destination and by sector, however, a time-series comparison between three individual years is
not possible because the 1995-2000-2005 Linked Input-Output Table' statistical concepts, including sector definitions
and destination categories, are different from those of the 2005 Input-Output Table and the 2010 Updated Table. As
such, we only analyze 2005 and 2010 data.

- 2 -
(1) Changes in the value of exports and shifts in its structure as seen in the Trade Statistics
The share of exports to China rises, while the share of exports to the U.S. falls
Looking at changes in the value of Japanese imports and exports between 2000 and 2012 using the Trade
Statistics (Figure 1) shows that after hitting bottom at 48.9792 trillion yen in 2001, the value of exports1
continued to rise until 2007 when it marked 83.9314 trillion yen (1.7 times increase from 2001 to 2007).
Affected by the financial shock following the collapse of Lehman Brothers, the value of exports declined for
two consecutive years in 2008 and 2009. It began to pick up in 2010 at 67.3996 trillion yen but took a
downward turn again in 2011, recording 63.7436 trillion yen in 2012. This was a decrease for the second year in
a row.
The value of imports, on the other hand, grew during the period from 2003 to 2008, marking an all-time high
in 2008. Hit by the financial shock following the collapse of Lehman Brothers, the value of imports saw a
significant drop in 2009—a year later than exports. But it began to rise again in 2010 and continued to grow in
2011 and 2012, marking an increase for the third year in a row.
Figure 1. Changes in imports and exports
40
45
50
55
60
65
70
75
80
85
90
2000 2001 2002 2003 2004 2005 2006 2007 2008 2009 2010 2011 2012
Exports
Imports
67.3996
48.9792
54.1796
83.9314
( trillion yen)
63.7436
Source: Trade Statistics (Ministry of Finance)
1 The value of exports in the Trade Statistics corresponds roughly to "ordinary trade" under "exports" ( see Note 3, Table 1-1 on Page 2 for the definition) in the Input-Output Tables.

- 3 -
Looking at the changes in the value of Japanese exports by destination between 2000 and 2012 (Figure 2),
the value of US-bound exports was the highest in the early years. However, while growth in exports to China,
Asia (excluding China), and other destinations was relatively strong between 2002 and 2007, US-bound exports
saw slower growth during the same period.
In 2008, growth was only seen in exports to China and those to other destinations. In 2009, while a decline
was seen in exports to all destinations, the pace of decline in China-bound exports was smaller than that in
exports to other destinations. Helped by these, China-bound exports overtook US-bound exports, marking the
highest levels since then.
After exports to all destinations began to pick up in 2010, exports to China, Asia (excluding China), and other
destinations fell for two consecutive years in 2011 and 2012. US-bound exports declined in 2011 but rose in
2012. Exports to the EU increased in 2011 but contracted in 2012.
Figure 2. Changes in exports by destination
0
5
10
15
20
25
30
2000 2001 2002 2003 2004 2005 2006 2007 2008 2009 2010 2011 2012
U.S.
China
Asia (excl. China)
EU
Other destinations
( trillion yen)
Source: Trade Statistics (Ministry of Finance)
The changes in the breakdown of exports by destination (Figure 3) shows that during the period from 2000 to
2012, the share of exports to China rose from 6.3% to 18.1%, up 11.9 percentage points, while the share of
exports to the U.S. declined from 29.7% to 17.5%, down 12.2 percentage points. In 2009, the share of China-
bound exports (18.9%) overtook that of US-bound exports (16.1%).

- 4 -
Figure 3. Changes in the breakdown of exports by destination
29.7 30.0 28.5 24.6 22.4 22.5 22.5 20.1 17.5 16.1 15.4 15.3 17.5
6.3 7.7 9.6 12.2 13.1 13.5 14.3 15.3 16.0 18.9 19.4 19.7 18.1
34.8 32.6 33.5 34.3 35.4 35.0 33.2 32.8 33.3 35.3 36.7 36.3 36.6
16.3 15.9 14.7 15.3 15.5 14.7 14.5 14.8 14.1 12.5 11.3 11.6 10.2
12.8 13.7 13.7 13.7 13.6 14.3 15.4 17.0 19.0 17.3 17.2 17.1 17.6
0%
10%
20%
30%
40%
50%
60%
70%
80%
90%
100%
2000 2001 2002 2003 2004 2005 2006 2007 2008 2009 2010 2011 2012
Other destinations
EU
Asia (excl. China)
China
U.S.
Source: Trade Statistics (Ministry of Finance)
Here we look at the breakdown by commodity of Japanese exports to the world, China and the U.S. between
2000 and 2012 (Figure 4).
The percentage breakdown of the world total shows that over the 12 years, chemicals was up from 7.4% to
10.0%, manufactured goods was up from 9.8% to 13.2%, and transport equipment was up from 21.0% to
23.5%. In contrast, electrical machinery was down from 26.5% to 17.9%, and machinery was down from
21.5% to 20.1%. In 2012, transport equipment (23.5%) accounted for the largest share, followed by machinery
(20.1%) and electrical machinery (17.9%).
The percentage breakdown of China-bound exports shows that while chemicals (13.1%) and electrical
machinery (27.5%) accounted for large shares in 2000 compared to their respective shares in the world total,
transport equipment rose significantly over the 12 years from 3.9% to 9.6%. In 2012, electrical machinery
(23.7%) accounted for the largest share, followed by machinery (20.7%) and chemicals (13.9%).
The percentage breakdown of US-bound exports shows that transport equipment, which already accounted
for a large share in 2000 at 30.7%, expanded its share to 40.8% in 2007. The breakdown by commodity did not
change much over the years. In 2012, transport equipment (37.5%) accounted for the largest share, followed by
machinery (23.8%) and electrical machinery (15.3%).

- 5 -
Figure 4. Breakdown by commodity of exports to the world, China and the U.S.
Source: Trade Statistics (Ministry of Finance)
(2) Analysis of the impact of Japanese exports' structural change on domestic production using Input-Output
Tables
Here we present a detailed quantitative analysis of the shifts in the structure of Japanese exports observed in
the Trade Statistics while taking into account the structural changes in domestic production, using mainly the
2010 Updated Table we created. Unless otherwise specified, "exports" mean "exports (ordinary trade)" below.
First, we look into Japanese exports' impact on domestic production using the 1995-2000-2005 Linked Input-
Output Table, the 2005 Input-Output Table, and the 2010 Updated Table.
We then analyze Japanese exports by sector and destination, using the 2005 Input-Output Table (Basic Table)
Wor
ld to
tal
Chi
na
U.S
.
13.1 12.7 12.5 11.6 12.4 13.0 13.1 14.1 12.6 14.0 12.9 13.1 13.9
22.9 22.2 19.5 16.6 16.3 16.5 16.2 15.4 16.1 15.6 14.6 14.2 13.8
19.5 20.2 20.9 22.3 23.1 21.3 20.4 18.6 18.7 17.7 22.4 24.3 20.7
27.5 26.2 26.8 28.3 26.3 25.9 27.2 27.4 25.5 25.0 23.5 22.7 23.7
3.9 4.3 6.0 6.7 5.7 5.0 5.8 6.4 7.4 9.2 10.2 9.8 9.6
13.1 14.4 14.3 14.6 16.3 18.4 17.3 18.0 19.7 18.5 16.5 16.0 18.2
0%
20%
40%
60%
80%
100%
2000 2001 2002 2003 2004 2005 2006 2007 2008 2009 2010 2011 2012
Chemicals Manufactured goods Machinery Electrical machinery Transport equipment Other
7.4 7.8 8.1 8.4 8.7 8.9 9.0 9.2 9.0 10.7 10.3 10.4 10.0 9.8 10.5 10.7 10.6 10.9 11.3 11.5 11.8 12.6 13.0 13.0 13.4 13.2
21.5 21.3 20.7 20.6 21.0 20.3 19.7 19.8 19.7 17.8 19.8 21.1 20.1
26.5 24.0 23.3 24.0 23.9 22.2 21.4 20.2 19.0 19.9 18.8 17.7 17.9
21.0 23.2 25.4 24.7 23.5 23.1 24.2 24.8 24.8 21.9 22.6 21.4 23.5
13.9 13.2 11.8 11.7 12.0 14.2 14.2 14.2 15.1 16.8 15.5 16.1 15.2
0%
20%
40%
60%
80%
100%
2000 2001 2002 2003 2004 2005 2006 2007 2008 2009 2010 2011 2012
Chemicals Manufactured goods Machinery Electrical machinery Transport equipment Other
4.5 4.6 4.9 5.6 5.5 5.1 4.7 4.9 5.5 6.7 6.4 6.0 5.3 5.5 5.5 5.4 5.6 5.8 5.8 5.9 5.9 6.4 6.7 7.2 7.9 7.6
22.0 22.0 21.3 21.1 22.2 22.6 21.5 21.0 21.5 20.5 21.5 24.7 23.8
23.2 19.1 17.4 17.6 18.4 17.5 15.9 15.6 16.1 16.5 15.8 15.4 15.3
30.7 34.4 39.1 38.4 36.2 36.9 40.4 40.8 38.7 35.4 36.6 34.2 37.5
14.2 14.5 11.9 11.7 11.9 12.1 11.5 11.8 11.8 14.1 12.5 11.8 10.5
0%
20%
40%
60%
80%
100%
2000 2001 2002 2003 2004 2005 2006 2007 2008 2009 2010 2011 2012
Chemicals Manufactured goods Machinery Electrical machinery Transport equipment Other

- 6 -
and the export matrix by destination2—which was created by consistently reorganizing the 2010 Updated Table
data and the Trade Statistics data in terms of sectors and destinations and putting them into Input-Output Tables.
In the export matrix by destination, China-bound exports include those to Hong Kong. This is because the
export matrix by destination used to have a destination category "China (including Hong Kong)."
Reorganizing the Trade Statistics data according to the sector classification used in the Updated Input-Output
Tables allows for a comprehensive and quantitative analysis of the imports and exports' relationship with
domestic production—specifically the impact of changes in Japanese imports and exports and in their structure
on domestic production—using the Updated Input-Output Tables. A further breakdown of imports and exports
by destination allows for a consistent and quantitative comparative analysis of the changes in imports and
exports by destination and the shifts in their structure by destination, using the Updated Input-Output Tables.
Below we present charts that illustrate the changes in exports by destination (Figure 5), the breakdown of
exports by destination (Figure 6), and the sector-by-sector breakdown of exports to the world, China and the U.S.
(Figure 7), viewed in the export matrix by destination.
Figure 5. Changes in exports by destination Figure 6. Breakdown of exports by destination
Note: "China" in 2000 data in Figure 5 and Figure 6 includes South Korea and Taiwan. Hong Kong is included in "other destinations."
2 In creating the export (import) matrix by destination, in order to reorganize the Trade Statistics data according to the concept of the Updated Input-Output Tables, we (1) converted the Trade Statistics' commodity classification into the sector classification used in the Updated Input-Output Tables, (2) excluded used or recycled goods and (3) converted FOB prices into producer's prices, and treated these figures as imports or exports in the Updated Input-Output Tables.
29.7%22.7%
15.6%
26.0%
19.1%24.6%
15.1%
29.0% 31.3%
16.3% 13.8% 11.3%
12.9% 15.4% 17.1%
0%
10%
20%
30%
40%
50%
60%
70%
80%
90%
100%
2000 2005 2010
U.S. China Asia (excl. China) EU Other destinations
10
20
30
40
50
60
70
0
5
10
15
20
25
30
2000 2005 2010
U.S. China
Asia (excl. China) EU
Other destinations Exports (ordinary trade): Right-hand side scale
62.5225 63.0839
49.6187
( trillion yen)
( trillion yen)

- 7 -
Figure 7. Sector-by-sector breakdown of exports to the world, China and the U.S.
World total
Inner circle: 2005
Outer circle: 2010
15%
14%
11%
7%5%4%6%4%
4%2%
28%
15%
12%
10%
8%6%5%
5%
4%
4%
4%
27%
General machinery
Passenger motor cars
Electronic components
Motor vehicle parts and accessories
Iron and steel
Other transport equipment
Other electrical machinery
Electrical devices and parts
Chemical basic products
Non-ferrous metals
Others
21%
14%
4%6%5%6%
6%3%
2%3%
30%
17%
16%
6%
6%5%5%
5%
5%
4%
4%
27%
Electronic components
General machinery
Motor vehicle parts and accessories
Other electrical machinery
Electrical devices and parts
Iron and steel
Chemical basic products
Non-ferrous metals
Passenger motor cars
Plastic products
Others
China
29%
14%
11%5%6%
6%
4%2%3%5%
15%
30%
14%
10%5%
5%
5%
4%
4%
3%
3%
17%
Passenger motor cars
General machinery
Motor vehicle parts and accessories
Other electrical machinery
Electronic components
Electronic computing equipment and its accessories
Electrical devices and parts
Other transport equipment
Miscellaneous manufacturing products
Household electronics equipment
Others
U.S.Inner circle: 2005
Outer circle: 2010

- 8 -
Below, we analyze the impact of exports' structural change on domestic production, using various analytical
methodologies used in the Input-Output Tables. Specifically, our analysis involves the following steps:
(i) Calculate the export ratio for total exports and sector-by-sector exports, and analyze the changes in the share
of exports in domestic production.
(ii) Calculate the value of domestic production induced by exports, for total exports, sector-by-sector exports
and destination-by-destination exports, and analyze the changes in the value of domestic production
induced by exports.
(iii) Calculate the production inducement dependency on individual final demand items, and analyze the
changes in domestic production's dependence on exports.
(iv) Calculate the production inducement coefficient for exports, for total exports and destination-by-destination
exports, and analyze the changes in the size of domestic production induced by an additional unit of
exports.
(v) Analyze factors contributing to variations in domestic production induced by exports and break them down
into the following categories: "changes in production technology structure," "changes in the scale of
exports," "changes in export destination composition" and "changes in export commodity composition,"
and analyze their respective impact.
(vi) Break down the production inducement dependency on exports into the dependency on destination-by-
destination exports and the dependency on sector-by-sector exports, and analyze the changes in them.
1) Export ratio
The share of exports in domestic production increases
The export ratio represents exports as a percentage of domestic production.
Looking at the export ratio for 2000, 2005 and 2010 (Table 1), it continued to rise, reaching 5.8% in 2000,
7.8% in 2005, and 9.1% in 2010. In particular, although domestic production decreased from 947.7022 trillion
yen to 888.3810 trillion yen between 2005 and 2010, exports grew from 73.7687 trillion yen to 80.7277 trillion
yen, with exports (ordinary trade) up from 62.4766 trillion yen to 69.6718 trillion yen. This shows that the
shares of exports and exports (ordinary trade) in domestic production increased.

- 9 -
Table 1. Export ratios
2000 2005 2010
5.8 7.8 9.1
537,912 737,687 807,277
Exports (ordinary trade) (100 million yen) 455,860 624,766 696,718
9,219,356 9,477,022 8,883,810
Export ratio (% )
Exports (100 million yen)
Domestic production (100 million yen) Note: "Exports" in this table represent the total of "exports (ordinary trade)," "exports (non-ordinary trade)," "exports (direct purchase)" and "adjustment categories." The 2000 data is derived from the 1995-2000-2005 Linked Input-Output Table and therefore not based on exactly the same statistical concept. Export ratio = exports / domestic production
Sector-by-sector export ratios (Table 2) show that compared to 2005, the 2010 export ratio for precision
instruments was up 8.1 percentage points, that for plastic products was up 7.9 percentage points, and that for
non-ferrous metals was up 7.9 percentage points. In contrast, the 2010 export ratio for household electronics
equipment was down 4.5 percentage points, that for machinery for office and service industry was down 2.6
percentage points, and that for reuse and recycling was down 1.9 percentage points.
Table 2. Sector-by-sector export ratios
2005 2010 2010-2005
Precision instruments 37.5 45.7 8.1
Plastic products 10.4 18.3 7.9
Non-ferrous metals 16.7 24.7 7.9
Other cars 35.5 43.3 7.8
Ceramic, stone and clay products 10.5 18.3 7.8
Household electronics equipment 26.0 21.5 -4.5
Machinery for office and service industry 6.4 3.8 -2.6
Reuse and recycling 25.5 23.6 -1.9
Transport 13.9 13.2 -0.7
Electronic computing equipment and its accessories 60.7 60.2 -0.5
Sect
ors
wit
h th
ela
rges
t dec
line
SectorExport ratio (% )
Sect
ors
wit
h th
ela
rges
t inc
reas
e

- 10 -
2) Domestic production induced by exports
China-bound exports lead an increase in domestic production induced by exports
Induced domestic production3 is the value of domestic production induced by final demand. Domestic
production induced by exports is calculated by multiplying the inverse matrix coefficients by the
export column vector.
Looking at domestic production induced by exports in 2000, 2005 and 2010 (Table 3), it is on the rise,
marking 117.5791 trillion yen in 2000, 141.4317 trillion yen in 2005, and 146.7916 trillion yen in 2010.
However, the pace of growth between 2005 and 2010 was 3.8%, a small increase compared to 11.5% growth in
exports during the same period.
Table 3. Domestic production induced by exports
2000 2005 2010 2010/2005 (%)
Induced domestic production (100 million yen) 1,175,791 1,414,317 1,467,916 3.8
Exports (100 million yen) 537,912 624,766 696,718 11.5
Note: The 2000 data is derived from the 1995-2000-2005 Linked Input-Output Table and therefore not based on exactly the same statistical concept.
Looking at sector-by-sector domestic production induced by exports (Table 4), sectors that made a positive
contribution to growth in 2010 include: electronic components (up 19.3% compared to 2005), iron and steel (up
12.7%) and passenger motor cars (up 8.2%). On the other hand, sectors that made a negative contribution to
growth include: motor vehicle parts and accessories (down 3.0%), goods rental and leasing services (down
23.3%) and finance and insurance (down 9.8%).
3 Domestic production induced by exports was calculated by consolidating the basic sector classification in the 2010 Updated Table into 53 sectors and using the following equation
output model that takes into account the self-sufficiency rate: X=(I- MI ˆ A)-1(ΓY+E).
I: Identity matrix, MI ˆ : Self-sufficiency rate, : Import coefficient matrix, A: Input coefficient matrix,
Y: Domestic final demand, E: Exports, X: domestic production

- 11 -
Table 4. Sector-by-sector domestic production induced by exports
2005 20102010/2005
(%)2005 2010 2010-2005
Electronic components 105,366 125,665 19.3 65.0 69.4 4.4
Iron and steel 112,354 126,644 12.7 44.4 52.8 8.5
Passenger motor cars 75,093 81,278 8.2 51.4 56.5 5.1
Other business services 40,639 45,358 11.6 9.5 10.3 0.7
Plastic products 34,682 39,341 13.4 32.6 41.6 9.0
Motor vehicle parts and accessories 156,775 152,037 -3.0 54.7 59.7 4.9
Goods rental and leasing services 15,310 11,743 -23.3 12.7 12.0 -0.6
Finance and insurance 32,735 29,533 -9.8 7.9 8.4 0.5
Miscellaneous manufacturing products 19,129 17,263 -9.8 24.5 27.9 3.3
Other cars 14,191 12,373 -12.8 34.6 42.1 7.4
Induced domestic production (100 million yen) As a percentage of domestic production (%)
Sect
ors
wit
h th
ela
rges
t inc
reas
eSe
ctor
s w
ith
the
larg
est d
ecli
ne
Next, domestic production induced by exports by destination (Table 5) shows that domestic production
induced by China-bound exports increased significantly by 39.7% from 24.9344 trillion yen in 2005 to 34.8219
trillion yen in 2010. In contrast, domestic production induced by US-bound exports decreased considerably by
26.4% from 34.2404 trillion yen in 2005 to 25.2017 trillion yen in 2010, pushing domestic production induced
by China-bound exports ahead of domestic production induced by US-bound exports in 2010.
Table 5. Domestic production induced by exports by destination
2005 20102010/2005
(%)2005 2010
2010/2005 (%)
Exports 624,766 696,718 11.5 1,414,317 1,467,916 3.8
China 117,243 173,043 47.6 249,344 348,219 39.7
U.S. 143,781 114,244 -20.5 342,404 252,017 -26.4
Induced domestic production (100 million yen)Exports (100 million yen)
3) Production inducement dependency by final demand item
Domestic production's dependence on exports rises
Production inducement dependency by final demand item is the value of domestic production induced by
individual final demand items (consumption, investment and exports) expressed as a percentage of domestic
production. It indicates how much of domestic production depends on individual final demand items.
Looking at the production inducement dependency on individual final demand items for 2005 and 2010
(Table 6), the production inducement dependency on domestic final demand—consisting of consumption and
investment—declined from 83.0% in 2005 to 81.3% in 2010, down 1.7 percentage points. In contrast, the
production inducement dependency on exports rose from 17.0% to 18.7%, up 1.7 percentage points. This
indicates that domestic production's dependence on exports is on the rise.

- 12 -
Table 6. Production inducement dependency by final demand item
2005 2010 2005 2010 2010-2005
Domestic final demand 7,864,857 7,224,240 83.0 81.3 -1.7
Consumption 5,757,460 5,583,640 60.8 62.9 2.1
Investment 2,107,398 1,640,600 22.2 18.5 -3.8
Exports 1,612,165 1,659,570 17.0 18.7 1.7
Exports (ordinary trade) 1,414,317 1,467,916 14.9 16.5 1.6
Total final demand 9,477,022 8,883,810 100.0 100.0 0.0
Induced domestic production(100 million yen)
Production inducement dependency (% )
Note: "Exports" in this table represent the total of "exports (ordinary trade)," "exports (non-ordinary trade)," "exports (direct purchase)" and "adjustment categories."
4) Production inducement coefficients for exports
The capacity of exports to induce domestic production declines
Production inducement coefficient for exports is the value of domestic production induced by exports
expressed as a percentage of exports. It indicates how much and which sector's domestic production is induced
by an additional unit of exports.
The production inducement coefficient for exports (Table 7) marked 2.5793 in 2000, 2.2638 in 2005, and
2.1069 in 2010, with the 2010 figure recording a decrease of 0.1569 points from 2005. This shows that the
capacity of exports to induce domestic production is on the decline.
Table 7. Production inducement coefficients for exports
2000 2005 2010 2010-2005
Production inducement coefficient 2.5793 2.2638 2.1069 -0.1569
Induced domestic production (100 million yen) 1,175,791 1,414,317 1,467,916 53,599
Exports (100 million yen) 455,860 624,766 696,718 71,952 Note: The 2000 data is derived from the 1995-2000-2005 Linked Input-Output Table and therefore not based on exactly the same statistical concept.
Production inducement coefficients by final demand item (Table 8) show that although the coefficient for
exports fell by 0.1297 points between 2005 and 2010, the coefficient for domestic final demand also declined
during the same period, as seen in a decrease of 0.0327 points in the coefficient for consumption and a decrease
of 0.1098 points in the coefficient for investment. In 2010, the production inducement coefficient for exports
was 2.0558, still maintaining higher level than the coefficient for consumption at 1.5052 and the coefficient for
investment at 1.7090.

- 13 -
Table 8. Production inducement coefficients by final demand item
2005 2010 2010-2005
Consumption 1.5379 1.5052 -0.0327
Investment 1.8187 1.7090 -0.1098
Exports 2.1854 2.0558 -0.1297
Exports (ordinary trade) 2.2638 2.1069 -0.1569
Production inducement coefficient
Note: "Exports" in this table represent the total of "exports (ordinary trade)," "exports (non-ordinary trade)," "exports (direct purchase)" and "adjustment categories."
The import ratio represents imports as a percentage of domestic demand.
Import ratios (Table 9) show that the import ratio for all industries rose from 7.7% in 2005 to 8.4% in 2010,
up 0.7 percentage points. The import ratio for the manufacturing industry rose from 15.0% to 17.5%, up 2.5
percentage points.
Production spillover strength is the growth in production of the same or different sector induced directly or
indirectly when final demand in one industry increases by one unit. Specifically, it is calculated as the column
total of inverse matrix coefficients by sector.
The average production spillover strength for all industries declined by 0.0751 points from 1.9963 in 2005 to
1.9211 in 2010. The average production spillover strength for the manufacturing industry also declined from
2.2055 to 2.0915, marking a decrease of 0.1141 points.
A rise in the rate of import goods inputs—imported goods as a percentage of intermediate inputs by each
industry—triggered by an increase in the import ratio pushes down production spillover strength. As such, the
manufacturing industry, whose rate of import goods inputs is generally higher than that of other industries, sees
a larger increase in the rate of import goods inputs and a bigger fall in the production spillover strength when the
import ratio rises.
The major factor contributing to such decline in the production inducement coefficient for exports in 2010
compared to 2005 is thought to be the increase in imports.
Table 9. Changes in import ratios and average production spillover strength
2005 2010 2010-2005
Average production spillover strength 1.9963 1.9211 -0.0751
Import ratio (% ) 7.7 8.4 0.7
Average production spillover strength 2.2055 2.0915 -0.1141
Import ratio (% ) 15.0 17.5 2.5
All industries
Manufacturingindustry
Note: Import ratio = (imports (ordinary trade) + imports (non-ordinary trade) + imports (direct purchase) + customs duties + duty on imported goods) / total domestic demand The manufacturing industry covers sectors from "04. Beverages and foods" to "34. Reuse and recycling" in the 53 sectors used in the Updated Input-Output Tables.

- 14 -
Production inducement coefficients for exports by destination (Table 10) shows that the coefficient for China-
bound exports fell from 2.1267 in 2005 to 2.0123 in 2010. The coefficient for US-bound exports also declined
from 2.3814 to 2.2060. The pace of decline in the coefficient for US-bound exports was 0.1755 points, whereas
that for China-bound exports was 0.1144 points, a smaller decrease than US-bound exports. This shows that
although the coefficient for US-bound exports is still higher than that for China-bound exports, the gap between
the two is narrowing.
Table 10. Production inducement coefficients for exports by destination
2005 2010 2010-2005
Exports 2.2638 2.1069 -0.1569
China 2.1267 2.0123 -0.1144
U.S. 2.3814 2.2060 -0.1755
Production inducement coefficient
5) Analysis of factors contributing to variations in domestic production induced by exports
Changes in the scale of exports and in export commodity composition pushes up domestic production
induced by exports
Here we decompose the factors contributing to variations in domestic production induced by exports into
"changes in production technology structure" and "changes in export structure." The changes in export structure
consist of "changes in the scale of exports," "changes in export destination composition" and "changes in export
commodity composition" (see Annotation 2 for the factor decomposition method). (Table 11)
Domestic production induced by exports in 2010 grew 3.8% from 2005. Each factor's degree of contribution
to the growth from 2005 (referred to as "contribution" in Section II.1. below) shows that the changes in
production technology structure made a negative contribution of 6.7% while the changes in export structure
made a positive contribution of 11.4%. Of the changes in export structure, the changes in the scale of exports
made a positive contribution of 11.5%, the changes in export commodity composition made a positive
contribution of 0.6%, and the changes in export destination composition made a negative contribution of 0.7%.
These findings reveal that the biggest factor contributing to the growth in domestic production induced by
exports between 2005 and 2010 was the changes in the scale of exports—an increase in exports. The second
biggest factor was the changes in export commodity composition. In contrast, the changes in production
technology structure and the changes in export destination composition made a negative contribution to the
growth in domestic production induced by exports.

- 15 -
Table 11. Factors contributing to variations in domestic production induced by exports
2010-2005
(100 million yen) (% )
Induced domestic production 53,599 3.8
Changes in production technology structure -94,774 -6.7
Changes in export structure 160,613 11.4
Changes in the scale of exports 162,883 11.5
Changes in export destination composition -10,070 -0.7
Changes in export commodity composition 7,800 0.6
Confounding item -12,241 -0.9
Contribution togrowth from 2005
Looking at China-bound exports and US-bound exports as a component of the changes in export destination
composition (Table 12), which made a negative 0.7% contribution to the growth in domestic production
induced by exports, shows that China-bound exports made a positive contribution of 5.7% while US-bound
exports made a negative contribution of 7.0%. This reflects the impact caused by the drop in US-bound exports
that surpasses the impact generated by the increase in China-bound exports. As seen in these results, Japanese
exports' shift from the U.S. to China not only changed their respective share in Japanese exports but also had an
impact on the capacity of exports to induce domestic production.
Table 12. Impact of changes in export destination composition
2010-2005
(100 million yen) (% )
Induced domestic production 53,599 3.8
Changes in export destination composition -10,070 -0.7
China 80,665 5.7
U.S. -98,436 -7.0
Contribution togrowth from 2005
Next, looking at China-bound exports and US-bound exports as a component of the changes in export
commodity composition (Table 13), which made a positive 0.6% contribution to the 3.8% growth in domestic
production induced by exports, shows that both China-bound exports and US-bound exports made a positive
contribution of 0.3% and 0.1%, respectively.
Breaking down the changes in export commodity composition by sector reveals that China-bound exports
saw a clear shift from raw material products to processed and assembled products. Sectors that made a negative
contribution include: "chemical basic products," "textile products" and "iron and steel." Sectors that made a
positive contribution were those with high production spillover strength, including "motor vehicle parts and
accessories," "passenger motor cars" and "general machinery." In US-bound exports, on the other hand, the top
position both in sectors that made the largest positive contribution to growth and that made the largest negative
contribution to growth was held by the processed and assembled products sectors such as "passenger motor
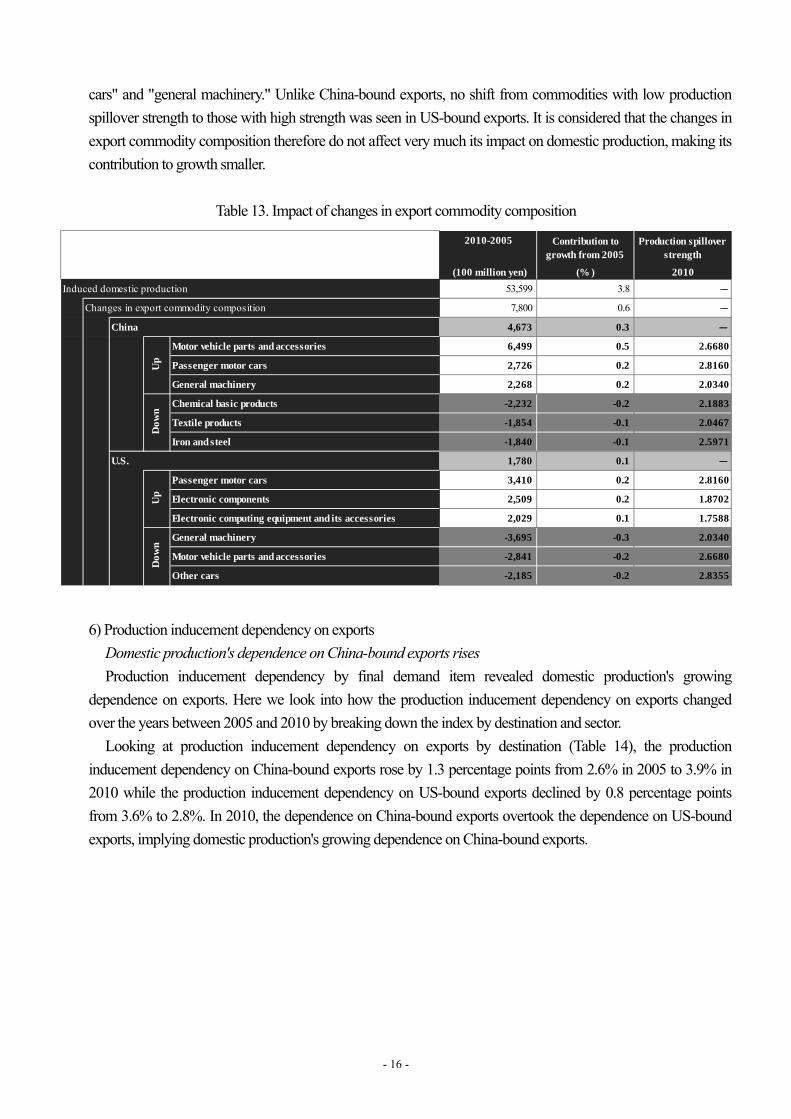
- 16 -
cars" and "general machinery." Unlike China-bound exports, no shift from commodities with low production
spillover strength to those with high strength was seen in US-bound exports. It is considered that the changes in
export commodity composition therefore do not affect very much its impact on domestic production, making its
contribution to growth smaller.
Table 13. Impact of changes in export commodity composition
2010-2005
(100 million yen) (% ) 2010
Induced domestic production 53,599 3.8 -
Changes in export commodity composition 7,800 0.6 -
China 4,673 0.3 -
Motor vehicle parts and accessories 6,499 0.5 2.6680
Passenger motor cars 2,726 0.2 2.8160
General machinery 2,268 0.2 2.0340
Chemical basic products -2,232 -0.2 2.1883
Textile products -1,854 -0.1 2.0467
Iron and steel -1,840 -0.1 2.5971
U.S. 1,780 0.1 -
Passenger motor cars 3,410 0.2 2.8160
Electronic components 2,509 0.2 1.8702
Electronic computing equipment and its accessories 2,029 0.1 1.7588
General machinery -3,695 -0.3 2.0340
Motor vehicle parts and accessories -2,841 -0.2 2.6680
Other cars -2,185 -0.2 2.8355
Production spilloverstrength
Up
Dow
nU
pD
own
Contribution togrowth from 2005
6) Production inducement dependency on exports
Domestic production's dependence on China-bound exports rises
Production inducement dependency by final demand item revealed domestic production's growing
dependence on exports. Here we look into how the production inducement dependency on exports changed
over the years between 2005 and 2010 by breaking down the index by destination and sector.
Looking at production inducement dependency on exports by destination (Table 14), the production
inducement dependency on China-bound exports rose by 1.3 percentage points from 2.6% in 2005 to 3.9% in
2010 while the production inducement dependency on US-bound exports declined by 0.8 percentage points
from 3.6% to 2.8%. In 2010, the dependence on China-bound exports overtook the dependence on US-bound
exports, implying domestic production's growing dependence on China-bound exports.

- 17 -
Table 14. Production inducement dependency on exports by destination
2005 2010 2005 2010 2010-2005
Exports 1,414,317 1,467,916 14.9 16.5 1.6
China 249,344 348,219 2.6 3.9 1.3
U.S. 342,404 252,017 3.6 2.8 -0.8
Induced domestic production(100 million yen)
Production inducement dependency (% )
Looking at sector-by-sector production inducement dependency on exports in 2005 and 2010, the top five
sectors with the highest production inducement dependency on exports are "electronic components," "synthetic
resins," "motor vehicle parts and accessories," "electronic computing equipment and its accessories" and
"chemical basic products" in both years (Table 15).
Sectors that saw a substantial change in their production inducement dependency on exports between 2005
and 2010 include "ceramic, stone and clay products," "mining," "plastic products," "synthetic resins" and "iron
and steel" (Table 16).
Looking at these sectors in terms of their dependence on exports to China and the U.S., all the sectors saw a
rise in their production inducement dependency on China-bound exports in 2010 compared to 2005, whereas all
the sectors but "ceramic, stone and clay products" saw a decline in their production inducement dependency on
US-bound exports.
One of the factors behind the rise in Japan's production inducement dependency on exports is rising
production inducement dependency on China-bound exports in a wide range of sectors. This can be seen in the
fact that 49 out of 53 sectors—including sectors that have particularly high production inducement dependency
on exports such as "electronic components" and "synthetic resins" and sectors that saw a rise in their production
inducement dependency on exports such as "ceramic, stone and clay products" and "mining"—saw a rise in
their production inducement dependency on China-bound exports.

- 18 -
Table 15. Production inducement dependency on exports by sector and destination
(Top sectors in 2010)
Rank 2005 Rank 2010 2010-2005
Electronic components 65.0 69.4 4.4
China 19.6 25.6 6.0
U.S. 10.1 7.6 -2.5
Synthetic resins 51.6 60.5 8.9
China 16.2 21.9 5.7
U.S. 7.4 6.1 -1.3
Motor vehicle parts and accessories 54.7 59.7 4.9
China 3.1 8.2 5.1
U.S. 21.2 16.0 -5.2
Electronic computing equipment and its accessories 59.5 58.8 -0.8
China 10.2 12.6 2.4
U.S. 20.2 17.7 -2.5
Chemical basic products 50.8 56.5 5.7
China 13.4 17.0 3.6
U.S. 6.9 5.9 -1.0
3 2
Sector/DestinationProduction inducement dependency (% )
1 1
5 3
4 4
2 5

- 19 -
Table 16. Production inducement dependency on exports by sector and destination
(Top sectors with the biggest difference between 2005 and 2010)
Rank 2010-2005 2010
Ceramic, stone and clay products 12.1 35.7
China 3.6 -
U.S. 0.2 -
Mining 10.7 47.0
China 4.3 -
U.S. -1.0 -
Plastic products 9.0 41.6
China 4.6 -
U.S. -1.5 -
Synthetic resins 8.9 60.5
China 5.7 -
U.S. -1.3 -
Iron and steel 8.5 52.8
China 3.0 -
U.S. -1.4 -
4
5
2
3
Sector/Destination
1
Production inducement dependency(% )
Figure 8. Production inducement dependency on exports by sector
(Difference between 2005 and 2010)
-6.0
-4.0
-2.0
0.0
2.0
4.0
6.0
8.0A
griculture, forestry and fishery
Mining
Coal m
ining, crude petroleum and natural gas
Beverages and foods
Textile products
Wearing apparel and other textile products
Tim
ber, wooden products and furniture
Pulp, paper and processed paper products
Printing, plate m
aking and book binding
Chem
ical basic products
Synthetic resins
Final chem
ical products
Medicam
ents
Petroleum
and coal products
Plastic products
Ceram
ic, stone and clay products
Iron and steel
Non-ferrous m
etals
Metal products
General m
achinery
Machinery for office and service industry
Electrical devices and parts
Other electrical m
achinery
Household electric appliances
Household electronics equipm
ent
Electronic com
puting equipment and its accessories
Electronic com
ponents
Passenger m
otor cars
Other cars
Motor vehicle parts and accessories
Other transport equipm
ent
Precision instrum
ents
Miscellaneous m
anufacturing products
Reuse and recycling
Construction
Electricity
Gas and heat supply
Water supply and w
aste disposal business
Com
merce
Finance and insurance
Real estate
House rent (im
puted house rent)
Transport
Other inform
ation and comm
unications
Information services
Public adm
inistration
Education and research
Medical service, health, social security and nursing care
Advertising services
Goods rental and leasing services
Other business services
Personal services
Others
Exports to China
Exports to the U.S.
(%)

- 20 -
(3) Summary
According to the Trade Statistics, after seeing growth between 2002 and 2007, the value of Japanese exports,
hurt by the financial shock following the collapse of Lehman Brothers, fell in 2008 and 2009. Although it began
to rise again in 2010, it declined in 2011 and 2012. During this period, Japanese exports saw a structural change
in which the share of exports to China increased while that of US-bound exports decreased. An analysis of its
impact on domestic production, using data including the 2010 Updated Table, found out the following:
(i) As exports grew irrespective of the changes in the value of domestic production, the export ratio, which
represents exports as a percentage of domestic production, continued to rise, marking 5.8% in 2000, 7.8%
in 2005, and 9.1% in 2010.
(ii) In 2010, domestic production induced by exports—a value that shows how much domestic production was
induced by exports—grew 3.8% from 2005. By sector, "electronic components," "iron and steel" and
"passenger motor cars" recorded an increase. By destination, exports to the U.S. declined significantly while
those to China saw a large increase. In 2010, domestic production induced by China-bound exports
overtook that by US-bound exports. This shows China-bound exports' growing impact on Japan's domestic
production.
(iii) Looking at production inducement dependency by final demand item, which indicates how much of
domestic production depends on individual final demand items, shows that domestic production's
dependence on exports in 2010 increased from 2005 but its dependence on consumption and investment—
the components of domestic final demand—decreased.
(iv) The production inducement coefficient that indicates how much domestic production was induced by an
additional unit of exports shows that although the coefficient for exports in 2010 declined from 2005, it still
maintained higher level than the coefficients for consumption and investment—the components of
domestic final demand. The decreases in the production inducement coefficients were largely due to
domestic products' declining production spillover strength caused by rising import ratios.
(v) An analysis of factors contributing to the increase in domestic production induced by exports mentioned in
(ii) above found out that the biggest factor was the changes in the scale of exports, caused by increased
exports. The second biggest factor was the changes in export commodity composition, driven by China-
bound exports' shift to commodities produced by sectors with high production spillover strength, including
"motor vehicle parts and accessories" and "passenger motor cars." An analysis of factors contributing to the
decrease in domestic production induced by exports, on the other hand, found out that the biggest factor
was the changes in production technology structure, caused by rising import ratios. The second biggest
factor was the changes in export destination composition, caused by an increase in China-bound exports
and a decrease in US-bound exports.

- 21 -
(vi) A breakdown by sector and destination of factors contributing to the increase in production inducement
dependency on exports mentioned in (iii) above revealed that many sectors, including those with high
production inducement dependency on exports such as "electronic components" and "synthetic resins" and
those that saw a rise in their production inducement dependency on exports such as "ceramic, stone and
clay products" and "mining," increased their dependence on China-bound exports but cut their dependence
on US-bound exports.

- 22 -
Annotation 2 Model Equation to Analyze Factors Contributing to Variations in Production (Exports)
1. Basic model to analyze factors contribution to variations
The basic model to analyze factors contribution to variations is as explained in Annotation 1. Annotation 2 will discuss a model
that only involves exports among other final demand components.
Equation (1) is the basic equation of the equation output model (same as in Annotation 1).
Explanation of symbols
X : Domestic production, M : Imports, E : Exports, Y : Domestic final demand, A : Input coefficients,
I : Identity matrix
])ˆ[(])ˆ([ 1 EYMIAMIIX .................................................................................................................. (1)
For the sake of convenience in explanation, we here call the inverse matrix coefficients in equation (1)
"production technology structure" and express it as (B) and define final demand for domestic products as (F). Induced domestic
production (X) can be obtained by multiplying production technology structure (B) by final demand for
domestic products (F) as shown in equation (2) below:
BFX ............................................................................................................................................................. (2)
Of equation (2), domestic production induced only by exports (E) can be obtained by equation (3) below:
BEX E .......................................................................................................................................................... (3)
Thus, if we define the variations in domestic production induced by exports between Year o (base year: 2005 for example) and
Year t (year to be compared:2010 for example) as ΔXE, the variations in exports as ΔE, the variations in the production
technology structure of domestic products as ΔB, equation (3) can be resolved as follows and equation (4) can be obtained by
simplifying it.
Explanation of symbols
EX : Domestic production induced by exports, o : Base year, t : Year to be compared, : Variations
Base year: ooE EBX 0
Year to be compared: ))(( EEBBEBX ootttE
Variations in domestic production: 0E
tEE XXX
oott EBEB oooo EBEEBB ))((
EBBEEBX ooE ............................................................ (4)
The definitions in equation (4) are as follows:
The first term on the right-hand side EBo : variations caused by changes in exports
The second term on the right-hand side oBE : variations caused by changes in production technology structure
The third term on the right-hand side EB : variations caused by simultaneous changes in the two factors above
(confounding item)
1])ˆ([ AMII
])ˆ[( EYMI

- 23 -
2. Decomposition of factors contributing to the value of exports
Explanation of symbols
c : Distribution matrix (commodity composition of exports by destination)
e : Distribution coefficient row vector
(Composition ratio of the column total of exports by destination to the total value of exports)
e : Diagonal matrix that has elements of e as the diagonal elements
: Total value of exports (scalar)
Using the three factors c , e and , exports of domestic products E can be expressed as follows in equation (5):
ecE ˆ ............................................................................................................................................................... (5)
Thus, variations E in exports of domestic products E can be resolved as follows in equation (6):
Base year: oooo ecE ˆ
Year to be compared: tttt ecE ˆ
Variations: ot EEE ooottt ecec ˆˆ
oooooo eceecc ˆ))(ˆˆ)(( oooooo ecececE ˆˆˆ
) ecececec ooo ˆˆˆˆ( ................................................................ (6)
Further details of the factors contributing to variations in domestic production can be obtained by substituting equation (5) into
the first term on the right-hand side of equation (3) above.
(Same as (4) above) EBBEEBX ooE ................................................................................................ (4)
)+
+++++
++++
+
+++=
ecB
ecBecBeBcecBecB
eBceBcecBecBecB
EBecBecBecBX
oooooo
oooooooooo
ooooooooooE
ˆ(
)ˆˆˆˆ()ˆ
ˆˆˆˆˆ(
ˆˆˆ
........................................................................... (7)
The definitions in equation (7) are as follows:
The first term on the right-hand side ooo ecB ˆ : variations caused by changes in the scale of exports
The second term on the right-hand side ooo ecB ˆ : variations caused by changes in export destination composition
The third term on the right-hand side ooo ecB ˆ : variations caused by changes in export commodity composition
The fourth term on the right-hand side oBE : variations caused by changes in production technology structure
{ } in the fifth term on the right-hand side: Variations caused by simultaneous changes in
two or more of the four factors above
(confounding item)