iht2 health it summit in seattle 2012 – keynote presentation "improving health with...
TRANSCRIPT

1 1
Improving Health with
Healthcare Intelligence
iHT2 Health IT Summit Seattle
Thursday, 23 August 2012
Dick Gibson MD PhD
Chief Healthcare Intelligence Officer
Providence Health & Services – Renton WA
2 2
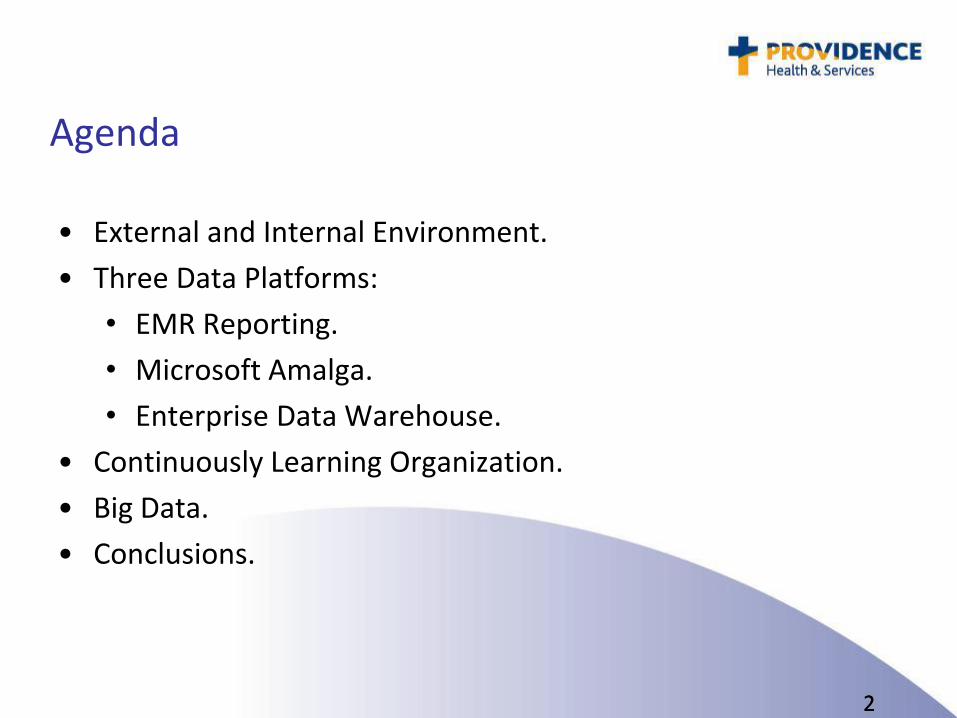
Agenda
• External and Internal Environment.
• Three Data Platforms:
• EMR Reporting.
• Microsoft Amalga.
• Enterprise Data Warehouse.
• Continuously Learning Organization.
• Big Data.
• Conclusions.

3 3
What we believe about the future
• More care done for lower Per Member Per Month.
• Mental Health Care & Post Acute Care will grow significantly.
• Less reliance on physicians & more on alternative providers.
• More care delivered at home, at work, & on mobile devices.
• More self-care with Internet information sources.
• More scrutiny of our care by regulatory & consumer bodies.
• More telehealth, teleradiology, telepharmacy, etc.
• Genomic and proteomic data will revolutionize healthcare but not for a few years.
• More reimbursement by Health Savings Accounts (more retail a la carte buying) and by global premium.

4 4
Our overall motivation

5 5
What does this mean for our healthcare?

6 6
If it is not indicated, we don’t do it.
If it is indicated, we do it reliably.
If we do it, we do it flawlessly.
We study our results and we continuously improve.

7 7
• 32 hospitals • 7,000 beds • 64,000 employees • 2,300 employed physicians • 285 clinics • 400,000 member health plan • $10Billion Net Revenue
Including Swedish Health Services

8 8
Two kinds of information systems
• Transaction Systems: Epic Hyperspace for healthcare.
• Captures all characterizations of the patient’s status.
• Both Pre-intervention & Post-intervention.
• Captures all our interventions: diagnostic & therapeutic.
• Point-of-care Clinical Decision Support guides providers.
• Reporting Systems: Retrospectively examine outcomes.
• Epic Clarity Reporting Database.
• Amalga.
• Enterprise Data Warehouse.
9 9
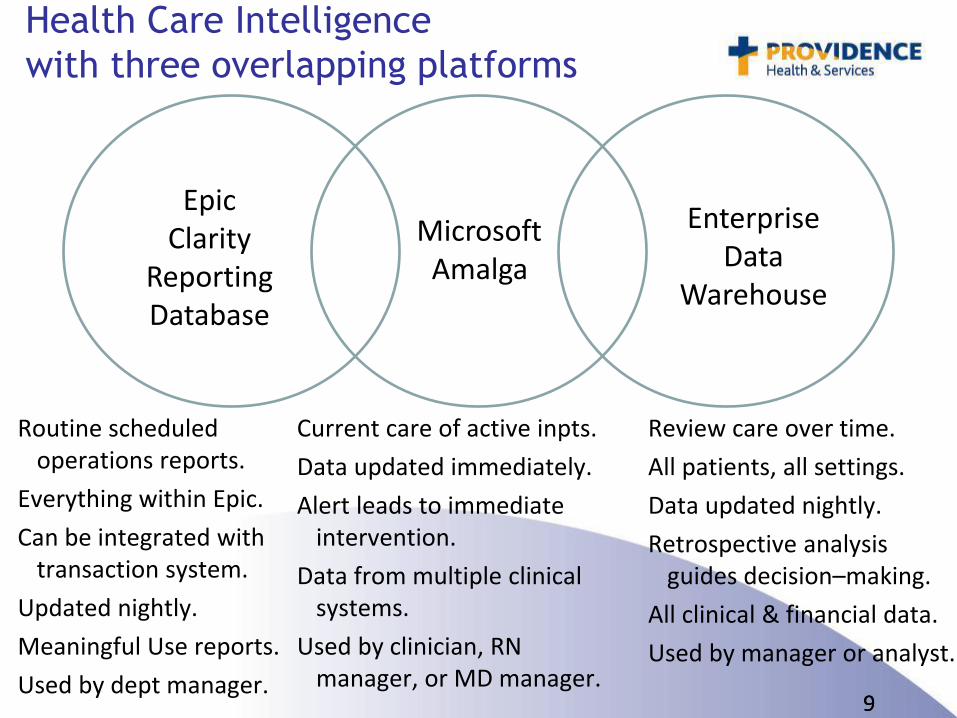
Epic Clarity
Reporting Database
Microsoft Amalga
Enterprise Data
Warehouse
Routine scheduled operations reports.
Everything within Epic.
Can be integrated with transaction system.
Updated nightly.
Meaningful Use reports.
Used by dept manager.
Current care of active inpts.
Data updated immediately.
Alert leads to immediate intervention.
Data from multiple clinical systems.
Used by clinician, RN manager, or MD manager.
Review care over time.
All patients, all settings.
Data updated nightly.
Retrospective analysis guides decision–making.
All clinical & financial data.
Used by manager or analyst.
Health Care Intelligence
with three overlapping platforms

10 10
EMFI
Community Lead
AK WA/MT OR/CA
(Enterprise Master File
Infrastructure)
Single Epic Clarity Reporting
Database
Epic Hyperspace Transaction
System
Three Identical instances
11 11
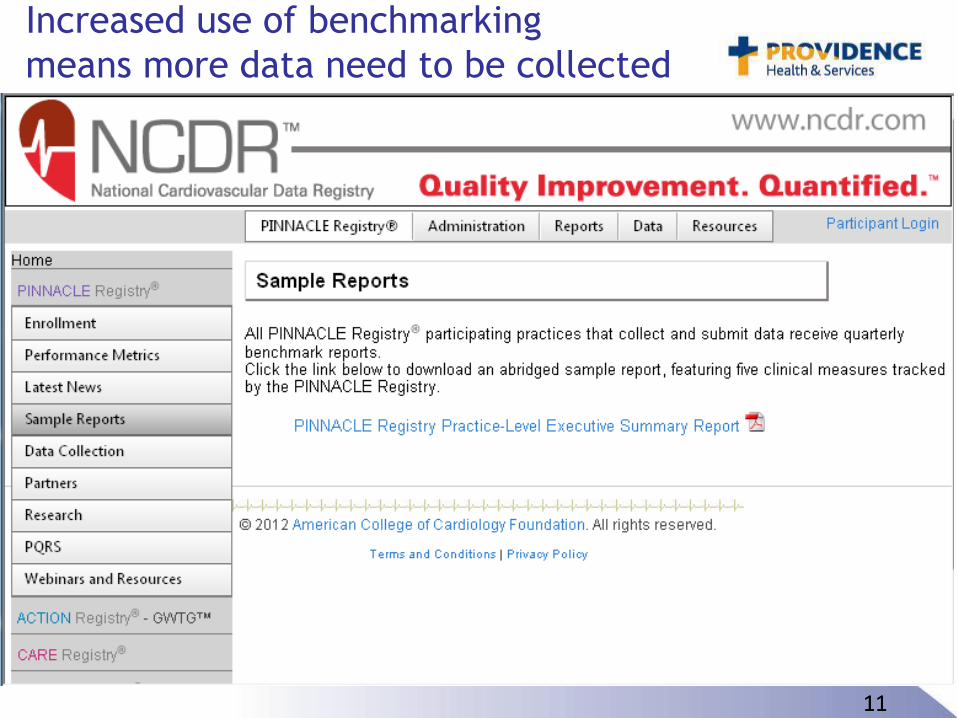
Increased use of benchmarking
means more data need to be collected

12 12
Thanks to Jeff Westcott MD at Swedish
And a lot of the data must come
from doctors at the point of care

13 13
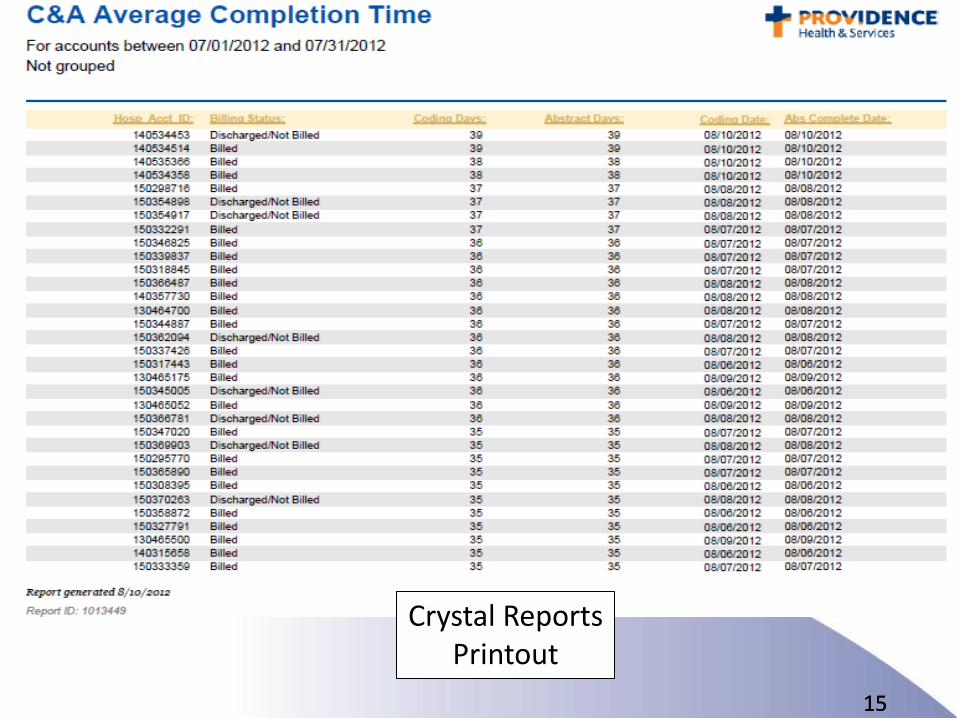
For Epic Clarity Reporting: SAP Business Objects
Crystal Reports
• Operational reports built by IT, read by manager.
• Precise, pixel perfect formatting.
• High volume publishing.
• Predictable questions.
Web Intelligence
• Query and analysis, sort, filter, drill down.
• Business user or analyst interacts with the data.
• Basic formatting only.
• Unpredictable questions.
Gradual trend from reports to analytics

14 14
Crystal Reports
Drop Down Lists To Select
Report Parameters
15 15
Crystal Reports Printout

16 16
Web Intelligence
Pull the Data Fields here that you want
to see on the screen.
Pull the Data Fields here to determine what records to include
in the output.

17 17
Data Acquisition & Distribution Engine (DADE)
Message Receiver
Lifetime Raw
Message Archive
Message Queue
Data Store Tables & SQL Views Optimized by Use
Data Elements
S
E
C
U
R
I
T
Y
Amalga Client
Raw data feeds
GET STORE SHOW
Parsers Message
Filer
Microsoft Amalga is a new entry in data management

18 18
Amalga collects data from multiple disparate transaction systems into one alerting engine
• 117 servers.
• 87 Terabytes of provisioned storage.
• 150 realtime interfaces.
• Outbound alerts connected to paging system.
• Data presented in simple Excel-like row & column format.

19 19
Modified Early Warning System (MEWS)

20 20
Users can sort, filter, exclude columns

21 21
Currently Active
• Modified Early Warning System (MEWS).
• Sepsis Scoring.
• Catheter Associated Urinary Tract Infection.
• Central Line Associated Blood Stream Infection.
In Process
• Readmission Manager
• Infection Control.
• Antimicrobial Stewardship.
• Pressure Ulcer Reduction.
• Falls Prevention.
Providence’s Use of Amalga

22 22
Enterprise Data Warehouse Stack
Lab
EHR
Costing
Gen Ledger
Regist
Time & Att
Sources Data Management Layers
Mat Mgt
MD Cred
Pt Satis
Staging
Master Data & Conformed Dimensions
Finance
Data Marts
Surgery
Quality
Office
Bundles
Claims
Integration Data Services
Revenue
Patient MD Meds

23 23
Source to Staging & Data Quality
• Bring over data, table for table, without changing the data.
• Relieve transaction system from the CPU slowdown of reporting.
• Examine Staging data quality and give feedback to Operations.
• Looking for null fields, Discharge dates before Admission dates, surgical stays without surgeon, etc.
Sources Staging
DATA QUALITY
Lab
EHR
Costing
Gen Ledger
Regist
Time & Att
Mat Mgt
MD Cred
Pt Satis Claims

24 24
Master Data Management & Data Stewards
• A few key tables of the most important assets.
• Patients.
• Providers.
• Orderables: implants, medications, surgical supplies.
• Departments.
• Single source of truth for entire organization.
• These become the “Conformed Dimensions” of the facts.
• A Data Steward is appointed to manage the master table for a given data type for entire organization.
Patient MD Meds

25 25
Data Integration Layer
• Patient, provider, & med names are replaced by keys from Master Tables.
• Addresses are validated & cleansed by outside Reference Tables.
• A patient’s multiple identities from multiple EMRs are associated with a unique key in the Patient Master Table and that key is used in this layer.
• Normalized tables are created for each of the major entities: Patients, Encounters, Orderables, etc.
Max data
break down
Patient MD Meds
Staging Data Integration
26 26
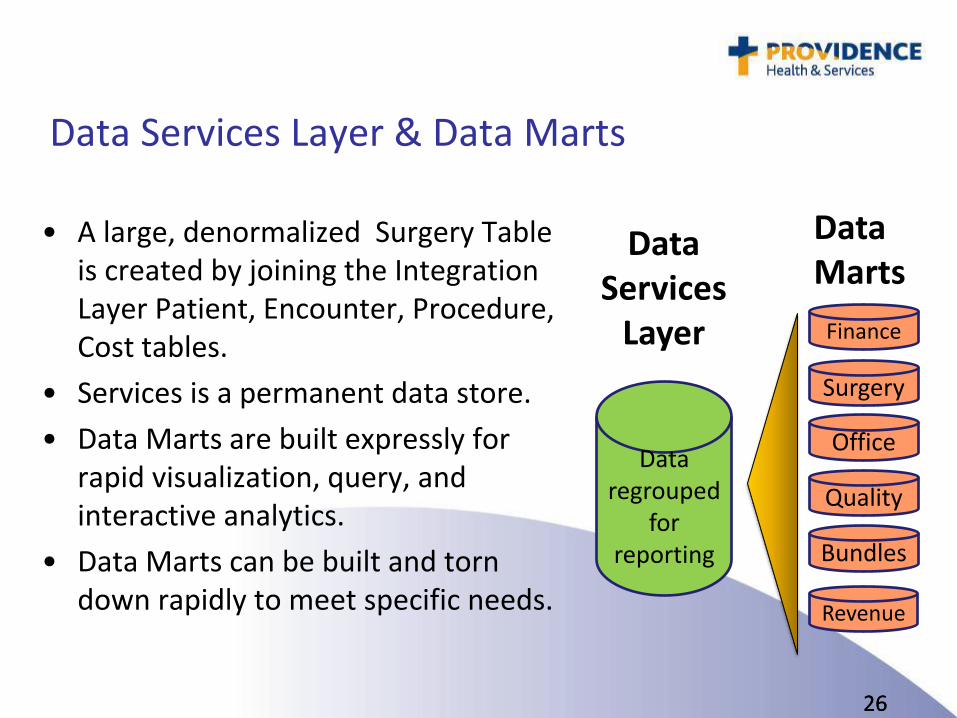
Data Services Layer & Data Marts
• A large, denormalized Surgery Table is created by joining the Integration Layer Patient, Encounter, Procedure, Cost tables.
• Services is a permanent data store.
• Data Marts are built expressly for rapid visualization, query, and interactive analytics.
• Data Marts can be built and torn down rapidly to meet specific needs.
Data regrouped
for reporting
Finance
Surgery
Quality
Office
Bundles
Revenue
Data Services
Layer
Data Marts

27 27
Semantic & Presentation Layers
• Semantic Layer uses column names that are familiar to business users.
• Standard Reporting & Dashboards for routine monitoring by untrained users.
• Special training for ad hoc query and interactive analytics.
• Statistical packages used for data mining.
Finance
Surgery
Quality
Office
Bundles
Revenue
Data Marts
Dashboard
Query & Analysis
Data Mining SE
MA
NTI
C L
AYE
R
Standard Reporting
Presentation Layer
28 28
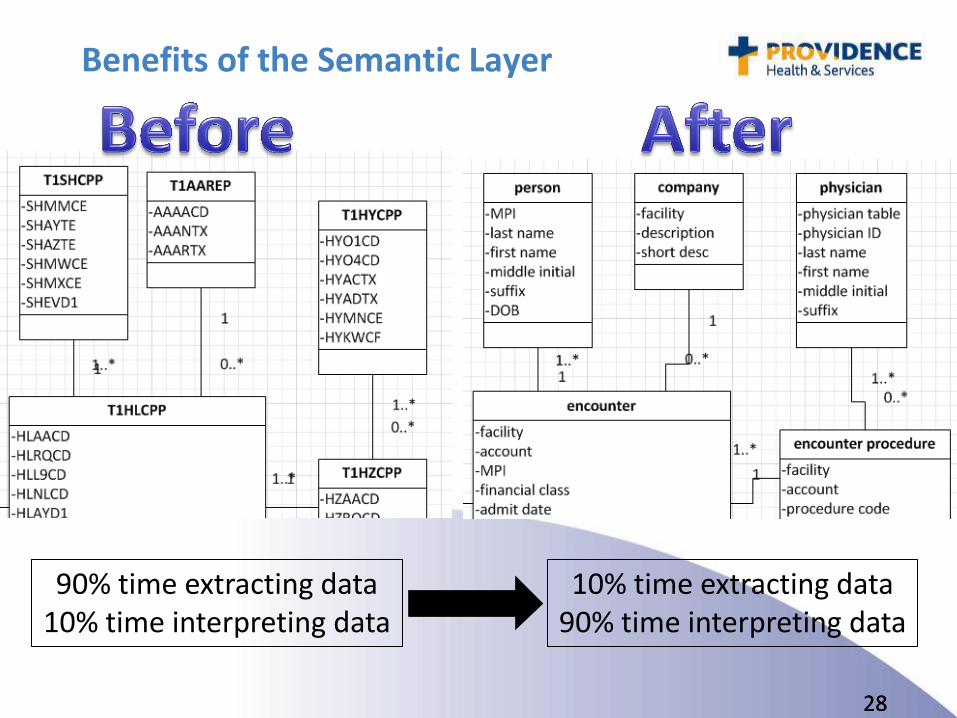
Benefits of the Semantic Layer
90% time extracting data 10% time interpreting data
10% time extracting data 90% time interpreting data

29 29
Microsoft Presentation Tools

30 30
What can Healthcare Intelligence do?
• Analyze emergency department patient throughput.
• Provide insight to revenue cycle performance in each work queue.
• Assess PMG physician clinical and productivity performance.
• Calculate cost of an individual encounter or average cost of a service line in preparation for bundled or global payment.
• Predict nurse staffing need for a shift in two weeks.
• Highlight sources and cost of physician variation in normal vaginal delivery and newborn care.
• Link physician office waiting time with client satisfaction.
31 31
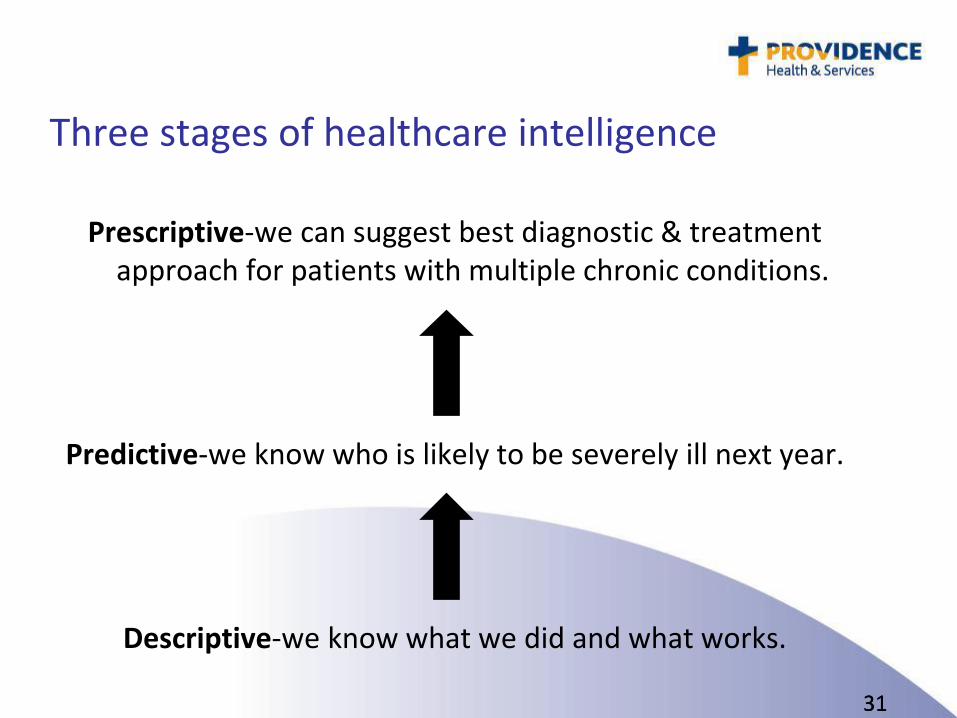
Three stages of healthcare intelligence
Prescriptive-we can suggest best diagnostic & treatment approach for patients with multiple chronic conditions.
Predictive-we know who is likely to be severely ill next year.
Descriptive-we know what we did and what works.

32 32
Nov 2011
An example of prescriptive analytics

33 33
What did their own patients tell them?
• Overall 98 patients with lupus, 10 of them developed thrombosis (blood clots).
• 15x: Relative risk of thrombosis with lupus and persistent proteinuria (protein in urine) vs lupus without proteinuria.
• 12x: Relative risk of thrombosis with lupus and pancreatitis (inflammation of pancreas) versus lupus without pancreatitis.

34 34
Importance of this NEJM report
• First report of using EMR patient data search to aid immediate care of a patient.
• More EMRs lead to more data.
• Idea can scale with large combined data sets.
• Potentially better than anecdotal or expert opinion.
• Challenge will be system speed and relevance of findings.
35 35
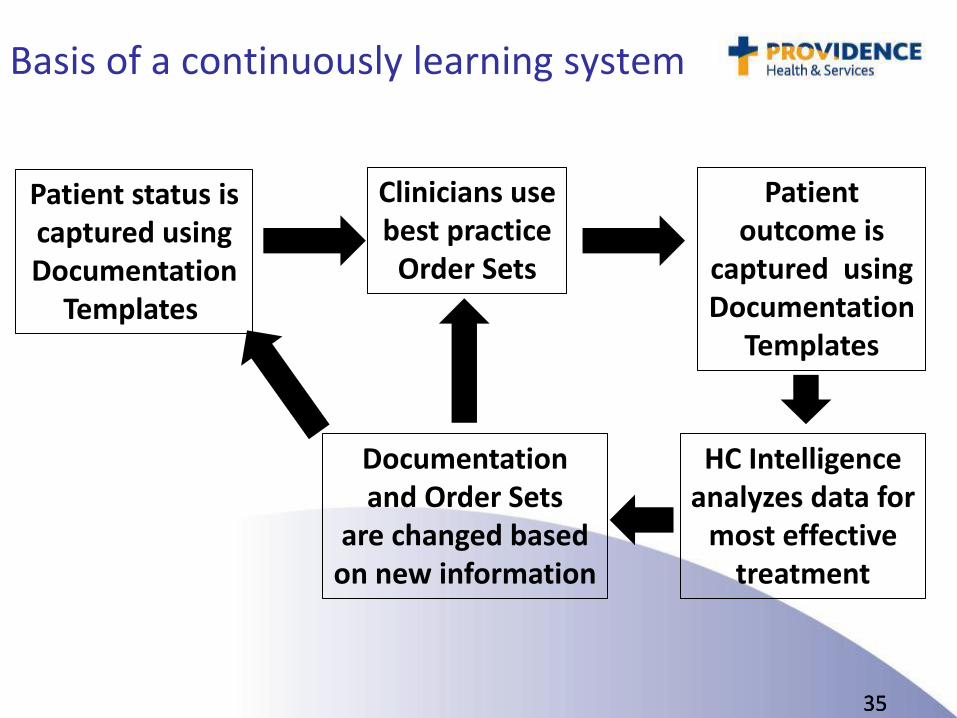
Epic and Amalga/EDW promote a continuous improvement cycle
Clinicians use best practice
Order Sets
Patient outcome is
captured using Documentation
Templates
Patient status is captured using Documentation
Templates
HC Intelligence analyzes data for
most effective treatment
Documentation and Order Sets
are changed based on new information
Basis of a continuously learning system

36 36
0
50
100
150
200
250
60
%
62
%
64
%
66
%
68
%
70
%
72
%
74
%
76
%
78
%
80
%
82
%
84
%
86
%
88
%
90
%
92
%
94
%
96
%
98
%
Number of Primary Care Physicians at a given Treatment Quality score
2005
2010

37 37
What is Big Data?
• Data that are hard to process by routine computing methods.
• Gartner calls it “Extreme Computing.”
• Any one of three characteristics can make data “Big.” Often it is more than one characteristic.
• Volume.
• Velocity.
• Variety.
38 38
What are sources of Big Data in healthcare?
• Physician freetext dictation.
• EHR access logs.
• Medical images.
• Ubiquitous vital signs and fluid sampling from microchips embedded in garments worn at home and office.
• Detailed patient histories of all their habits, symptoms, families, food, activities, moods, purchases, thoughts.
• Electronic medical record entries nationwide.
• Freetext textbook and journal articles.
• Genomics, proteomics, human microbiomics.

39 39
Big Data will revolutionize healthcare.
• Will require massive scale computing.
• But it will take 5-10 years.
• It’s not Either/Or – it’s Both/And.
• Meanwhile we need to master regular data.
• Indications for diagnostic & therapeutic intervention.
• High reliability healthcare.
• Patient throughput.
• Client satisfaction.
• Full value when Big Data combined with clinical, financial, and operational database across millions of patients.
40 40
Conclusions
• Do the Right Thing, Do the Right Thing Right (David Eddy).
• Different data platforms serve different needs.
• We will need to use our EMRs to collect specific physician data.
• It’s the people and effort behind the technology that count.
• The EMR is the collector of data and it is also the Action Arm where knowledge is put back into practice.
• We need to continue to master regular data while we get ready for the revolution of Big Data.

41 41
Questions?
iHT2 Health IT Summit Seattle
Thursday, 23 August 2012
Dick Gibson MD PhD
Chief Healthcare Intelligence Officer
Providence Health & Services – Renton WA