ihs global economics & country risk conference · pdf fileihs global economics &...
TRANSCRIPT

© 2014 IHS
Presentation
ihs.com
IHS
Evolution in China’s economy, regions, and politics
IHS Global Economics & Country Risk Conference
Todd C. Lee, Senior Director, IHS, +1 781 301 9026, [email protected] Brian Jackson, Senior Economist, IHS, +86 10 6533 4567, [email protected] Chris Christopher, Director, IHS, +1 781 301 9113, [email protected] David Yang, Principal Analyst, IHS, +1 703 236 2403, [email protected]
11 November 2014
ECONOMICS & COUNTRY RISK
© 2014 IHS 2
Agenda Evolution in China’s Economy, Regions, and Politics / November 2014
Introduction Todd C. Lee, Senior Director, Global Economics
Economic evolution Brian Jackson, Senior Economist, Asia Economics
Regional development
Chris Christopher, Director, Global Consumer Service
Political outlook David Yang, Principal Analyst, Asia Country Risk
Q&A

© 2014 IHS © 2014 IHS 3
Introduction
Todd C. Lee

© 2014 IHS
0
2000
4000
6000
8000
10000
12000
14000
16000
0
2
4
6
8
10
12
14
16
1980 1990 2000 2010
Real per capita GDP growth (annual % ch, left) Real per capita GDP level (1990 PPP$, right)
China’s economic development since economic reform began
Source: Maddison (2013)

© 2014 IHS 5
China’s economic development during its march to modernity in 30-year spans
0
200
400
600
800
1000
-1.0-0.8-0.6-0.4-0.20.00.20.40.60.81.0
0 10 20 30
0
200
400
600
800
1000
-1.0-0.8-0.6-0.4-0.20.00.20.40.60.81.0
0 10 20 30
0
200
400
600
800
1000
-1.0-0.8-0.6-0.4-0.20.00.20.40.60.81.0
0 10 20 30
0
200
400
600
800
1000
1200
1400
1600
-20
-15
-10
-5
0
5
10
15
20
0 10 20 30
0
200
400
600
800
1000
1200
1400
1600
-20
-15
-10
-5
0
5
10
15
20
0 10 20 30
0
5000
10000
15000
20000
-20
-15
-10
-5
0
5
10
15
20
0 10 20 30
Real per capita GDP growth (% ch, left axis) Per capita GDP level (1990 PPP USD, right axis)
1830-1860 1860-1890 1890-1920
1920-1950 1950-1980 1980-2010
Opium War (Hong Kong ceded to Britain) Taiping Rebellion
1st Sino-Japanese War (Taiwan ceded to Japan)
Qing Dynasty ends
Warlord Era
Warlord Era
Nanjing Gov.
2nd Sino-Japanese War (WWII)
Birth of PRC
Great Leap
Forward
Culture Revolution
Market Reform
Source: Maddison (2013)

© 2014 IHS © 2014 IHS 6
Economic evolution
Brian Jackson

© 2014 IHS 7
Economic restructuring

© 2014 IHS 8
Over three decades China experienced radical changes in the composition of production and income

© 2014 IHS 9
Massive changes in China’s domestic economy mirrored by important shifts globally

© 2014 IHS 10
Ownership and efficiency

© 2014 IHS 11
Changing ownership and incentives in the economy played a key role in the economic boom

© 2014 IHS 12
…but the shift towards a private economy is not strictly one way

© 2014 IHS 13
SOEs remain major players in some sectors, despite clear inefficiencies

© 2014 IHS 14
Economic reform and growth

© 2014 IHS
Reform: The speed we’re used to
15
Reform Year
1978 Third Plenum
Opening for foreign investment projects Duel Track Currency Exchange Town-Village Enterprise
1978
Sino-Foreign Equity Joint Ventures Law 1979
Special Economic Zones: Shantou, Shenzhen, Xiamen, Zhuhai 1980
Household Responsibility Reform (rural farm reform) 1981
14 coastal cities and three provinces designated as open to foreign investment 1984
General Principles of Civil Law: legal support for private market activity 1986
1993 Third Plenum
Exchange rate unification and reform Approved FDI permitted nationwide
1994
Fiscal reform 1995
Central bank reform 1995
Industrial state owned enterprise reform 1995
Price Law - price reform 1997
WTO entry 2001

© 2014 IHS
Reform: The speed we’re seeing today
16
Reform Year
2013 Third Plenum
Finance •Shanghai FTZ foreign deposit interest rate liberalization •Shanghai FTZ cross-border Chinese Yuan (CNY) payment services •Private banking trial •Deposit insurance •Interest rate liberalization
2014 2014 2014 2015(F) 2016-2017(F)
Monopolies and market competition •National and regional SOE reform plans issued •Simplified business registration and financial barriers to entrepreneurship •Red tape cutting – 500+ central approvals canceled or devolved •Increasing competition in service sectors (bank cards, express delivery, hospitals…)
2014 2014 2013-… 2014-…
Foreign investment •SH FTZ negative investment list revisions •12 new FTZ feasibility studies launched, 3 approved, more in pipeline •US-China Bilateral Investment Treaty negotiations begin •Provinces instructed to prepare negative investment lists
Annual review 2014-2015 2014 2014
Government, society and the environment Budget Law revision Environmental Law revision Hukou reform plan
2014 2014 2014

© 2014 IHS
Outlook and challenges
Indicator 1984 → 2013 2014 → 2043
GDP growth (average) 10.1% 5.4%
Services/GDP 25% → 46% → 60%
GDP per capita (USD) 300 → 6,700 → 65,000
Urban population (share) 23% → 53.7% → 75%
Exports (share of world) 1% → 12% → 14%
Imports (share of world) 1% → 10% → 14%
17
• Near-medium term challenges are numerous and substantial, but not insurmountable.
• Setbacks have occurred and will occur in some areas.
• Much implementation remains to be seen – but policy momentum is consistent with a rigorous decade-long reform agenda.

© 2014 IHS © 2014 IHS 18
Regional development
Chris Christopher

© 2014 IHS
China: Regional classification map
19
Northeast Central
Coast
West

© 2014 IHS
Coastal region consumer spending fuels global consumption
0
5
10
15
20
25
2000 2005 2010 2015 2020 2025 2030
Coast Central Northeast West NationalSource: NBS, IHS
20
Share of the China regional consumer spending in global consumption

© 2014 IHS
Sources of growth of global GDP and consumer spending - production and consumption balancing
(Percent of world GDP and consumption, US dollars)
GDP Consumer Spending
2004 2014 2024 2004 2014 2024
U.S. 28 22 19 33 27 23
India 2 3 6 2 3 6
China 4 14 22 3 8 15
Coast 3 8 12 2 5 8
Central 1 4 6 1 2 4
Northeast 1 2 3 0 1 2
West 0 1 2 0 1 2
Western Europe 31 23 18 30 24 19
21

© 2014 IHS
Coastal provinces’ growth slowing down, inner regions development picking up
0
0.2
0.4
0.6
0.8
1
1.2
1.4
1.6
1.8
1980 1985 1990 1995 2000 2005 2010 2015 2020
Coast Central Northeast West
Real GDP per capita index (National average = 1.0)
Source: NBS, IHS
GDP per capita index (National average = 1.0)
Source: NBS, IHS
22

© 2014 IHS
China’s regions over the 1980-2013 period
0
4
8
12
16
20
0 5 10 15 20 25 30 35 40 45 50 55
Real
GDP
per
capi
ta g
row
th, C
AGR
(Per
cent
)
Real GDP Per capita (Thousand 2000 Yuan)
Source: NBS, IHS
Real GDP per capita growth vs Real GDP per capita
2000, 2000-09 1980, 1980-1989 2007, 2007-13 1990, 1990-1999
23

© 2014 IHS 24
China’s population by region
37.6%
35.2%
12.7%
14.6%
Coast Central Northeast West
Total population (1996)
Source: NBS, IHS
41.5%
32.1%
12.2%
14.2%
Coast Central Northeast West
Total population (2013)
Source: NBS, IHS

© 2014 IHS 25
China’s GDP by region
56.6% 24.5%
10.3%
8.6%
Coast Central Northeast West
Real GDP (1996)
Source: NBS, IHS
57.7% 24.1%
10.6%
7.6%
Coast Central Northeast West
Real GDP (2013)
Source: NBS, IHS

© 2014 IHS 26
China’s private consumption by region
50.7%
27.9%
10.7%
10.7%
Coast Central Northeast West
Real private consumption (1996)
Source: NBS, IHS
57.0% 24.6%
9.4%
9.0%
Coast Central Northeast West
Real private consumption (2013)
Source: NBS, IHS

© 2014 IHS 27
Coastal region no longer leads growth, the Western region has the most dynamic consumer markets
0
2
4
6
8
10
12
14
16
1995-99 2000-04 2005-09 2010-14 2015-20
Coast Central NortheastWest National
GDP per capita (Thousand yen)
Source: NBS, IHS
Real GDP per capita, compound annual growth rate Real GDP per capita, CAGR (percent)
Source: NBS, IHS
0
2
4
6
8
10
12
14
16
1995-99 2000-04 2005-09 2010-14 2015-20
Coast Central NortheastWest National
GDP per capita (Thousand yen)
Source: NBS, IHS
Real consumption per capita, compound annual GDP per capita (Thousand yen)
Source: NBS, IHS
Real GDP per capita, compound annual growth rate Real consumption per capita, CAGR
Source: NBS, IHS

© 2014 IHS 28
Urban population – central region growing faster
0
50
100
150
200
250
300
350
400
450
2005 2010 2015 2020 2025 2030
Coast CentralNortheast West
Urban population
Source: NBS, IHS
Urban population (millions)
Source: NBS, IHS
20
30
40
50
60
70
80
2005 2010 2015 2020 2025 2030
Coast CentralNortheast WestNational
Urbanization rate (percent)
Source: NBS, IHS
Urbanization rate (percent)
Source: NBS, IHS

© 2014 IHS
Over three decades, China experienced radical changes in the composition of income
29
-
500
1,000
1,500
2,000
2,500
3,000
3,500
4,000
4,500
5,000
1978 1983 1988 1993 1998 2003 2008 2013
Rural income Urban income
Rising per capita income and inequality
Source: NBS, Chen, Jiandong (2010), IHS
Nom
inal
USD
Rising per capita income and inequality
Source: NBS, IHS

© 2014 IHS
Consumer spending to GDP is picking up across all regions
20
25
30
35
40
45
50
55
60
1996 1999 2002 2005 2008 2011 2014 2017 2020 2023 2026 2029
Coast Central Northeast West National
Private consumption to GDP (percent)
Source: NBS, IHS
Private consumption to GDP (percent)
Source: NBS, IHS
30

© 2014 IHS
Coastal regions still on top in terms of consumption per capita levels
31
0
4
8
12
16
20
1996 1998 2000 2002 2004 2006 2008 2010 2012 2014 2016 2018 2020
Coast Central Northeast West National
Real Consumption per capita (Thousand 2000 Yuan)
Source: NBS, IHS
Real private consumption per capita (Thousand 2000 Yuan)
Source: NBS, IHS

© 2014 IHS © 2014 IHS 32
Political outlook
David Yang

© 2014 IHS
Overview: Domestic politics
• Pres. Xi Jinping has achieved high centralization of power
• Legal reforms emphasized at recent 4th Plenum • Administrative reforms to reduce local gov’t interference
• But local leaders have other levers to indirectly influence judges
• Anti-corruption campaign still ongoing • Instrument to remove obstacles to further economic reforms?
33

© 2014 IHS
Overview: External relations
• High-level dialogues with Japan resumed after 4-yr gap
• Military exchanges with Vietnam resumed after May standoff
• Current “One Belt, One Road” campaign - response to U.S. pivot?
34

© 2014 IHS
The anti-corruption campaign: Targeting both “Tigers” & “Flies”
• Current anti-corruption drive unprecedented in reach • Former Politburo Standing Committee member Zhou Yongkang
• Former Central Military Commission Deputy Chair Xu Caihou
35
0
5
10
15
20
25
30
0
10000
20000
30000
40000
50000
60000
2003 2005 2007 2009 2011 2013
Total Provincial/Ministerial level (RHS)
Figure 1: Number of officials formally investigated for corruption
Source: IHS
Notes: 2014 based on reports through August 2014.
• Number of senior officials censured in the first 20 months of Xi’s tenure more than the previous five years combined

© 2014 IHS
The anti-corruption campaign: Effect on businesses
• Some evidence that intensity of crackdown negatively correlated with GDP growth & FDI at provincial level
• Crackdown has slowed project approvals
• Reduced flow of funds has depressed real estate prices
36
2%
3%
4%
5%
6%
7%
8%
9%
10%
11%
12%
10 20 30 40 50 60
Figure 2: GDP growth vs. investigation rate by province
Source: IHS
Officials investigated per million
2014
Q1
GD
P gr
owth
rate
• IHS expects negative impact of the campaign to be only temporary

© 2014 IHS
The anti-corruption campaign: Outlook
• Current campaign will continue until at least 2017
• Intensity may slacken over the next 3 years
• We do not expect the current campaign to significantly reduce corruption risks beyond the next three years • Xi’s position will be unassailable after the next Party Congress
37

© 2014 IHS
The anti-monopoly campaign: Selective enforcement against MNCs?
• Multiple sectors affected since 2013
• Jan. 2013: Samsung and 5 other LCD makers fined $57M
• Aug. 2013: 5 foreign & 1 local baby formula makers fined $110M
• Nov. 2013: Qualcomm investigation began, w/ potential $1B fine
• May 2014: 5 foreign optometric makers fined $3.1M
• Jul. 2014: Microsoft offices raided in anti-trust probe
• Aug. 2014: Audi, Chrysler, Mercedes-Benz & Toyota investigated
38

© 2014 IHS
The anti-monopoly campaign: Selective enforcement against MNCs?
• Some domestic firms have been investigated
• Luxury distillers Maotai & Wuliangye
• Jewelry retailers such as Laofengxiang
• China Unicom & China Telecom (ongoing since 2011)
• Automaker FAW Group (ongoing since 2012)
• Major SOEs more likely to avoid fines through negotiation
• Similar enforcement bias in U.S. Sherman Act cases?
39

© 2014 IHS
The anti-monopoly campaign: Outlook
• Cases against foreign firms do not always benefit domestic producers who compete on price
• Sectoral struggles may be more important (e.g. insurers vs. auto-parts makers)
• Gov’t more sensitive to perceptions of selective enforcement
• MNCs that sell directly to consumers remain vulnerable LT
40

© 2014 IHS
The “Occupy Central” protests: Key issues
• Basic framework laid down by PRC National People’s Congress on 31 August:
• HKSAR Chief Executive to be elected by universal suffrage in 2017
• 2 – 3 candidates to be nominated by pro-Beijing nominating committee
• Opposition Pan-Democrats demand direct nominations
• But nominating committee is stipulated under Basic Law
• NPC framework must be adopted by HK Legislative Council
41

© 2014 IHS
The “Occupy Central” protests: Key players
The protests involve a range of groups, united in their dissatisfaction with the NPC framework, but unclear on specific demands:
• Student groups (e.g. Hong Kong Federation of Students, Scholarism) form the core
• Opposition parties have not played a leadership role
• Labor union participation is minimal
• A number of fringe groups are likely to be more militant
42

© 2014 IHS
The “Occupy Central” protests: Key players
• Student groups such as the Hong Kong Federation of Students & Scholarism form the core of the protests
• Opposition parties support the protests, but have not played a leadership role
• The participation of labour unions has been minimal
• A number of fringe groups are likely to be more militant
• Groups are united in their dissatisfaction with the NPC framework, but unclear on their specific demands
43

© 2014 IHS 44
The “Occupy Central” protests: Locations and numbers Protest sites in Hong Kong – November 2014
© 2014 IHS
Source: AFP
Hong Kong & Vicinity
Number of Occupy protesters as of late October
• Admiralty/Central: ~4,000; ~2,000 tents
• Mongkok: ~2,800; 100 tents
• Causeway Bay: 200; 37 tents

© 2014 IHS
The “Occupy Central” protests: Prospects for resolution
• Direct Chinese intervention is unlikely
• No compromise is likely on Beijing’s basic framework
• Economic impact of the protests will be relatively minor – the HK gov’t can afford to be patient
• No clear consensus among protesters, a resolution will likely have to be brokered by opposition party leaders
• Some police coercion may be needed to remove hold-outs
45

© 2014 IHS © 2014 IHS 46
Appendix Additional slides on China regional development

© 2014 IHS
The long-term trend in world trade is expected to flatten
World imports as a percent of GDP
10
15
20
25
30
35
40
1980 1984 1988 1992 1996 2000 2004 2008 2012 2016 2020 2024
Perc
ent

© 2014 IHS
Sources of growth of global GDP and consumer spending - production and consumption balancing
(Percent of world GDP and consumption, US dollars)
GDP Consumer Spending
2004 2014 2024 2004 2014 2024 North America 33 26 23 37 32 27
U.S. 28 22 19 33 27 23
Asia-Pacific 24 31 39 22 26 35
Japan 11 6 4 11 7 5
China 4 14 22 3 8 15
India 2 3 6 2 3 6
Western Europe 31 23 18 30 24 19
Emerging Europe 5 7 8 5 7 7
Latin America 3 6 6 3 7 7
ME & Africa 4 7 8 3 4 5
48

© 2014 IHS
Lower wages give Vietnam a cost advantage
Average annual manufacturing wages, USD
© 2014 IHS
Source: General Statistics Office, Vietnam, China’s NBS Note: China data refers to urban manufacturing wages, VNM data is manufacturing wages in state sector
0
2,000
4,000
6,000
8,000
10,000
12,000

© 2014 IHS
Region Province
2013 Real GDP/pop
2008-2013 CAGR
Real GDP per capita Population
(2000 Yuan, 1000s) (millions) Beijing 55.6 21.2 8.8% Tianjin 66.9 14.8 15.3% Shanghai 72.1 24.2 8.3% Jiangsu 49.7 79.7 11.1% Zhejiang 45.0 55.2 9.2%
Coast Guangdong 43.0 106.9 9.7% Liaoning 45.6 44.1 11.5% Hebei 27.0 73.6 10.3% Shandong 40.0 97.7 10.9% Fujian 43.7 37.9 12.1% Hainan 22.9 9.0 11.7% Chongqing 26.7 29.8 14.8% Jiangxi 19.4 45.4 12.1% Hunan 23.3 67.2 12.4%
Central Hubei 31.8 58.2 12.6% Sichuan 21.8 81.4 13.4% Anhui 21.8 60.5 12.7% Henan 22.8 94.5 10.7%
Province mapping classification – coast & central
50

© 2014 IHS
Province mapping classification – northeast & west
51
Region Province 2013 Real GDP/pop
2008-2013 CAGR
Real GDP per capita Population (2000 Yuan, 1000s) (millions)
Heilongjiang 32.7 38.5 10.8%
Jilin 30.1 27.6 12.2%
Northeast Inner Mongolia 38.2 25.1 13.3%
Shanxi 18.8 36.4 10.2%
Shaanxi 21.1 37.8 13.2%
Ningxia 16.9 6.6 11.7%
Tibet 17.0 3.1 12.3%
Qinghai 20.4 5.8 12.4%
West Xinjiang 22.3 22.7 10.7%
Gansu 15.0 25.9 11.5%
Yunnan 16.2 47.1 12.6%
Guizhou 8.1 34.7 13.0%
Guangxi 19.1 47.4 12.4%

© 2014 IHS
Chinese government subsidized inner-land provinces’ economic growth
0
5
10
15
20
25
1993 1995 1997 1999 2001 2003 2005 2007 2009 2011 2013
Coast Central Northeast West National
Government spending to GDP (percent)
Source: NBS, IHS
Government spending to GDP (percent)
Source: NBS, IHS
52

© 2014 IHS
Foreign investment drove coastal regions’ economic growth
0
2
4
6
8
10
12
1990 1995 2000 2005 2010 2015 2020 2025 2030
Coast Central
Foreign direct investment to GDP (percent)
Source: NBS, IHS
Foreign direct investment to GDP share (percent)
Source: NBS, IHS
53

© 2014 IHS
Region Province Symbol Region Province Symbol Beijing Heilongjiang Tianjin Jilin Shanghai Northeast Inner Mongolia Jiangsu Shanxi Zhejiang Shaanxi
Coast Guangdong Liaoning Hebei Shandong Fujian Hainan Chongqing Ningxia
Jiangxi Tibet Hunan Qinghai Hubei West Xinjiang
Central Sichuan Gansu Anhui Yunnan Henan Guizhou Guangxi
Regions’ GDP growth and GDP per capita - Legend
54

© 2014 IHS
China’s regions over the 1980-2013 period
0
4
8
12
16
20
0 5 10 15 20 25 30 35 40 45 50 55Real
GDP
per
capi
ta g
row
th, C
AGR
(Per
cent
)
Real GDP Per capita (Thousand 2000 Yuan)
Source: NBS, IHS
Real GDP per capita growth vs Real GDP per capita
2000, 2000-09 1980, 1980-1989 2007, 2007-13 1990, 1990-1999
55

© 2014 IHS
China’s regions over the 1980-89 period
0
4
8
12
16
20
0 5 10 15 20 25 30 35 40 45 50 55
Real
GDP
per
capi
ta g
row
th, C
AGR
1980
-89
(Per
cent
)
1980 Real GDP Per capita (Thousand 2000 Yuan)
Source: NBS, IHS
Real GDP per capita growth vs Real GDP per capita
Northeast Central Coast West
56

© 2014 IHS
China’s regions over the 1990-99 period
0
4
8
12
16
20
0 5 10 15 20 25 30 35 40 45 50 55
Real
GDP
per
capi
ta g
row
th, C
AGR
1990
-99
(Per
cent
)
1990 Real GDP Per capita (Thousand 2000 Yuan)
Source: NBS, IHS
Real GDP per capita growth vs Real GDP per capita
Northeast Central Coast West
57

© 2014 IHS
China’s regions over the 2000-09 period
0
4
8
12
16
20
0 5 10 15 20 25 30 35 40 45 50 55
Real
GDP
per
capi
ta g
row
th, C
AGR
2000
-09
(Per
cent
)
2000 Real GDP Per capita (Thousand 2000 Yuan)
Source: NBS, IHS
Real GDP per capita growth vs Real GDP per capita
Northeast Central Coast West
58

© 2014 IHS
China’s regions over the 2007-13 period
0
4
8
12
16
20
0 5 10 15 20 25 30 35 40 45 50 55
Real
GDP
per
capi
ta g
row
th, C
AGR
2007
-13
(Per
cent
)
2007 Real GDP Per capita (Thousand 2000 Yuan)
Source: NBS, IHS
Real GDP per capita growth vs Real GDP per capita
Northeast Central Coast West
59

© 2014 IHS
China’s regions over the 1980-2013 period
0
4
8
12
16
20
0 5 10 15 20 25 30 35 40 45 50 55Real
GDP
gro
wth
, CAG
R 19
80-8
9 (P
erce
nt)
1980 Real GDP Per capita (Thousand 2000 Yuan)
Source: NBS, IHS
Real GDP growth vs Real GDP per capita
60
1980, 1980-1989 1990, 1990-1999 2000, 2000-09 2007, 2007-13

© 2014 IHS
China’s regions over the 1980-89 period
0
4
8
12
16
20
0 5 10 15 20 25 30 35 40 45 50 55Real
GDP
gro
wth
, CAG
R 19
80-8
9 (P
erce
nt)
1980 Real GDP Per capita (Thousand 2000 Yuan)
Source: NBS, IHS
Real GDP growth vs Real GDP per capita
Northeast Central Coast West
61

© 2014 IHS
China’s regions over the 1990-99 period
0
4
8
12
16
20
0 5 10 15 20 25 30 35 40 45 50 55Real
GDP
gro
wth
, CAG
R 19
90-9
9 (P
erce
nt)
1990 Real GDP Per capita (Thousand 2000 Yuan)
Source: NBS, IHS
Real GDP growth vs Real GDP per capita
Northeast Central Coast West
62

© 2014 IHS
China’s regions over the 2000-09 period
0
4
8
12
16
20
0 5 10 15 20 25 30 35 40 45 50 55Real
GDP
gro
wth
, CAG
R 20
00-0
9 (P
erce
nt)
2000 Real GDP Per capita (Thousand 2000 Yuan)
Source: NBS, IHS
Real GDP growth and Real GDP per capita
Northeast Central Coast West
63

© 2014 IHS
China’s regions over the 2007-13 period
0
4
8
12
16
20
0 5 10 15 20 25 30 35 40 45 50 55
Real
GDP
gro
wth
, CAG
R 20
07-1
3 (P
erce
nt)
2007 Real GDP Per capita (Thousand 2000 Yuan)
Source: NBS, IHS
Real GDP growth and Real GDP per capita
Northeast Central Coast West
64

© 2014 IHS
Regional growth vs. GDP per capita level
6
7
8
9
10
11
12
13
14
0 7 14 21 28
Real
GDP
gro
wth
, CAG
R (P
erce
nt)
Real GDP Per capita (Thousand 2000 Yuan)
Real GDP per capita growth and Real GDP per capita
Source: NBS, IHS
65
Northeast Central Coast West National
1980,1980-89 1990,1990-99 2000, 2000-09 2007, 2007-13

© 2014 IHS
Coastal provinces no longer China’s hub for economic growth
0
2
4
6
8
10
12
14
16
1980-1985 1985-1990 1990-1995 1995-2000 2000-2005 2005-2010 2010-2015 2015-2020
Coast Central Northeast West National
GDP per capita (Thousand yen)
Source: NBS, IHS
Real GDP per capita, compound annual growth rate (percent) Real GDP per capita, compound annual growth rate (percent)
Source: NBS, IHS
66

© 2014 IHS
Real GDP per capita in coastal regions is still above the rest of China
0
10
20
30
40
50
60
70
80
1970 1975 1980 1985 1990 1995 2000 2005 2010 2015 2020
Coast Central Northeast West National
Real GDP per capita (Thousand 2000 Yuan)
Source: NBS, IHS
67
© 2014 IHS
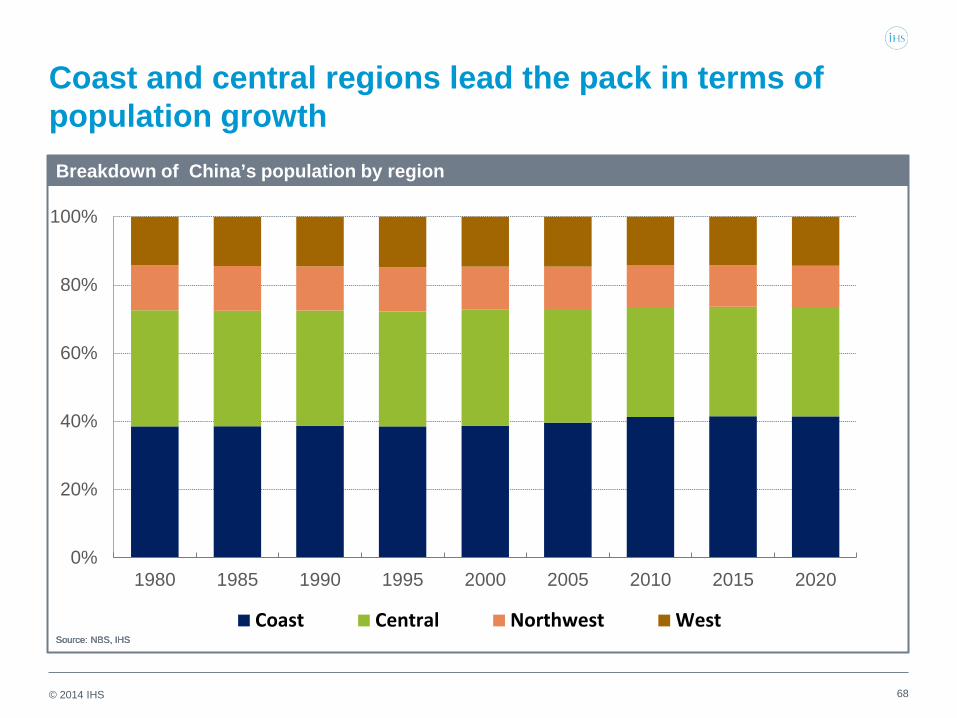
Coast and central regions lead the pack in terms of population growth
0%
20%
40%
60%
80%
100%
1980 1985 1990 1995 2000 2005 2010 2015 2020
Coast Central Northwest West
Population share
Source: NBS, IHS
GDP per capita (Thousand yen)
Source: NBS, IHS
Real GDP per capita, compound annual growth rate (percent) Breakdown of China’s population by region
Source: NBS, IHS
68

© 2014 IHS
Western provinces progressively becoming China’s most dynamic consumer markets
0
2
4
6
8
10
1996-2001 2001-06 2006-11 2011-16 2016-21Coast Central Northeast West National
GDP per capita (Thousand yen)
Source: NBS, IHS
Real consumption per capita, compound annual growth rate (percent) GDP per capita (Thousand yen)
Source: NBS, IHS
Real GDP per capita, compound annual growth rate (percent) Real consumption per capita, compound annual growth rate (percent)
Source: NBS, IHS
69

© 2014 IHS 70
Breakdown of China’s GDP by region
55.8% 25.0%
10.5%
8.7%
Coast Central Northeast West
Nominal GDP (1996)
Source: NBS, IHS
55.4% 24.4%
11.6%
8.6%
Coast Central Northeast West
Nominal GDP (2013)
Source: NBS, IHS

© 2014 IHS 71
Breakdown of China’s private consumption by region
51.1%
27.2%
10.8%
10.9%
Coast Central Northeast West
Nominal private consumption (1996)
Source: NBS, IHS
54.8%
25.3%
10.3%
9.6%
Coast Central Northeast West
Nominal private consumption (2013)
Source: NBS, IHS

© 2014 IHS
IHS Customer Care: • Americas: +1 800 IHS CARE (+1 800 447 2273); [email protected] • Europe, Middle East, and Africa: +44 (0) 1344 328 300; [email protected] • Asia and the Pacific Rim: +604 291 3600; [email protected]
© 2014 IHS. No portion of this report may be reproduced, reused, or otherwise distributed in any form without prior written consent, with the exception of any internal client distribution as may be permitted in the license agreement between client and IHS. Content reproduced or redistributed with IHS permission must display IHS legal notices and attributions of authorship. The information contained herein is from sources considered reliable but its accuracy and completeness are not warranted, nor are the opinions and analyses which are based upon it, and to the extent permitted by law, IHS shall not be liable for any errors or omissions or any loss, damage or expense incurred by reliance on information or any statement contained herein. For more information, please contact IHS at Customer Care (see phone numbers and email addresses above). All products, company names or other marks appearing in this publication are the trademarks and property of IHS or their respective owners.