igg multiple myelomadm5migu4zj3pb.cloudfront.net/manuscripts/106000/106971/...kinetics of...
TRANSCRIPT

Kinetics of Tumor Growth and Regression
in IgG Multiple Myeloma
PErm W. SULLIVAN and SYDNEYE. SALMONFrom the Cancer Research Institute and the Department of Medicine,School of Medicine, University of California, San Francisco, California 94122
A B S T R A C T Studies of immunoglobulin synthesis,total body tumor cell number, and tumor kinetics werecarried out in a series of patients with IgG multiplemyeloma. The changes in tumor size associated withtumor growth or with regression were underestimatedwhen the concentration of serum M-component wasused as the sole index of tumor mass. Calculation of thetotal body M-component synthetic rate (corrected forconcentration-dependent changes in IgG metabolism)and tumor cell number gave a more accurate andpredictable estimate of changes in tumor size. Tumorgrowth and drug-induced tumor regression were foundto follow Gompertzian kinetics, with progressive retar-dation of the rate of change of tumor size in both ofthese circumstances. This retardation effect, describablewith a constant a, may be caused by a shift in theproportion of tumor cells in the proliferative cycle. Drugsensitivity of the tumor could be described quantita-tively with a calculation of Bo, the tumor's initialsensitivity to a given drug regimen. Of particularclinical significance, the magnitude of a given patient'stumor regression could be predicted from the ratio of
This work was presented in part at the National Meetingof the American Federation for Clinical Research, AtlanticCity, N. J., 3 May 1971 (Salmon, S. E., and P. W. Sulli-van. 1971. Effects of treatment on total body tumor cellnumber in multiple myeloma. Clin. Res. 19: 496), and inpart at the Myeloma Workshop sponsored by the LeukaemiaResearch Fund and held at the Royal Postgraduate MedicalSchool, London, 24-25 March 1971 (Salmon, S. E. 1971.Immunoglobulin synthesis and tumour cell number and thenatural history of multiple myeloma. Brit. Med. J. 2: 321).
Dr. Sullivan was supported by predoctoral fellowshipsfrom the California Division of the American Cancer So-ciety and from the International College of Surgeons. Dr.Salmon's present address is Division of Hematology andOncology, Department of Medicine, University of Ari-zona College of Medicine, Tucson, Ariz. (Reprint requestsshould be directed to Dr. Salmon.)
Received for publication 15 November 1971 and in re-vised form 10 February 1972.
B0 to a. Mathematical proof was obtained that 'theretardation constant determined during tumor regres-sion also applied to the earlier period of tumor growth,and this constant was used to reconstruct the pre-clinical history of disease. In the average patient, fewerthan 5 yr elapse from the initial tumor cell doublingto its clinical presentation with from 1011 to more than1012 myeloma cells in the body. The reduction in totalbody tumor mass in most patients responding to therapyranges from less than one to almost two orders ofmagnitude. Application of predictive kinetic analysis tothe design of sequential drug regimens may lead tofurther improvement in the treatment of multiplemyeloma and other tumors with similar growthcharacteristics.
INTRODUCTION
Kinetic analysis of growth of disseminated malignanciesin man is a subject of major importance, both forunderstanding the pathophysiology of cancer and forplanning optimal therapy. Convincing evidence of thetherapeutic ramifications of such kinetic analysis isfound in the series of dramatic demonstrations withvarious animal tumors; knowledge of the cell populationand cell-cycle kinetics of certain tumors has providedthe necessary foundation for designing curative chemo-therapy (1-4). Animal tumors, which arise from-andcan be transplanted with-a single neoplastic cell, canbe assessed serially, using measurements of tumor mass;by further transplantation studies, the population andcellular kinetics of viable tumor stem cells can bestudied during growth and during drug-induced regres-sion of the neoplasm (5).
Although measurements of tumor size can sometimesbe obtained in man, transplantation studies cannot bedone, and other methods of serially estimating thenumber of viable tumor cells must be found. Multiple
The Journal of Clinical Investigation Volume 51 July 1972 1697

myeloma may represent an "ideal" disseminated neo-plasm for kinetic study, as the population of tumor cellscan be readily sampled, the cells almost always producea marker immunoglobulin (M-component)l whosemetabolism has been well characterized, and the tumorappears to arise from a single neoplastic cell clone.
Previous studies from this laboratory (6, 7) estab-lished that measurements of synthesis of M-componentin vivo and in vitro could be used to determine thetotal number of tumor cells present in patients withmultiple myeloma. In those patients, clinical manifesta-tions of disease did not become apparent until more than1011 myeloma cells were present in the body. Our presentinvestigations were designed to provide a firm mathe-matical basis for the application of predictive kineticanalysis to the design and evaluation of treatment ofmultiple myeloma, and to provide new insights into itsnatural history.
METHODSPatient studies. Patients with well-documented IgG
multiple myeloma (subclasses IgG1 and IgG2) were selectedfor study. Clinical and immunologic criteria used for diagnosisand staging of these patients were detailed previously, aswere data on metabolism in vivo of [1251-labeled]IgG and ontotal body tumor cell number in 10 of these patients (6).
Bone marrow aspirates were collected in heparin; short-term tissue cultures were prepared for studies of cellularsynthesis of myeloma protein (IgGmp) (8). Newly synthesizedIgG was measured with the "sandwich" radioimmunoassaytechnique (9). Cellulose acetate electrophoresis and densi-tometry2 were performed at least monthly. The serum con-centration of IgGmp was determined by careful analysis of theelectrophoretic patterns. Plasma volume was measured by theNuclear Medicine division of this institution every 3 monthswith the [E251-labeled] albumin technique. The total body syn-thetic rate of IgGmp was calculated from the concentration ofIgGmp in serum, the plasma volume, and the body weight asdescribed below.
In addition to the cases studied at this institution, recordson 19 patients treated in cooperating institutions of theSouthwest Cancer Chemotherapy Study Group (SWCCSG)were also analyzed. Plasma volumes for these patients wereestimated on the basis of height and weight, using the tech-nique of Fairbanks and Tauxe (10). Storage of patient recordsand computations of metabolic turnover data, IgGmp syntheticrates and total body tumor cell number, as well as curvefitting and tumor kinetic studies, were carried out with aGeneral Electric 260 digital computer via the GE Mark ITime Sharing Service (General Electric Co., InformationServices Business Div., Schenectady, N. Y.). Remission ofmyeloma was defined as at least halving of the total bodytumor cell number, and significant regression was defined as anapproximate 1-log reduction in the total number of tumorcells in the body.
Calculation of the total body IgG synthetic rate and tumor cellnumber. The total body synthetic rate for IgGmp was calcu-
1Abbreviations used in this paper: M-component, a mono-clonal immunoglobulin; IgGmp, myeloma protein; SWCCSG,Southwest Cancer Chemotherapy Study Group.
2 Microzone system, Beckman Instruments, Inc., Fullerton,Calif.
lated with the equation for the fractional catabolic rate ofIgG developed by Waldmann and Strober (11). A detaileddescription of their derivation and its assumptions appears intheir work. Their equation is:
Df = a - Vc + mD
where: f = fractional catabolic rate, a = the fraction of theplasma pool isolated per day (the fraction of the intravascularpool catabolized per day at infinite IgG concentration),D = the number of molecules protected from catabolism perunit time at full saturation, Vc = the total circulating IgGpool (the product of the serum IgG concentration and theplasma volume), and m = the slope of a plot of the reciprocalof the milligrams of IgG protected ( IV( f))!against the
reciprocal of the plasma pool of IgG,I
Vc6From our studies in man, we have estimated 0.16 as the
value for a and, as did Waldmann and Strober (11), we used147 mg of IgG/kg per day as the value for D. In the steadystate, the total IgG catabolized by the body (f. Vc) equalsthe total IgG synthesized by the body. It should be notedthat f is governed by the total serum IgG concentration, notjust the concentration of the M-component. As a result of thesevere deficiency in normal immunoglobulins which occurs inmyeloma, the concentration of M-component alone is usuallysatisfactory; in the presence of a significant amount of normalIgG in addition to the IgGmp, total IgG must be measured,and the calculated f must be used to determine the turnoverrate of the M-component.
As described previously (6), IgG myeloma cell number canthen be derived if the average rate of IgG synthesis permyeloma cell is measured. Thus:
Total body myeloma cell numberNumber of myeloma cells in vitro
Rate of total body myeloma IgG synthesis in vivoRate of total myeloma IgG synthesis in vitro
Correcting to the average IgG synthetic rate per myeloma cell,
N = f. Vcr
(2)
where: N = total number of myeloma cells in the body,r = rate of IgG synthesis per myeloma cell per day, and Vcand f are as defined above.
A first order differential equation was developed to providea more general solution for myeloma cell number in the non-steady state (during tumor growth or response):
Change = Production - Destruction
dd Vc= (r.N) - (f- Vc).
Solving for tumor cell number
(fVC+ -Vc)N- (3)
r
dwhere: d = time rate of change.
1698 P. W. Sullivan and S. E. Salmon
(1)

Clinical data including serum IgGmp, plasma volume, andbody weight were used to calculate f from equation 1, andthe value for f was substituted into equation 3 for determina-tion of the total number of myeloma cells in the body. Thevalue for r was determined for each of our cases by in vitromeasurement of IgG synthesis on fresh marrow aspirates (6, 8).Measurements of r were not carried out for the cases providedby the SWCCSG,and assumed reasonable values for r wereused in the analysis of those cases. Solution of equation 3 withthe approximation, (d/dt) Vc - A Vc/At, yielded curves of thelog of tumor cell number vs. time such as those seen in Fig. 1.
THEORETICALBACKGROUND
The curves (in Fig. 1) demonstrate that neither tumorgrowth nor response to treatment was exponential, butrather that the rate of these processes appears to becontinuously changing. As extensively formulated firstby Laird, embryonic tissues (12) and a variety ofanimal tumors (13, 14) have a similar growth patternwhich can be described by a Gompertzian function.Subsequent work at the Southern Research Institutehas extended this concept (4, 15, 16).
Growth, which occurs in Gompertzian fashion, couldbe due to any of the following situations: (a) a decreas-ing proliferative fraction with an increasing number ofresting cells (Go), an increasing number of nonclonogeniccells, or both; (b) an increase in the mean cell-cycletime; or (c) a continuous increase in the fractional cellloss. Griswold, Simpson-Herren, and Schabel (17),working with the metastatic plasmacytoma of thehamster (PLA-1), have shown that the slowing oftumor growth is due primarily to an increasingly largefraction of the cells in a nonproliferative state, with apossible increase in the fraction of cells lost. Measure-ments of the cell-cycle time for the hamster plasma-cytoma by Griswold et al. (17) and for human myelomaby Killmann, Cronkite, Fliedner, and Bond (18) haveyielded quantitatively similar results.
Characteristics of the Gompertz equation. Gompertzfirst developed his equation for actuarial purposes (19).Rewritten in terms of tumor cell number (12), we have:
N = Ne(Aola) (i-0t) (4)
where: N = the dependent variable, t = the indepen-dent variable, and No, AO, and a = constants for anyparticular system. Equation 4 is also the solution of thedifferential equations:
dNdt= yN
(5)
dt = -aiwhere: y = Ae-at. Equation 5 describes a system ofexponentially increasing or decreasing Nwhere the rateof exponential change is continuously decreasing at theconstant rate a. When t = 0, N = No; and when
012 [
1011
V,-I
LUu
0LUJ
Io12k-_
1011L-
- . ~~(A)
GROWTH
0'
0
TIME
*BO (B)
V0S REGRESSION
EA M0
T A ,M
TIME
FIGURE 1 Log of tumor cell number vs. linear plot of timein an untreated case (A) and a treated case (B). Neithergrowth nor regression is linear.
t = 00, N= NeAo1a. Equation 4 may be rewritten as:
1 dN A czatN dt
/1 dN\and ln (-t-) = In Ao -at.
1 dNXThe term (4No dt[) is referred to as the specific growth
1 ANrate and is estimated from data as N-A. When a isN At~constant this equation yields a straight line with slopeof -a and y intercept at In A0 (Fig. 2), and theGompertz equation provides a workable model of thetumor's growth. When a tumor yields data that ap-proximate a straight line on this graph, more precisecurve-fitting techniques (Appendix I) are used. Apply-
Tumor Growth and Regression in IgG Multiple Myelom 11699

0.06
0.05
0.04
SPECIFICGROWTH
RATE
I !N'\(+N nt
GOMPERTZEQUATIONAo -0(t
N = Noe (le
0.031-
0.02 H
0.01
(A)
100 200 300
DAYS
SPECIFICDEATHRATE
1 AN( N At/
100 200 io0o
DAYS OF TREATMENT
FIGURE 2 (A) Derivation of the instantaneous growth rate(Ai) and a for myeloma cells from serial measurements of thespecific growth rate during the period of observation in an un-treated myeloma patient. Ao, the instantaneous growth rate atthe time of first observation, is the intercept of the line at time0, while a is the slope. (B) Use of clinical data obtained duringa period of consistent drug treatment for approximation of aand the instantaneous regression rate (B.) for patient W. W.The specific death rate of tumor cells is a term comparablewith the specific growth rate shown in (A), but is negativein sign. a is the slope of the line on this plot, while Bo, con-sidered to reflect the sensitivity of the tumor to the drug, isthe intercept of the line at time 0. Plots such as those shownin (A) and (B) are screening techniques to determine whetherGompertzian conditions prevail. Whenthey do, and a straight-line relationship such as those shown here is seen, the moreprecise curve fitting computer relationships (Appendix I) areused.
ing the Gompertz equation to tumor regression (seebelow and Appendix II), a new comparable term-
specific death rate (-o -d- )-yields the same linear
relationship but with a negative A0, which we define asBo. Bo is thus the instantaneous regression rate at the
start of treatment and is an index of drug sensitivityof the tumor.
Some of the implications of Gompertzian growth aredetailed by Laird, Tyler, and Barton (20), includingthe following useful concepts: (a) The time axis maybe easily shifted T units, permitting a new equation tobe written,
N = Nie(Ai1a) (1-e6st)where: Al = Acie-aT, N= N1 when t = 0, and N=NieAl/a when t = oo; (b) the instantaneous rate ofgrowth at any ti is Ai, where
Ai = A e-ali
(Ai is the slope of the line tangent to the growth curveat ti); (c) the theoretical time required to grow fromone cell to N. cells is
ln [1 - ( a )n No]
-a
(d) the theoretical doubling time (generation time, tg)from one cell to two cells is
In 2tg =
A
where A. = A 0eaT; and (e) the theoretical proliferativefraction (p) at ti, if tg is assumed to be constant, is
pi = Ai*tg%.Application of the Gompertz equation to tumor regression
data and derivation of a for tumor growth. As developedby Dr. Hugo M. Martinez of this institution anddetailed in Appendix II, mathematical derivation showsthat the retardation constant a applies to both tumorregression and tumor growth. Thus, in circumstanceswhere a consistent treatment program was used for agiven myeloma patient, it was possible to derive theretardation constant necessary to describe the dynamicsof the disease. With certain assumptions, stated below,the derived a could also be used for reconstruction ofthe subclinical growth phase of the tumor clone fromits initial doubling.
Estimation of the initial growth rate (A,). Values forA,, the instantaneous growth rate at the time of thetumor's initial doubling (start of growth), cannot bederived from tumor regression data. Its approximationcan be made only by analysis of progressive tumorgrowth in untreated cases, or by addition of severalconstraints to the Gompertz function which are basedon generally accepted survival data. The constraintsadded for this purpose were an average survival timefrom diagnosis in untreated or drug-resistant cases ofless than 24 months (median 18 months) (21), a
1700 P. W. Sullivan and S. E. Salmon

threshold tumor cell number at diagnosis of at least2.5 X 1011 myeloma cells in the body (6) and an averagetumor doubling time of 4-6 months during the clinicalphase of disease (6, 22, 23). These three constraints,plus a value for a, provide all the data necessary for asolution of the Gompertz equation.
RESULTS
Cellular immunoglobulin synthetic rates. Measure-ments of the cellular IgG synthetic rate in vitro weremade in a total of 36 patients with IgG multiplemyeloma. 22 of these patients have been studiedserially during their clinical course, and a total of 67studies (range, 2-8 per patient) have been performed.Synthetic rates were determined at the time of pre-sentation and during subsequent tumor regression orremission. Bone marrow specimens for culture wereobtained when the patients were receiving no therapy(e.g., before treatment was begun; off treatment; orimmediately before the beginning of an intermittentcourse of melphalan, prednisone, or both) or while theywere receiving treatment with low daily doses ofmelphalan. Synthetic rates among these patients rangedfrom 1.5 to 34 pg/myeloma cell per day (mean,14.5+9.6). The cellular IgG synthetic rates have re-mained constant 4- 10% for as long as 3 yr for allpatients studied serially under these circumstances,whether or not the patient was receiving therapy andindependent of the number of tumor cells in the body.Additional studies were performed during 4 day, high-dose, "pulse" chemotherapy; however, these data arenot included as they gave disparate results, probablybecause of the acute effects of intensive therapy. Noneof the in vitro studies reported here was carried outduring relapse on continued chemotherapy.
Comparison of predicted and measured IgG metabolicparameters. Data on 10 patients on whom metabolicturnover studies had been done were processed with thecomputer program to calculate the fractional catabolicrate (f) by means of the metabolic equation. Table Isummarizes this comparison; the metabolic equationprovides an excellent approximation of the f measuredfor IgG by metabolic turnover study. The averagedeviation from the predicted value was 8% (+3.9%SEM). Predicted plasma volumes for these 10 patients(based on height, weight, and hematocrit) also agreedwell with the measured plasma volumes. One patient(E. M.) had an initial plasma volume more than 25%greater than predicted. However, it is important to notethat the expanded plasma volume in this patientcontracted during chemotherapy even though there wasno significant change in hematocrit.
Relationship of concentration-dependent changes in IgGmetabolism to tumor regression. Data were analyzed on15 SWCCSGpatients with IgG myeloma, who were
TABLE IComparison of Predicted and Measured IgG Fractional Catabolic
Rate (f) in 10 Patients with IgG Multiple Myeloma
f
Patient Predicted Measured* Difference
L. M. 9.0 9.3 0.3J. H. 9.1 9.6 0.5J. U. 13.7 10.9 2.8A. V. 12.2 12.0 0.2R. T. 12.7 12.1 0.6R. W. 10.8 12.9 2.1M. P. 12.1 11.9 0.2W. W. 12.1 12.5 0.4L. F. 11.8 13.8 2.0D. R. 12.5 12.2 0.3
* Data previously reported (6).
considered to be "nonresponders" on the basis of lessthan a 50% reduction in the concentration of M-com-ponent. Eight of these patients had an actual reductionin synthetic rate that was greater than 50% (mean53%), even though electrophoretic data had suggesteda significantly lesser degree of response to treatment(mean 39%). Seven of these eight patients who werereclassified as responders had initial concentrations ofM-component of 3.7 g/100 ml or less, thus falling intothat portion of the curve of IgG catabolism mostaffected by changes in IgG concentration (11). Survivaldata on these patients who were reclassified as partialresponders showed them to have a significantly longermean and median survival than those patients who hadless than a 50% reduction in the M-component syn-thetic rate. For the entire group of 15 patients, themean calculated reduction in the total body IgG syn-thetic rate was 34.9+4.8% greater than the change inthe serum concentration of M-component. Data on thepatients analyzed in Table II showed a similar phe-nomenon and demonstrated that uncorrected electro-phoretic measurements underestimate the magnitudeof tumor response to chemotherapy.L Analysis of tumor regression. Studies of measured andcalculated immunoglobulin synthetic rate and tumorcell number (Table II), and regression and growthkinetics (Table III) were carried out in 11 patients.These 11 patients were selected because (a) they hadmanifested objective response to treatment, (b) serialelectrophoretic patterns and detailed clinical data wereavailable for anAdysis, and (c) each had received con-sistent patterns of treatment with minimal deviation indrug dosage or schedule. Serial measurements of IgGsynthetic rate were done on the first seven patients andplasma volumes were measured with [u25I-labeled]
Tumor Growth and Regression in IgG Multiple Myeloma 11701

+ + ~~+
di U) 0 U)
0o c'0
go 0 - 0%
x
0%o o- o
a4 .a ad
U-. .U)
o4 o '6
'0. o
N v
~ _t _. e
di' U) U) 0
+) +b u
*o -' 0o 0 0 0 U)
- U) U) -% o 0%
o. o o o%
'0 0 0o 0 (.4 0 0'0 - *. *0 *% U-
o 4_ _ -0o~
WI) 0% 0 0 0U- t-. C4 (.4 ad
(C4
o 0Nd Nd
0 - '0 0 r- 0.4 .4 .4e - 0
0%1 U) U) U) U) 0
.4 .4 -- 0 -r ) -s0U)
'0 0 a-' a-' t-' 0 d*4 .4 . . .4 .
Il_ _oI It o~t
_N Vo qp m (
A w A
'0>E ' 9 '0k9w
o% (.4 0 U) U 0 Ina- 0% In U) '0 I- 'o
U -' 0 U (.4 0 c0'0~ co U) Ul) a-' '0 'or-
* 2 (Ml 4a (z 44 4a fad4
-.3 Bi (dr4
> OC
..0
be
co
OU di0
0 0
P di
..i
4)
dd
4id
04
v
Ai~d' b.*Y -up
m0 *>
di
di
p4
)
I
4
-.t
b64
SU4
3t
di
0
4.d*3
0di
0
Ca
0
be
dI
.!
0
*0._
ko
IV
dii.) _
di IVS
abeJ
o .2co
v .e
41W .,
bO
._ dP di
di
0%
Odi
>>Cdi
i. 5 "
0% 0
di L
'0 O.a Xd *
i-J i
di * X fU)di *gE
@0 @ di.
wcdodiOGi Ci di.,edi
* 0s od
1702 P. W. Sullivan and S. E. Salmon
bo k " co r-.94 W) Ul) 10411w" I ., .4 :.cn

TABLE I I ICalculated Gompertz Constants and Growth Parameters in Patients with IgG Multiple Myeloma
Instantaneous Initial Instantaneous Duration ofregression rate growth rate Myeloma cell growth rate subclinical disease
Patient a (B.) (A,) generation time at 2.5 X 10¹¹ cells to 2.5 X 10¹¹ cells
days est. days
L. M. 0.011 -0.013 0.313 2.20 0.030 217J. H. 0.010 -0.040 0.287 2.41 0.027 237W. W. 0.015 -0.047 0.395 1.55 0.038 153E. M. 0.018 -0.020 0.513 1.35 0.049 133D. M. 0.026 - 0.028 0.751 0.92 0.072 91H. J. 0.010 -0.008 0.296 2.34 0.028 230L. W. 0.013 -0.023 0.368 1.88 0.035 184N. S. 0.013 -0.028 0.380 1.82 0.036 179S. A. 0.004 -0.009 0.117 5.94 0.012 575T. D. 0.022 -0.039 0.624 1.11 0.060 109K. L. 0.007 -0.024 0.195 3.56 0.019 349
albumin. In four patients, data were supplied by theSWCCSGand fixed cellular IgG synthetic rates andplasma volumes were estimated with the techniquesdescribed above.
Kinetics of tumor regression. A characteristic mode oftumor regression is observed when myeloma patientsare treated with alkylating agents alone or combinedwith prednisone. The tumor regresses rapidly at first,then slows and reaches a plateau size which is stablefor a period of months or years. The rapidity with whichmyeloma cell number initially decreased with treatmentwas dependent upon Bo, the sensitivity of the tumor todrug. With a large B0, the initial rate of tumor regres-sion was rapid. This effect occurred in three patients(J. H., W. W., T. D.); each had a B0 of -0.039 orgreater. In these patients, the tumor cell number halvedin less than 30 days.
The retardation constants a for these 11 patientswere all between 0.004 and 0.022, suggesting a narrowrange for this constant for myeloma cells. The totaldegree of tumor regression is not dependent solely uponeither B. or a but, rather, upon their ratio. Optimaltumor response thus occurs when B, is large and a issmall; that is, when the ratio of these two is large. Itfollows from the Gompertz equation that a ratio ofB0:a of greater than 2.4 predicts a tumor regression ofgreater than 1 log. Regressions which approximated thismagnitude were induced in 5 of the 11 patients studied(87.9-98.2% regression). Three of the five patients whohad significant tumor regressions (N. S., S. A., K. L.)had tumors less sensitive to drug than the three patientsdiscussed above (B,, values of -0.009 to -0.028), buttheir values for a were also extremely small. The pre-dictive capability of kinetic analysis is illustrated inFig. 3, wherein final measured and predicted tumor cellnumbers are shown for patient W. W. In this instance,the plateau of tumor during treatment was predictedmany months in advance.
Calculated theoretical growth characteristics of myeloma.Using the measured values for a and the constraints tothe Gompertz equation indicated by clinical observa-tions (see above), the initial growth rate (A.), myelomacell generation time (to), proliferative fraction at
3.0r-
2.01_
-J-J
LU
0LU
1.00.8
0.6
*-* MEASURED
0 o PREDICTED FROMGOMPERTZEQUATION
0.4 _
0.2 _
0.10.08
0-
100 200R M.
I I300 400 500 600 700
DAYSFIGURE 3 Measured and predicted response to treatment inpatient W. W. who had IgG multiple myeloma. The patient'scourse of treatment with low-dose melphalan and prednisoneis shown. The initial IgGmp concentration was 6.5 g; the final,,0.7 g/100 ml. Data points obtained in the period designatedwith the horizontal arrow could be used to predict the subse-quent plateau of the patient's tumor. At the low concentra-tions of M-component observed at the time of remission, thecomputer estimation of cell number may be more accuratethan that derived from electrophoretic data.
Tumor Growth and Regression in IgG Multiple Myeloma
I
1703

2.5 X 10¹¹ cells (P2.5x1011), and subclinical duration ofdisease were calculated (Table III). Myeloma cellgeneration time varied from 22 to 142 hr (mean, 55 hr).The calculated fraction of cells in the proliferativecompartment at the threshold of clinical detectabilityranged from 5.9 to 7.1%. The tumor appears to have asubclinical period of growth of approximately 100 timesthe value for tg, before a clinical threshold of 2.5 X 10"cells is reached. For the patients studied, this periodranged from 91 to 575 days. Since only 38 doublings arerequired to reach this threshold from a single malignantcell, the degree of retardation of tumor growth isreadily apparent, as exponential growth of tumors withsimilar values for tg, would result in a much shortersubclinical phase of disease.
DISCUSSION
Unlike the techniques of measurement of tumorvolume which have been widely applied in previousstudies of animal and human tumors, derivation ofserial tumor mass from measurements of immuno-globulin synthesis is not subject to the difficulties ofmeasuring tumor nodules which may contain variablebut significant numbers of nonviable cells, normaltissue elements, and interstitial fluid. Our studies doentail a concept of cell death which is somewhatdifferent from that generally used by the radiobiologist,who defines death as the loss of a cell's capability toserve as a stem cell (i.e., it becomes sterile, or non-clonogenic) (24). In our kinetic studies, myeloma cellsthat we call dead on the basis of their loss of capabilityto synthesize an M-component are most likely "deadand gone," rather than simply nonclonogenic. Sub-stantiation of this impression was recently providedwhen we analyzed electrophoretic data obtained byBergsagel on a patient whom he treated with totalbody irradiation (25). In this patient, the half-life ofirradiated myeloma cells was at least 2 wk, during whichtime they continued to secrete the M-component.
Recognition that changes in IgG metabolism, whichoccur as a concentration-dependent phenomenon, couldlead to significant underestimation of the degree ofchange in total body M-component synthesis (andtumor mass) prompted us to develop a technique tocorrect for these metabolic effects. IgG clones accountfor slightly more than half of all cases of myeloma(26-28); errors in interpretation of response in IgGmyeloma could significantly alter response data formyeloma in general. Analysis of so-called "nonre-sponders" in the SWCCSGexperience indicated thatsome of these patients had actually had a significant(50%) reduction in the amount of tumor and that thisdegree of response was associated with prolongation ofsurvival. Such findings indicate that we may be under-estimating the effects of conventional treatment and,
perhaps, abandoning it prematurely (especially inpatients with an initial serum concentration of IgG ofless than 3.5 g/100 ml).
Study of the regression and growth of the neoplasmby means of serial estimates of the total number oftumor cells in the body unearthed a number of featuresof tumor kinetics which may have major significance.Use of the Gompertz equation to analyze growth of theneoplasm in a responding patient whose treatment wasstopped (because of marrow toxicity rather than drugresistance) indicated that, in this patient, tumor growthduring the period of relapse was Gompertzian and hada very clear plateauing phenomenon. Of particularinterest was the unexpected observation that the curvesof tumor regression on continuous therapy and ofregrowth on its cessation had similar retardation (Fig.4). Deductive analysis, which proved that an a deter-mined during tumor regression also applied to theearlier period of tumor growth, confirmed the validityof use of regression data to determine growth charac-teristics (see Appendix II).
This approach broadens the applicability of growthanalysis in human tumors and provides a more repre-sentative sample of patients than could ethically beobtained in untreated patients. Study of an untreatedpatient group would be prejudiced toward the selectionof patients with slowly growing tumors because bene-ficial therapy cannot be justifiably withheld frompatients with progressive myeloma (e.g., 29). Addi-tionally, analysis of the process of tumor relapse duringcontinued therapy may not yield information which isrepresentative of the growth of the untreated or drug-responsive neoplasm; "subcloning phenomena," asdescribed by Coffino, Laskov, and Scharff for mousemyeloma (30) and by Hobbs for myeloma in man (31),do appear to occur (we have observed this feature inseveral of our patients). The measurements of immuno-globulin synthesis in vitro reported here were obtainedby sampling 107-108 bone marrow cells at the time ofinitial presentation and during regression and plateauphases of myeloma; we have not observed significantchanges in the rate or type of cellular M-componentsynthesis. We recognize that subcloning does occurduring relapse in at least 5% of cases, and serial mea-surements of M-component synthesis in vitro will beneeded to characterize cellular function in the resistantphase of the disease. We are investigating this phe-nomenon but have, as yet, relatively few measurements.However, analysis of some electrophoretic data frompatients in relapse suggests that a drug-resistant cloneappearing during relapse may have a much smallervalue for a.
Our interpretation of the cellular and populationevents which account for these growth and regressionphenomena must be considered tentative; however, the
1704 P. W. Sullivan and S. E. Salmon

demonstration that the identical a applies to bothcircumstances strongly supports the concept thatreciprocal changes are occurring in the size of theproliferating or growth fraction of the tumor. Duringthe period of progressive growth of the tumor theproliferating fraction appears to decrease, while duringthe period of regression during treatment a largerfraction of the remaining tumor mass appears to shiftinto the proliferative compartment. This form ofretarded regression could be anticipated whenever atreatment (e.g., an alkylating agent) produces a con-stant fractional kill of tumor cells. Such therapy couldbe considered as an additional environmental forcefavoring cell death; it would force the tumor to seek anew (and lower) population size, with the resultingregression and plateau in size representing a newlyestablished balance between increased cell death due totreatment and increased tumor cell birth rate resultingfrom an expanded proliferative fraction. The plateauphenomenon during remission probably does not reflectthe acquisition of drug resistance; a prolonged plateauphase (several years in some of our patients) could notbe anticipated in a drug-resistant tumor-the tumormass would increase progressively even with continuedtherapy.
The capability to predict the maximum degree ofregression and time until plateau of tumor size for anyform of therapy should be clinically important. If theplateauing phenomenon during therapy is caused by anexpansion of the proliferative fraction of the tumor asthe total population is reduced, or if the residual cellsare mostly nonclonogenic, use of antimetabolites thatattack the tumor stem cells during the proliferativecycle would be most rational after the tumor had firstbeen reduced significantly in size by a noncycle-specificagent such as an alkylating agent. The plasmacytomaof the hamster, which also grows in Gompertzianfashion, appears to display precisely this phenomenon(17). It cannot be cured with a potent cycle-activeagent (cytosine arabinoside) when the tumor is ex-tensive, but it can be cured with the same drug if thetotal mass is first reduced by several logs with alkylatingagents (reversal of this sequence is ineffective).
Our estimated generation times for myeloma cellsare similar to those measured in man by Killmann et al.(18). Their tritiated thymidine-labeling studies in vivoshowed that the proliferative fraction is very small atthe clinical stage of disease. Analysis of our kinetic dataon the theoretical proliferative fraction (TheoreticalBackground) suggests that, in most patients, approxi-mately 6.5% of myeloma cells are in the proliferativefraction at the clinical threshold of 2.5 X 10¹¹ tumorcells. Flash-labeling studies with tritiated thymidine invitro suggest that the labeling index is extremely low(less than 3.5%) when measured at high total body
1.0
0.90.8
0.7
0.6
0.5
-J
w
0
-iLUI
0.4
0.3
- 0/\ ~/0s.,.~~~~~0
'14%e
0.2 -
V.l100
PREDM
200 300 400 500 600 700 800
DAYS
FIGURE 4 Log of tumor cell number vs. time in patient L. M.,who had a drug-induced regression and subsequent relapseafter cessation of therapy. The regression and relapse curvesare not exponential.
densities of tumor cell number (7), although it remainsto be established whether the labeling index increasessignificantly during remission. Study of the labelingindex at low tumor cell density presents substantialproblems due to the difficulties inherent in identifyingas myeloma cells a small percentage of all marrow cellsand in identifying an even smaller fraction of these asbeing labeled. However, the possibility of an expandedproliferative fraction during regression can be testedwith the use of clinical trials of cycle-active agents inpatients who have had very large tumor regressions. Forevaluation of such a trial, an extremely sensitive indi-cator of the myeloma protein would be requiredonce the M-component was no longer detectable byelectrophoresis.
Reconstructing the natural history of myeloma, itappears that its duration is shorter than had previouslybeen considered (6, 22). Our calculations on the sub-clinical phase of disease (up to 2.5 X 10¹¹ cells) suggestthat this initial period of tumor growth occurs in fromless than 4 months to approximately 18 months. How-ever, most patients are not recognized at this thresholdpoint; diagnosis usually occurs after the tumor hasundergone further but ever slowing growth for several
Tumor Growth and Regression in IgG Multiple Myeloma 1
I8 1 _
1705

1014r
1012
101C
108I
106
104
100°
DEATH
CLINICAL DIAGNOSIS
ok=o/Of,-O.OO<(=0l0I/ 0 i 1:
12 8 4
YEARS
FIGURE 5 Hypothetical models of the natural history ofuntreated multiple myeloma. The curves plotted are thosepredicted by various values of a, assuming the clinical con-
straint that the tumor must double four times in 2 yr betweendiagnosis and death. Calculated values for a in the patientsstudied ranged between 0.004 and 0.022, suggesting a pre-
clinical period of less than 5 yr.
additional years. Various models of myeloma can beconstructed within the constraints dictated by theclinical phase of disease (Fig. 5). Our estimates of a inmyeloma have all been in the range of 0.004-0.022,indicating that the tumor grows rapidly at the sub-clinical level and likely is manifest in most patientswithin 5 yr of its initial doubling. Assuming that so-
called "benign monoclonal gammopathies" (32) are alsosubject to similar growth regulation, we would propose
that such tumors may be quite similar to the malignantvariant; however, such clones may undergo a greaterdegree of growth retardation or have a smaller initialgrowth rate, and consequently plateau at a level whichdoes not lead to lethal complications.
A central enigma persists in identifying the bio-chemical basis for the retardation constant, a. Oneappealing possibility is that a feedback inhibitionsystem may control the growth of both normal andneoplastic antibody-producing clones. Viewed in thiscontext, myeloma cells would not appear to have thesame degree of sensitivity to this inhibition as normalclones; however, their proliferation would also beinhibited progressively with increasing tumor cellnumber.
Should a feedback inhibitor produced by myelomacells also affect normal antibody-producing clones, thenone major clinical feature of myeloma may be clarified.An antibody-deficiency syndrome is a constant featureof this disorder; it appears to be due to a reduction in
the number of normal-immunoglobulin-producing clonesrather than a change in immunoglobulin catabolism(33-35). Extrapolating from our measurements inmyeloma, we calculate that the mass of all antibody-producing clones in normal man is some 3 X 10¹¹ cells(about 300 g). Based on our measurements, patientswith myeloma have at least a 1 log reduction in thenumber of normal antibody-producing clones in thebody. In the mouse, recent studies by Zolla (36) presentstrong evidence that myeloma cells do have depressiveeffects on normal immune cell proliferation. Her studiesdemonstrate that subcutaneously transplanted myelo-mas suppress the proliferation of antibody-producingcells progressively as they grow.
Investigations of the growth of myeloma may thusnot only clarify the natural history of the disorder andprovide an approach to predictive cancer chemotherapy,but may also provide some insight into the processesthat regulate neoplastic and normal cell growth.
APPENDIX I.CURVE-FITTING TECHNIQUESFORTHE GOMPERTZEQUATION
When a specific growth or death rate implies Gompertziankinetics, a best-fit curve can be generated using the methoddeveloped by Simpson-Herren and Lloyd (16). A computerwas programmed to evaluate N., A., and a from the experi-mental data by an iterative one-dimensional search on a.
If equation 4 is rewritten as
A0In N = In No +-(1 - at),
a
it may be expressed as
u = a0 + aiv
where:
u = lnN
AOao = lnN0 + Aa
Aoal =
a
V =e-at
This is a linear equation in u and v with slope a, and intercepta.. The parameters a, and a0 are evaluated by the method ofleast squares for each estimate of a and the variance is calcu-lated. The value of a is then systematically incremented ordecremented until the variance about the straight line con-verges to a minimum. Upon convergence, the best a is known,and Ao and No are readily calculated:
Ao =- aal
No = e(aO+al).
The equation is then fully described.
1706 P. W. Sullivan and S. E. Salmon
U.'U
-i
0LU
6
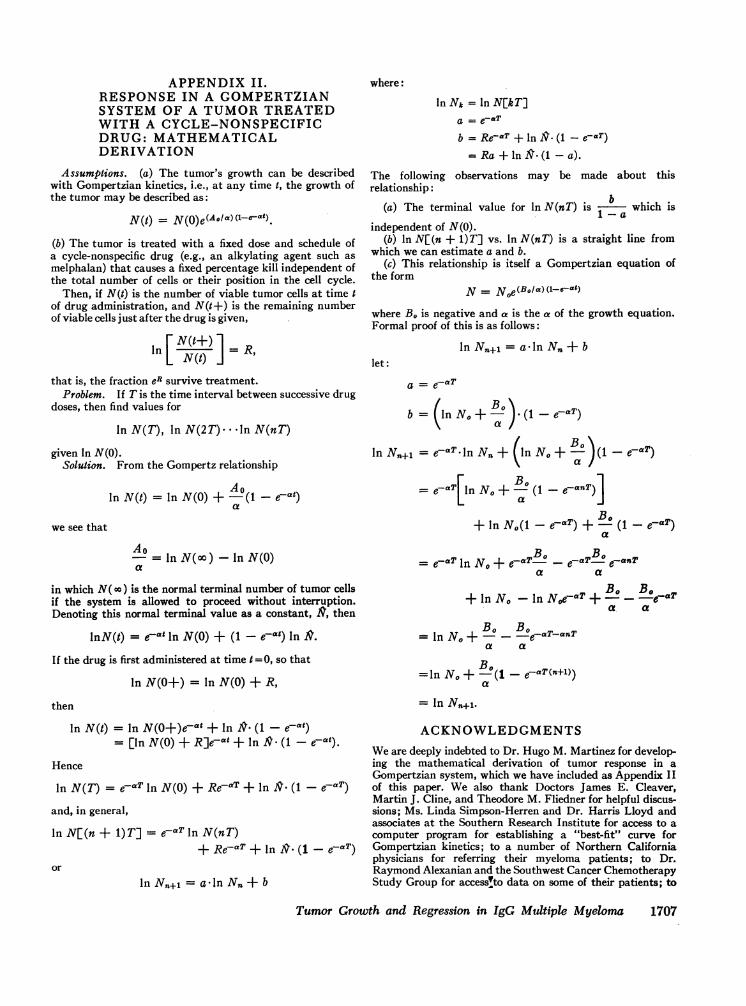
APPENDIX II.RESPONSEIN A GOMPERTZIANSYSTEMOF A TUMORTREATEDWITH A CYCLE-NONSPECIFICDRUG: MATHEMATICALDERIVATION
Assumptions. (a) The tumor's growth can be describedwith Gompertzian kinetics, i.e., at any time I, the growth ofthe tumor may be described as:
N(t) = N(0)e
(b) The tumor is treated with a fixed dose and schedule ofa cycle-nonspecific drug (e.g., an alkylating agent such asmelphalan) that causes a fixed percentage kill independent ofthe total number of cells or their position in the cell cycle.
Then, if N(t) is the number of viable tumor cells at time tof drug administration, and N(t+) is the remaining numberof viable cells just after the drug is given,
In N(t) R,
that is, the fraction eR survive treatment.Problem. If T is the time interval between successive drug
doses, then find values for
In N(T), In N(2T)- .Iln N(nT)
given In N(O).Solution. From the Gompertz relationship
In N(t) = In N(O) + -(1 - at)a
we see that
A0-= in N(oo) - In N(O)a
in which N( oo) is the normal terminal number of tumor cellsif the system is allowed to proceed without interruption.Denoting this normal terminal value as a constant, fit, then
lnN(t) = e at in N(O) + (1 - eat) In SR.
If the drug is first administered at time t =0, so that
In N(O+) = In N(O) + R,
then
In N(t) = In N(O+)e-a" + In 9- (1 -eat)= [in N(O) + R]e-'t + In Do (1 - eat)
Hence
in N(T) = e-aT In N(O) + Re'r + In SR (1 - e7aT)
and, in general,
in N[(n + 1)T] = e-aT In N(nT)+ Re-aT + In eo(1- eaT)
orIn Nn+s = a-In N. + b
where:
In Nk = ln N[kT]a = e-aT
b = Re--T+ In N- (1 -eaT)= Ra +lnI '(1 -a).
The following observations may be made about thisrelationship:
(a) The terminal value for In N(nT) is which is1-a
independent of N(O).(b) In N[(n + 1)T] vs. In N(nT) is a straight line from
which we can estimate a and b.(c) This relationship is itself a Gompertzian equation of
the formN =Noe(Bola)(--a )
where Bo is negative and a is the a of the growth equation.Formal proof of this is as follows:
In Nn+l = akln N. + blet:
a = e7aT
b = In No +-) (1 - eaT)
In N.+, = e-aT. In N, + (ln No +-o)(1 - e-aT)
= e-aT[ln No +B (1- eanT)]
+ In No(1 - eaT) + Bo (1 - e-aT)a
= e-aT In No + e-aTB - e-aT-B e-anTa a
+ In No - In Noe-aT + B_ Boa a
= In No + -o_ B-.7aT-anTa a
=ln No +B-(1 - eaT(n+l))a
=in N.,+l.
ACKNOWLEDGMENTSWeare deeply indebted to Dr. Hugo M. Martinez for develop-ing the mathematical derivation of tumor response in aGompertzian system, which we have included as Appendix IIof this paper. We also thank Doctors James E. Cleaver,Martin J. Cline, and Theodore M. Fliedner for helpful discus-sions; Ms. Linda Simpson-Herren and Dr. Harris Lloyd andassociates at the Southern Research Institute for access to acomputer program for establishing a "best-fit" curve forGompertzian kinetics; to a number of Northern Californiaphysicians for referring their myeloma patients; to Dr.Raymond Alexanian and the Southwest Cancer ChemotherapyStudy Group for access!to data on some of their patients; to
Tumor Growth and Regression in IgG Multiple Myeloma 1707

Dr. Daniel E. Bergsagel for providing unpublished data on apatient treated with total body irradiation; to Mr. RandallKrakauer for aid in development of computer programs; andto Ms. Beth A. Smith for highly skilled technical assistance.
This work was supported by grants from the U. S. PublicHealth Service (CA-12744 and CA-11067), by funds from theCommittee on Research of the Academic Senate of the Uni-versity of California, San Francisco, and by a special grantfrom the California Division of the American Cancer Society(558). Several of the studies were carried out in the GeneralClinical Research Center, provided by the Division of Re-search Resources, U. S. Public Health Service (RR-79).
REFERENCES
1. Skipper, H. E., F. M. Schabel, Jr., and W. S. Wilcox.1964. Experimental evaluation of potential anticanceragents. XIII. On the criteria and kinetics associated with"curability" of experimental leukemia. Cancer Chemother.Rep. 35: 1.
2. Laster, W. R., Jr., J. G. Mayo, L. Simpson-Herren, D. P.Griswold, Jr., H. H. Lloyd, F. M. Schabel, Jr., and H. E.Skipper. 1969. Success and failure in the treatment ofsolid tumors. II. Kinetic parameters and "cell cure" ofmoderately advanced carcinoma 755. Cancer Chemother.Rep. 53: 169.
3. Skipper, H. E., F. M. Schabel, Jr., L. B. Mellett, J. A.Montgomery, L. J. Wilkoff, H. H. Lloyd, and R. W.Brockman. 1970. Implications of biochemical, cytokinetic,pharmacologic, and toxicologic relationships in the designof optimal therapeutic schedules. Cancer Chemother. Rep.54: 431.
4. Schabel, F. M., Jr. 1969. The use of tumor growth kineticsin planning "curative" chemotherapy of advanced solidtumors. Cancer Res. 29: 2384.
5. Goldin, A. 1969. Factors pertaining to complete drug-induced remission of tumor in animals and man. CancerRes. 29: 2285.
6. Salmon, S. E., and B. A. Smith. 1970. Immunoglobulinsynthesis and total body tumor cell number in IgGmultiple myeloma. J. Clin. Invest. 49: 1114.
7. Salmon, S. E., 0. R. McIntyre, and M. Ogawa. 1971.IgE myeloma: total body tumor cell number and synthesisof IgE and DNA. Blood. 37: 696.
8. Salmon, S. E., and B. A. Smith. 1970. Sandwich solidphase radioimmunoassays for the characterization ofhuman immunoglobulins synthesized in vitro. J. Immunol.104: 665.
9. Salmon, S. E., G. Mackey, and H. H. Fudenberg. 1969."Sandwich" solid phase radioimmunoassay for the quanti-tative determination of human immunoglobulins. J.Immunol. 103: 129.
10. Fairbanks, V. F., and W. N. Tauxe. 1967. Plasma anderythrocyte volumes in obesity, polycythemia, and relatedconditions. In Compartments, Pools, and Spaces inMedical Physiology. U. S. A. E. C. Symp. S. 11. 283.
11. Waldmann, T. A., and W. Strober. 1969. Metabolism ofimmunoglobulins. Progr. Allergy. 13: 1.
12. Laird, A. K. 1965. Dynamics of relative growth. Growth.29: 249.
13. Laird, A. K. 1964. Dynamics of tumor growth. Brit. J.Cancer. 18: 490.
14. Laird, A. K. 1965. Dynamics of tumour growth: com-parison of growth rates and extrapolation of growth curveto one cell. Brit. J. Cancer. 19: 278.
15. Griswold, D. P., Jr., F. M. Schabel, Jr., W. S. Wilcox, L.Simpson-Herren, and H. E. Skipper. 1968. Success andfailure in the treatment of solid tumors. I. Effects ofcyclophosphamide (NSC-26271) on primary and meta-
static plasmacytoma in the hamster. Cancer Chemother.Rep. 52: 345.
16. Simpson-Herren, L., and H. H. Lloyd. 1970. Kineticparameters and growth curves for experimental tumorsystems. Cancer Chemother. Rep. 54: 143.
17. Griswold, D. P., Jr., L. Simpson-Herren, and F. M.Schabel, Jr. 1970. Altered sensitivity of a hamster plasma-cytoma to cytosine arabinoside (NSC-63878). CancerChemother. Rep. 54: 337.
18. Killmann, S. A., E. P. Cronkite, T. M. Fliedner, and V. P.Bond. 1962. Cell proliferation in multiple myeloma studiedwith tritiated thymidine in vivo. Lab. Invest. 11: 845.
19. Gompertz, B. 1825. On the nature of the function expres-sive of the law of human mortality, and on a new modeof determining the value of life contingencies. Phil. Trans.Roy. Soc. London. 115: 513.
20. Laird, A. K., S. A. Tyler, and A. D. Barton. 1965.Dynamics of normal growth. Growth. 29: 233.
21. Osgood, E. E. 1960. The survival time of patients withplasmocytic myeloma. Cancer Chemother. Rep. 9: 1.
22. Hobbs, J. R. 1969. Growth rates and responses to treat-ment in human myelomatosis. Brit. J. Haematol. 16: 607.
23. Hobbs, J. R. 1971. Immunocytoma o' mice an' men.Brit. Med. J. 2: 67.
24. Park, C. H., D. E. Bergsagel, and E. A. McCulloch. 1971.Mouse myeloma tumor stem cells: a primary cell cultureassay. J. Nat. Cancer Inst. 46: 411.
25. Bergsagel, D. E. 1971. Total body irradiation for myelo-matosis. Brit. Med. J. 2: 325. (Abstr.)
26. Osserman, E. F., and K. Takatsuki. 1963. Plasma cellmyeloma: gamma globulin synthesis and structure. Areview of biochemical and clinical data, with the descrip-tion of a newly-recognized and related syndrome, "H'-2-chain (Franklin's) disease." Medicine (Baltimore). 42: 357.
27. Bergsagel, D. E., P. J. Migliore, and K. M. Griffith. 1965.Myeloma proteins and the clinical response to melphalantherapy. Science (Washington). 148: 376.
28. Hobbs, J. R. 1969. Immunochemical classes of myelo-matosis: including data from a therapeutic trial conductedby a Medical Research Council working party. Brit. J.Haematol. 16: 599.
29. Alexanian, R., A. Haut, A. U. Khan, M. Lane, E. M.McKelvey, P. J. Migliore, W. J. Stuckey, Jr., and H. E.Wilson. 1969. Treatment for multiple myeloma: combina-tion chemotherapy with different melphalan dose regi-mens. J. Amer. Med. Ass. 208: 1680.
30. Coffino, P., R. Laskov, and M. D. Scharff. 1970. Immuno-globulin production: method for quantitatively detectingvariant myeloma cells. Science (Washington). 167: 186.
31. Hobbs, J. R. 1971. Modes of escape from therapeuticcontrol in myelomatosis. Brit. Med. J. 2: 325. (Abstr.)
32. Waldenstrom, J. 1962. Hypergammaglobulinemia as aclinical hematological problem: a study in the gammo-pathies. Progr. Hematol. 3: 266.
33. Fahey, J. L., R. Scoggins, J. P. Utz, and C. F. Szwed.1963. Infection, antibody response and gamma globulincomponents in multiple myeloma and macroglobulinemia.Amer. J. Med. 35: 698.
34. Solomon, A., T. A. Waldmann, and J. L. Fahey. 1963.Metabolism of normal 6.6S y-globulin in normal subjectsand in patients with macroglobulinemia and multiplemyeloma. J. Lab. Clin. Med. 62: 1.
35. Salmon, S. E., B. A. Samal, D. M. Hayes, H. Hosley, S.P. Miller, and A. Schilling. 1967. Role of gammaglobulinfor immunoprophylaxis in multiple myeloma. N. Engl. J.Med. 277: 1336.
36. Zolla, S. 1972. The effect of plasmacytomas on the immuneresponse of mice. J. Immunol. 108: 1039.
1708 P. W. Sullivan and S. E. Salmon