ifrs v. u.s. gaap: impact on a company's earning and
TRANSCRIPT

Pace UniversityDigitalCommons@Pace
Honors College Theses Pforzheimer Honors College
5-1-2010
IFRS v. U.S. GAAP: Impact on a Company'sEarning and ActivitiesLinda LiPace University
Follow this and additional works at: http://digitalcommons.pace.edu/honorscollege_thesesPart of the Accounting Commons, and the Finance and Financial Management Commons
This Thesis is brought to you for free and open access by the Pforzheimer Honors College at DigitalCommons@Pace. It has been accepted for inclusionin Honors College Theses by an authorized administrator of DigitalCommons@Pace. For more information, please contact [email protected].
Recommended CitationLi, Linda, "IFRS v. U.S. GAAP: Impact on a Company's Earning and Activities" (2010). Honors College Theses. Paper 99.http://digitalcommons.pace.edu/honorscollege_theses/99

IFRS v. U.S. GAAP: Impact on a company’s earning and activities
Linda Li
Graduation Date: December 2009 Major: Accounting
Advisor: Dr. Picheng Lee Department of Accounting Lubin School of Business

2
Précis For centuries, nations have developed their own accounting language specifically for
their country to use in reporting financials. Each country develops different standards in their
reporting language to recognize and account for particular items. As companies operate
domestically and overseas, reporting in different accounting languages across various
jurisdictions becomes problematic for companies. Recently, many international countries have
permitted or allowed their domestic companies to use International Financial Reporting
Standards (IFRS), an international reporting language, to reduce the problems. However there
are some international countries (i.e. United States) that have yet to decide whether to require or
permit their domestic companies to use IFRS. In light of recent changes in the business world,
should countries conform to and use one accounting language?
This paper examines if companies in all industries and specific industries report higher
earnings under IFRS than under United States Generally Accepted Accounting Principles (U.S.
GAAP), the accounting language used in the United States. In addition, the activities and items
that caused the change in earnings, for particular industries, are also identified and explained in
this paper. The findings of this study will be in the interest of United States domestic companies
in particular industries. It will help the management anticipate which areas and items require
more resources when reporting from U.S. GAAP to IFRS. Based on the results from the
analyses in this paper, the impact on specific United States industries’ financials can be predicted
if companies in the industries use IFRS instead of U.S. GAAP.
In order to properly conduct the analyses for this paper, industries that are common in the
United States were selected. After selecting the industries, international firms were chosen from
the selected industries based on the list generated by the Edgar database on the Securities and

3
Exchange Commission of the United States. Through the use of the selected companies in the
Edgar database, the selected companies’ reconciled net income statement from IFRS to U.S.
GAAP for the year 2006 were used for the analyses. In this paper, two methods “U.S. GAAP
ROA” and “Millions figure” were introduced and used in analyzing the reconciled income
statements of firms. To measure the change in earnings from IFRS to U.S. GAAP, one tailed t-
tests were applied to the data from these two methods.
The findings from the analyses in this paper were consistent with the findings from prior
studies. Under both “U.S. GAAP ROA” and “Millions figure” methods, there was a change in
companies’ earnings under the international reporting language and under the United States
reporting language for the period between 2004 and 2006. There was no significant change in
earnings between IFRS and U.S. GAAP under the “U.S. GAAP ROA” method. Meanwhile,
there was a significant change in earnings under the “U.S. GAAP ROA” method. Nevertheless,
companies’ earnings were higher under IFRS than U.S. GAAP. In addition, the following
categories were frequently reconciled by sampled companies during the period between 2004
and 2006: financial instruments, minority interest, pension and post-retirement activities,
activities related to share or stock-based compensation and taxes.
The analyses in this paper were conducted with a small sample size. As a result, this
study has a high sample risk and limited in scope. If more industries and more companies were
selected, this study will help identify which industries will need to spend more resources on
which areas when reporting from IFRS to the U.S. GAAP. Nevertheless, this study is a general
overview of the effects on companies’ earnings, from specific industries, when reporting from
IFRS to U.S. GAAP.

4
Table of Contents Introduction ………………………………………………………………... 6 - 7 Contributions ………………………………………………………………. 7 Literature Review ………………………………………………………….. 8 - 9 Hypothesis …………………………………………………………………. 9 Research design: Selection of firms ……………………………………….. 9 - 10 Research methodology……………………………………………………... 10 - 13 Findings…………………………………………………………………….. 13 - 29 Conclusion …………………………………………………………………. 29 References …………………………………………………………………. 30 - 33 Appendix…………………………………………………………………… 34
A-1: Sampled Firms’ Information……………………………………….. 35 A-2: 2004 to 2006 Currency Exchange Rates for U.S. dollars…………... 36

5
List of Tables Table 1: Sample Firms’ U.S. GAAP Total Assets for the Period Between 2004 to 2006 …................................................................. 12 Table 2:
Panel A - U.S. GAAP ROA One Tailed T-Test for the Period Between 2004 to 2006 …………………………………… 14 Panel B – Millions Figure One Tailed T-Test for the Period Between 2004 to 2006 …………………………………… 15
Table 3: One Tailed T-Test for the Period Between 2004 to 2006 - Telecommunications without Radio Telephones Industry ……….. 16 Table 4: One Tailed T-Test for the Period Between 2004 to 2006 - Commercial Bank Industry ……………………………………….. 16 Table 5: One Tailed T-Test for the Period Between 2004 to 2006 - Pharmaceutical Preparations Industry ……………………………. 17 Table 6: One Tailed T-Test for the Period Between 2004 to 2006 - Crude Petroleum and Natural Gas Industry …………………….... 17 Table 7: Firms in Telecommunications without Radio Telephones Industry…………………………………………………………… 20 - 21 Panel A - U.S. GAAP ROA Method …………………………….. 20 Panel B – Millions Figure Method ………………………………. 21 Table 8: Firms in Commercial Bank Industry ……………………………… 22- 23 Panel A - U.S. GAAP ROA Method ……………………………... 22
Panel B – Millions Figure Method ……………………………….. 23 Table 9: Firms in Pharmaceutical Preparations Industry …………………… 24
Panel A - U.S. GAAP ROA Method ……………………………… 24 Panel B – Millions Figure Method ………………………………... 24
Table 10: Firms in Crude Petroleum and Natural Gas Industry …………….. 25 - 26
Panel A - U.S. GAAP ROA Method ……………………………... 25 Panel B – Millions Figure Method ……………………………….. 26
6
Introduction
For centuries, nations have developed their own system of accounting principles, which is
commonly known as an accounting framework or Generally Accepted Accounting Principles
(GAAP), to be used in their country. Each country develops different standards to recognize
particular items in accounting, which causes accounting “frameworks” to vary from country to
country. As companies operate beyond the borders of their home country, and investors invest in
both domestic and foreign companies, the use of different accounting frameworks across various
jurisdictions becomes problematic for both companies and investors. Duplication of records,
loss of resources and confusion are the result. In light of recent changes in the business world,
should countries abdicate their accounting framework in the sake of using one framework to
reduce problems and permit companies to be effective yet efficient?
Currently, there are two accounting frameworks used by many countries and companies,
which are United States Generally Accepted Accounting Principles (U.S. GAAP) and
International Financial Reporting Standards (IFRS). Companies in the United States (U.S.) are
required to use U.S. GAAP, which is an accounting framework to report their financials.
Meanwhile, IFRS is an international accounting framework developed the International
Accounting Standards Board (IASB), which is an international group that was formed to create
an accounting framework to be accepted by many countries (IASB, 2008). IFRS is now widely
accepted by more than 100 international countries. These international countries have permitted
or required their domestic companies to adopt and prepare their financials under IFRS in total
(IASB, 2008). For instance, companies in the European Union member states are required to
report their financials under IFRS beginning on and after January 1, 2005 based on a 2002
regulation passed by the European Union (European Commission, 2002). Meanwhile, many

7
other international countries are working towards in either requiring or allowing their domestic
companies to use IFRS. However there are a few international countries including the U.S. that
have yet to decide whether to permit or require U.S. companies to use IFRS instead of U.S.
GAAP.
Contributions
This paper has three purposes. The first purpose is to determine if companies in all
industries and if specific industries reported a higher earning under IFRS than under U.S. GAAP
during the period between 2004 and 2006. Prior studies including Henry, Lin and Yang (2009)
discovered that an international company reports a higher earning under the use of IFRS than
under U.S. GAAP in general. The second purpose of this paper is to identify the frequently used
reconciliation items in specific industries through the use of international companies’ reconciled
earnings from IFRS to U.S. GAAP in those industries. Unlike prior studies, this study focuses
on the reconciled earnings of specific industry companies from IFRS to U.S. GAAP. In other
words, how will reporting in IFRS affect a company’s income in a particular industry is the focus
of this paper. Based on the results from the analyses in this paper, the impact on specific U.S.
industries’ financials can be predicted if companies in the industries use IFRS instead of U.S.
GAAP, which is the third purpose of this paper.
The findings of this study will be in the interest of U.S. companies in particular
industries. It will help the management anticipate which areas and items require more resources
when reconciling from U.S. GAAP to IFRS. By identifying the areas and items to be reconciled,
the management can create a plan in how to smoothly transition the company from U.S. GAAP
to IFRS. Thus, this study is in the interest of the U.S. domestic companies.
8
Literature review
On an annual basis, a company is required to file their annual financial report in
accordance with their local GAAP in their home country. For instance, U.S. companies must
file their annual financial report in the form of a 10-K with the Securities and Exchange
Commission (SEC) of the U.S. (Hughes, 2007, 139). If a company trades in another country’s
market, the company must also file their annual financial report with the financial governing
body of that country. The company’s annual financial report must also be in accordance with the
local GAAP of that country they trade in. For example, if a foreign company trades in the U.S.,
which is also known as an international company or a non-U.S. issuer, the non-U.S. issuer is
required to file their annual financial report in the 20-F reconciliation form with the SEC
(Hughes, 2007, 139). Non-U.S. issuers have the choice of reporting their financials in U.S.
GAAP or their home country’s local GAAP in the 20-F form with the SEC. If the company used
their home country’s local GAAP in the 20-F form, then the company must reconcile their
financials to U.S. GAAP and provide appropriate disclosures to the reconciled line items (SEC a,
2007). In 2007, the SEC proposed a rule to eliminate the reconciliation requirement for non-U.S.
issuing companies if companies report under IFRS. In other words, a non-U.S. issuer will not be
required to provide reconciliations of their financials to U.S. GAAP in the U.S. only if the
company reports under IFRS. By late 2007, the SEC approved this proposed rule. In the final
ruling, the SEC noted that the rule was approved to promote the conformity between U.S. GAAP
and IFRS (SEC a, 2007).
On August 27, 2008, the SEC proposed a roadmap in leading the U.S. to the use of IFRS.
According to the proposed roadmap, there are several phases, if achieved, can lead the U.S. to
adopt IFRS in the near future (SEC b, 2008). As stated in the roadmap, some of the U.S. public

9
companies can change reporting from U.S. GAAP to IFRS as early as 2010 (SEC b, 2008). A
U.S. company is eligible for the adoption only if the public company’s industry uses IFRS more
than other accounting frameworks. By 2011, the SEC will decide whether U.S. reporting
companies will use IFRS instead of U.S. GAAP.
Hypothesis
After reviewing the literature (i.e. Henry, Lin and Yang, 2009) and studies (i.e. Pijper,
2008) conducted by other scholars and organizations, companies’ earnings reported under IFRS
were higher than the earnings reported under U.S. GAAP. For the purpose of this paper, non-
U.S. issuers will report a much higher profit under IFRS than under U.S. GAAP. In other
words, there will be a significant deviation between IFRS and U.S. GAAP reconciled earnings.
Prior studies also found that line items including pension, taxes and goodwill were frequently
used by foreign companies when reconciling from IFRS to U.S. GAAP. This study will identify
what reconciliation items will be frequently used by companies in general and in specific
industries.
Research design: Selection of firms
To properly address the questions in this paper, international firms from U.S. major or
common industries were needed. A list of U.S. major or common industries can be found on the
U.S. Central Intelligence Agency’s world fact book. The list of U.S. common and major
industries were checked against the Standard Industrial Classification (SIC) list of codes, which
was found on the SEC’s Edgar search database main webpage, to determine the industries’ SIC
codes. The industries’ SIC codes were crucial because it was used to generate a list of firms for
the particular industries from the SEC Edgar database. Using the list of firms from the database,
possible firms were selected to be part of the sample in this paper.

10
Firms were selected based on their state or country filing code in the particular industry’s
list of firms. Only firms with international state or country filing codes were selected for this
paper. In other words, firms used in the sample must be international. The selected non-U.S.
issuers must file their 20-F reconciliation form with the SEC for the year of 2006.
Reconciliation forms for the firms can be found either in the Edgar database of the SEC or on the
firms’ websites. These firms may have filed their 20-F during 2006 or later years with the SEC.
In addition, the sampled firms must use IFRS as their reporting basis and have reconciled their
IFRS statement of profit and loss in accordance with U.S. GAAP in their 20-F. Four industries
with a total of eighteen firms were selected as the sample for this paper. The industries selected
were pharmaceutical preparations, commercial banks, telecommunications without radio
telephones and crude petroleum and natural gas. There were five non-U.S. issuing companies
chosen for each of the selected industry except the crude petroleum and natural gas industry (See
Appendix A-1). Many of the companies in the crude petroleum and natural gas industry did not
report their financials under IFRS; thus, only three firms in this industry were selected to be
sampled.
Research methodology
Within the reconciliation form for the year of 2006, many of the firms have reconciled
their IFRS statement of profit and loss in accordance with U.S. GAAP for the years of 2004,
2005 and 2006. The firm’s 2004 reconciled financial statement may not be available in some
instances such as the pharmaceutical preparations companies sampled in this paper. The
reconciled statements were copied onto a spreadsheet to be translated into a common currency
for comparability purposes. For the interest of the U.S. domestic companies, the U.S. dollar will
be the common currency used in this study. The foreign currency exchange rates for the U.S.

11
dollar between 2004 and 2006 were used to convert the companies reported reconciled amounts
to U.S. dollars (See Appendix A-2). These new translated numbers in U.S. dollars will be
referred to as “reconciled amounts in U.S. dollars” throughout this paper.
The firms’ reconciled line items and the corresponding reconciled amounts in U.S.
dollars were then grouped or consolidated into a single line item to reduce the number of
reconciliation line items in the spreadsheet. For example, if companies A and B reported
pension as a line item in their reconciliation forms. There will be one pension line item in the
spreadsheet. After the grouping and consolidating the line items, the reconciled line items and
its reconciled amounts in U.S. dollars were sorted by industries to be used in the methods
mentioned below to answer the questions posed in this paper.
Two methods were used in this paper to determine if a company reported a lower or
higher earning under IFRS than under U.S. GAAP and to identify the frequent reconciled line
items used in the sampled industries. Assuming that reconciled line items were caused by firm’s
assets, using the return on assets (ROA) formula would be appropriate to measure the change of
earnings between IFRS and U.S. GAAP. The ROA formula was modified in this paper and will
be referred to as the “U.S. GAAP ROA” method throughout this paper. Like ROA, the “U.S.
GAAP ROA” method used the firms’ total assets for the years between 2004 and 2006 (see
Table 1). However under “U.S. GAAP ROA” method, the firms’ total assets must be reconciled
to U.S. GAAP and translated into U.S. dollars. To determine each firm’s “U.S. GAAP ROA”,
the firm’s reconciled amounts in U.S. dollars in the particular year were divided by the firm’s
total assets in U.S. dollars for that year. In other words, this method was applied to IFRS and
U.S. GAAP earnings and the amounts in the reconciled line items. This method was also applied

12
to every sampled firm during the period between 2004 and 2006 except for those firms who did
not provide their 2004 information in their reconciliation forms.
Table 1 Sample Firms' U.S. GAAP Total Assets for the Period Between 2004 to 2006
Year end total assets under U.S. GAAP in millions U.S. dollars
Company Industry Type Industry SIC 2006 2005 2004
PetroChina Co Ltd Crude petroleum & natural gas 1311 107,541.9694 94,445.9344 73,008.0850
Total SA Crude petroleum & natural gas 1311 174,598.4944 175,120.4969 151,847.2050
Eni Spa Crude petroleum & natural gas 1311 107,661.2296 103,077.0186 89,880.7453
Protherics Plc Pharmaceutical preparations 2834 98.8051 63.2218 50.2381
Novogen Ltd Pharmaceutical preparations 2834 38.4485 51.4367 56.9213
Prana Biotechnology Ltd Pharmaceutical preparations 2834 7.8413 16.9887 25.1454
Chemgenex Pharmaceuticals Ltd Pharmaceutical preparations 2834 12.0722 7.4070 1.6559
Elan Corp Plc Pharmaceutical preparations 2834 2,302.0000 2,340.0000 2,975.0000
Telefonica S A Telephone communications (No radio telephone)
4813 141,698.8708 95,214.9068 77,585.0932
Koninklijke KPN N V Telephone communications (No radio telephone)
4813 26,967.3777 28,800.0000 29,973.9130
National Telephone Co of Venezuela Telephone communications (No radio telephone)
4813 4,273.4046 3,505.9887 3,427.6340
Eircom Ltd Telephone communications (No radio telephone)
4813 5,169.3852 4,643.4783 4,893.1677
Telecom Corp of New Zealand Ltd Telephone communications (No radio telephone)
4813 3,962.4109 6,123.8564 6,080.8482
ABN Amro Holding N V Commercial banks, NEC 6029 1,227,234.6299 1,088,653.4161 900,834.7826
Allied Irish Banks Plc Commercial banks, NEC 6029 198,585.9473 166,732.9193 124,537.8882
Lloyds Banking Group Plc Commercial banks, NEC 6029 625,376.8382 556,212.7273 515,747.2527
Barclays Bank Plc Commercial banks, NEC 6029 1,705,987.1324 1,528,467.2727 1,198,864.4689
Royal Bank of Scotland Group Plc Commercial banks, NEC 6029 1,416,939.3382 1,273,429.0909 1,155,860.8059
The second method was a comparison of the firms’ reconciled amounts in U.S. dollars
between IFRS and U.S. GAAP in millions. This method will be referred to as “millions figure”
throughout this paper. Sixteen of the selected firms reported their financials in millions; thus, the
reconciled financials should be in millions of U.S. dollars for this comparison study. The
sampled three firms that reported their financials in thousands, their reconciled amounts in U.S.
dollars were divided by a million. This method was applied to IFRS and U.S. GAAP earnings
and the amounts in the reconciled line items.
13
One-tailed t-tests, a type of statistical testing, were used for both “U.S. GAAP ROA” and
“millions figure” methods to determine if there were any significant change between the earnings
under both IFRS and U.S. GAAP during the period between 2004 and 2006. To generate the t-
tests, the “t test tool” in Microsoft Excel was used. Two t-tests were conducted to determine if
there was an overall change in earnings between IFRS and U.S. GAAP under both “U.S. GAAP
ROA” and “millions figure” methods and which accounting framework improved companies’
earnings. For every sampled industry, two t-tests were conducted for both methods. To measure
the change between IFRS and U.S. GAAP in the t-test, the significance level of change was set at
.05. If the result was higher than .05, the change of earnings between IFRS and U.S. GAAP was
relatively small. Meanwhile, the change in earnings was considered to be significant if the
change was lower than .05 as prescribed in this paper. In total, there were ten individual one
tailed t-tests conducted.
Besides determining if there was a change in earnings between IFRS and U.S. GAAP, the
two methods “U.S. GAAP ROA” and “millions figure” were also used in identifying the
reconciliation items frequently used by these firms. When the methods were applied, the
conversion had caused some of the sample firms’ reconciled line items to be insignificant, which
were line items less than .0001. As a result, the methods eliminated line items that had minor
impact on the change in earnings between IFRS and U.S. GAAP.
Findings
As mentioned before, two methods were used to determine if a company’s earning is
reported higher under IFRS than under U.S. GAAP. The first method “U.S. GAAP ROA”
calculated the sampled firms’ net income or loss in U.S. dollars over the firm’s total assets under
U.S. GAAP in U.S. dollars for all the years during the period from 2004 to 2006. In total, there

14
were 47 “U.S. GAAP ROA” data points used in the one- tailed t test. As mentioned before, the
significance level of change in the one tailed t test was set at .05 to measure the change between
IFRS and U.S. GAAP. Using the “U.S. GAAP ROA” method, the change in earnings between
IFRS and U.S. GAAP was immaterial. The change was .09094 (see Table 2: Panel A), which
surpassed the determined significant level in this analysis. In other words, a company’s earning
under IFRS was .09094 times higher than its earning under U.S. GAAP during 2004 to 2006. It
was a minor increase in earnings when a company reported from U.S. GAAP to IFRS during the
period between 2004 and 2006. The findings from this method are inconsistent with this paper’s
hypothesis.
Table 2: Panel A U.S. GAAP ROA One Tailed T-Test for the Period Between 2004 to 2006
In U.S. dollars IFRS U.S. GAAP
Mean -0.035669196 -0.049290137
Variance 0.059235979 0.058916544
Observations 47 47
Hypothesized Mean Difference 0
Df 46
t Stat 1.355483545
P(T<=t) one-tail 0.090940943
t Critical one-tail 1.678660414
Unlike “U.S. GAAP ROA” method, findings from the “millions figure” were consistent
with the hypothesis of this paper. There was a significant deviation between IFRS and U.S.
GAAP under the “millions figure” method during the period between 2004 and 2006. This
method was based on the companies’ earnings that were translated into millions of U.S. dollars
between 2004 and 2006. In total, there were 47 data points of earnings in millions of U.S.
dollars used in the one tailed t test. Like the “U.S. GAAP ROA” method, the significance level
of change was also set at .05 for the t test. The change between IFRS and U.S. GAAP was
.00019 (see Table 2: Panel B), which meant that the sampled companies reported a much higher
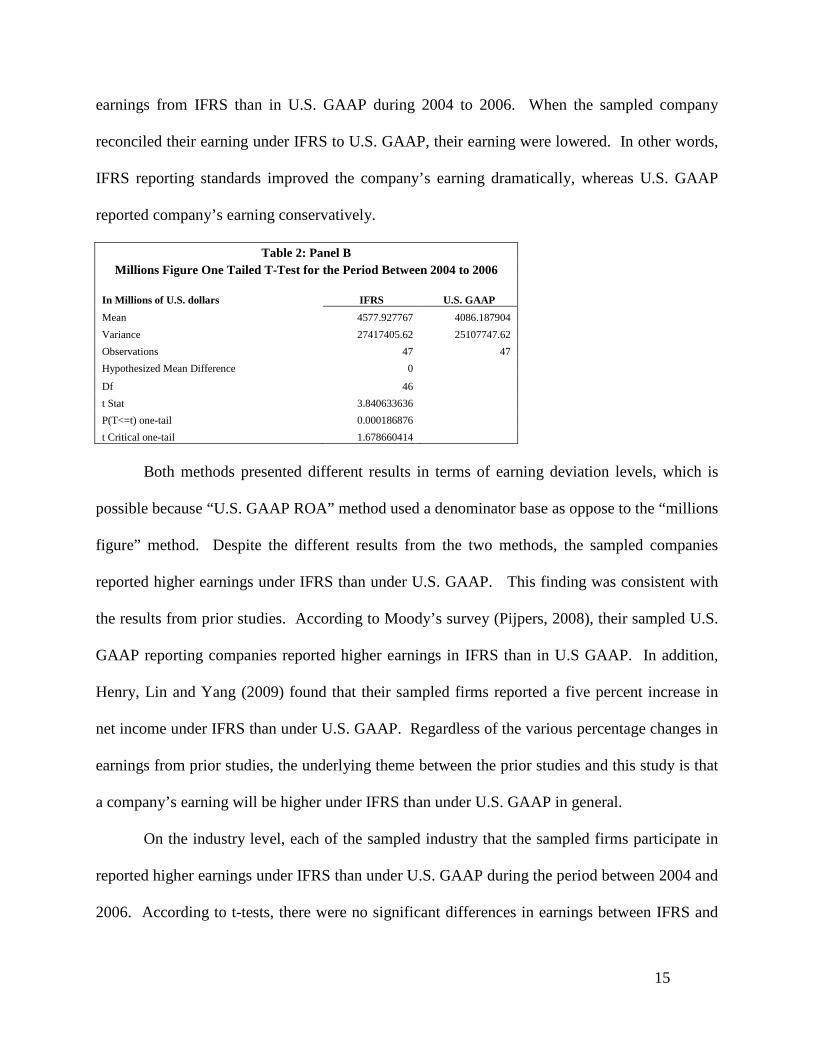
15
earnings from IFRS than in U.S. GAAP during 2004 to 2006. When the sampled company
reconciled their earning under IFRS to U.S. GAAP, their earning were lowered. In other words,
IFRS reporting standards improved the company’s earning dramatically, whereas U.S. GAAP
reported company’s earning conservatively.
Table 2: Panel B Millions Figure One Tailed T-Test for the Period Between 2004 to 2006
In Millions of U.S. dollars IFRS U.S. GAAP
Mean 4577.927767 4086.187904
Variance 27417405.62 25107747.62
Observations 47 47
Hypothesized Mean Difference 0
Df 46
t Stat 3.840633636
P(T<=t) one-tail 0.000186876
t Critical one-tail 1.678660414
Both methods presented different results in terms of earning deviation levels, which is
possible because “U.S. GAAP ROA” method used a denominator base as oppose to the “millions
figure” method. Despite the different results from the two methods, the sampled companies
reported higher earnings under IFRS than under U.S. GAAP. This finding was consistent with
the results from prior studies. According to Moody’s survey (Pijpers, 2008), their sampled U.S.
GAAP reporting companies reported higher earnings in IFRS than in U.S GAAP. In addition,
Henry, Lin and Yang (2009) found that their sampled firms reported a five percent increase in
net income under IFRS than under U.S. GAAP. Regardless of the various percentage changes in
earnings from prior studies, the underlying theme between the prior studies and this study is that
a company’s earning will be higher under IFRS than under U.S. GAAP in general.
On the industry level, each of the sampled industry that the sampled firms participate in
reported higher earnings under IFRS than under U.S. GAAP during the period between 2004 and
2006. According to t-tests, there were no significant differences in earnings between IFRS and
16
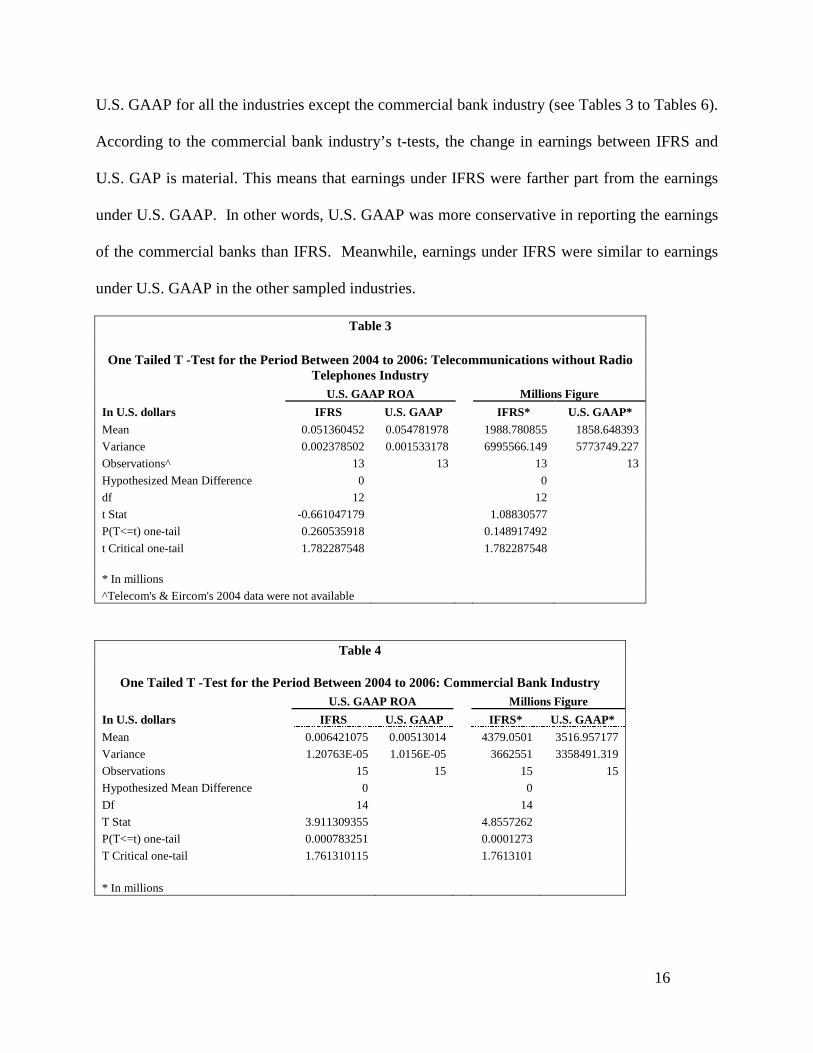
U.S. GAAP for all the industries except the commercial bank industry (see Tables 3 to Tables 6).
According to the commercial bank industry’s t-tests, the change in earnings between IFRS and
U.S. GAP is material. This means that earnings under IFRS were farther part from the earnings
under U.S. GAAP. In other words, U.S. GAAP was more conservative in reporting the earnings
of the commercial banks than IFRS. Meanwhile, earnings under IFRS were similar to earnings
under U.S. GAAP in the other sampled industries.
Table 3
One Tailed T -Test for the Period Between 2004 to 2006: Telecommunications without Radio Telephones Industry
U.S. GAAP ROA Millions Figure
In U.S. dollars IFRS U.S. GAAP IFRS* U.S. GAAP*
Mean 0.051360452 0.054781978 1988.780855 1858.648393
Variance 0.002378502 0.001533178 6995566.149 5773749.227
Observations^ 13 13 13 13
Hypothesized Mean Difference 0 0
df 12 12
t Stat -0.661047179 1.08830577
P(T<=t) one-tail 0.260535918 0.148917492
t Critical one-tail 1.782287548 1.782287548
* In millions
^Telecom's & Eircom's 2004 data were not available
Table 4
One Tailed T -Test for the Period Between 2004 to 2006: Commercial Bank Industry U.S. GAAP ROA Millions Figure
In U.S. dollars IFRS U.S. GAAP IFRS* U.S. GAAP*
Mean 0.006421075 0.00513014 4379.0501 3516.957177
Variance 1.20763E-05 1.0156E-05 3662551 3358491.319
Observations 15 15 15 15
Hypothesized Mean Difference 0 0
Df 14 14
T Stat 3.911309355 4.8557262
P(T<=t) one-tail 0.000783251 0.0001273
T Critical one-tail 1.761310115 1.7613101 * In millions

17
Table 5
One Tailed T -Test for the Period Between 2004 to 2006: Pharmaceutical Preparations Industry
U.S. GAAP ROA Millions Figure
IFRS U.S. GAAP IFRS* U.S. GAAP* Mean -0.354408538 -0.41538512 13.06527418 -73.88632325
Variance 0.146181416 0.100121276 60116.76206 18354.15871
Observations^ 10 10 10 10
Hypothesized Mean Difference 0 0
df 9 9
t Stat 1.348028555 0.852473989
P(T<=t) one-tail 0.105297767 0.20802968
t Critical one-tail 1.833112923 1.833112923 * In millions ^ 2004 information were not available for the sampled pharmaceutical companies
Table 6
One Tailed T -Test for the Period Between 2004 to 2006: Crude Petroleum and Natural Gas Industry
U.S. GAAP ROA Millions Figure
In U.S. dollars IFRS U.S. GAAP IFRS* U.S. GAAP* Mean 0.122625684 0.116455217 13721.339 12874.76755 Variance 0.001751272 0.002225446 9612318.4 12613436.8 Observations 9 9 9 9 Hypothesized Mean Difference 0 0 df 8 8 t Stat 1.671734458 1.6425032 P(T<=t) one-tail 0.066559599 0.0695555 t Critical one-tail 1.859548033 1.859548 * In millions
The two methods “U.S. GAAP ROA” and “millions figure” were also used to identify the
common reconciliation line items used by companies generally and in specific industries. At
times, reconciliation line item names varied. Depending on each firm, items were either
separated or combined when firms reported their reconciled activities in their reconciliation
forms. For example, some firms reported separate line items for derivatives and financial
instruments. Meanwhile, derivatives are types of financial instruments. For this paper,
derivatives and financial instruments are considered to be separate reconciliation line items.
18
Despite these nuances, prior studies including Henry, Lin and Yang (2009) and Moody’s (Pijper,
2008) have found that pension, taxes and goodwill were frequently reconciled by companies, as a
general rule. Besides these line items, Ernst & Young (Callaghan, Treacy, 2007) also identified
the following as common differences between IFRS and U.S. GAAP: business combinations,
minority interests, activities related to financial instruments, and share based payment. The
results from the research conducted in this paper were consistent with the findings from the
mentioned studies. Overall, financial instruments, minority interest, pension and post retirement
activities, activities related to share or stock based compensation, taxes and other were frequently
reconciled by sampled companies during the period of 2004 to 2006. Through the use of both
“U.S. GAAP ROA” and “millions figure methods”, the following items have also contributed to
the deviation of a company’s earning between IFRS and U.S. GAAP: derivatives, goodwill and
revaluations of assets.
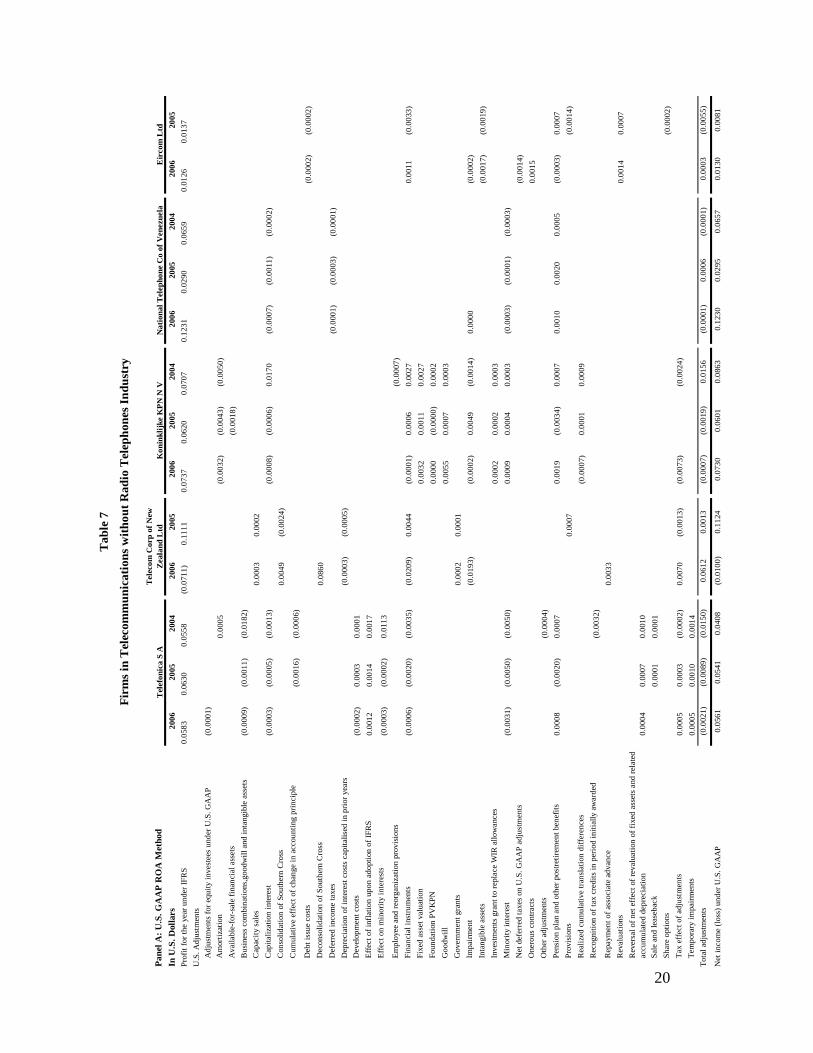
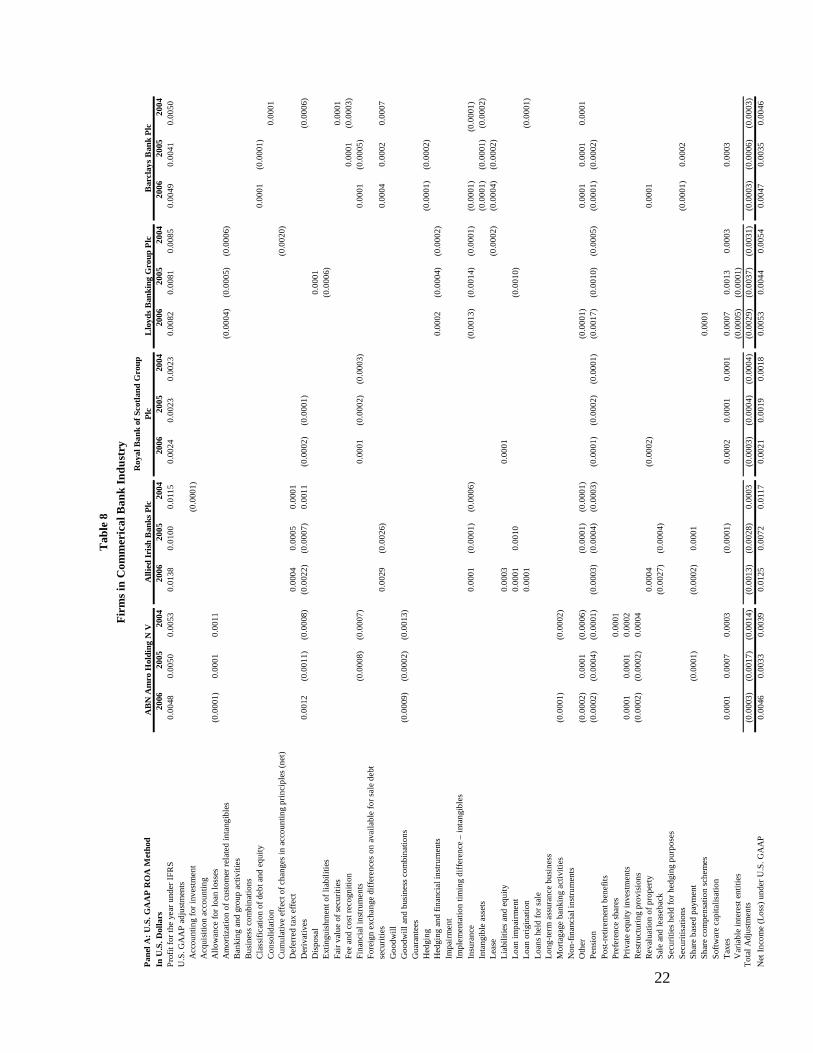
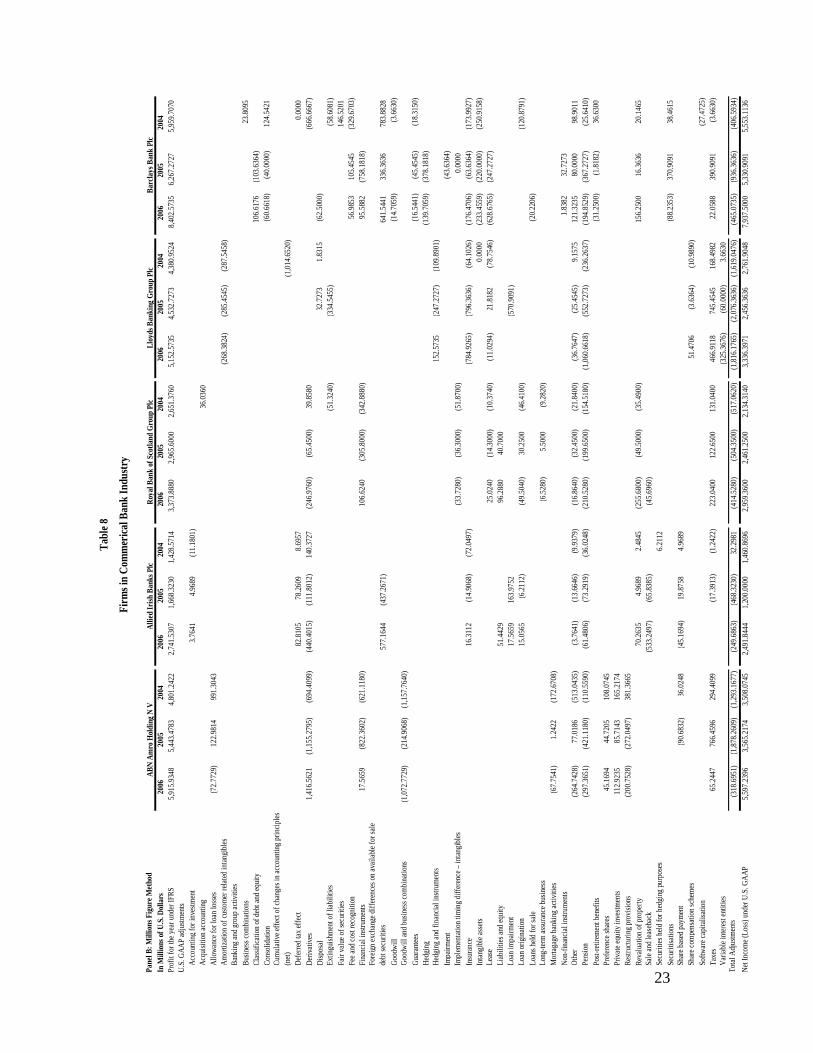
On the industry level, there were a few common reconciliation line items shared between
the sampled industries. Between 2004 and 2006, the sampled commercial banks (see Table 8)
and crude petroleum and natural gas firms (see Table 10) frequently used the line item called
“other” in their reconciliation forms. For instance, ABN Amro Holding N V (2007) listed an
item called “other fair value difference” under “other” without a disclosure note. “Other” is a
broad category, which encompasses many miscellaneous organizational items; thus, disclosures
were not provided for this line item in these firms’ reconciliation forms. Meanwhile, the
sampled telecommunications without radio telephones (see Table 7) companies and commercial
banks (see Table 8) frequently reconciled their activities related to pension, post-retirement,
derivatives and financial instruments. Pension and post-retirement activities were amortized
differently as a result of the different methods prescribed by both IFRS and U.S. GAAP. As

19
Telefonica S A (2007) stated in note 11 of their reconciliation form, both IFRS and U.S. GAAP
provided different amortization methodologies. In IFRS, the prior service costs related to
pension plans and post-retirement benefits were amortized over the benefit’s vesting period
(Telefonica S A, 2007). Meanwhile, the prior service costs were amortized over the remaining
life expectancy of inactive plan participants and over the remaining service period in U.S.
GAAP. According to Allied Irish Bank Plc’s (2007) reconciliation note 53g, companies
amortized pension and post-retirement benefit plans differently (i.e. the gains and losses from the
plans were presented differently under IFRS and U.S. GAAP). As stated in note 53g, the gains
and losses were recognized in the equity section under IFRS (Allied Irish Bank Plc, 2007).
Meanwhile, under U.S. GAAP, the gains and losses were recognized in the income statement.
Both IFRS and U.S. GAAP recognized these activities differently, which caused the sampled
commercial banks and crude petroleum and natural gas firms to frequently reconcile these items.
As mentioned previously, sampled commercial banks and telecommunication (without
radio telephone) companies also reconciled their derivatives the most during the period between
2004 and 2006. Both IFRS and U.S. GAAP defined the terms “hedge relationship” and
“derivatives” differently from each other. As Telefonica S A (2007) stated in note 10 of their
reconciliation form, IAS 39 and SFAS No. 133 provided different definitions on a hedging
relationship. IAS 39 and SFAS No. 133 are standards relating to the recognition and
measurement of financial instruments from IFRS and U.S. GAAP respectively. With different
definitions and recognition methods of derivatives and financial instruments, firms in both
commercial bank and telecommunications without radio telephone industries to reconcile their
derivatives from IFRS to U.S. GAAP. Besides the differences in the standards, a company’s
20
Pan
el A
: U
.S. G
AA
P R
OA
Met
hod
In U
.S.
Dol
lars
200
620
052
004
200
620
052
006
20
0520
04
200
620
052
004
200
620
05
Pro
fit for
the y
ear
un
der
IFR
S0.0
58
3
0.0
630
0
.055
8
(0.0
71
1)
0.1
11
1
0.0
73
7
0.0
620
0
.070
7
0.1
23
1
0.0
290
0
.065
9
0.0
126
0
.013
7
U.S
. A
dju
stm
en
ts
Ad
just
ments
for
equ
ity in
vest
ees
und
er
U.S
. G
AA
P(0
.000
1)
Am
ortiz
atio
n0
.000
5
(0.0
03
2)
(0.0
04
3)
(0.0
050
)
Ava
ilable
-for-
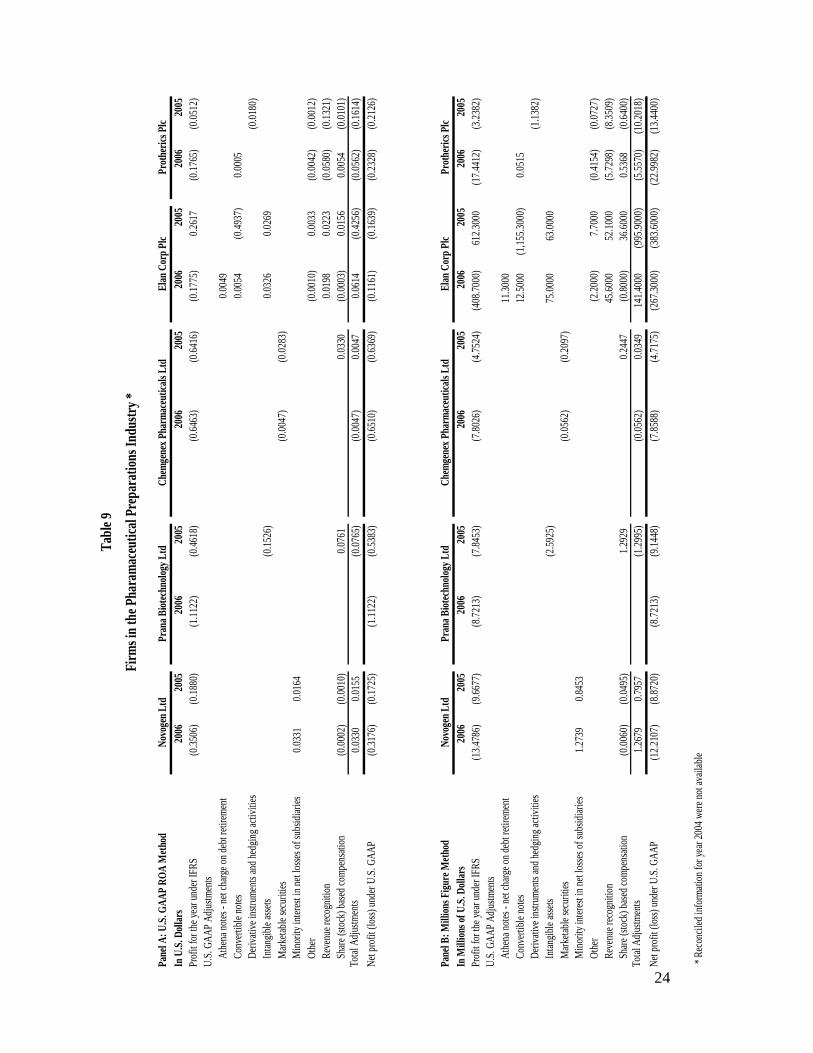
sale
fin
an
cia
l ass
ets
(0.0
01
8)
Busi
ness
com
bin
atio
ns,
goodw
ill a
nd
inta
ngib
le a
sset
s (0
.000
9)
(0.0
011
)(0
.01
82)
Cap
aci
ty s
ale
s0
.000
3
0.0
002
Cap
italiz
atio
n in
tere
st
(0.0
00
3)
(0.0
005
)(0
.00
13)
(0.0
00
8)
(0.0
00
6)
0.0
17
0
(0.0
00
7)
(0.0
011
)(0
.00
02)
Con
solid
atio
n o
f S
ou
thern
Cro
ss0
.004
9
(0.0
024
)
Cum
ula
tive e
ffect
of
chan
ge in
acc
ountin
g p
rinci
ple
(0.0
016
)(0
.00
06)
Debt
issu
e c
ost
s(0
.000
2)
(0.0
002
)
Deco
nso
lidatio
n o
f S
outh
ern
Cro
ss0
.086
0
Defe
rred
inco
me t
axe
s(0
.000
1)
(0.0
003
)(0
.00
01)
Depre
cia
tion
of in
tere
st c
ost
s ca
pita
lised
in p
rior
years
(0
.000
3)
(0.0
005
)
Deve
lop
men
t co
sts
(0.0
00
2)
0.0
003
0
.000
1
Effe
ct o
f in
flatio
n u
pon a
doptio
n o
f IF
RS
0.0
01
2
0.0
014
0
.001
7
Effe
ct o
n m
inori
ty in
tere
sts
(0.0
00
3)
(0.0
002
)0
.011
3
Em
plo
yee a
nd
reorg
aniz
atio
n p
rovi
sions
(0.0
007
)
Fin
an
cia
l inst
rum
ents
(0.0
00
6)
(0.0
020
)(0
.00
35)
(0.0
20
9)
0.0
044
(0
.00
01)
0.0
006
0
.00
27
0.0
01
1
(0.0
033
)
Fix
ed a
sset
valu
atio
n0
.003
2
0.0
011
0
.00
27
Foun
datio
n P
VK
PN
0.0
00
0
(0.0
00
0)
0.0
00
2
Goodw
ill0
.005
5
0.0
007
0
.00
03
Gove
rnm
ent
gra
nts
0
.000
2
0.0
001
Imp
air
men
t(0
.019
3)
(0.0
00
2)
0.0
049
(0
.00
14
)0
.000
0
(0.0
00
2)
Inta
ngib
le a
ssets
(0.0
01
7)
(0.0
019
)
Inve
stm
ents
gra
nt
to r
epla
ce W
IR a
llow
ance
s0
.000
2
0.0
002
0
.00
03
Min
ority
inte
rest
(0.0
03
1)
(0.0
050
)(0
.00
50)
0.0
00
9
0.0
004
0
.00
03
(0.0
00
3)
(0.0
001
)(0
.00
03)
Net
defe
rred t
axe
s on
U.S
. G
AA
P a
dju
stm
ents
(0.0
01
4)
Onero
us
con
tra
cts
0.0
01
5
Oth
er
adju
stm
ents
(0.0
00
4)
Pensi
on p
lan a
nd o
ther
post
retir
em
en
t ben
efit
s0
.000
8
(0.0
020
)0
.000
7
0.0
01
9
(0.0
03
4)
0.0
00
7
0.0
01
0
0.0
020
0
.000
5
(0.0
00
3)
0.0
007
Pro
visi
ons
0.0
007
(0
.00
14
)
Realiz
ed c
um
ula
tive t
ran
slatio
n d
iffere
nce
s(0
.00
07)
0.0
001
0
.00
09
Reco
gniti
on o
f ta
x cr
ed
its in
peri
od in
itially
aw
ar
ded
(0
.00
32)
Repa
ymen
t of ass
oci
ate
ad
van
ce0
.003
3
Reva
luatio
ns
0.0
01
4
0.0
007
Reve
rsa
l of net
effect
of
reva
lua
tion
of fix
ed a
sse
ts a
nd
rela
ted
a
ccu
mu
late
d d
ep
reci
atio
n0
.000
4
0.0
007
0
.001
0
Sale
an
d le
ase
back
0.0
001
0
.000
1
Sha
re o
ptio
ns
(0.0
002
)
Ta
x effe
ct o
f a
dju
stm
en
ts0
.000
5
0.0
003
(0
.00
02)
0.0
07
0
(0.0
013
)(0
.00
73)
(0.0
02
4)
Tem
pora
ry im
pa
irm
en
ts0
.000
5
0.0
010
0
.001
4
Tota
l ad
just
men
ts(0
.002
1)
(0.0
089
)(0
.015
0)
0.0
61
2
0.0
013
(0
.000
7)
(0.0
019
)0
.015
6
(0.0
00
1)
0.0
006
(0
.000
1)
0.0
003
(0
.00
55
)
Net
inco
me (
loss
) un
der
U.S
. G
AA
P0
.056
1
0.0
541
0
.04
08
(0.0
10
0)
0.1
124
0
.073
0
0.0
601
0
.086
3
0.1
23
0
0.0
29
5
0.0
65
7
0.0
130
0
.00
81
Tab
le 7
Firm
s in
Tel
ecom
mun
icat
ions
with
out
Rad
io T
elep
hon
es In
dust
ry
Eirc
om L
tdN
atio
nal T
ele
pho
ne C
o o
f V
ene
zue
laT
ele
com
Cor
p of
New
Z
eal
and
Ltd
Tel
efo
nica
S A
Ko
nink
lijke
KP
N N
V

21
Pane
l B: M
illion
s Fi
gure
Met
hod
In M
illion
s of
U.S
. Dol
lars
2006
2005
2004
2006
2005
2006
2005
2004
2006
2005
2004
2006
2005
Pro
fit fo
r the
yea
r und
er IF
RS
8,25
4.70
51
5
,996
.273
3
4
,330
.434
8
(
281.
9183
)
680
.506
7 1,
986.
1982
1,78
5.09
32
2,
120.
4969
5
25.9
919
1
01.5
882
2
25.8
322
65
.354
0
6
3.59
50
U.S
. GA
AP A
djus
tmen
tsAd
just
men
ts fo
r equ
ity in
vest
ees
unde
r U.S
. GAA
P
(7.
5282
)
(32.
2981
)
24.844
7 Am
ortiz
atio
n
38
.509
3 (8
6.57
47)
(1
22.9
814)
(1
49.0
683)
Av
aila
ble-
for-s
ale
finan
cial
ass
ets
(50.
9317
)
Busi
ness
com
bina
tions
, goo
dwill
and
inta
ngib
le a
sse
ts
(132
.998
7)
(1
06.8
323)
(1,4
09.9
379
)C
apac
ity s
ales
1
.296
2
1.40
75
Cap
italiz
atio
n in
tere
st
(4
8.93
35)
(5
2.17
39)
(
98.
1366
)(2
2.58
47)
(1
8.63
35)
50
8.07
45
(3.1
005)
(3.6
919)
(0.7
513)
Con
solid
atio
n of
Sou
ther
n C
ross
19
.442
6
(14
.778
3)D
ebt i
ssue
cos
ts
(0
.797
0)
(0
.805
0)D
econ
solid
atio
n of
Sou
ther
n C
ross
340
.894
4 D
efer
red
inco
me
taxe
s
(0
.462
5)
(1
.122
0)
(0
.345
4)D
epre
ciat
ion
of in
tere
st c
osts
cap
italis
ed in
prio
r y
ears
(1.2
962)
(2.8
149)
Dev
elop
men
t cos
ts
(25.
0941
)
28.
5714
7.45
34
Effe
ct o
f inf
latio
n up
on a
dopt
ion
of IF
RS
16
4.36
64
136
.646
0
134
.161
5 E
ffect
on
min
ority
inte
rest
s
(45.
1694
)
(17.
3913
)
878
.260
9 E
mpl
oyee
and
reor
gani
zatio
n pr
ovis
ions
(21.
1180
)
Fina
ncia
l ins
trum
ents
(8
9.08
41)
(186
.335
4)
(272
.04
97)
(82.
9553
)
2
6.74
17
(3.7
641)
18.6
335
79.5
031
5.
5790
(15
.295
0)Fi
xed
asse
t val
uatio
n86
.574
7
32.2
981
81.9
876
Foun
datio
n P
VK
PN
1.25
47
(1
.242
2)
6.
2112
Goo
dwill
148.
0552
21
.118
0
8.
6957
Gov
ernm
ent g
rant
s
0.6
481
0.
7037
Im
pairm
ent
(76.
4744
)(6
.273
5)
14
1.61
49
(40.
9938
)
(0.7
970)
Inta
ngib
le A
sset
s
(8
.767
0)
(8
.855
0)In
vest
men
ts g
rant
to re
plac
e W
IR a
llow
ance
s6.
2735
6.21
12
8.
6957
Min
ority
inte
rest
(434
.128
0)
(4
73.2
919)
(3
85.0
932)
23.8
394
12
.422
4
9.
9379
(1.3
750)
(0.2
270)
(1.1
572)
One
rous
con
tract
s
7.97
00
Oth
er a
djus
tmen
ts
(27
.329
2)N
et D
efer
red
taxe
s on
U.S
. GAA
P a
djus
tmen
ts
(7
.173
0)P
ensi
on P
lan
and
othe
r pos
tretir
emen
t ben
efits
10
9.15
93
(193
.788
8)
57
.142
9 50
.188
2
(96.
8944
)
21.1
180
4.
4615
6.99
15
1.
7678
(1
.594
0)
3.22
00
Pro
visi
ons
4.
2224
(6
.440
0)R
ealiz
ed c
umul
ativ
e tra
nsla
tion
diffe
renc
es(1
8.82
06)
3.
7267
26.0
870
Rec
ogni
tion
of ta
x cr
edits
in p
erio
d in
itial
ly a
warde
d
(247
.205
0)R
epay
men
t of a
ssoc
iate
adv
ance
12
.961
8 R
ever
sal o
f net
effe
ct o
f rev
alua
tion
of fi
xed
asse
ts a
nd re
late
d ac
cum
ulat
ed d
epre
ciat
ion
6
1.48
06
6
4.59
63
7
9.50
31
Rev
alua
tions
7.
1730
3.22
00
Sale
and
leas
ebac
k
6
.273
5
8
.695
7
1
1.18
01
Shar
e op
tions
(0.8
050)
Tax
effe
ct o
f adj
ustm
ents
6
7.75
41
3
2.29
81
(18.63
35)
27
.867
8
(7
.741
0)(1
95.7
340)
(72.
0497
)
Tem
pora
ry im
pairm
ents
7
5.28
23
9
0.68
32
10
9.3
168
Cum
ulat
ive
effe
ct o
f cha
nge
in a
ccou
ntin
g pr
inci
ple
(147
.826
1)
(48
.447
2)To
tal a
djus
tmen
ts
(2
98.6
198)
(848
.447
2)
(1
,166
.459
6)
2
42.3
850
7.7
410
(17.
5659
)
(54.
6584
)
467.
0807
(0
.476
5)
1.95
07
(0
.486
0)
1.59
40
(25
.760
0)
Net
inco
me
(loss
) und
er U
.S. G
AAP
7,95
6.08
53
5
,147
.826
1
3
,163
.975
2
(3
9.53
34)
688
.247
7 1,
968.
6324
1,73
0.43
48
2,
587.
5776
5
25.5
154
1
03.5
388
2
25.3
462
66
.948
0
3
7.83
50
Tabl
e 7
Firm
s in
Tel
ecom
mun
icat
ions
with
out R
adio
Tel
epho
nes In
dust
ry
Eirc
om L
tdTe
lefo
nica
S A
Tele
com
Cor
p of
New
Ze
alan
d Lt
dKo
nink
lijke
KPN
N V
Nat
iona
l Tel
epho
ne C
o of
Ven
ezue
la
22
Pan
el A
: U.S
. GA
AP
RO
A M
etho
dIn
U.S
. Dol
lars
2006
2005
2004
2006
2005
2004
2006
2005
2004
2006
2005
2004
200
620
0520
04P
rofit
for
the
ye
ar u
nd
er I
FR
S0
.00
480.
00
50
0.0
053
0.0
138
0.0
10
00
.011
50
.00
24
0.0
02
30
.00
23
0.0
08
20
.00
81
0.0
08
50.
00
49
0.0
041
0.0
05
0U
.S. G
AA
P a
dju
stm
ents
Acc
ou
ntin
g fo
r in
vest
men
t(0
.000
1)
Acq
uisi
tion
acc
ou
ntin
gA
llow
ance
for
loa
n lo
sses
(0.0
001
)0.
00
01
0.0
011
Am
ort
izat
ion
of
cust
om
er r
elat
ed
inta
ngib
les
(0.0
00
4)
(0.0
00
5)(0
.00
06
)B
an
kin
g an
d g
rou
p a
ctiv
itie
sB
usi
nes
s co
mb
inat
ion
sC
lass
ifica
tion
of d
eb
t an
d e
qu
ity0.
00
01
(0.0
001
)C
on
solid
atio
n0.
00
01
Cu
mu
lativ
e e
ffect
of c
ha
nges
in a
cco
un
ting
prin
cip
les
(n
et)
(0.0
02
0)
Def
erre
d ta
x e
ffect
0.0
004
0.0
00
50
.000
1D
eriv
ativ
es0
.00
12(0
.00
11
)(0
.00
08)
(0.0
022
)(0
.00
07
)0
.001
1(0
.00
02
)(0
.00
01
)(0
.00
06
)D
isp
osa
l0
.00
01
Ext
ingu
ish
men
t o
f lia
bili
ties
(0.0
00
6)F
air
valu
e o
f se
curitie
s0.
00
01
Fee
an
d c
ost
rec
ogn
ition
0.0
001
(0.0
00
3)
Fin
anci
al in
stru
me
nts
(0.0
00
8)
(0.0
007
)0
.00
01
(0.0
00
2)
(0.0
00
3)
0.0
00
1(0
.00
05)
Fo
reig
n e
xch
an
ge d
iffer
en
ces
on
ava
ilab
le f
or
sale
d
ebt
se
curitie
s0
.002
9(0
.00
26
)0.
00
04
0.0
002
0.0
00
7G
oo
dw
illG
oo
dw
ill a
nd
bus
ine
ss c
omb
ina
tion
s(0
.00
09)
(0.0
00
2)
(0
.00
13)
Gu
ara
nte
esH
edgi
ng
(0.0
00
1)
(0.0
002
)H
edgi
ng
and
fin
anc
ial i
nst
rum
ents
0.0
00
2(0
.00
04)
(0.0
00
2)
Imp
airm
en
tIm
ple
me
nta
tion
tim
ing
diff
ere
nce
– in
tan
gib
les
Insu
ran
ce0
.000
1(0
.00
01
)(0
.000
6)
(0.0
01
3)
(0.0
01
4)(0
.00
01
)(0
.00
01
)(0
.00
01)
Inta
ngi
ble
ass
ets
(0.0
00
1)
(0.0
001
)(0
.00
02
)Lea
se(0
.00
02
)(0
.00
04
)(0
.00
02)
Lia
bilit
ies
and
eq
uity
0.0
003
0.0
00
1Lo
an im
pai
rme
nt
0.0
001
0.0
01
0(0
.00
10)
Lo
an o
rigi
na
tion
0.0
001
(0.0
00
1)
Lo
ans
held
for
sale
Lo
ng-
term
ass
ura
nce
bu
sin
ess
Mo
rtag
age
ba
nki
ng
act
iviti
es(0
.00
01)
(0.0
002
)N
on
-fin
anc
ial i
nst
rum
ents
Oth
er
(0.0
002
)0.
00
01
(0.0
006
)(0
.00
01
)(0
.000
1)
(0.0
00
1)
0.0
00
10
.00
010.
00
01
Pe
nsi
on
(0.0
002
)(0
.00
04
)(0
.00
01)
(0.0
003
)(0
.00
04
)(0
.000
3)
(0.
000
1)
(0.0
00
2)
(0.0
00
1)
(0.0
01
7)
(0.0
01
0)(0
.00
05
)(0
.00
01
)(0
.00
02)
Po
st-r
etir
em
ent
ben
efit
sP
refe
ren
ce s
hare
s0
.00
01P
riva
te e
qu
ity in
vest
men
ts0
.00
010.
00
01
0.0
002
Re
stru
ctu
rin
g p
rovi
sion
s(0
.00
02)
(0.0
00
2)
0.0
004
Re
valu
atio
n o
f pro
per
ty0
.000
4(0
.00
02
)0.
00
01
Sal
e an
d le
aseb
ack
(0.0
027
)(0
.00
04
)S
ecu
ritie
s h
eld
for
hed
ging
pu
rpo
ses
Sec
uritis
atio
ns
(0.0
00
1)
0.0
002
Sh
are
ba
sed
pay
me
nt
(0.0
00
1)
(0.0
002
)0
.00
01
Sh
are
co
mpe
nsa
tion
sch
em
es
0.0
00
1S
oftw
are
cap
italis
atio
nT
axe
s0
.00
010.
00
07
0.0
003
(0.0
00
1)
0.0
00
20
.00
01
0.0
00
10
.00
07
0.0
01
30
.00
03
0.0
003
Var
iab
le in
tere
st e
ntit
ies
(0.0
00
5)
(0.0
00
1)T
ota
l Ad
just
me
nts
(0.0
003
)(0
.00
17
)(0
.00
14)
(0.0
013
)(0
.00
28
)0
.000
3(0
.00
03
)(0
.00
04
)(0
.00
04
)(0
.00
29
)(0
.00
37)
(0.0
03
1)
(0.0
00
3)(0.0
006
)(0
.00
03
)N
et I
nco
me
(Los
s) u
nde
r U
.S.
GA
AP
0.0
046
0.0
03
30
.00
390
.012
50
.00
72
0.0
117
0.0
02
10
.00
19
0.0
01
80
.00
53
0.0
04
40
.00
54
0.0
04
70
.00
350.
00
46
Tab
le 8
Firm
s in
Com
mer
ical
Ban
k In
dust
ry
AB
N A
mro
Hol
ding
N V
Bar
clay
s B
ank
Plc
Lloy
ds B
anki
ng G
roup
Plc
Roy
al B
ank
of S
cotla
nd G
roup
P
lcA
llied
Iris
h B
anks
Plc
23
Pane
l B: M
illion
s Fi
gure
Met
hod
In M
illio
ns o
f U.S
. Dol
lars
2006
2005
2004
2006
2005
2004
2006
2005
2004
2006
2005
2004
2006
2005
2004
Pro
fit fo
r the
yea
r und
er IF
RS
5,91
5.93
485,
443.
4783
4,80
1.24
222,
741.
5307
1,66
8.32
301
,428
.571
43,
373.
8880
2,96
5.60
002,
651.
3760
5,15
2.57
354,
532.
7273
4,38
0.95
248,
402.
5735
6,26
7.27
275,
959.
7070
U.S
. GAA
P a
djus
tmen
tsAc
coun
ting
for i
nves
tmen
t3.
7641
4.96
89(1
1.18
01)
Acqu
isiti
on a
ccou
ntin
g36
.036
0Al
low
ance
for l
oan
loss
es(7
2.77
29)
122.
9814
991.
3043
Amor
tizat
ion
of c
usto
mer
rela
ted
inta
ngib
les
(268
.382
4)(2
85.4
545)
(287
.545
8)B
anki
ng a
nd g
roup
act
iviti
esB
usin
ess
com
bina
tions
23.8
095
Cla
ssifi
catio
n of
deb
t and
equ
ity10
6.61
76(1
03.6
364)
Con
solid
atio
n(6
0.66
18)
(40.
0000
)12
4.54
21C
umul
ativ
e ef
fect
of c
hang
es in
acc
ount
ing
prin
cipl
es
(net
)(1
,014
.652
0)D
efer
red
tax
effe
ct82
.810
578
.260
98.
6957
0.00
00D
eriv
ativ
es1,
416.
5621
(1,1
55.2
795)
(694
.409
9)(4
40.4
015)
(111
.801
2)
140.
3727
(246
.976
0)(6
5.45
00)
39.8
580
(666
.666
7)D
ispo
sal
32.7
273
1.83
15(6
2.50
00)
Ext
ingu
ishm
ent o
f lia
bilit
ies
(51.
3240
)(3
34.5
455)
(58.
6081
)Fa
ir va
lue
of s
ecur
ities
146.
5201
Fee
and
cost
reco
gniti
on56
.985
310
5.45
45(3
29.6
703)
Fina
ncia
l ins
trum
ents
17.5
659
(822
.360
2)(6
21.1
180)
106.
6240
(305
.800
0)(3
42.8
880)
95.5
882
(758
.181
8)Fo
reig
n ex
chan
ge d
iffer
ence
s on
ava
ilabl
e fo
r sal
e de
bt s
ecur
ities
577.
1644
(437
.267
1)64
1.54
4133
6.36
3678
3.88
28G
oodw
ill(1
4.70
59)
(3.6
630)
Goo
dwill
and
bus
ines
s co
mbi
natio
ns(1
,072
.772
9)(2
14.9
068)
(1,1
57.7
640)
Gua
rant
ees
(16.
5441
)(4
5.45
45)
(18.
3150
)H
edgi
ng(1
39.7
059)
(378
.181
8)H
edgi
ng a
nd fi
nanc
ial i
nstru
men
ts15
2.57
35(2
47.2
727)
(109
.890
1)Im
pairm
ent
(43.
6364
)Im
plem
enta
tion
timin
g di
ffere
nce
– in
tang
ible
s(3
3.72
80)
(36.
3000
)(5
1.87
00)
0.00
00In
sura
nce
16.3
112
(14.
9068
)(7
2.04
97)
(784
.926
5)(7
96.3
636)
(64.
1026
)(1
76.4
706)
(63.
6364
)(1
73.9
927)
Inta
ngib
le a
sset
s0.
0000
(233
.455
9)(2
20.0
000)
(250
.915
8)Le
ase
25.0
240
(14.
3000
)(1
0.37
40)
(11.
0294
)21
.818
2(7
8.75
46)
(628
.676
5)(2
47.2
727)
Liab
ilitie
s an
d eq
uity
51.4
429
96.2
880
40.7
000
Loan
impa
irmen
t17
.565
916
3.97
52(5
70.9
091)
Loan
orig
inat
ion
15.0
565
(6.2
112)
(49.
5040
)30
.250
0(4
6.41
00)
(120
.879
1)Lo
ans
held
for s
ale
(20.
2206
)Lo
ng-te
rm a
ssur
ance
bus
ines
s(6
.528
0)5.
5000
(9.2
820)
Mor
taga
ge b
anki
ng a
ctiv
ities
(67.
7541
)1.
2422
(172
.670
8)N
on-fi
nanc
ial i
nstru
men
ts1.
8382
32.7
273
Oth
er(2
64.7
428)
77.0
186
(513
.043
5)(3
.764
1)(1
3.66
46)
(9.9
379)
(16.
8640
)(3
2.45
00)
(21.
8400
)(3
6.76
47)
(25.
4545
)9.
1575
121.
3235
80.0
000
98.9
011
Pen
sion
(2
97.3
651)
(421
.118
0)(1
10.5
590)
(61.
4806
)(7
3.29
19)
(36
.024
8)(2
10.5
280)
(199
.650
0)(1
54.5
180)
(1,0
60.6
618)
(55
2.72
73)
(236
.263
7)(1
94.8
529)
(367
.272
7)(2
5.64
10)
Pos
t-ret
irem
ent b
enef
its(3
1.25
00)
(1.8
182)
36.6
300
Pre
fere
nce
shar
es45
.169
444
.720
510
8.07
45P
rivat
e eq
uity
inve
stm
ents
112.
9235
85.7
143
165.
2174
Res
truct
urin
g pr
ovis
ions
(200
.752
8)(2
72.0
497)
381.
3665
Rev
alua
tion
of p
rope
rty70
.263
54.
9689
2.48
45(2
55.6
800)
(49.
5000
)(3
5.49
00)
156.
2500
16.3
636
20.1
465
Sale
and
leas
ebac
k(5
33.2
497)
(65.
8385
)(4
5.69
60)
Secu
ritie
s he
ld fo
r hed
ging
pur
pose
s6.
2112
Secu
ritis
atio
ns(8
8.23
53)
370.
9091
38.4
615
Shar
e ba
sed
paym
ent
(90.
6832
)36
.024
8(4
5.16
94)
19.8
758
4.96
89Sh
are
com
pens
atio
n sc
hem
es51
.470
6(3
.636
4)(1
0.98
90)
Softw
are
capi
talis
atio
n(2
7.47
25)
Taxe
s65
.244
776
6.45
9629
4.40
99(1
7.39
13)
(1.2
422)
223.
0400
122.
6500
131.
0400
466.
9118
745.
4545
168.
4982
22.0
588
390.
9091
(3.6
630)
Varia
ble
inte
rest
ent
ities
(325
.367
6)(6
0.00
00)
3.66
30To
tal A
djus
tmen
ts(3
18.6
951)
(1,8
78.2
609)
(1,2
93.1
677)
(249
.686
3)(4
68.3
230)
32.2
981
(414
.528
0)(5
04.3
500)
(517
.062
0)(1
,816
.176
5)(2
,076
.363
6)(1
,619
.047
6)(4
65.0
735)
(936
.363
6)(4
06.5
934)
Net
Inco
me
(Los
s) u
nder
U.S
. GA
AP5,
597.
2396
3,56
5.21
743,
508.
0745
2,49
1.84
441,
200.
0000
1,4
60.8
696
2,95
9.36
002,
461.
2500
2,13
4.31
403,
336.
3971
2,45
6.36
362,
761.
9048
7,93
7.50
005,
330.
9091
5,55
3.11
36
Tabl
e 8
Firm
s in
Com
mer
ical
Ban
k In
dust
ry
Bar
clay
s B
ank
Plc
ABN
Am
ro H
oldi
ng N
VAl
lied
Irish
Ban
ks P
lcR
oyal
Ban
k of
Sco
tland
Gro
up P
lcLl
oyds
Ban
king
Gro
up P
lc
24
Pane
l A: U
.S. G
AAP
ROA
Met
hod
In U
.S. D
olla
rs20
0620
0520
0620
0520
0620
0520
0620
0520
0620
05Pr
ofit
for t
he y
ear u
nder
IFR
S(0
.350
6)(0
.188
0)(1
.112
2)(0
.461
8)(0
.646
3)(0
.641
6)(0
.17
75)
0.26
17(0
.176
5)(0
.051
2)U
.S. G
AAP
Adju
stm
ents
Athe
na n
otes
- ne
t cha
rge
on d
ebt r
etire
men
t0.
0049
Con
verti
ble
note
s0.
0054
(0.4
937)
0.00
05D
eriva
tive
inst
rum
ents
and
hed
ging
act
iviti
es(0
.018
0)In
tang
ible
ass
ets
(0.1
526)
0.03
260.
0269
Mar
keta
ble
secu
ritie
s(0
.004
7)(0
.028
3)M
inor
ity in
tere
st in
net
loss
es o
f sub
sidi
arie
s0.
0331
0.01
64O
ther
(0.0
010)
0.00
33(0
.004
2)(0
.001
2)R
even
ue re
cogn
ition
0.01
980.
0223
(0.0
580)
(0.1
321)
Shar
e (s
tock
) bas
ed c
ompe
nsat
ion
(0.0
002)
(0.0
010)
0.07
610.
0330
(0.0
003)
0.01
560.
0054
(0.0
101)
Tota
l Adj
ustm
ents
0.03
300.
0155
(0.0
765)
(0.0
047)
0.00
470.
0614
(0.4
256)
(0.
0562
)(0
.161
4)N
et p
rofit
(los
s) u
nder
U.S
. GAA
P(0
.317
6)(0
.172
5)(1
.112
2)(0
.538
3)(0
.651
0)(0
.636
9)(0
.11
61)
(0.1
639)
(0.2
328)
(0.2
126)
Pane
l B: M
illion
s Fi
gure
Met
hod
In M
illion
s of
U.S
. Dol
lars
2006
2005
2006
2005
2006
2005
2006
2005
2006
2005
Prof
it fo
r the
yea
r und
er IF
RS
(13.
4786
)(9
.667
7)(8
.721
3)(7
.845
3)(7
.802
6)(4
.752
4)(4
08.7
000)
612.
3000
(17.
4412
)(3
.238
2)U
.S. G
AAP
Adju
stm
ents
Athe
na n
otes
- ne
t cha
rge
on d
ebt r
etire
men
t11
.300
0C
onve
rtibl
e no
tes
12.5
000
(1,1
55.3
000)
0.05
15D
eriva
tive
inst
rum
ents
and
hed
ging
act
iviti
es(1
.138
2)In
tang
ible
ass
ets
(2.5
925)
75.0
000
63.0
000
Mar
keta
ble
secu
ritie
s(0
.056
2)(0
.209
7)M
inor
ity in
tere
st in
net
loss
es o
f sub
sidi
arie
s1.
2739
0.84
53O
ther
(2.2
000)
7.70
00(0
.415
4)(0
.072
7)R
even
ue re
cogn
ition
45.6
000
52.1
000
(5.7
298)
(8.3
509)
Shar
e (s
tock
) bas
ed c
ompe
nsat
ion
(0.0
060)
(0.0
495)
1.29
290.
2447
(0.8
000)
36.6
000
0.53
68(0
.640
0)To
tal A
djus
tmen
ts1.
2679
0.79
57(1
.299
5)(0
.056
2)0.
0349
141.
4000
(995
.900
0)
(5.5
570)
(10.
2018
)N
et p
rofit
(los
s) u
nder
U.S
. GAA
P(1
2.21
07)
(8.8
720)
(8.7
213)
(9.1
448)
(7.8
588)
(4.7
175)
(267
.300
0)(3
83.6
000)
(22.
9982
)(1
3.44
00)
* Rec
onci
led
info
rmat
ion
for y
ear 2
004
were
not
ava
ilabl
e
Prot
heric
s Pl
cNo
voge
n Lt
dPr
ana
Biot
echn
olog
y Lt
dCh
emge
nex
Phar
mace
utica
ls L
tdEl
an C
orp
Plc
Pran
a Bi
otec
hnol
ogy
Ltd
Chem
gene
x Ph
arm
aceu
tical
s Ltd
Elan
Cor
p Pl
c
Tabl
e 9
Firm
s in
the
Phar
amac
eutic
al P
repa
ratio
ns In
dust
ry *
Prot
heric
s Pl
cNo
voge
n Lt
d

25
Pan
el A
: U.S
. GA
AP
RO
A M
etho
d
In U
.S. D
olla
rs20
0620
0520
0420
0620
0520
0420
0620
0520
04P
rofit
for
the
year
und
er IF
RS
0.17
400.
1802
0.17
790.
0846
0.08
710.
0889
0.10
740.
1059
0.09
76U
.S. G
AA
P A
djus
tmen
ts
Ass
ets
asso
ciat
ed to
the
acqu
isiti
on o
f a c
ompa
ny(0
.000
1)(0
.000
1)(0
.000
1)B
usin
ess
com
bina
tions
—go
odw
ill a
nd o
ther
in
tang
ible
ass
ets
(0.0
010)
Def
erre
d in
com
e ta
xes
(0.0
014)
(0.0
034)
(0.0
003)
Dep
reci
atio
n0.
0042
0.00
820.
0121
Effe
cts
of c
hang
ing
from
IFR
S to
U.S
. GA
AP
0.00
24(0
.000
1)0.
0006
Elim
inat
ion
of a
sset
impa
irmen
ts a
nd re
valu
atio
ns0.
0004
0.00
01E
mpl
oyee
ben
efit
oblig
atio
ns
(0.0
009)
(0.0
013)
(0.0
006)
Equ
ity in
vest
ees
reva
luat
ions
, net
(0.0
001)
0.00
18(0
.017
4)Fi
nanc
ial i
nstru
men
ts
(0.0
016)
(0.0
007)
(0.0
003)
Gai
n on
dis
posa
l0.
0000
0.00
29G
oodw
ill o
n co
nsol
idat
ed c
ompa
nies
(0.0
054)
(0.0
111)
Impa
irmen
t of a
sset
s (0
.000
1)(0
.001
3)0.
0006
Loss
on
disp
osal
of r
eval
ued
prop
erty
, pla
nt a
nd
equi
pmen
t 0.
0003
0.00
060.
0009
Min
ority
inte
rest
(0
.010
0)(0
.008
2)(0
.006
4)O
ther
0.00
010.
0001
(0.0
008)
(0.0
039)
Pro
pert
y, p
lant
and
equ
ipm
ent r
eval
uatio
n(0
.002
6)(0
.002
4)(0
.003
1)S
hare
of i
ncom
e of
join
tly c
ontr
olle
d en
titie
s 0.
0032S
tock
com
pens
atio
n0.
0005
Suc
cess
ful-e
fforts
acc
ount
ing
0.00
420.
0006
(0.0
011)
Tax
effe
cts
(0.0
016)
(0.0
029)
(0.0
043)
0.00
250.
0033
0.00
23T
radi
ng in
vent
orie
s0.
0001
(0.0
002)
Val
uatio
n of
inve
ntor
ies
0.00
31(0
.011
5)(0
.004
4)T
otal
adj
ustm
ents
(0.0
039)
(0.0
023)
0.00
23(0
.002
6)(0
.004
8)(0
.029
8)0.
009
2(0
.014
5)(0
.009
1)N
et p
rofit
in a
ccor
danc
e w
ith U
.S. G
AA
P0.
1702
0.17
800.
1802
0.08
190.
0823
0.05
910.
1166
0.09
140.
0885
Pet
roC
hina
Co
Ltd
Tota
l S A
Eni
Spa
Tabl
e 10
Firm
s in
Cru
de P
etro
leum
and
Nat
ural
Gas
Indu
stry

26
Pan
el B
: Mill
ions
Fig
ure
Met
hod
In M
illio
ns o
f U.S
. Dol
lars
2006
2005
2004
2006
2005
2004
2006
2005
2004
Pro
fit fo
r th
e ye
ar u
nder
IFR
S18
,716
.737
717
,023
.284
212
,989
.743
014
,765
.370
115
,245
.96
2713
,500
.621
111
,564
.617
310
,916
.770
28,
768.
9441
U.S
. GA
AP
Adj
ustm
ents
Ass
ets
asso
ciat
ed to
the
acqu
isiti
on o
f a c
ompa
ny(6
.273
5)(6
.211
2)(6
.211
2)B
usin
ess
com
bina
tions
—go
odw
ill a
nd o
ther
in
tang
ible
ass
ets
(3.7
641)
(172
.670
8)D
efer
red
inco
me
taxe
s(1
50.5
646)
(346
.583
9)(2
6.08
70)
Dep
reci
atio
n45
4.27
2177
7.64
2388
5.72
46E
ffect
s of
cha
ngin
g fro
m IF
RS
to U
.S. G
AA
P41
3.66
463.
7641
(11.
1801
)50
.931
7
Elim
inat
ion
of a
sset
impa
irmen
ts a
nd r
eval
uatio
ns45
.169
46.
2112
Em
ploy
ee b
enef
it ob
ligat
ions
(1
49.3
099)
(226
.087
0)(8
4.47
20)
Equ
ity in
vest
ees
reva
luat
ions
(ne
t)(2
2.58
47)
316.
7702
(2,6
45.9
627)
Fina
ncia
l ins
trum
ents
(2
77.2
898)
(119
.254
7)(3
9.75
16)
Gai
n on
dis
posa
l31
6.18
57G
oodw
ill o
n co
nsol
idat
ed c
ompa
nies
(945
.341
6)(1
,691
.925
5)Im
pairm
ent o
f ass
ets
(8.7
829)
(234
.782
6)86
.956
5Lo
ss o
n di
spos
al o
f rev
alue
d pr
oper
ty, p
lant
and
eq
uipm
ent
35.9
559
52.6
637
63.1
109
Min
ority
inte
rest
(1
,077
.424
2)(7
73.0
099)
(466
.151
8)O
ther
13.8
018
13.6
646
(124
.223
6)(5
.018
8)(3
.726
7)(3
47.8
261)
Pro
pert
y, p
lant
and
equ
ipm
ent r
eval
uatio
n(4
57.9
674)
(423
.602
5)(4
64.5
963)
Sha
re o
f inc
ome
of jo
intly
con
trol
led
entit
ies
342.
6460
0.24
38S
tock
com
pens
atio
n77
.018
6S
ucce
ssfu
l-effo
rts a
ccou
ntin
g45
0.43
9158
.385
1(1
01.8
634)
Tax
es e
ffect
s(1
70.1
328)
(274
.046
1)(3
13.1
411)
432.
8733
571.
4286
356.
521
7T
radi
ng in
vent
orie
s11
.292
3(3
3.54
04)
Val
uatio
n of
inve
ntor
ies
335.
0063
(1,1
87.5
776)
(392
.546
6)T
otal
adj
ustm
ents
(414
.683
0)(2
16.5
062)
169.
5427
(461
.731
5)(8
39.7
516)
(4,5
30.4
348)
988.
7077
(1,4
96.8
944)
(817
.391
3)N
et p
rofit
in a
ccor
danc
e w
ith U
.S. G
AA
P18
,302
.054
61
6,80
6.77
8013
,159
.285
614
,303
.638
614
,406
.211
28,
970.
1863
12,5
53.3
250
9,41
9.87
587,
951.
5528
Tabl
e 10
Firm
s in
Cru
de P
etro
leum
and
Nat
ural
Gas
Indu
stry
Pet
roC
hina
Co
Ltd
Tota
l S A
Eni
Spa

27
decision to adopt or not adopt the derivative standards also caused the sampled firms in both
industries to reconcile their derivatives and financial instruments from IFRS to U.S. GAAP. For
instance, Telecom Corp of New Zealand Ltd (2006) chose to apply IAS 39 standard for their
derivatives and financial instruments but did not apply SFAS No. 133 to their derivatives and
financial instruments. A company’s decision to adopt a standard and the different methods in the
standards had caused the sampled firms to reconcile their derivatives frequently.
In the telephone communications without radio telephone industry (see Table 7), the
surveyed companies often reconciled minority interests from IFRS to U.S. GAAP. Both IFRS
and U.S. GAAP standards recognized minority interest differently. For example, IFRS specified
that minority interests were to be included in the stockholder’s equity and presented as a separate
item in the net income as stated in note 26e of National Telephone of Venezuela’s (2007)
reconciliation form. Unlike IFRS, minority interest was reported as a separate item between
liabilities and stockholder’s equity and included as a part of net income in U.S. GAAP. Like
National Telephone of Venezula’s note, Telefoncia S A (2007) disclosed also a similar note on
the presentation of minority interest under IFRS and U.S. GAAP in their reconciliation forms.
The different presentations of minority interest under IFRS and U.S. GAAP have caused the
telephone companies to frequently reconcile their minority interest.
Along with pension and post-retirement activities, derivatives and financial instruments,
insurance was a common reconciled item in the sampled commercial banks as shown in Table 8
of this paper during the period between 2004 and 2006. Insurance contracts and products were
treated differently under IFRS and U.S. GAAP according to the banks’ disclosures in the
reconciliation forms. For instance, Allied Irish Bank Plc’s (2007) stated that the present value of
future earnings from insurance activities was not recognized under U.S. GAAP. Meanwhile,
28
IFRS recognized the present value of future earnings from insurance contracts as noted in Lloyds
Banking Group Plc’s (2007) reconciliation form. With different recognition treatments as
prescribed by IFRS and U.S. GAAP, commercial banks frequently reconcile their insurance
contracts and products
There was no common reconciled item found in the crude petroleum and natural gas
industry besides the category “other” as shown in Table 10. As previously mentioned, “other” is
a broad miscellaneous category on the reconciliation form. Disclosures were not provided for
this line item in Eni Spa’s (2007) and other firms’ reconciliation forms. Each of the sampled
firms reported different reconciled line items from each other in both “U.S. GAAP ROA” and
“millions figure” methods. For instance, Total S A (2007) was the only firm to report financial
instruments as shown in Table 10. Meanwhile, minority interest was the only reconciled by
PetroChina Co Ltd out of the other sampled firms in the industry.
As for the pharmaceutical preparations industry, the sampled firms had the least number
of reconciliation items (see Table 9) out of the other companies in the sampled industries. With
the least number of reconciliation items, earnings under IFRS were relatively the same as
earnings under U.S. GAAP besides the categories including share or stock based compensation,
revenue recognition and “other” during the period between 2005 and 2006. Share or stock-based
compensation related activities were frequent reconciled items in the pharmaceutical
preparations industry. Both IFRS and U.S. GAAP recognized the activities related to share or
stock-based compensation differently. Under IFRS, stock-based compensation plans were
calculated based on a mathematical formula and recognized over the period that the employee
performed related services, as noted in Protherics Plc’s (2006) reconciliation form. Unlike IFRS,
stock compensation plans were calculated based on the difference between issuance shares’

29
market price and the exercise price under U.S. GAAP (Protherics Plc, 2006); the difference were
recognized over the period that the employee performed related services, as noted in Novogen
Ltd’s (2006), and Prana Biotechnology Ltd’s (2007) reconciliation forms. With different
recognition methods, the standards caused the firms to frequently reconcile their activities related
to stock and share based compensations.
Conclusion
From this study, companies will report a higher earning under IFRS than under U.S.
GAAP regardless of the industry that the company is in. In addition, companies will have to
reconcile certain company activities more than other organizational activities from IFRS to U.S.
GAAP if the SEC does not allow IFRS to be used in the U.S. U.S. and non-U.S. companies in
the telecommunication without radio telephones industry will have to use more resources on
reconciling their pension and post-retirement activities, derivatives, financial instruments and
minority interest from IFRS to U.S. GAAP. In the commercial bank industry, U.S. and non-U.S.
issuing banks will have to frequently reconcile the following items from IFRS to U.S. GAAP:
pension and post retirement related activities, derivatives, financial instruments and insurance.
Meanwhile, U.S. and non-U.S. crude petroleum and natural gas companies will need to reconcile
the category “other”. U.S. and non-U.S. pharmaceutical preparations companies will have the
least number of items to reconcile out of the other sampled industries in this paper. The
pharmaceutical preparations companies will reconcile on their share or stock based
compensation related activities. By identifying these areas and other activities, financial
managers can allocate resources properly when reconciling IFRS to U.S. GAAP if the SEC does
not approve of the changeover.

30
References
ABN Amro Holding N V. (2007, April 2). 20-F. Retrieved September 26, 2009, from U.S. Securities and Exchange Commission 20-F Web site: http://sec.gov/Archives/edgar/data/1038727/000095010307000816/0000950103-07-000816-index.htm
Allied Irish Banks Plc. (2007, May 30). 20-F. Retrieved September 26, 2009, from U.S. Securities and Exchange Commission 20-F Web site: http://sec.gov/Archives/edgar/data/850364/000119312507125420/0001193125-07-125420-index.htm
Barclays Bank Plc. (2007, March 26). 20-F. Retrieved September 26, 2009, from U.S. Securities and Exchange Commission 20-F Web site: http://sec.gov/Archives/edgar/data/312070/000119312507063804/0001193125-07-063804-index.htm
Bolt-Lee, C., & Smith, L. (2009). Highlights of IFRS research. Journal of Accountancy, 208(5), 48-52.
Callaghan, S., & Treacy, M. (2007, December 1). Towards convergence IFRS to US GAAP differences. Accountancy Ireland, 39(6), 10-14. Retrieved from http://web.ebscohost.com.rlib.pace.edu/ehost/detail?vid=3&hid=8&sid=29de19a5-a206-4af5-a8ed-717e107df7da%40sessionmgr14&bdata=JnNpdGU9ZWhvc3QtbGl2ZQ%3d%3d#db=buh&AN=27819784
Chemgenex Pharmaceuticals Ltd. (2006, December 28). 20-F. Retrieved September 25, 2009, from U.S. Securities and Exchange Commission 20-F Web site: http://sec.gov/Archives/edgar/data/1175965/000110465906084086/0001104659-06-084086-index.htm
CIA. (2009). CIA: World fact book. Retrieved September 25, 2009, from Central Intelligence Agency of United States of America CIA: World fact book Web site: https://www.cia.gov/library/publications/the-world-factbook/geos/us.html
Eircom Ltd. (2006, June 30). 20-F. Retrieved September 26, 2009, from 20-F Web site: http://sec.gov/Archives/edgar/data/1088652/000119312506140184/0001193125-06-140184-index.htm
Elan Corp Plc. (2007, February 28). 2006 20-F. Retrieved September 26, 2009, from Elan Corp Plc 2006 20-F Web site: http://phx.corporate-ir.net/External.File?item=UGFyZW50SUQ9MzQzMzAwfENoaWxkSUQ9MzI5ODk5fFR5cGU9MQ==&t=1
31
Eni Spa. (2007, June 20). 20-F. Retrieved September 25, 2009, from U.S. Securities and Exchange Commission 20-F Web site: http://sec.gov/Archives/edgar/data/1002242/000131143507000014/0001311435-07-000014-index.htm
European Commission. (2009). European Commission: Internal market. Retrieved November 23, 2009, from European Commission European Commission: Internal market Web site: http://ec.europa.eu/internal_market/accounting/legal_framework/ias_regulation_en.htm
Henry, E., Lin, S., & Yang, Y. (2009). The European-U.S. "GAAP gap": IFRS to U.S. GAAP form 20-F reconciliations. Accounting Horizons, 23(2), 121-150. Retrieved from http://proquest.umi.com.rlib.pace.edu/pqdweb?index=0&did=1790255131&SrchMode=2&sid=2&Fmt=4&VInst=PROD&VType=PQD&RQT=309&VName=PQD&TS=1260948924&clientId=2088
Hughes, S. (2007). Using form 20-F reconciliations to internationalize an accounting course. Journal of accounting education, 25, 137-151.
IASB. (2008, February). IFRSs around the world. Retrieved September 6, 2009, from International Accounting Standards Board IFRSs around the world Web site: http://www.iasb.org/About+Us/About+the+IASB/IFRSs+around+the+world.htm
Koninklijke KPN N V. (2007, March 1). 20-F. Retrieved September 26, 2009, from U.S. Securities and Exchange Commission 20-F Web site: http://sec.gov/Archives/edgar/data/1001474/000110465907015506/0001104659-07-015506-index.htm
Langmead, J., & Soroosh, J. (2009). Planning ahead for IFRS 1: Initial adoption of IFRS by companies. The CPA Journal, (10), 24-29.
Lloyds Banking Group Plc. (2007, June 8). 20-F. Retrieved September 26, 2009, from U.S. Securities and Exchange Commission 20-F Web site: http://sec.gov/Archives/edgar/data/1160106/000093041307005063/0000930413-07-005063-index.htm
National Telephone Co of Venezuela. (2007, May 18). 20-F. Retrieved September 26, 2009, from U.S. Securities and Exchange Commission 20-F Web site: http://sec.gov/Archives/edgar/data/1025862/000119312507118821/0001193125-07-118821-index.htm
Novogen Ltd. (2006, November 29). 20-F. Retrieved September 25, 2009, from U.S. Securities and Exchange Commission 20-F Web site: http://sec.gov/Archives/edgar/data/1075880/000095013306005154/0000950133-06-005154-index.htm
32
PetroChina Co Ltd. (2007, May 11). 20-F. Retrieved September 26, 2009, from U.S. Securities and Exchange Commission 20-F Web site: http://sec.gov/Archives/edgar/data/1108329/000114554907000795/0001145549-07-000795-index.htm
Pijper, T. (2008, November). Are we better off under IFRS? Moody's global corporate finance: Special comment
Prana Biotechnology Ltd. (2007, June 18). 20-F. Retrieved September 25, 2009, from U.S. Securities and Exchange Commission 20-F Web site: http://sec.gov/Archives/edgar/data/1131343/000114420407032259/0001144204-07-032259-index.htm
Protherics Plc. (2006, July 31). 20-F. Retrieved September 25, 2009, from 20-F Web site: http://sec.gov/Archives/edgar/data/945725/000095014406007123/0000950144-06-007123-index.htm
Royal Bank of Scotland Group Plc. (2007, April 24). 20-F. Retrieved September 26, 2009, from 20-F Web site: http://sec.gov/Archives/edgar/data/844150/000095010307001017/0000950103-07-001017-index.htm
SEC a. (2007, December 21). Acceptance From Foreign Private Issuers of Financial Statements Prepared in Accordance With International Financial Reporting Standards Without Reconciliation to U.S. GAAP. Retrieved October 10, 2009, from SEC Acceptance From Foreign Private Issuers of Financial Statements Prepared in Accordance With Internat Web site: http://www.sec.gov/rules/final/2007/33-8879.pdf
SEC b. (2008, August 27). SEC proposes roadmap toward global accounting standards to help investors [Press Release]. Retrieved September 18, 2008, from U.S. Securities and Exchange Commission Press release: SEC proposes roadmap toward global accounting standards to help investors Web site: http://www.sec.gov/news/press/2008/2008-184.htm
Street, D., & Needles, B., Jr. (Eds.). (2009). IFRS digest: What U.S. practitioners and entities need to know now. New York: American Institute of Certified Public Accountants, Inc.
Telecom Corp of New Zealand Ltd. (2006, September 25). 20-F. Retrieved September 26, 2009, from U.S. Securities and Exchange Commission 20-F Web site: http://sec.gov/Archives/edgar/data/875809/000119312506196113/0001193125-06-196113-index.htm
Telefonica S A. (2007, May 18). 20-F. Retrieved September 25, 2009, from U.S. Securities and Exchange Commission 20-F Web site: http://sec.gov/Archives/edgar/data/814052/000095012307007683/0000950123-07-007683-index.htm

33
Total SA. (2007, April 10). 20-F. Retrieved September 25, 2009, from U.S. Securities and Exchange Commission 20-F Web site: http://sec.gov/Archives/edgar/data/879764/000119312507077881/0001193125-07-077881-index.htm
Yearly average currency exchange rates. (2009, November 16). Retrieved November 23, 2009, from United States Internal Revenue Service Yearly average currency exchange rates Web site: http://www.irs.gov/businesses/small/international/article/0,,id=206089,00.html

34
Appendix
A-1: Sampled Firms’ Information
A-2: 2004 to 2006 Currency Exchange Rates for U.S. dollars
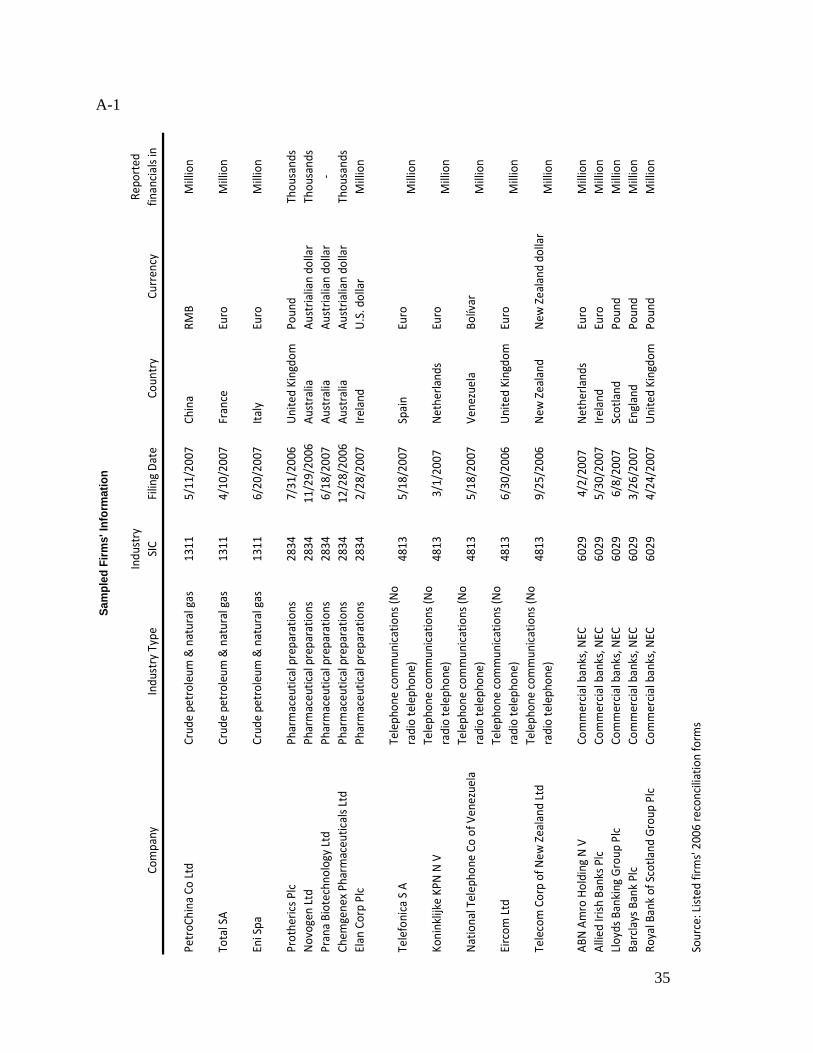
35
A-1
Co
mp
any
Ind
ust
ry T
ype
Ind
ust
ry
SIC
Filin
g D
ate
Co
un
try
Cu
rre
ncy
Re
po
rte
d
fin
an
cia
ls in
Pe
tro
Ch
ina
Co
Ltd
Cru
de
pe
tro
leu
m &
nat
ura
l ga
s1
31
15
/11
/20
07
Ch
ina
RM
B
Mill
ion
To
tal S
AC
rud
e p
etr
ole
um
& n
atu
ral g
as
13
11
4/1
0/2
00
7Fr
ance
Eu
roM
illio
n
En
i Sp
aC
rud
e p
etr
ole
um
& n
atu
ral g
as
13
11
6/2
0/2
00
7It
aly
Eu
roM
illio
n
Pro
the
rics
Plc
Ph
arm
ace
uti
cal p
rep
ara
tio
ns
28
34
7/3
1/2
00
6U
nit
ed
Kin
gdo
mP
ou
nd
Th
ou
san
ds
No
voge
n L
tdP
har
mac
eu
tica
l pre
par
ati
on
s2
83
41
1/2
9/2
00
6A
ust
ralia
Au
stri
alia
n d
olla
rT
ho
usa
nd
s
Pra
na
Bio
tech
no
logy
Ltd
Ph
arm
ace
uti
cal p
rep
ara
tio
ns
28
34
6/1
8/2
00
7A
ust
ralia
Au
stri
alia
n d
olla
r-
Ch
em
gen
ex
Ph
arm
ace
uti
cals
Ltd
Ph
arm
ace
uti
cal p
rep
ara
tio
ns
28
34
12
/28
/20
06
Au
stra
liaA
ust
rial
ian
do
llar
Th
ou
san
ds
Ela
n C
orp
Plc
Ph
arm
ace
uti
cal p
rep
ara
tio
ns
28
34
2/2
8/2
00
7Ir
ela
nd
U.S
. d
olla
rM
illio
n
Te
lefo
nic
a S
AT
ele
ph
on
e c
om
mu
nic
atio
ns
(No
rad
io t
ele
ph
on
e)
48
13
5/1
8/2
00
7Sp
ain
Eu
roM
illio
n
Ko
nin
klijk
e K
PN
N V
Te
lep
ho
ne
co
mm
un
icat
ion
s (N
o
rad
io t
ele
ph
on
e)
48
13
3/1
/20
07
Ne
the
rlan
ds
Eu
roM
illio
n
Nat
ion
al T
ele
ph
on
e C
o o
f V
en
ezu
ela
Te
lep
ho
ne
co
mm
un
icat
ion
s (N
o
rad
io t
ele
ph
on
e)
48
13
5/1
8/2
00
7V
en
ezu
ela
Bo
lívar
Mill
ion
Eir
com
Ltd
Te
lep
ho
ne
co
mm
un
icat
ion
s (N
o
rad
io t
ele
ph
on
e)
48
13
6/3
0/2
00
6U
nit
ed
Kin
gdo
mE
uro
Mill
ion
Te
leco
m C
orp
of
Ne
w Z
eal
and
Ltd
Te
lep
ho
ne
co
mm
un
icat
ion
s (N
o
rad
io t
ele
ph
on
e)
48
13
9/2
5/2
00
6N
ew
Ze
alan
dN
ew
Ze
alan
d d
olla
rM
illio
n
AB
N A
mro
Ho
ldin
g N
VC
om
me
rcia
l ba
nks
, N
EC
60
29
4/2
/20
07
Ne
the
rlan
ds
Eu
roM
illio
n
Alli
ed
Iris
h B
anks
Plc
Co
mm
erc
ial b
an
ks,
NE
C6
02
95
/30
/20
07
Ire
lan
dE
uro
Mill
ion
Llo
yds
Ban
kin
g G
rou
p P
lcC
om
me
rcia
l ba
nks
, N
EC
60
29
6/8
/20
07
Sco
tlan
dP
ou
nd
Mill
ion
Bar
cla
ys B
ank
Plc
Co
mm
erc
ial b
an
ks,
NE
C6
02
93
/26
/20
07
En
glan
dP
ou
nd
Mill
ion
Ro
yal B
an
k o
f Sc
otl
and
Gro
up
Plc
Co
mm
erc
ial b
an
ks,
NE
C6
02
94
/24
/20
07
Un
ite
d K
ingd
om
Po
un
dM
illio
n
Sou
rce
: Li
ste
d f
irm
s' 2
00
6 r
eco
nci
liati
on
fo
rms
Sam
pled
Firm
s' In
form
atio
n

36
A-2
2004 to 2006 Currency Exchange Rates for U.S. Dolla rs
Country Currency 2006 2005 2004
Australia Dollar 1.329 1.312 1.360
China Yuan 7.982 8.203 8.287
Euro Zone Euro 0.797 0.805 0.805
New Zealand Dollar 1.543 1.421 1.509
United Kingdom Pound 0.544 0.550 0.546
Venezuela Bolivar 2149.035 2110.561 1884.780
Source: Internal Revenue Service of United States