ifo institute for economic research at the university of munich “education and training: the...
TRANSCRIPT

Ifo Institute for Economic Research at the University of Munich
“Education and Training: The European Economy’s Best Hope”Munich Economic Summit 2012 – Introduction to Panel 1:
Peering over the Hedge: How Do the Neighbors Do It? Ludger WoessmannUniversity of Munich and Ifo Institute
11th Munich Economic SummitMunich, 3 May 2012

• “If custom and law define what is educationally allowable within a nation, the educational systems beyond one’s national boundaries suggest what is educationally possible.” – Arthur W. Foshay, a pioneer in international testing, in 1962
on the first pilot study of international student achievement
• Countries differ widely in their education policies and outcomesHuge opportunity to learn what works and what does not
• Look at the whole sample of countries to see whether countries with certain policies perform systematically different – Rather than being exceptions to the rule
• All the following statements derive from such systematic econometric cross-country research
Learning from Cross-Country Analyses
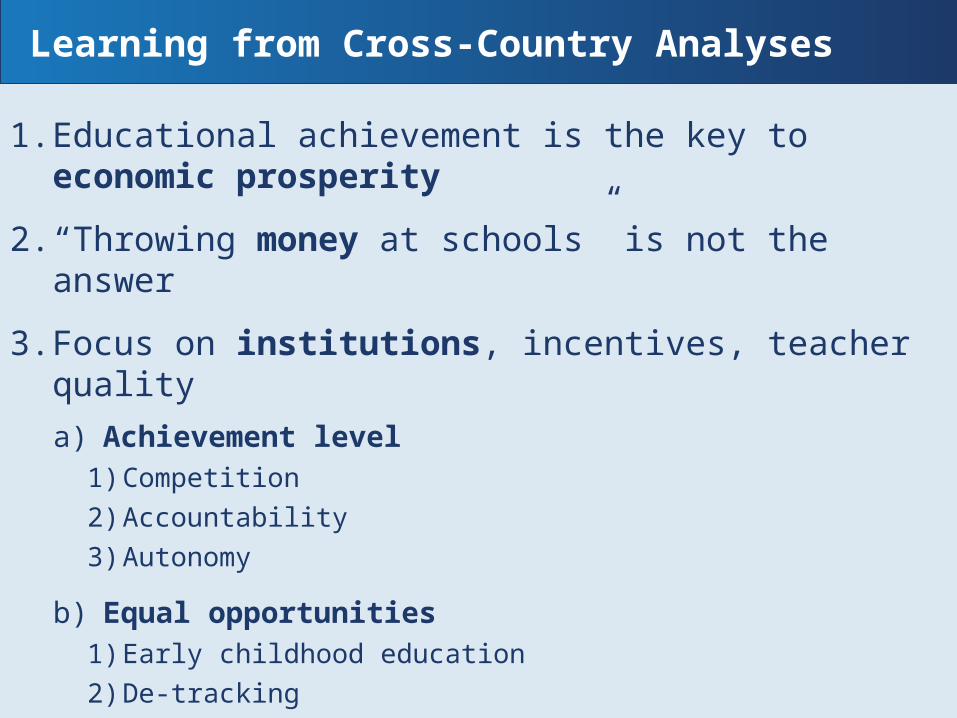
1. Educational achievement is the key to economic prosperity
2. “Throwing money at schools” is not the answer
3. Focus on institutions, incentives, teacher quality
a) Achievement level 1) Competition
2) Accountability
3) Autonomy
b) Equal opportunities 1) Early childhood education
2) De-tracking
Learning from Cross-Country Analyses
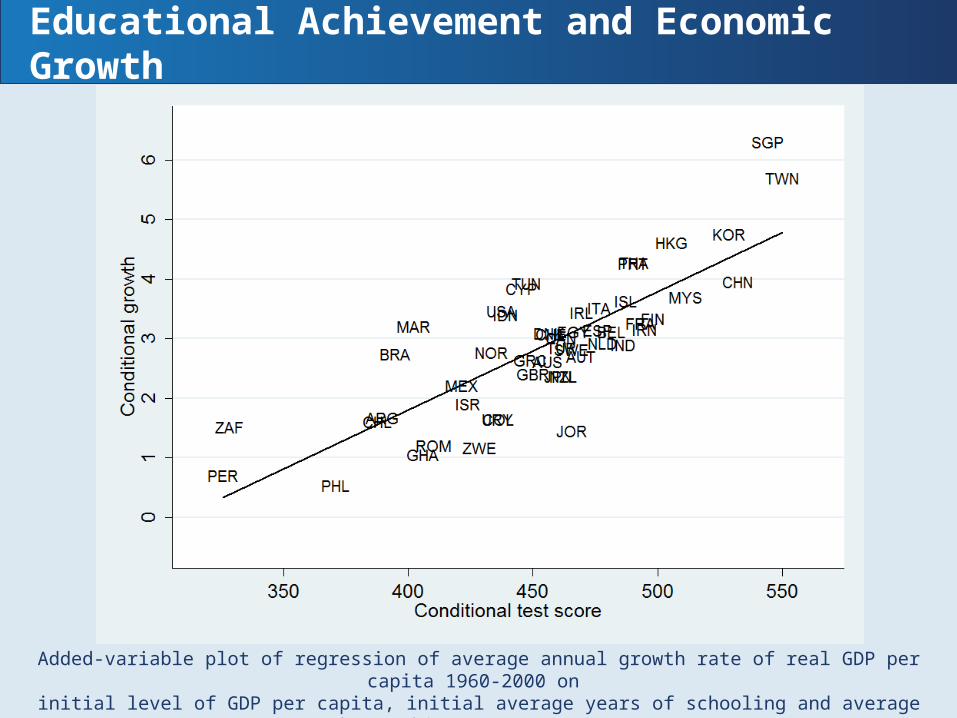
Added-variable plot of regression of average annual growth rate of real GDP per capita 1960-2000 on
initial level of GDP per capita, initial average years of schooling and average student achievement test scores
(mean of the unconditional variables added to each axis). Based on Hanushek and Woessmann (JEL 2008).
Educational Achievement and Economic Growth
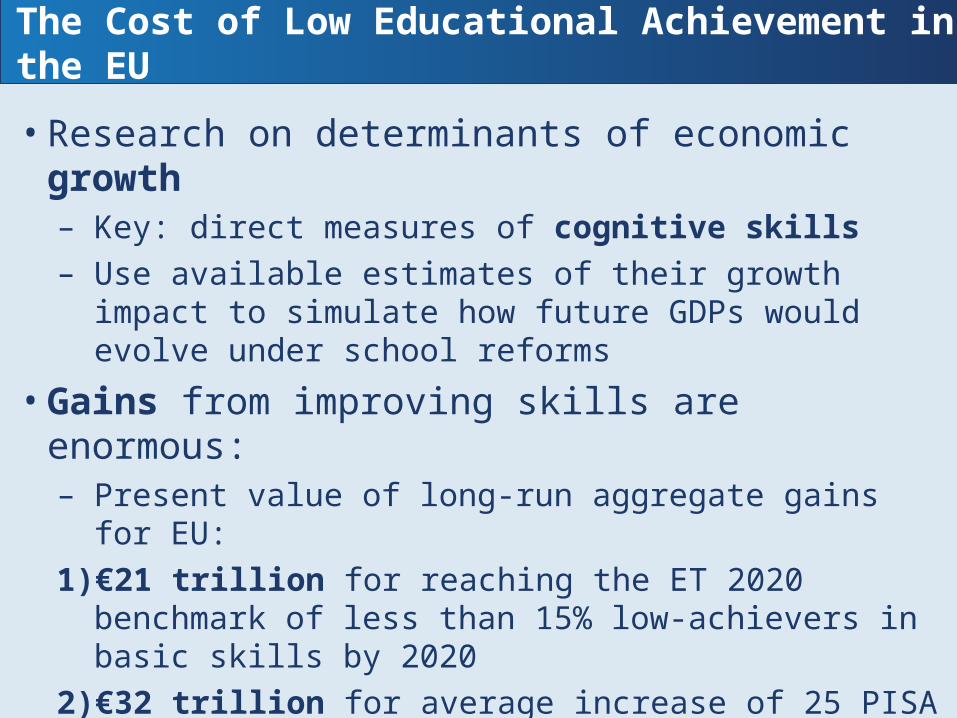
• Research on determinants of economic growth – Key: direct measures of cognitive skills– Use available estimates of their growth impact to simulate
how future GDPs would evolve under school reforms
• Gains from improving skills are enormous: – Present value of long-run aggregate gains for EU:
1) €21 trillion for reaching the ET 2020 benchmark of less than 15% low-achievers in basic skills by 2020
2) €32 trillion for average increase of 25 PISA points
3) €87 trillion for bringing each nation’s achievement to level of top-performing Finland
Focus on educational outcomes, not just attainment
The Cost of Low Educational Achievement in the EU
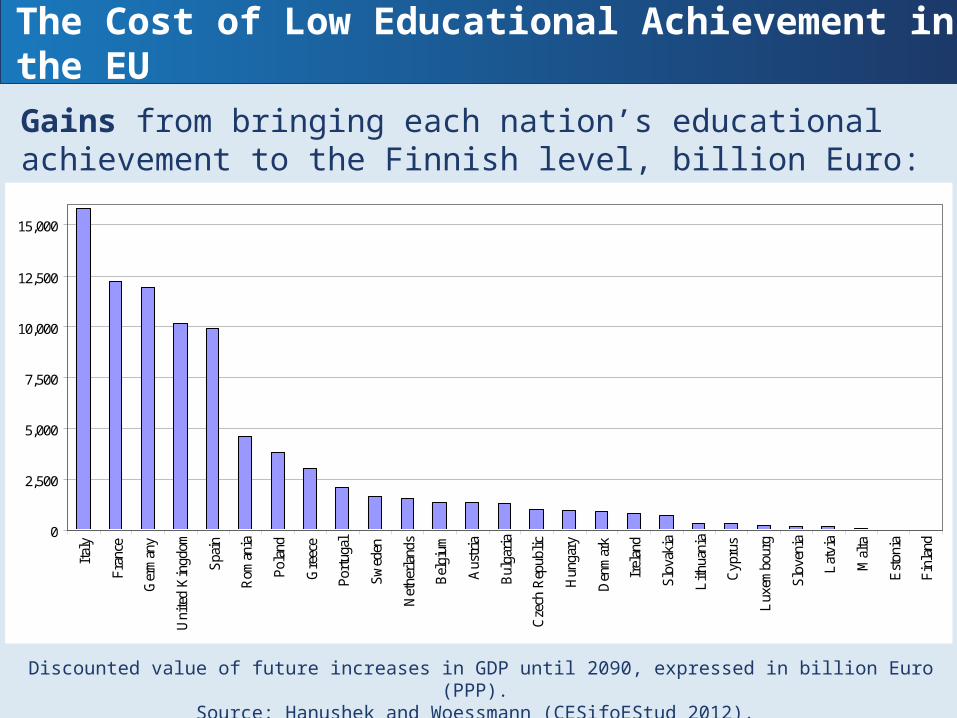
Gains from bringing each nation’s educational achievement to the Finnish level, billion Euro:
Discounted value of future increases in GDP until 2090, expressed in billion Euro (PPP). Source: Hanushek and Woessmann (CESifoEStud 2012).
0
2,500
5,000
7,500
10,000
12,500
15,000
Ital
y
Fra
nce
Ger
man
y
Uni
ted
Kin
gdom
Spa
in
Rom
ania
Pol
and
Gre
ece
Por
tuga
l
Sw
eden
Net
herl
ands
Bel
gium
Aus
tria
Bul
gari
a
Cze
ch R
epub
lic
Hun
gary
Den
mar
k
Irel
and
Slo
vaki
a
Lit
huan
ia
Cyp
rus
Lux
embo
urg
Slo
veni
a
Lat
via
Mal
ta
Est
onia
Fin
land
The Cost of Low Educational Achievement in the EU
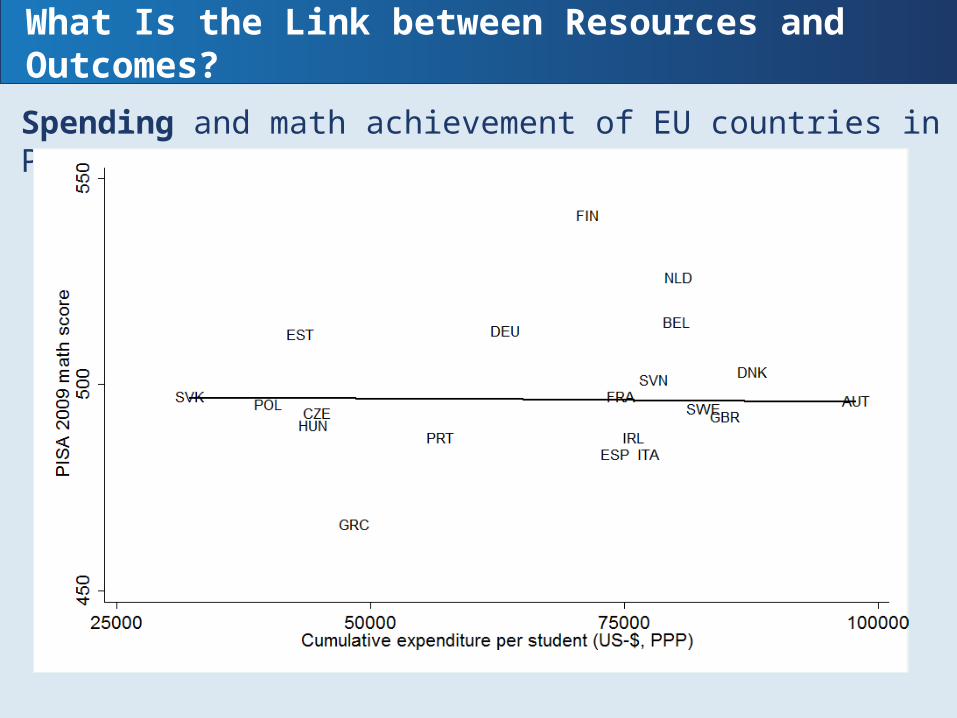
Spending and math achievement of EU countries in PISA 2009:
Own depiction based on PISA 2009 data. Regression line of best fit (without three outliers).
What Is the Link between Resources and Outcomes?

Class size and math achievement of EU countries in PISA 2009:
Own depiction based on PISA 2009 data. Regression line of best fit (without three outliers).
What Is the Link between Resources and Outcomes?

• Incentives – Best way to use investments efficiently and effectively
is to ensure that everyone in the system has incentives to focus on improving student outcomes
Institutional framework: provides the incentive schemes that create better student outcomes – Competition and choice– Accountability – Autonomy
Focus on Institutions, Incentives, and Teacher Quality
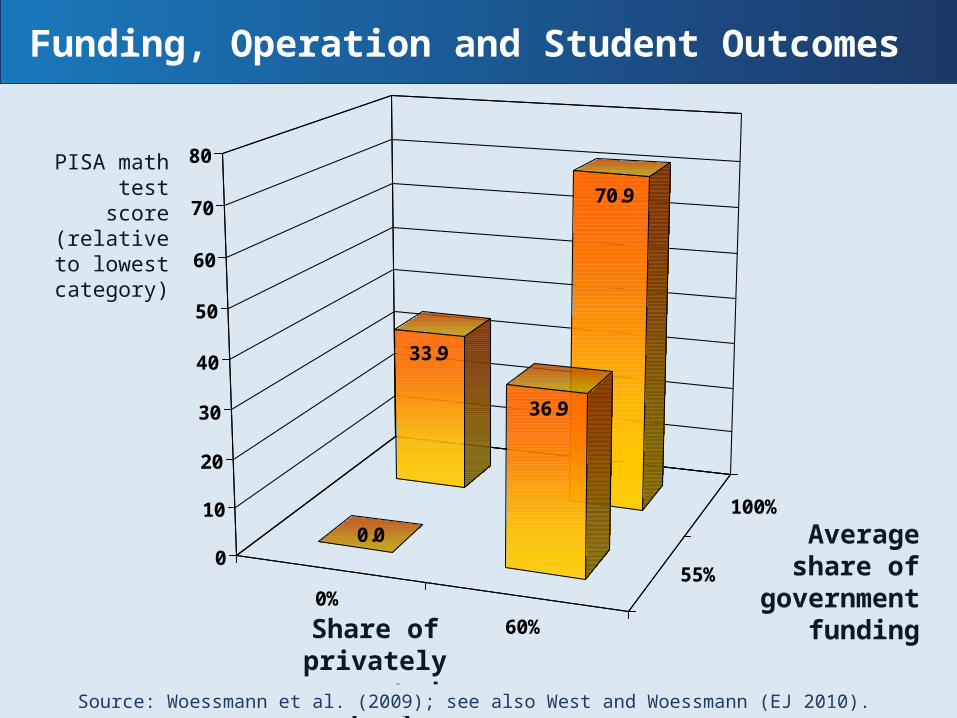
PISA math test score
(relative to lowest
category)
0%
60%
55%
100%
33.9
70.9
0.0
36.9
0
10
20
30
40
50
60
70
80
Average share of government
fundingShare of privately operated schools
Funding, Operation and Student Outcomes
Source: Woessmann et al. (2009); see also West and Woessmann (EJ 2010).
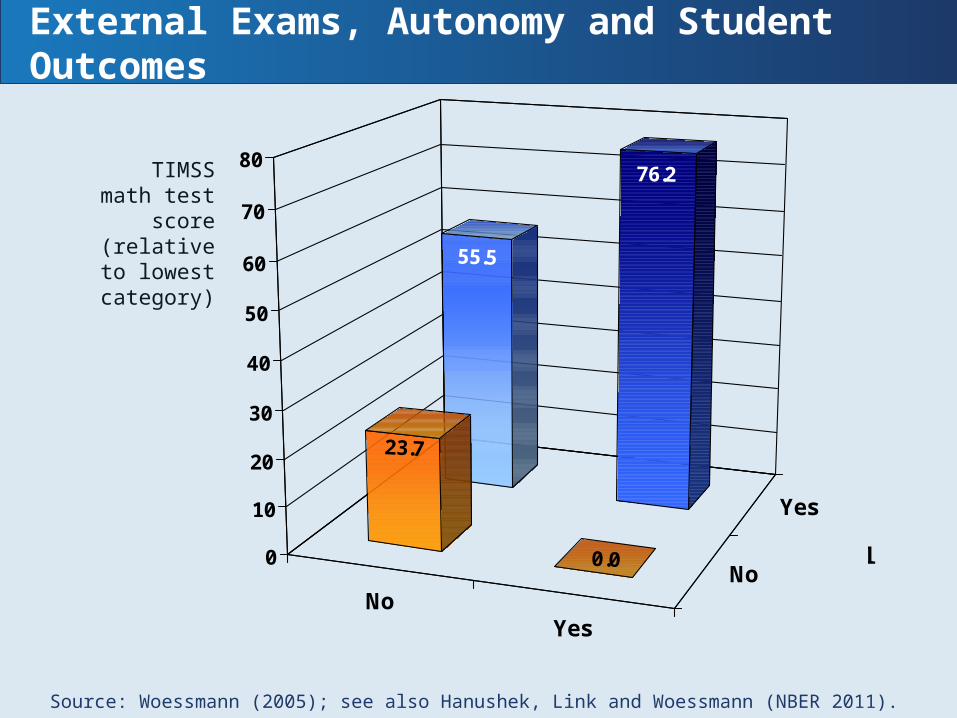
TIMSS math test
score (relative to
lowest category)
NoYes
No
Yes
55.5
76.2
23.7
0.00
10
20
30
40
50
60
70
80
Central exams
School autonomy over teacher salaries
External Exams, Autonomy and Student Outcomes
Source: Woessmann (2005); see also Hanushek, Link and Woessmann (NBER 2011).
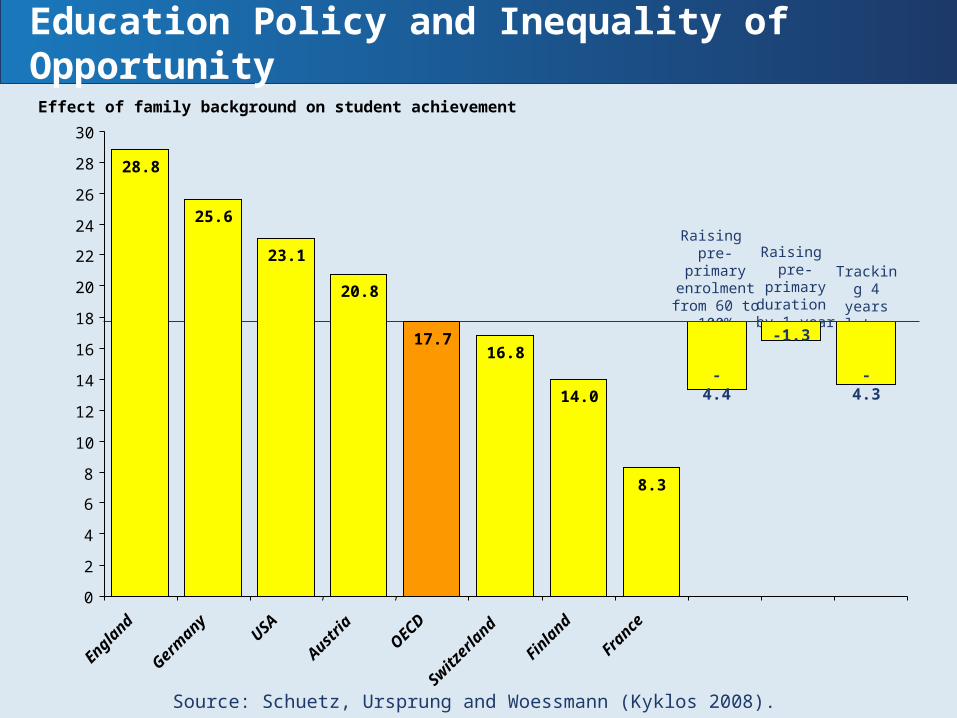
Raising pre-primary
duration by 1 year
Tracking 4 years
later
Raising pre-primary enrolment from 60 to
100%
- 4.3
-1.3
- 4.4
Education Policy and Inequality of Opportunity
Source: Schuetz, Ursprung and Woessmann (Kyklos 2008).
28.8
25.6
23.1
20.8
17.716.8
14.0
8.3
0
2
4
6
8
10
12
14
16
18
20
22
24
26
28
30
England
Germany
USA
Austria
OECD
Switzerland
Finland
France
Effect of family background on student achievement
Canada
France
Germany
Iceland
Latvia
CanadaCzech Rep.
Czech Rep.
France
Germany
Greece
Greece
Hong Kong
Hong Kong
HungaryHungary
IcelandItaly
Italy
Latvia
Netherlands
Netherlands
New Zealand
New Zealand
Norway
Norway
Russian Fed.
Russian Fed.
Slovak Rep.Slovak Rep.
Sweden
Sweden
Turkey
Turkey
United States
United States
-0.6
-0.4
-0.2
0.0
0.2
0.4
0.6
0.8
PIRLS (Primary school) PISA 2003 (Secondary school)
Standard Deviation
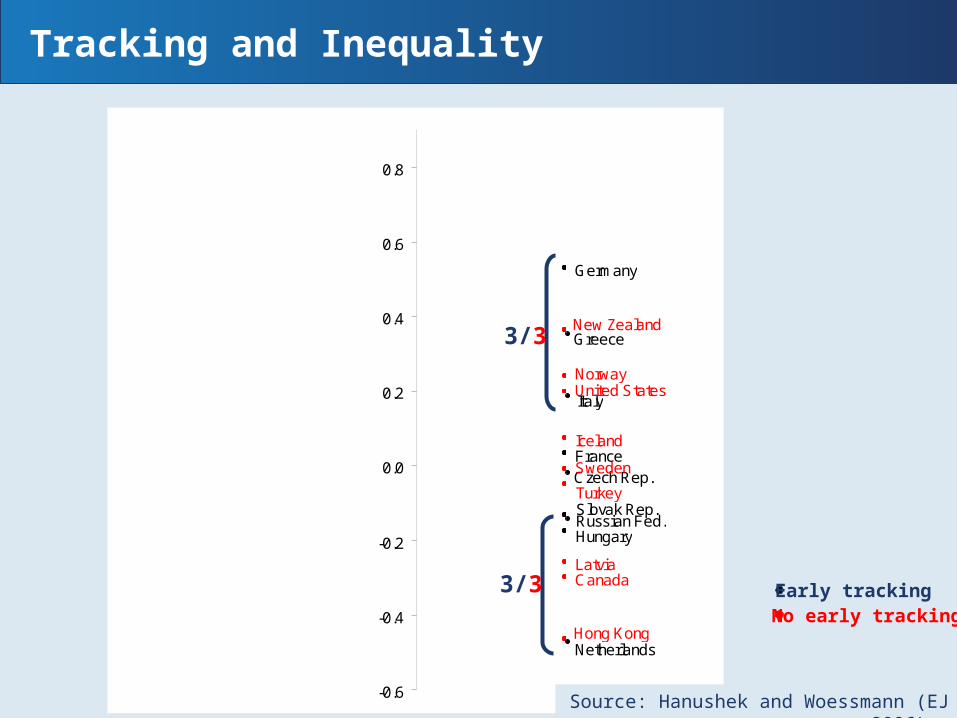
Early trackingNo early tracking
3/3
3/3
Tracking and Inequality
Source: Hanushek and Woessmann (EJ 2006).
Canada
France
Germany
Iceland
Latvia
CanadaCzech Rep.
Czech Rep.
France
Germany
Greece
Greece
Hong Kong
Hong Kong
HungaryHungary
IcelandItaly
Italy
Latvia
Netherlands
Netherlands
New Zealand
New Zealand
Norway
Norway
Russian Fed.
Russian Fed.
Slovak Rep.Slovak Rep.
Sweden
Sweden
Turkey
Turkey
United States
United States
-0.6
-0.4
-0.2
0.0
0.2
0.4
0.6
0.8
PIRLS (Primary school) PISA 2003 (Secondary school)
Standard Deviation
1
2
3
4
1
2
3
4
5
6 Early trackingNo early tracking
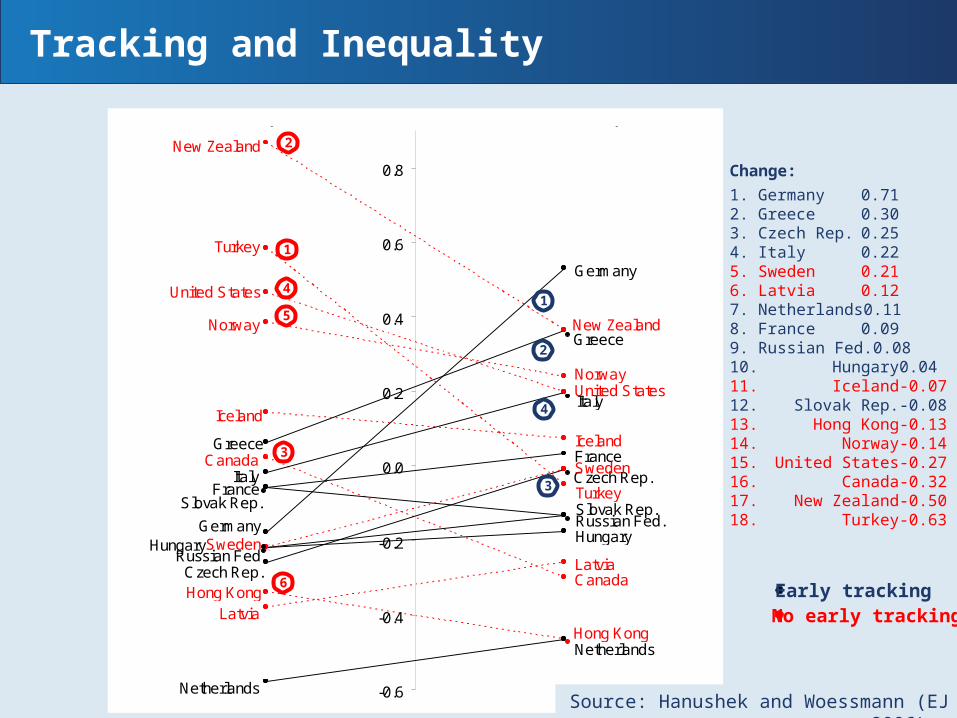
Change:
1. Germany 0.712. Greece 0.303. Czech Rep. 0.254. Italy 0.225. Sweden 0.216. Latvia 0.127. Netherlands 0.118. France 0.099. Russian Fed. 0.0810. Hungary 0.0411. Iceland -0.0712. Slovak Rep. -0.0813. Hong Kong -0.1314. Norway -0.1415. United States -0.2716. Canada -0.3217. New Zealand -0.5018. Turkey -0.63
Tracking and Inequality
Source: Hanushek and Woessmann (EJ 2006).

1. Educational achievement is the key to economic prosperity
2. “Throwing money at schools” is not the answer
3. Focus on institutions, incentives, teacher quality
a) Achievement level 1) Competition
2) Accountability
3) Autonomy
b) Equal opportunities 1) Early childhood education
2) De-tracking
Learning from Cross-Country Analyses