ifip aict 407 - ‘adaptation’ in children – a gui …€˜adaptation’ in children – a gui...
TRANSCRIPT

P. Campos et al. (Eds.): HWID 2012, IFIP AICT 407, pp. 22–34, 2013. © IFIP International Federation for Information Processing 2013
‘Adaptation’ in Children – A GUI Interaction Based Task-Performance Study
Yogesh Deshpande1, Pradeep Yammiyavar1, and Samit Bhattacharya2
1 Department of Design, Indian Institute of Technology Guwahati, India {d.deshpande,pradeep}@iitg.ernet.in 2 Department of Computer Science & Engineering,
Indian Institute of Technology Guwahati, India [email protected]
Abstract. This paper describes an exploration of how children adapt their inte-ractions with different graphical user interfaces (GUIs) in varied task situations. The effect of computer exposure, computer knowledge, attitude and motivation (computer-friendliness) on childrens’ (age 13-15 years) adaptations and per-formance was studied. No significant effect of computer-friendliness was found influencing their adaptations and task-performance. The participants were ex-posed to two different known graphical user interfaces (GUIs). The empirical data shows that participants performed equally well on both the GUIs by adapt-ing their interactions. Also it was observed that a GUI which is rich in features facilitates user adaptations in coping with differences in task complexities. Thus between-task adaptations and adaptivity can emerge as a new usability measure for comparing alternate GUI designs, for users of all age group.
Keywords: Human-Computer-Interaction, User Adaptations, Graphical User Interfaces, Task Performance, Children.
1 Introduction
Coping with different kinds of computing devices has become an essential skill for users of all ages including children. It has now become necessary for a child as young as 6 years of age to interact with various computing devices and interfaces especially in a learning environment.
As new computing and communication devices and software applications replace older ones a greater ability to adapt or discard them would be demanded of human skills. This study focuses on knowing what, when and how do children adapt to graphical user interfaces (GUIs). We have explored adaptations in interaction beha-viour and task performances of children in changing situations.(Adaptation means modification in behaviour for improving performance due to change in environment.)
Empirical research work on user adaptations in interaction behaviour has been re-ported widely as seen in published literature some of which is reviewed below.

‘Adaptation’ in Children – A GUI Interaction Based Task-Performance Study 23
1.1 Related Work
Attempts have been made by researchers to capture factors affecting learner’s task performance and to find relationships among these factors. Personal goals, computer self efficacy,[1][2] motivation,[3] computer usage, anxiety,[4] age, [5] internet effica-cy and attitude[6] have been reported to influence user interactions and satisfaction which may affect the success and failure of a task. A user with high computer self-efficacy or skills may also exhibit poor performance [2]. Inability to adapt to situa-tions causes such perception-performance difference. A review of research on types, causes, effects and adapting ability of users is presented in following paragraphs.
Some researchers have tried to characterize or model these user-adaptations. Gray et al. [7] incorporated a new fuzzy based credit assignment scheme to model user’s adaptations in strategy selection. Freed et al. [8] proposed a new way of cognitive modelling i.e. modelling adaptations in one’s cognitive architectures in response to changing task characteristics or situations.
In coping with different task demands users adapt their strategies and levels in us-ing software features. Heshan Sun [9] investigated the causes of “feature-use adapta-tions”. The observed causes were a new task, other person’s influence, change in working environment, discrepancy in system response and self deliberate initiative. Hayama et al.[10] found a new way to measure user’s adaptivity to software feature-use. They applied simple compression algorithm (LZW) to the user’s operation log to compute compression rate i.e. user’s adaptivity. Thus a new metric of measuring us-er’s interaction adaptivity was contributed. Schmitz et al. [11] used task-technology-fit theory to explain these adaptations. They segregated task adaptations(operational adaptations) from technology adaptations(software adaptations) and additionally found their strong relationship with perceived performance.
Smith et al. [12] found a novel mechanism of detecting drop in a search engine’s performance by monitoring change in user’s adaptations in querying instructions. They proposed that monitoring the querying behaviour of user can be used unobtru-sively to indicate failure in system and adaptively upgrade the system.
In e-learning domain Merri et al. [13] investigated adaptations in selecting a learn-ing-task using a shared-control (user+system) mechanism. In the experimental system a personalized learning-task list is first presented by the system and later user selects his learning-task from this list. The results showed benefit of this mechanism of user-adaptation and control in enhancing task involvement and motivation. Pieschl et al.[14] processed an e-learner’s interaction log and found that they adapt their learn-ing process(time and interactions) to complexity of learning task. Between task adap-tations were computed and summed to get a single score called “adaptation score” for each interaction variable. They concluded that adaptations in judged task complexi-ty(JTC), number of accessed nodes (NAN) and use of hierarchical commands(HC) were significantly related in improving learner’s performance. We have used this adaptation score (ASX – refer section 2.1) as a measure to find magnitude of adapta-tions in search, modify and delete operations of users.

24 Y. Deshpande, P. Yammiyavar, and S. Bhattacharya
Grayson et al. [15] recorded eye-movement data to find whether unconventional interface design layout triggers an adaptation of visual search behaviour during re-peated trials. Results of their experiment show influence of design characteristics like size, colour , boldness and location on adaptation of visual search behaviour.
The reviewed work shows no specific research related to adaptations in children using computers. Most of the findings were related to adaptations to task characteris-tics. Not much research has been reported about adaptations to system or interface characteristics or user’s personality. The authors of this paper have therefore chosen to research on adaptation phenomena in children.
2 Research Questions
This study therefore focuses on investigating adaptations in children to different graphical user interfaces through tasks. The aim was to establish relationship between adaptations and task performance. Children prefer drawing and gaming activities on computers the most. The authors have investigated childrens’ drawing skills on com-puters with different levels of task complexity and using different drawing tools(GUIs).
Terms relevant in this document are defined as follows by the authors.
i. Computer-friendliness= (Computer exposure)+(Computer knowledge)+ (Motivation to use computer)+(Attitude towards computer)
ii. Adaptation Score (ASX) of an operation X is
ASX = (│XT1-XT2│) + (│XT2-XT3│) +..... + (│XTi-1-XTi│) ................ [14] Where XTi = number of X operations during task Ti assuming tasks T1, T2, T3 ... Ti are executed in sequence.
iii. Adaptivity is the ability of adapting as well as achieving an ideal performance level within minimum trials in response to change in surrounding environment.
We have investigated following research questions.
RQ1=Does children’s computer-friendliness significantly affect their drawing performance?
RQ2 = Does task or interface complexity (tool used) significantly affect children’s’ drawing performance?
RQ3=Does task or interface complexity (tool used) significantly affect children’s’ interaction behaviour or adaptations?
‘Adaptation’ in Children – A GUI Interaction Based Task-Performance Study 25
3 Method
3.1 Participants
Participants of this study were 40 students of two different English medium schools situated in Indian cities of Pune and Guwahati. The participants were familiar with Paint and PowerPoint software interfaces. The schools had computer education inbuilt in their curriculum. Details of participants are shown in Table 1.
Table 1. The participants
School Number / Sex Age
Class Computer Experience
Jnana Prabodhini , Pune 10 Boys+10 Girls Mean=13.98 8 + 9 5 yrs
Kendriya Vidyalaya IITG 10 Boys+10 Girls
3.2 Material
Drawing Tools (Graphical User Interfaces - GUI). The drawing tools used were Paint(PNT) and PowerPoint(PPT). Paint was included because of its simplicity and familiarity. PowerPoint was included because of its popularity and ease-of-use. Dur-ing informal group discussions with participants they were asked to give feedback on their perceptions about the two interfaces. These were counter checked with the task evaluator’s opinions. They are summarized qualitatively in Table 2.
Table 2. Comparision of the drawing tools
Parameter Paint PowerPoint
Major use Drawing Slides
Features Low High
Complexity Low High
Ease-of-use High Low
Computer-Friendliness Preset Questionaries. Two questionnaires were designed for scaling computer-friendliness.
Questionnaire (Q1). – Consisted of 14 objective and 3 subjective items grouped into two scales capturing computer-exposure and computer-knowledge. Computer exposure was measured as usage in hours/week at home and at school. Computer knowledge was measured as knowledge of computer hardware, internet and applications.

26 Y. Deshpande, P. Yammiyavar, and S. Bhattacharya
Questionnaire (Q2). – Consisted of 15 objective and 1 subjective items grouped into two scales capturing computer-motivation and computer attitude. Motivation was measured in terms of motivation for e-learning, computer affinity and possessiveness. Computer attitude was measured in form of beliefs and initiatives.
Target Tasks. Total four drawing tasks T1,T2,T3,T4 were administered to the child subjects as shown in Table 3.
Table 3. The drawing tasks
Task Diagram Drawing Tool Time Allotted
T1 D1(Simple)
PowerPoint (PPT) 5 minutes
T2 D2(Complex)
Paint (PNT) 5 minutes
T3 D2(Complex)
PowerPoint (PPT) 5 minutes
T4 D1(Simple)
Paint (PNT) 5 minutes
Task-Performance Evaluation. To remove variability or bias in task evaluation, three evaluators evaluated the tasks of each participant. Average age of evaluators was 28 with experience of two years in design. Drawings were evaluated on the basis of how close the final outcome matches with the master-drawings D1 and D2 in all aspects. Each drawing task was evaluated using a 10 point scale. Average of evalua-tor’s scores was treated as task-performance score for that task.
3.3 Procedure
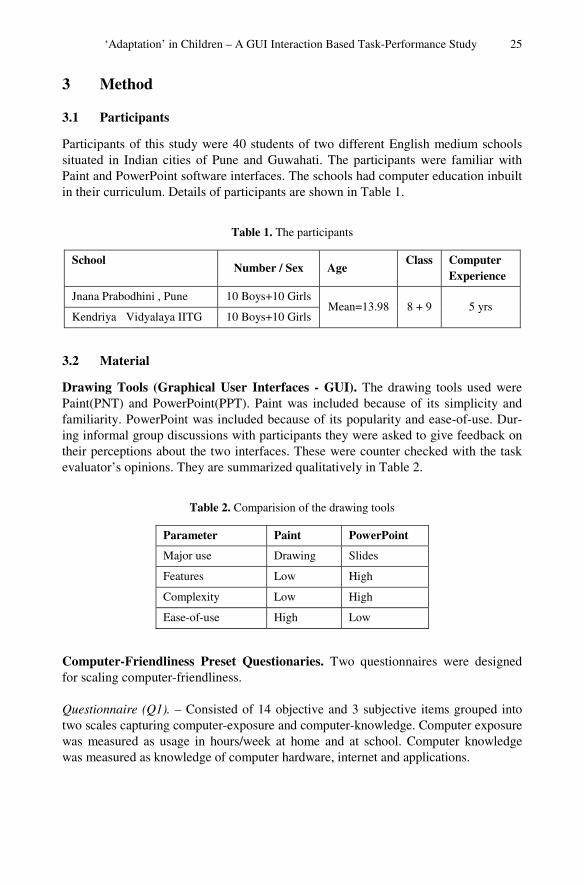
Twenty boys (20 numbers) and girls (20 numbers) from class 8 and 9 of two schools (Table 1) were chosen for the experiments. Participants were chosen randomly by the class-teacher. They were briefed about the study and asked to complete two question-naires Q1 and Q2. After the questionnaire survey participants were given drawing tasks on computers. They were asked to complete four tasks as mentioned in Table 3 using appropriate drawing tools (refer Fig. 1.). Total time consumed for the entire experiment was around 1 hour. To judge drawing performance, drawing outputs were evaluated by expert evaluators having design expertise. (Refer Task-Performance Evaluation paragraph in previous section).
‘Adaptation’ in Children – A GUI Interaction Based Task-Performance Study 27
Fig. 1. Participants performing tasks
Semi-structured group interviews in two groups, were conducted to understand childrens’ mental model, beliefs and per-ceptions about GUI features.
All drawing tasks were recorded using CamStudio Version 2.00 (Copyright 2001-2003 by RenderSoft). The full-screen re-gion was recorded with Microsoft Video-1 compression format, square yellow high-lighted cursor without audio recording.
4 Results and Discussions
Encoded questionnaire data was entered into statistical software (SPSS version-17) for analysis. Task performance scores were also computed and entered into SPSS.
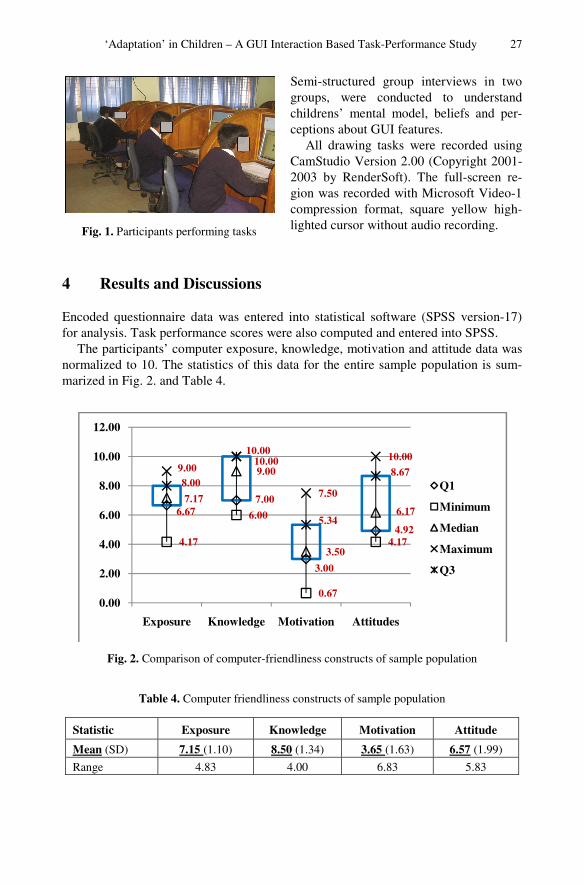
The participants’ computer exposure, knowledge, motivation and attitude data was normalized to 10. The statistics of this data for the entire sample population is sum-marized in Fig. 2. and Table 4.
Fig. 2. Comparison of computer-friendliness constructs of sample population
Table 4. Computer friendliness constructs of sample population
Statistic Exposure Knowledge Motivation Attitude
Mean (SD) 7.15 (1.10) 8.50 (1.34) 3.65 (1.63) 6.57 (1.99)
Range 4.83 4.00 6.83 5.83
6.677.00
3.00
4.924.17
6.00
0.67
4.17
7.17
9.00
3.50
6.17
9.00
10.00
7.50
10.00
8.00
10.00
5.34
8.67
0.00
2.00
4.00
6.00
8.00
10.00
12.00
Exposure Knowledge Motivation Attitudes
Q1
Minimum
Median
Maximum
Q3
28 Y. Deshpande, P. Yammiyavar, and S. Bhattacharya
Results show that students have good knowledge of computers, high exposure to computers and possess positive attitudes towards computers. What lacks is motivation to learn. It is posited here that learning programs on computers need to be engaging and motivating for continuous learning.
4.1 Research Questions
Does Childrens’ Computer-friendliness Significantly Affect their Drawing-Performance (RQ1)?. To answer this question correlation was done between comput-er-friendliness constructs and drawing performance scores of each task and average performance as well. Average task-performance (max=10) was computed as average of task-scores of T1, T2, T3 and T4. Computer friendliness (max=40) was computed as sum of scores of computer exposure, knowledge, motivation and attitude.
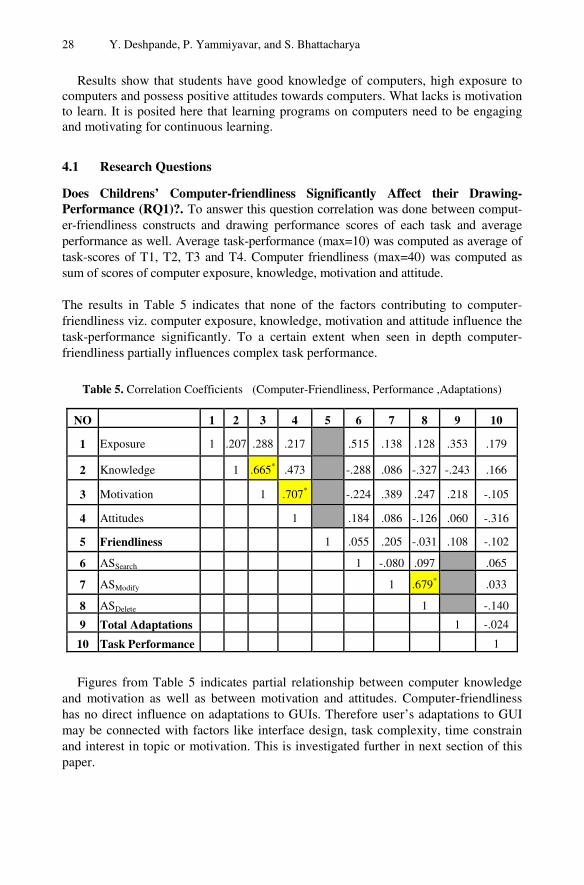
The results in Table 5 indicates that none of the factors contributing to computer-friendliness viz. computer exposure, knowledge, motivation and attitude influence the task-performance significantly. To a certain extent when seen in depth computer-friendliness partially influences complex task performance.
Table 5. Correlation Coefficients (Computer-Friendliness, Performance ,Adaptations)
NO 1 2 3 4 5 6 7 8 9 10
1 Exposure 1 .207 .288 .217 .515 .138 .128 .353 .179
2 Knowledge 1 .665* .473 -.288 .086 -.327 -.243 .166
3 Motivation 1 .707* -.224 .389 .247 .218 -.105
4 Attitudes 1 .184 .086 -.126 .060 -.316
5 Friendliness 1 .055 .205 -.031 .108 -.102
6 ASSearch 1 -.080 .097 .065
7 ASModify 1 .679* .033
8 ASDelete 1 -.140
9 Total Adaptations 1 -.024
10 Task Performance 1
Figures from Table 5 indicates partial relationship between computer knowledge
and motivation as well as between motivation and attitudes. Computer-friendliness has no direct influence on adaptations to GUIs. Therefore user’s adaptations to GUI may be connected with factors like interface design, task complexity, time constrain and interest in topic or motivation. This is investigated further in next section of this paper.

‘Adaptation’ in Children – A GUI Interaction Based Task-Performance Study 29
RQ1 : Computer-friendliness does not significantly affect the task-performance.
Does Task or Interface Complexity (Tool Used) Significantly affect Childrens’ Drawing Performance (RQ2)?. Dependant t-test (paired-samples t-test in SPSS) was conducted to see the effect of task-complexity on the drawing performance. For Paint with two independent tasks (simple, complex) the t statistics was tpaint(36) = 5.561, P < 0.0005 and for PowerPoint it was tpowerpoint(37) = 3.553, P < 0.001.This shows that user’s drawing performance is dependent on how complex is the draw-ing task. Which is evident in Fig. 3. Also the influence of task complexity on perfor-mance is more in Paint than in PowerPoint. This may be accounted to PowerPoint having more features to accommodate ease-of-change during complex tasks. An in-teresting hypothesis arises here: Do more features in a GUI lead to faster adaptation?
Fig. 3. Comparison of task performances
The mean task-performance in case of simple task for PPT=4.9297 and PNT=5.3338. Similarly mean task-performance in complex task situation for PPT=3.8676 and PNT=3.8429. This shows that task-performance is not influenced much by the GUI. A similar t-test was conducted to see the effect of interfaces on the drawing performances. For simple-task with two independent interfaces (Paint, PowerPoint) the t statistics was tsimple(36) = 1.321, P < 0.195 and for complex task it was tcomplex(37) = - 0.113, P < 0.911. This reassures that interface is not influencing the drawing performance to that extend. This is because in difficult task situations, users adapt their GUI interactions, and thereby achieve their goal successfully and efficiently. These user-adaptations can be at two levels (a)cognitive level and (b) interaction level. The second one is explored further in this paper.
3.67
3.00
4.16
2.59
0.00 0.00
2.33
0.00
5.33
3.50
5.33
3.67
8.008.33
8.007.67
6.67
5.08
6.67
5.08
0.00
1.00
2.00
3.00
4.00
5.00
6.00
7.00
8.00
9.00
PPT-Simple PPT-Complex PNT-Simple PNT-Complex
Q1
Minimum
Median
Maximum
Q3

30 Y. Deshpande, P. Yammiyavar, and S. Bhattacharya
RQ2 : The results of this experiment show that children once familiar with a particu-lar GUI show differences in their performances only because of complexity of task executed and not the GUI. They adjust very well to the complexity of known GUIs in keeping performances same. Therefore when exposed to a new interface a child will adapt and perform well (do less errors and take less time) after some trials or learning period. In this case what matters is how quickly he can adapt (adaptivity) to an inter-face. Are these adaptations or adaptivity dependant on interface characteristics or does it depend on individual abilities needs investigation.
Semi structured interviews of participants were conducted to investigate their per-ceptions and belief in this regards. These are depicted in the cause-effect diagram (Fig. 4).
Fig. 4. Cause-effect diagram for poor drawing performance
Does Task or Interface Complexity (Tool Used) Significantly affect Childrens’ Interaction Behaviour or Adaptations (RQ3)?. To monitor interaction behaviour the search(S), modify(M) and delete(D) operations during each tasks (T1 .. T4) were computed by observing the Cam Studio video recordings of these tasks. It was ob-served that 95% of all operations were mainly search, modify and delete. Adaptation-Score(AS) [14] for each individual for each of these operations was computed as follows
ASsearch = (│ST1-ST2│ ) + (│ST2-ST3│) + (│ST3-ST4│) ASmodify = (│MT1-MT2│) + (│MT2-MT3│) + (│MT3-MT4│) ASdelete = (│DT1-DT2│) + (│DT2-DT3│) +(│DT3-DT4│) The statistics obtained for the entire group is shown in Table 6 and Fig. 5.
Table 6. Adaptation Scores Statictics
Statistic ASSearch ASModify ASDelete
MEAN (SD) 11.55 (6.409) 17.36 (7.270) 15.00 (7.253)
RANGE 17 22 22
‘Adaptation’ in Children – A GUI Interaction Based Task-Performance Study 31
Fig. 5. Comparison of Adaptation Scores of interaction variables
Figure 5. shows high adaptation score for ‘modify’ operations compared to ‘delete’ and ‘searches’. It means that a child shows more adaptation in ‘modify’ behaviour while drawing. Therefore if a drawing tool gives a good support and flexibility of modifying drawing elements, it will prove to be a better interface when adapting to different situations. Similarly operations showing more between-task adaptations can be identified for e-learning interfaces as inputs to UI designers.
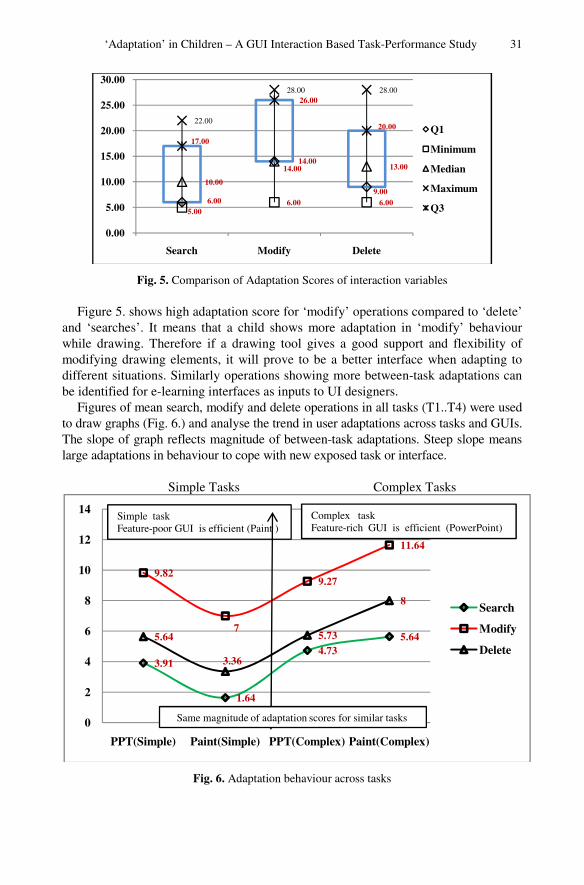
Figures of mean search, modify and delete operations in all tasks (T1..T4) were used to draw graphs (Fig. 6.) and analyse the trend in user adaptations across tasks and GUIs. The slope of graph reflects magnitude of between-task adaptations. Steep slope means large adaptations in behaviour to cope with new exposed task or interface.
Simple Tasks Complex Tasks
Fig. 6. Adaptation behaviour across tasks
6.00
14.00
9.00
5.006.00 6.00
10.00
14.0013.00
22.00
28.00 28.00
17.00
26.00
20.00
0.00
5.00
10.00
15.00
20.00
25.00
30.00
Search Modify Delete
Q1
Minimum
Median
Maximum
Q3
3.91
1.64
4.735.64
9.82
7
9.27
11.64
5.64
3.36
5.73
8
0
2
4
6
8
10
12
14
PPT(Simple) Paint(Simple) PPT(Complex) Paint(Complex)
Search
Modify
Delete
Simple task Feature-poor GUI is efficient (Paint )
Same magnitude of adaptation scores for similar tasks
Complex task Feature-rich GUI is efficient (PowerPoint)

32 Y. Deshpande, P. Ya
Figure 6 shows that magcomplex) tasks is same. B(clicks), Paint is superior complex tasks. In conclusiofeatures by sensing task cperspective.
User adaptation behavio(PowerPoint) adaptations ar
PowerPo
Fig
The conclusion we can drchanges frequently a featurWhile in case where task cGUI and reconfigure UI feat
Fig. 8. Ta
3.91
9.82
5.64
0
2
4
6
8
10
12
14
PPT(Simple) PPT
Feature-rich GUIRequires less adap
Adaptation score l
ammiyavar, and S. Bhattacharya
gnitude of adaptations (slope of graph) for both (simple But when considering number of operations carried during simple tasks while PowerPoint is superior duron an intelligent interface that adjusts the appearance ofcomplexity would be more useful from user’s adaptat
our across GUIs (Fig. 7) shows that for feature-rich Gre less than for the feature-poor GUI (Paint).
oint Paint
g. 7. Adaptation behaviour across GUIs
raw is that, in situation where complexity of task is high re-rich GUI proves beneficial from adaptation perspectomplexity is low and stable user can adapt to an adaptatures depending on task. This is visualized in Fig. 8.
ask characteristics favourable for adaptations
4.73
1.64
5.64
9.27
7
11.64
5.73
3.36
8
T(Complex) Paint(Simple) Paint(Complex)
Search
Modify
Delete
Iptations
Feature-poor GUIRequires more adaptations
low
Adaptation score high
and out
ring f its tion
GUI
and tive. able
‘Adaptation’ in Children – A GUI Interaction Based Task-Performance Study 33
E-learning interfaces should fall in this second category where learning tasks vary slowly in their complexity levels influenced by the learner’s strategies and style.
RQ3: The answer to this question emerges that the adaptations shown in handling simple or complex tasks are same between interfaces. (Fig. 6). However between-task adaptations (from simple to complex) show significant difference among two GUIs i.e. Paint and PowerPoint. (Fig.7). Practical implication of this is that between-task adaptation can be used as a usability measure in evaluating usefulness of alternative interface designs.
5 Conclusions and Future Scope
This study shows that childrens’ drawing performance is neither influenced by their computer-friendliness nor by the GUI they use. Task characteristics affect the perfor-mance to a large extent.
Results also point to the fact that children show adaptations in their interactions to cope up with difficult task situations. Amount of features available in a GUI may influence these adaptations and adaptivity to changing task situations. A further study can be undertaken on this.
Lastly it was seen that a specific functionality or feature of an interface influences ease-of-adaptations like modify feature of a drawing tool. Interface designers therefore can make use of user’s adaptation patterns and limits, in building “adaptation-friendly interfaces”. A task-sensitive adaptive interface may be more useful in personalization and can support adaptivity in a better way.
This paper contributes to an idea of using between-task-adaptation score as a usa-bility measure in evaluating usefulness of alternate interface designs. Can we also make use of user’s adaptation pattern as a tool for cognitive modelling is an interest-ing question that arises.
An investigation into interface characteristics influencing user-adaptivity is re-quired. We need to study whether features available in interface or information archi-tecture of interface or interaction design influences adaptivity. Cognitive adaptivity and interaction adaptivity can be two promising directions for future research.
Acknowledgements. The authors would like to acknowledge the help extended by the Principals of Jnana Prabodhini , Pune and Kendriya Vidyalaya IIT Guwahati. We are thankful to the additional support we got from computer teaching staff Ms. Ro-hini Dhavale, Mr. Rajeev Patel and Mr. Lukman Khan of these schools. We would like to thank all the participating students in this study.
References
1. Yi, M.Y.: Predicting computer task performance: Personal goal and self-efficacy. J. Orga-nizational and End User Computing 16(2), 20–37 (2004)
2. Smith, S.: An examination of computer self efficacy and computer-related task perfor-mance relationship. J. Continuing Higher Education 47306(765) (2005)

34 Y. Deshpande, P. Yammiyavar, and S. Bhattacharya
3. Artis, S.: In Thesis: The Effects of Age, Computer Self-Efficacy, and the Design of Web-Based Training on Computer Task Performance (2005)
4. Veena, D., Joseph, S.: The effects of motivation and computer usage policies and proce-dures on task performance. In: ECIS 2006 Proceedings, Sweden, paper 36 (2006)
5. Pak, R., Czaja, S.J., Sharit, J., Rogers, W.A., Fisk, A.D.: The role of spatial abilities and age in performance in an auditory computer navigation task. J. Computers in Human Be-havior 24(6), 3045–3051 (2008)
6. Sun, P.-C., Tsai, R.J., Finger, G., Chen, Y.-Y., Yeh, D.: What drives a successful e-Learning? An empirical investigation of the critical factors influencing learner satisfaction. J. Computers & Education 50(4), 1183–1202 (2008)
7. Gray, W.D., Schoelles, M.J., Sims, C.R.: Adapting to the task environment: Explorations in expected value. J. Cognitive Systems Research 6(1), 27–40 (2005)
8. Freed, M., Matessa, M., Rehling, J., Remington, R., Vera, A.: Human-Task Adaptations: The Next Step for Cognitive Modelling. In: IICM 2001 Proceedings, pp. 423–425. Virgin-ia, USA (2001)
9. Sun, H.: Adaptive system use; An investigation at the system feature level. In: ICIS 2008 Proceedings, Paris, paper 170 (2008)
10. Hayama, H., Ueda, K.: Evaluation of Users’ Adaptation by Applying LZW Compression Algorithm to Operation Logs. In: Negoita, M.G., Howlett, R.J., Jain, L.C. (eds.) KES 2004. LNCS (LNAI), vol. 3215, pp. 625–631. Springer, Heidelberg (2004)
11. Schmitz, K.: Exploring Technology and Task Adaptation Among Individual Users of Mo-bile Technology. In: ICIS 2010 Proceedings, St. Louis, paper 57 (2010)
12. Smith, C.L., Kantor, P.B.: User adaptation: good results from poor systems. In: SIGIR 2008 Proceedings, Singapore, pp. 147–154 (2008)
13. Corbalan, G.: Selecting learning tasks: Effects of adaptation and shared control on learning efficiency and task involvement. J. Contemporary Educational Psychology 33(4), 733–756 (2008)
14. Pieschl, S., Stahl, E.: Is adaptation to task complexity really beneficial for performance? J. Learning and Instruction 22(4), 281–289 (2011)
15. Tzanidou, E., Petre, M., Minocha, S., Grayson, A.: Combining Eye Tracking and Conven-tional Techniques for Indications of User-Adaptability. In: Costabile, M.F., Paternó, F. (eds.) INTERACT 2005. LNCS, vol. 3585, pp. 753–766. Springer, Heidelberg (2005)