if you have issues viewing or accessing this file, please ... sex, age, and birth order; but the...
TRANSCRIPT

Deriving M:!a.sures of Delinquency fran Self-report Data
00 .: J
$
Joel Zinmennan Research Director, Creighton University Institute
for Business I Law and Social Research Ph.D. I Psychology, 1973, Northwestenl University
Paul K. Broder Senior Research Associate, Creighton University Institute for Business, Law and Social Research
Ph. D. I Psycholocjy, 1973, Northwestenl Uni versi ty
April 21, 1978
If you have issues viewing or accessing this file, please contact us at NCJRS.gov.

•
'I' Abstract
The purpose of this research was to explore different ways of using
self-report data to derive neasures of juvenile delinquent behavior.
'Ihe subjects were 161 public school children L.Tl the Omaha area, 1,030
public school children and 665 adjudicated delinquents in the rretropoli tan
areas of Baltllrore, Indianapolis, and Phoenix. The cmaha youth responded
to 2S self-report items two tirres with an intervening period of three
weeks, and then rated the items ,for seriousness. Four rreasures of delinquency
were derived fran the data: frequency of activity, diversity of activity,
seriousness of acti vi ty, and progression into delinquent behavior. The
four rreasures were shCMn to: be highly reliable and strongly intercorrelated;
none was shCMn to be cons;Lstently betw.r than the other three. Hated
seriousness and reported freqrency of behavior were highly negatively
correlated, giving suppo:ct to the use of frequency rreasures in building
delinquency scales. However, the use of Gutman scales and other empirical
approaches based upon frequency of activity, as the basis for theoretical
argurrent about the cJ.brens;i..onality of juvenile delinquency, was questioned.
All four scales shCMed differences wi thin the Omaha semple as a function
of sex, age, and birth order; but the differences were not always in the
sarre directions using the four rreasures.

y Deriving M:asures of Delinquency fran Self-re:t;:ort Datal
Joel Zimnennan
Paul K. Broder
Creighton Uni versi ty: 2 Institute for Business, raw and Social Research
The use of behavioral measures of juvenile delinquency, such as
those derived fran self reports, has been of value because of the flaws
inherent in research definitions based solely upon official adjudication.
By sore estimates., as many as 90% of delinquent acts may go un::1etected
by police. 3 Additionally I the treatment of those children whose behaviors
are detected may vary as a result of factors other b'1.an behavioral
events, per see Thus, it has been said, for example, that: lithe basic
rationale for the use of self-re:t;:ort has been to eliminate a presumptive
bias of class and/or race in official statistics.,A
Previous studies of self-re:t;:ort data have shown that these instrl.:lIrents
are reliable and valid. 5 MJst investigators using self-report data sean
to agree that they are "sufficiently reliable arrl valid to make their
collection and analysis e:ninently w:JL'thwhile. 1I6
It has been stated that the true value in self-reINrt data is in
the capability they offer to treat delinquency as a variable, rather
than only as a dichotarous attriblte. 7 Given the inherent. protective
nechanisms arrl numerous diversion opportunities of our social-legal
syste:n, a child usually has becane seriously delinquent (by whatever
definition) by the tline he has been apprehended and officially adjudicated.
The dichotany between officially adjudicated delinquent arrl all other

.' children is frequently too gross to be of value in a scientifically
analytical sense. Self-report data make possible a dirnensionalization
of delinquency I fran slight behavioral deviations fran nonns I to those
behaviors serious enough to cause the irnposi:";ion of formal social arii
legal sanctions. By now, it is generally accepted that self-report data
contain sufficient external validity to use th.sn in exploring the
relationship be~ delinquency and other variables, 8 to rroni-tor changes
. beha' 9 and 111 V1or, so on.
The purpJse of the present research is to explore different ways in
which to use self-report data to derive in:iices of delinquency. Several
unidimensional in:ii~es will 1:e developed and used to measure the extent
of delinquent involvanerit. The develotznent of indices I havever, is not
entirely an end in it.self. One value of self-repJrt data is its use in
defining delinquency as a continuous variable which can 1:e related to
other infonnation atout children, and the capability it offers to explore
the manner in which- self-reported delinquency differs fran the stringent • ~ i :
definition of delinquer.cy as defined by formal adjudication. This
report is a prelbninary'step in an investigation of the relationship
l:etween juvenile delinquency and learning disabilities. The delinquency
in:iices will 1::e used to detennine whether and in what ways children with
learning disabilities behave differently fran other children, and whether
they are treated differently rr.i D'e legal system. Th:>se results will 1:e
reported in separate documents.
The various approaches to indexing delinquency which will 1::e examined
in this paper, all have been rrentioned in the literature l:efore,lO but
there has been little attanpt to canpare the sensitivity and inter-
- 2 -

"
relationships of such neasures. Although the different treasures can be
derived fran the same set of self-report data, they are calculated
differently and address different questions about delinquent involvement,
at least on a conceptual level. Specifically, del:i11quency can be
irna'{ed wit.h self-report data in at least four ways. First, a xreasure
can be derived to irrlicate frequency of involvement in delinquent acts.
Next, the diversity of delin:;ruent behavior can be considered by noting
the number of different categories of delinquent acts in which a child
has ever engaged. Third, seriousness of behavior can be examined by
using indeperrlent judgrnents of the seriousness of delinquent acb~: to
w=ight the scoring; of behavior. Finally, considering delinquen~1 as a
single d:iroension, one can rrsasure the phenanenon by noting how far along
the dimension a chil4l has progressed. These different treasures are the
subject of this paper.
One :irnp:lrtant theoretical question which has been addressed in
previous studies is whether delinquency should be considered unidi
mensional or mu1 tiCl,~sional. While the purpose of this paper is rot
to argue theoretically 'for or against a hypothesis of the multidimen
sionality of delinquency, ~ carments al:out the subject are in order
because the present data will be developed fran a particular point of
view. One aspect of this issue concerns the scalability of self-report
data using the Guttman unidimensional scaling techniques. On a con
ceptual level, the question is simply whether delinquency progresses
along a predictable, infrequently varying path of successively serious
behaviors. A set of behaviors is said to be unid:imensional if it can be
shown that virtually every child WlO has engaged in a given behavior
- 3 -

•
also has engaged previously in every other behavior (on the scale) which
is less serious. A child's delinquency is indexed as the IIOst serious
behavior to which he admits having progressed (implying, if the scale is
unid:irnensional, that he or she also has engaged in all other less serious
behaviors as well).
Many investigators have used the Gutbnan scaling procedure to
define unidimensional scales of certain types of delinquency! such as
theft. 11 As additional· i terns are added to such scales, a camon result
is that the exparrled set fails to scale unidirne.nsionally. This empirical.,
analytical phenanenon is taken as theoretical evidence to suggest that
delinquency should be viewed multidirne.nsionally rather than unidirne.n
. nall 12 s~o y.
The position espoused in this research is that the d:imensionality
of delinquency should not be inferred fran the Gutbnan scaling of self-
report data based upon frequencies of carrnission of a set of delinquent 13 '.
acts. There are several reasons why theoretical inferences made fran
empirical scaling experinEnts can be called into question. The reasons
are roth empirical an:1 theoretical.
Based upon e:npirical firrlings, many studies report difficulties in
getting iterns to scale according to the usual Gutbnan criteria.14 It
i::; true that all i terns should not be expected to fonn Gutbnan scales;
l:ut the scaling p:r:-ocess itself is one of "trial and error. ,,15 Items are
included or not, l:m:::l "cutting points" are set and reset, until the scale
"~rks" as well as it can be made to. This process enables and invites
- 4 -

an investigator to make use of the idiosyncratic, spurious statistical
characteristics of a data base. Given the difficulties which have been
reported in making items scale, along with the opportunistic rranner in
which such scales are finally achieved, t.h; errl results of Guttman
scalings should be accepted only with caution. In fact, gocd practice
should require that any such scale re developed with one group an:l
validated indeperrlently with another group. Finally, it should be shown
that the scaled items, used as an in:1ependent set, retain their scaling
characteristics. To the best knowledge of the authors, such rigorous
validations have not been corrlucted.
Even if scales were validated this way, there still muld be reason
to question the empirical results as ,evidence for the theoretical issue
of the dirrto..nsionality of delinquency. The scales camonly are constructed
'Jy grouping items whi~h have a conceptual similarity (e.g., they all
deal with theft; or, in a different scale, they all deal with vanc:1alism) .
The ernp¥ical frequencies of ccmnission are then shoNI'l to scale. But
suppose, hypothetically; that t\\O four-itan scales were developed arrl
validated as unidimensional scales: a theft scale and a varrlalism
scale. At face level, it is reasonable to accept this as evidence for
t\\O in:1eperrlent d.imensions of delinquent behavior (Le., theft and
varrlalisrn). HOwever, suppose it were sh.own that the first u..'O items of
the theft scale arrl the last tm items of the vandalism scale confOrme:l
to the Guttman scaling requiranents, as did another in:1ependent set
CClT[X>sed of the first t\\O items of the vandalism scale and the last tWJ
itE:.'"nS of the theft scale. 16 W:mld these b;o scales be acceptable as
evidence of tm theoretical dimensiol,1S of delinquency: a low-theft-
- 5 -

"
high-vandalis:n dimension ani a low-vanialism-high-theft dimension?
Although the preceding argument \\QuId lead to an affirmative response,
we believe that those scales w::mld not be conceptually acceptable.
In one sttrly, three Guttman scales were constructed arourrl the
. ck' 17 he dinen.sions of theft, vaniall.s:n, ani atta s agamst persons. - T
Pearson correlations arrong the scales were .62, .57, and .08 and the
rank order correlations arrong them were .63, .66, ani .52. The author
suggested that the results supported a hypothesis of nrul tidimensionali ty
despite the correlations arrong the scales, based upon the anount of
shared variance (E.2) ani the relatively poor predictability of anyone
based on any other. We consider correlations of that rna.gnitude to be
rather high,18 however, and conclude fran them that a hypothesis of
three separate dimensions is not well supported. The correlations also
make tenable the possibility that "crossed-iten scales" (as suggested in
the previous paragraph) could have been constructed from those data.
Setting aside the empirical results, there are purely theoretical
reasons to question this use of Guttman scales in the issue of dimen-
sionality. It has been pointed out that while the scaled Guttman position
of a delinquent act is a function of its frequency of oamrnission, the
nature and likelihood of the system's response to that act is not
necessarily related to its frequency of oamrnission in the population. 19
Society's response to an act is probably rrore closely related to the
act's seriousness than its frequency of oamrnission. The relation..<>hip
between the seriousness of an act and the frequency of its oamrnission is
an anpirical question ani is addressed directly in the current research.
- 6 -

The system I s response to an act, in fact, has been used to oper
ationally define an act I s seriousness. "Measurement of this dimension
[seriousness] necessitates o:.:msideration of the response to
behavior. . • • A rreasure of seriousness should, therefore, reflect
the likelilxx:x:i that social control agents will respond
officially . • • • ,,20 Following this approach, self-reported acts may
be classified as more or less serious, for exaIrq?le, depending upon
whether the acts would be punishable as felonies or misdeneanors. l-any
researchers have questioned whether frequency of commission is appropriate
or adequate as a measure of seriousness2l and same have scaled perceiVed
seriousness of offenses directly, independently of frequency.22
While self-report data usually take the fonn of frequencies of
carrnis s ion , delinquent acts also can and should be viewed in tenns of
the conceptual nature of the act (theft, vandalism, etc.), the seriousness
of the act, and perhaps in other ways. Dlinensionality has been detennined
empirically py using Guttman analyses (and factor analyses23 ) exclusively
on frequency data. The position taken in this paper is that dirrensionality
is probably better detennined on the basis of other characteristics of
delinquent acts, rather than py detennining the specific acts wix>se
frequencies of commission are related statistically. This research
endeavors only to derive measures of delinquent behavior; it does not
use the measures to explore the theoretical issue of the dirrensionality
of delinquency.
- 7 -

Subjects. The children wh:::>se responses are used in this research
will be referred to as public-sclXlOl (PS) children and delinquent (JD)
children. The main research sample was canposed of 1,030 PS and 665 JD
children fran the areas of Bal tinore, Indianapolis, and Phoenix. TJ:lls
sample will re referred to as the "3-city sample." Another group of 161
PS children fran the Qnaha area provided the principal data for the
develop:nent of the self-report measures.
All 665 JD children were officially adjudicated delinquents. At
the time of their involvanent in this research, they were either on
probation, institutionaliz¢, or on parole. The JD sample included
males and females between the ages of 12 and 17.
The 1,030 PS children in the 3-city sample all were males retween
12 and 16 years of age. (Originally, the JD and PS samples were to have .' ~ !
been canposed of similar youth. HOwever, the resulting JD sart"\l?le proved
too small for the major research purposes of this study. Therefore, the
JD sample waS enlarged to include fanales, and 17 -year olds.) The PS
children were cmsen randanly fran the populations of several schools in
each of the cities. The schools were cmsen by local school systen
personnel according to t\.-.D criteria: to provide a logistically convenient
mix of schools fran which to sample; and to provide the rrost heterogeneous
sample possible in tenns of the students I socio-econanic and ethnic
characteristics.
- 8 -

The 3-city children were participants in a project whose main
p.ll1XJse was to explore the relationship be~ learning disabilities
and juvenile delinquency. All the children's records were scI'eene:::l for
indications of possible learnin:] disabilities. If the presence of
learning disabilities could be rule:::l out with a high degree of certainty,
t±e children canplete:::l only an :i.nc1ividual 25-minute interview. 24 otherwise,
the children irrlividual1y were given a battery of diagnostic tests,
including the ~JaIre 25-minute interview at the end of the battery I during
a single session of approx.irnate1y 3.5 hours. The interview items were
read aloud to each chiid a.rrl responses were recorded by the test administrator.
'lhe testing and interviewing of the PS youth occurred approx.irnate1y fran
April through June, 1977. The testing arrl interviewing of the JD children
occurred approx.irnately :fran April through September, 1977 .
. The 161 PS chilaren in Qnaha were involved in the research only for
the purposes of investigating the interview materials generally, and the
test-retest reliability of the self-report instrument specifica11y.25
All the children were· in :grades 7 through 9 of a public school :in the
Qnaha area. Whereas the 3-city PS children were quite heterogeneous
with regard to race and social class, the Qnaha group was h:::m:lgeneous1y
white and upper-midd1e class with few exceptions. The children met as
groups in their c1assroans with the research staff. The interview guide
was read aloud by the researcher. The students were asked to read along
silently and to write the answer to each question in turn. The interviews
were administere:::l in Decanber, 1977. Three weeks later, in January,
1978, the self-report items were administere:::l for a second tirce.
Fbllowing that r the children were aske:::l to rate the seriousness of each
- 9 -

of the self-rer;ort itarLS (in a manner to be explained below). Each of
the two sessions took 35 to 40 minutes.
All the institutionalized JOs participated in the research with the
consent of the training school superintendents and. corrections depa.ri:Irent
officials. For all other children, inforrr.:=d consent was obtained fran
parents or guardians. All cooperating schools, courts and corrections
agencies provided directory infonnation and other necessary means for
contactmJ these persons. For all JOs listed on the agencies' directories,
and for a sample of the PS children, letters were mailed to parents
explaining the research ar:d seekil1g consent for the children's participation.
Afte.r perioos of tw::;, to four weeks, any parent who had not consented and
who had not affirmatively refused consent was sent another letter.
~elephone calls were then made whenever r;ossible to answer questions and
encourage consent. Arrong the 3-city samples of JO and PS children,
consent to participate was gained ~ran approximately 35%. .AmJng the
Qnaha sample, consent was gained frau approximately 75%.
Sane children were' eliminated fran the study in the 3-city sample.
This was done because of the need to classify the children consistently
with regard to the presence or absence of learning disabilities.
Children ",ori th physical handicaps that could .irrq;;air learning (e. g. ,
blindness I hearing loss) were excluded. Children whose primary dif
ficulties were identified as severe Em:)tional disturbances or mental
retardation also were excluded frau the sample.
- 10 -

The self-report itans. The main portion of the interview given to
all the children was the set of self-report items. (other questions
related to attittrles toward school, social class, and social desirability.)
The self-re:port itans were adapted fran previous research of the Institute
_ for Juvenile Research (IJR). 26 To ensure a broad range of behaviors,
the items were selected to be representative of a range of seriousness,
fran very low to rro::ierately high, arrl to include many different types of
acts. Thus, the 29 items ccrnprising the present scale may be grouped
conceptually into seven groups of four each, each group representing a
different type of offense. The groups were formed jtrlgrrentally by
considering roth the results of IJR' s cluster analysis of their i tans ,
and the clusters of offenses suggested by the results of a survey of
juvenile court per~nnel. 27 The clusters suggested by the ~ sets of
data are quite s:imilar, and when particular acts w=re placed into
different categories by the tw;J schanes, the anpirical results of the
IJR analyses were given preference. Appendix A lists the items to which
the subjects resporrled, and the exact -v;ordings and oontext of the items , .
may be obtained fran copies of the interview guide. Each item also is
identified with a code to facilitate easy itan identification in tables
and text. The code consists of the first tw::> letters of the category to
which the item belongs (status acts, miscellaneous acts, drug acts,
alcohol acts, aut:.arobile acts, criminal acts, and violent acts) and a
ntm1ber fran 1 to 4.
Fbr each of the 28 i tans, the youth reported how rnanytirres they
ever had engaged in the behavior, and how many times they had engaged in
that: behavior wi thin the past year. In this paper, attention will be
- 11 -

given only to the fonner. (The past-year data have rot yet been analyzed
fully; alth:::>ugh, prelllriinary analyses have shcMn that past-year data are
less reliable than the ever-have-done data.) Reported frequencies were
recorded exactly as given, up to a rnax.i.nn.:lrn of 99. All responses of 100
or TOC>re, arrl responses to the effect of "all the time~" ''In.m::lreds of
tines," and so on were coded as 99. Responses such as "a feN times" or
"every Tl!:M arrl then" were left blank and considered as missing data.
Although confidentiality had been assured, SCIre children still refused
to provide sane information. When information was refused, data were
treated as missing.
As rrentioI1'2d above, t.pe Qnaha PS children were asked to rate the
seriousness of the itans on this instrurrent, and seriousness is usually
conceptualized as society's reactions to an act, rather than the frequency
of an act I s occurrence in the population. Because it is the children's
behavior which is being €xarnined, and because deviance fran one I s own
and one's peers' nonns is probably of nost salience to a person, it was
felt that ratings frhn the children themselves muld be highly appropriate.
other studies have had seriousness of offenses rated py several dif-
ferent groups, caning to the conclusion that the different rating results
were all highly similar anyway. 28
In this study, it was de:::ided to anchor each sul:ject' s mean seriousness
rating a.rrl variance. A forced distri.b..ltion scaling procedure was used.
'lhe children V'ere instructed to pick the three IIOst serious offenses on
the list a.rrl assign then as. After that 1 the three least serious
offenses were rated with a 1. Ne.'{t, they chose the next five IIOst
- 12 -

serious arrl assigned than a 4, arrl the five remaining least serious
items were given a 2. Finally, the ranain:ing items were to be given. a
rating of 3. Each child, then, assigned ratmgs m a quasi-ronnal
distril:ution with a rrean of 3.
Results
Measure of FrequenSX' The first measure which is considered is the
frequency with which ~ child re:r;orts engagmg m delinquent behavior.
Children re:r;orted the numbers of t.irres they had ever done each act, to a
recorded maximum of 99. But, there is sane reason to doubt the reliability
(arrl thus the validity) of very large numbers which children give m
res:r;onse to such items. large numbers may indicate roastmg and exag
geratmg, guessmg, orapproximatmg. This hypothesis is supp::>rted by
the prep::>nderence of round numbers (endmg mOor 5) for those re:r;orted
frequencies greater than 19.
The statistical effects of large numbers are reducerl by transforming
the re:r;orted numbers into logarithmic equivalents. Other research by
the authors ShCMS that this substantially increases sane rneasures of the
reliability of frequency data. 29 For purposes of this research, then,
all frequenc:Les have been transfonned into logaritbns prior to any
further analyses, according to the followmg fo:rmula:
I..bg' Frequency = IDgarithrn10 (Raw Frequency + 1)
- l3 -

The effect of this transformation is that a report of 0 is unchanged
(lDg10 (0 + 1) := O}. Numl:ers reportoo between 1 a.ril 9 are transfol::l!'ed.
into a range fran .30 to 1.00, and numbers reporte::l between 10 and 99
are transforrred into a range fran 1.04 to 2.00.
Thus, the first measure is actually a rrean log frequency per itan
per category. For each subject, and for each of the seven delinquency
categories, a rrean was detennined fran the frequencies reported for
items in that category, as long as data \'iere given for at least one of
the four items. An overall mean for each subject was then calculated
fran the rr..eaIlS of the seven categories. .A subject's data were considere::1
missing only if he or. she failed to respon::1 to all four items in any
single category. Using this approach, the number of missing data cases
was minimized curl categor~es were w=ighted equally for all subjects I
scores (although single Tt::ems were not). The effective N using this
m::asure is shown in Table 1.
~... :
Inser·i: Table 1 al:x:mt here
The mean log frequency of delinquent acts for children in each of
the samples is sh:Jwn in the first row of Table 2. The rreans for the PC";
Insert Table 2 arout here
groups are .19, equivalent to a reported frequency of approximately .55.
'l1le m::an for the JDs, .50, is equivalent to a reported frequency of
about 2.16 occurrences per item.
- 14 -

For this measure, am for the other measures to be discuSse::1
below, analyses of variance ~e use::1 to test the statistical significance
of the differences between the Qnaha PS group am th:: 3-city PS group.
As Table 2 shows, these rreans are similar for all th:: measures am the
F tests fail to reach values of significance. For all four measures,
the PS groups ~e CXInbined am a test of significance was perfOJ:lt'ed to
see if their c·;:rnbine::1 mean is diffp..:cent fran the mean for the JDs. In
all four cases, the ~s are significant at the .01 level. Clearly, all
four measures smw strong canparability between levels of delinquency in
the Qnaha am 3-city PS groups; am all four show strongly a higher
level of delinquency arrong the adjudicated delinq.lents.
The first three: colUiITU1S of Table 3 display the mean log frequency
of occurrence reported for each of the individual items in the self-
Insert Table 3 about here
report instrument. : REisults are reporte::1 separately for Qnaha PS and the
3-city PS children, arrl for the JD children. The different delinquent
acts are engage::1 in similarly by the Onaha and 3-city groups; the correlation
between the mean item frequencies for the tw::> groups is .90. The JD
mean log frequencies also are significantly correlated with the PS
groups, although not as highly (Onaha PS with JD: r = .45, Elf.. .05; 3-
city PS with JD: r = .62, E L .01).
Measure of Diversity. The second rooasure does not attend to the
reported frequencies for each act, except to distinguish children wh:>
- 15 -

report no experience with an act (a report of 0) fran those who report
any experience (a report of 1 or nore). The intent is to measure heM
many different types of delinquent activity the child en;rages in. A
child who reported a frequency of 1 or nore for any act within a category
was given a count of 1 for the category. Children reporting ro experience
in any of a category's itans (inclwing th,:)se giving missing data) \<.ere
given a count of 0 for the category. Over the seven categories, then, a
child could score experiences in 0 to 7 types of delinquent activity.
Table 2 sOOws how the children score1 on this variable. The PS
children in roth samples average a reported involvement in 3.49 of the
categories. Children in the JD group report experience in a wider
diversity of activities, averaging 5.59.
As was the case with the frequency neasure, the Qnaha arrl 3-city
groups responded to the 28 individual items in a similar fashion. The
correlation between the percent engaging in each activity in the tw::>
groups is .90. Correlations be"b.'ISel1 the JD group and the Onaha group
(E. = .43, E £ .05) arrl between the JD group arrl the 3-city PS group
(E. = .66, E L. .01) are s:imilar to those for the frequency data.
Using roth measures, the nost frequently reported act for the Qnaha
PS children is drinking liquor with permission (ALl), an act admitted by
78.3% of the children, at an average mean log frequency of .676 (corresponding
to a reported frequency of 3. 74 times). The act with greatest frequency
of activity for the 3-city PS children is cheating in school (STl)
- 16 -

( • 527, or a reported frequency of 2.37), although the greatest incidence
is in getting thrown out of class (ST4) (66.2%). For roth PS groups,
the act with the least reported frequency is car theft (CR4), a.rrl the
acts aClmitted by the fewest children are car theft an::1 using psych:x1elics
(DR2). lldjudicaterl deli.nquents show the greatest percentage engaging in
getting suspeIX1erl fran sch::cl (S1'3) (77.0%), am the greatest frequency
in being truant fran sch::cl (ST2) (1. 029, corresponding to a reporterl
frequency of 9.69 tiIres). The least participated-in act (14.5%) and the
act with least frequency (.118, a reported frequency of .31) is stripping
autcm::>bile parts (AU4).
Seriousness Ratings. Table 3 lists the itens in their order of
mean rated seriousness, along with the mean ratings. It is easy to see
that the itens in the drug, violent delinquency, am. crimi.nal delinquency
categories cluster ~t the serious end of the scale, while the status
acts are considererl less serious offenses.
Using these ratmgs, it is possible to examine the relationships
between an act's seriousness, am. its frequency and incidence of occurrence.
These data were examinerl separately for each of the samples am. are
surrmarizerl in Table 4. With all groups, there is a significant negative
Insert Table 4 about here
relationship between seriousness am. extent of activity; the nore serious
an act, the less frequently it is engagerl in am the fewer children \Ylx)
- 17 -

ever engage in it. The correlations are particularly strong tor t.he PS
samples (approxlillately -.80) and marke::Uy less strong for the delinquent
sample (-.40 and -.48).
M=a.sure of Seriousness. The scaled seriousness of each delinquent
act can be used to derive a measure of seriousness of delinquent involve
It!eI1t for each child. The idea behind this measure is that the seriousness
of a child's delinquency can be measured as a function of roth J:x:Jw many
delinquent acts a child ha~ done, and how serious t.h:)se acts are. 'lb
derive this rneasure, a Thurstone scaling procedure was used. Each item
was given a score value equal to its rrean seriousness rating (as shown
in Table 3). lmy child ~ s score on this delinquency measure is the sum
of the mean seriousness ratings for all those acts in which the child
reported any frequency greater than O. Because this measure makes use
of all 28 items in::iividually, any child who had missing information for
any itan was not given a score on this scale. The functional Ns for the
groups are reduced considerably as a result (see Table 1). Although
there are several i ways in which these scores can be based up::>n partial
data and "corrected" in order to reduce the number of missing cases, it
was decided to use only the "pure" cases in this canparative analysis of
the rreasures.
The mean values and starrlard deviations for the three samples are
shown in Table 2. As with the other measures, there is no significant
difference be~ the rreans for the PS groups (17 .56 and 17.26),
although these are significantly different fram the JD rrean (40.42).
- 18 -

M=asure of Progression. The final delinquency rooasure was con
structerl as an Wex of behavioral progression. All 28 itans were
scorerl for each child on the basis of whether the act had been done or
not (reported frequency equal to 0 or greater than 0). The idea was to
identify a series of l:ehaviors (with 00 regard to categories) which had
the c:b.aracteristics of a Guttman scale; Le., any child .... rho had engagerl
in a behavior positione:1 on the scale also had engagerl in each anCl every
behavior positioned at a point lower on the scale. In essence, the
scale IDuld imply that delinquency follows a prerlictab1e course: a
child engages in act "x" first, act "y" second, and so on.
Following the line of reasoning in the introduction, the fo11cminq
criteria were deciderl upon a priori for the construction of a Guti::mc:ll1 , -scale with these items:
1. Ch11y a single dimensional scale IDuld be sought, using and
mixing the itans fran all the delinquency categories.
2. Scales IDUld be deriverl fran the Qnaha PS sample and IDuld .
have to scale on toth the 3-city PS and the 3-city JD samples
with the i tans in the same order.
3. A scale IDuld have to rreet minimal Guttman scaling character
istics (reproducibi1ii;y at least .90 anCl scalability at least
.60) within the Onaha PS sample, anCl IDuld have to m:et tiose
same criterict when app1ierl to each of the other ·twJ samples.
4. The order of the itans within the scale would have to be
it'nnotonic with regard to their nean sca1erl seriousness. 30
- 19 -

Even with 28 items to work with, the criteria described al:x:we
proved jn-possible to meet. The most difficult constraint \vas the third;
no scale could be .identified which net all the other criteria (even
exclu::ling criterion 4) an:1 also net minimal Guttman scale dbaracteristics
~ng the JD sample.
The unid:irrensional scale which fared the best under the given
constraints was canpoSe::l of five items, in this order: drank witlx>ut
permission (AU), was drunk (AL2), used marijuana (DRl) , used a weaIXln
(VI4) , an:1 stole a car (CR4). This is the scale which is reIXlrted in
31 the present paper.
Criteria I ana. 2 were adhered to strictly in wilding scales. It
was felt that the items should rank the sam':! way in all three :i.rrlependent
samples to avoid the unique properties of error in any system. The
proportions of youth ccmnitting an act could be scanned quickly in Table
3 a.rrl, assuming a higl? .d.egree of reprooucibility in a unidirrensional
sense, only thJse items which are m:motonically related in all three
sarrq;>les could be expected to satisfy criterion 2. Thus, many IXlssible
scales were eliminated easily fram consideration.
The best of the scales, like the previous delinquf'.ncy rreasures, was
applied l.rrleperrlently to the three samples. The statistical characteristics
of this scale are shown in Table 5. The coefficient of reproducibility
Insert Table 5 al::out here
- 20 -

(.96 and .S2) and the coefficient of scalability (.81 and .63) are
sa.tisfactori1y high for the PS samples (Qnaha and 3-city, respectively),
but fail to meet criterion stan:lards for the JD group (.84 and .50 for
reprcducibi1ity and scalability). The frequency distributions shcM that
the scale does a pc:x:>r job of discriminating arrong i:h:).se with little
delinquent involvement; approximately 40% of the PS samples fall into
the first scoring category. Discrimination is better in the JD sample,
but, as staterl al::xwe, the results do rot satisfactorily meet the criteria
for a unid:imensional progression (criterion 3, al::cve). The resulting
rre<.lnS and dispersions are sl'x:Mn in Table 2. As with the other rreasures,
the PS results are quite similar (1.16 and 1.15) and differ fran the JD
results (2.67).
Ccrnparison of the measures. Ali:h:)ugh the delinquency m=asures care
fran the same data. base, they have been derived fran different perspectives
on delinquency. The obvious E!t'\Pirical question is whether or not the
use of these different m=asures provides different results and interpre
tatk'ns al:out a child I 5 delinquency. This is examined in three ways:
by intercorre1ating the measures, by examining their .sensitivity, and by
reviewing what the measures reveal al::cut different groups of the children.
The anaha children were given the .self-report instrument tw::> times,
separaterl by a three~ interval. They could thus be scored on each
of the scales tw::> t.imes; the test-1, test-2 correlations are measures of
test-retest reliability. These figures are shown on the diagonal
- 21 -

Insert Table 6 al::out rere
entries of Table 6. These reliabilities are all quite good a"ld esse..."1tially
the same, ranging fran a low of .88 to a high of .93.
The scale soore interoorrelations are also presenterl in Table 6.
The scores are all highly correlaterl within all three samples. The
lo;.;est correlation on the table is bebt.een rrean log frequency arrl number
of categories for the, JD group, .69, irnplying 48% shared variance. The
(X)rrelations go up to .92 (85% shared variance). Further, considering
that the correlation between ~ variables is limited theoretically by
the reliabilities,32 these correlations are indeed high. It may be
concluded fran these results that the relative outcares of scoring
children with these four measures are all aJ::out the same, in all three
samples.
Another way to canpare the scores is by testing their sensitivity
to the differences between the 3-city PS arrl JD samples. It could b=
arguerl that the IIDst sE'J1sitive score is .the one which does the best job
of distll'l.guishing between the PS arrl JDgroups.
one rigorous way in which to rreasure sensitivity is through the use
of the Theory of Signal Detectability (T:3D) ,33 Using the TSD m::x:1el, a
delinquency scale presents data fran whid1 to predict whether a child is
a PS child or a JD child. Any point along a delinquency scale can be
used as a cutoff point: any child with a score below the point is
- 22 -

predicted to be a PS child; and any child al:ove the point is predicted
to be a JD. At each cutoff point, there will be a proportion of delinquents
correctly predicted to be delin:;ruents ("hits"), as well as a proportion
of the PS children predicted to be delinquents (" false alanns "). If the
scale is providing accurate infonnation, given that Jrl children should
be higher in delinquent acts! each point along the scale should yield a
higher proportion of hits than of false alanns.
As an example of a TSD analysis, consider the analysis of the
seriousness scale. The range of scores for the PS and JD samples was
divided arbitrarily into 17 points. considering each point to re a
:'l1toff point for pre:iiction purposes, the proportions of hits and false
alanns were plotted on the axes of a graph as in Figure 1. If the scale
r'psert Figure 1 al:out here
is working well, the proportion of hits will l:e higher than the proportion
of false alanns at any cUtoff point, and the points will describe a
curve al:ove the diagonal. The nnre accurate the predic"l:ion, the s:naller
the false alann rate will l:e at any. level of hits, and the further away
the curve will be fran the diagonal. Thus, the area under the curve can
be taken as a .measure of the sensitivity of this scale in distinguishing
the PS children fran the JD children.
An :important property of the TSD measure of area Ul"'rler the curve is
that it is base-rate invariant. In other words, this m=-.asure of sensitivity
describes the scale regardless of the proportion of delinquents in the
- 23 -

total sample being tested. Many CC'lllI'On measures of sensitivity, which
might be applierl to these data, such as the point-biserial correlation,
w:luld be influenced by the difference in proportions of PS and JD children
in the sample.
The area under the curve measure also has an easy interpretation.
SupfX)se one PS and one JD child \re.Le coosen at rarrlan. With no info:r:mation,
a pre::Uction of which child came fran which sample w:luld be randcrn, with
a .50 chance of being correct. With a scale score for each child, the
prerliction would be that the child with the highest score was the
delinquent. If the scale were w:lrking correctly, the correct prerliction
would exceerl .50; if it worked in the wrong direction, prediction 'WOUld
be below .50. The TSD area measure is equivalent to the probability of
making a correct prediction usin:; these scale scores on any tw:> children
randanly chosen fran the tw:> samples.
The area measure is shJwn for each of the delin:;ruency m=asures in
Table 7. 'Ib derive ithese measures, all 6 points on the unidimensional
Insert T,able 7 arout here
scale (0 through 5) and all 8 points on the number of categories scale
(0 through 7) were used as cutoffs. For the other tw:J scores, 17 ~ly
spacerl cutoff points were coosen. 34 Using this procedure, the seriousness
scale is shcrwn to have the greatest sensitivity with an area treaSUre of
.83. The least sensitive measure is sh::lwn to be the uniclirne..nsional
- 24 -

--,
scale (. 77). The number of categories (.81) and the IreaIi log frequeru,.~
(.80) measures are close secon:1 and third in sensitivity. The differences
arrong the measures are enall, overall.
A final way in which to ca:npare the four rooasures of delinquency is
to examine their use in analyzing delinquent behavior as a function of
sene variables which canronly have proven to be signifie<mt. Many
studies have srown that carm:m sense expectations al:out delinquent
behavior are confinued using self-reports: males report higher rates of
delinquent behavior than do females; and OldE!r chi 1 nrAD report rrore than
- ----35 younger children do. Sc::tre studies also have shown that birth order is
a significant predictor of delinquent behavior. 36
The four treaSures of delinquent behavior were applied to the Qnaha
PS group to examine delinquent invol vernent. as a function of sex, age,
and birth order. The measurenent of self-reported delinquent behavior
in the 3-city sampies, analyzed as a function of dem::>graphic variables,
includirq diagnostic variables related to the presence of learning
disabilities, is of S\lfficient size to warrant an in:1e:pendent report,
aTJd will not be presented in this paper.
Table 8 shows self-reported delinquent ]~vior as a function of
the child's sex. All the measures show significantly greater delinquent
Insert Table B al:cut here
behavior by males than by fe-nales, confL.-ming findings in many previous
studies as ~ll as the general validity of these rooasures.
- 25 -

Previous studies have suggested 'chat delinquent behavior observed
in males is approximately three tines greater than that for fe:nales in
self-report sbrlies, while nost official statistics report a ratio
closer to 5_to_l. 37 Serre recent sttrlies suggest that delinquent behavior
is becaning nore frequent, or at least rrore frequenUy admitted, by
- fatales. 38 The m=asures in Table 8 all show a ratio of male to female
behavior of approximately 3-to-2. In Table 9, the proportion of males
Insert Table 9 al:cut here
admitting to any involvanent in delinquent acts is ccmpareCi to the
proportion of fanales admitting any involvarent. Data are presented
separately for the seven categories o:E delinquent acts sttrlied. A rrean
proportion was derived for each sex for the foUJ~' itans in each category,
and the mean for males· was divided by the mean for fatales. The table
suggests that the ratio bf male to fe:nale involvement in delinquent acts
is al:cut 1.5 (3-to-2), except in the rrore serious offense categories of
crllninal arrl violent 'acts where the ratios are 2.36 a.rrl 4.71, respectively.
Table 10 st.Jr[('[I.arizes delinquency as a function of age. As expected,
age is srown to be a significant variable with all neasures. HcMever,
Insert Table 10 a.1:out hare
while the mean log frequency a.rrl seriousness scales :increase nonotonically
with age, the other tv;o measures decline sanewhat be~ ages 14 a.rrl
15. This suggests that children at age 15 may not be engaging in many
- 26 -

new delinquency activities, rut may be performing nore frequent ani/or
nore serious behaviors of the same kin1s in which they previously engaged.
If this could be confirmed, it \\CUld be evidence that the different
orientation of these measures is Meed useful despite their high
intercorrelations. NJ empirical check on this hypothesis is possible
with presently available data.
Finally, Table 11 sh::Jws the relationship between delinquent behavior
IIisert Table 11 al::x:mt here
ani birth order. T'ne high variability in the seriousness measure
obscures the differenc~s arrong the group means, while the other three
measures yield statistically significant differences. All the measures . show less delinquent activity arrong only children and first-born, while
middle arrl youngest children show nore delinquent behavior; rut there
are no strong differences within these su.1::x3roups.
Discussion
This research explored four different methcxls of using self-report
data to derive measures of delinquent activity. Although the results
carre fran the same data base, the four measures Were derived in different
marUlers to reflect four different perspectives on delipquent behavior:
frequency of delinquent activity; diversity of behavior; seriousness of
- 27 -

behavior; arrl th3 degree of progression of the behavior. Correlations
revealed that the measures are highly related, ani all have high test
retest reliabilities.
'I!he general conclusion fran this research is that the rreasures tend
to be highly redurrlant. There is no clear arrl consistent evidence that
anyone of the m=asures is better than the other three. There is sore
irrlication that the m=asures nay, in fact, lead to different ronclusions
in sane analyses~ oo,t there is no way to check in the present study
whether those differences are due to -v.eaknesses :in the rreasures or to
true differences in behaviors.
While the seriousness rreasure has the greatest sensitivity :in
distinguishing between .PS arrl JD children in the major sample, it fails
to result in significant differences arrong the Onaha children in the
birth order analysis. The other variables also do not consistently show
the sarre pattern of differences on all analyses.
'I!he research doeis establish a strong negative correlation between
rated seriousness of offenses arrl their frequency of occurrence. This
gives support to the use of frequency neasures in deriving delinquency
scales which purport to rreasure seriousness of behavior. Using simple
linear regression, it can be sh:Mn, h:Jwever, that SCIre behaviors are
reported rrore frequently than their rated seriousness \\Ould lead one to
expect. The acts which are exceptions to the general relationship
(i.e., tlnse for which the errors of prediction pre greatest) may well
vary fran sample to sample • On the other han:1, if the frequency-seriousness
- 28 -

discrepancy were consistent for sane behaviors, the exclusion of thos(~
acts fran self-report scales probably w::mld make frequency-derived
seriousness irrlices nore valid.
Another result of this research has been to confinn the difficulty
in getting self-report items to scale into unidimensional progression!s.
It was suggested that Gltbnan scales should be validated on irrlependent
samples. The present research sh:Jws that while scales can be derived
and validated using the PS samples, it is :i.Irq;lossible to firrl a scale of
items which maintains sufficient reproducibility and scalability when
applied to the sample of adjtrlicated delinquents.
Finally, this research confinns once again that self-report instrurrents
can be used to meaSure delinquent activity. These scales can detect
differences in delinquent behavior arrong distinct groups of children and
as a function of demo9raphic variables. The present research yields
info:rmation al:xJut specific types of delinquent activity in which there
appear to be especially wide sex differences . .
The reliability, validity, and usefulness of self-report data have,
by nr::M, been established sufficiently in the research literature. It is
now appropriate to explore the nore subtle questions of using this
info:rmation to derive the nost accurate and sensitive measures possible.
- 29 -
--"

Footz'l.otes
~s research was supported in part by Grants Nunl:::ers 76-NI-99-0133, 76-JN-99-0022, and 76-JN-99-0022S1 fran the National Institute for Juvenile Justice and l)'~~,~ency Prevention, Law Enforcement Assistance Administration, U. S. Dt:!pa.rt:rcent of Justice. Points of view or opinions in this paper are those of the authors and do not represent the official position or policies of the U. S. Department of Justice or Creighton University. FUrther information and dOCl1l1'el1tation relating to this research may be obta.ine:l fran the autmrs at the National Center for state Courts, 300 Newport Avenue, Williamsburg, VA. 23185.
2The authors wish to acknowledge the contributions made to this research by rnanbers of the Creighton Institute staff, particularly by cassie Spohn, Betty Bullock and caren Randleman wh:> helped in the data collection in Qnaha.
3L. T • Empey & M.L .. Erickson, IlHidden Delinquency and Social Status, II Social Forces, 44, (1966), 546-554. Also see M.L. Erickson, "Th: Changing Relationship Betw=en Official and Self-reported Measures of Delinquency: An Exploratory-Predictive Stooy, II Journal of Criminal Law, Crllninology and Police Science, 63 (1972), 388-395, and J. Blackm:Jre, liThe Relationship Between Self-reported Delinquency and Official Statistics AnDngst Adolescent Boys,1I British Journal of Crimi.nology, 14 (1974), 172-176.
4L•D. Savitz & L~ Rosen, City Life and Delinquency - Victimization, Fear of Cr.ime, and Gang M:!nbership, 1977, National Institute of Juvenile Justice and Delinquency Prevention, Office of Juvenile Justice and Delinquency Prevention, Law Enforcenent Assistance Mministration, Depa.rt:rcent of Justice i p. 4 .
5See discussion in D.S. Elliot & H."L. Voss, Delinquency and Dropout, (lexington, M3.ss.: lexington Books, 1974); Ei"rpey and Erickson (note 3); R.A. Dentler & L.J • .M:::ore, IlSocial COrrelates of Early Adolescent Theft, II American Sociological Review, 26 (1961), 733-743; D.P. Farrington, IlSelf-reports of Deviant Behavior: Predictive and Stable?1I Journal of Criminal Law and Criminology, 64 (1973), 99-110; R.H. Hardt & S. PetersonHardt, "en Detenn:i.ning the Q.lality of the Delinquency Self-report M9thod, II Journal of Research in Crime and Delinquency, 14 (1977), 247-261. The authors are preparing a report on test-retest reliability of self-report neasures using the CInaha ~lic school sanple. The results will be presented in a separate dOCl1l1'el1t and may be obtained fran the authors at the cost of duplication and postage.
6R•A• Dentler, 1962 unpublished paper cited by R.D. Wirt & P.F. Briggs, lI'!he M9aning of Delinquency," ed. H.C. Quay, Juvenile Delinquency: Research and Theory. (Princeton: Van NorstJ:and, 1965).
7F .1. Nye & J.F. Short, IIScaling Delinquent Behavior, II Arrerican Sociological Review, 22, (1957), 326-331.
8 For example, see Empey & Erickson (rote 3).
- 30 -

9Hardt am Peterson-Hardt (note 5).
l°See T. Sellin & M.E. W::>lfgang, The ~suranent of Delinquencyr (New York: Wiley, 1964), an::1 A.S. Berger, "The Construction am Interpretation of a General M:.~sure of Delinquency," (Chicago: Institute for Juvenile Research, 1975), unpublished draft cited with pennission of the auth:>r.
l~r example, Nye & ~1b:>rt (note 7).
l2As an exarrple, see J. F • Scott, "~Dimensions of Deli.n:;Iuent Behavior," Arrerican Sociological Review, 24 (1959), 240-243, mo suggests the need for two dirrensions. Also see Dentler and Mx>re (rote 5) who discuss four dimensions.
13The auth:>rs told the opinion that dirrensionality probably \\OUld be established best by using multidimensional scaling to analyze people IS
perceptions ab:mt the similarities and differences arrong different types of delinquent activities.
l4See E11i~t arx1 yoss (note 5) page 104, note 4 and Dentler & M:x:>re (note 5), and W.R. Arnold, "Cbntinuities in Research: Scaling Delinquent Behavior, II Social Problans, 13 (1965), 59-66; and Berger (note 10).
l5R.L • Gordon, Unidimensional Scaling of Social Variables: Cbncepts and Procedures. (New York: MacMillan Publishing Co., 1977), p. 123.
16Tnis ou~ame is readily possible and not one mich investigators would tem to look for in their trial and error manipulations.
17 Arnold (note 14)·.
l8Consider also that the theoretical upper l:x:>urrls of these correlations are restricted by the scales I reliabilities.
19E1liot & Voss (note 5), p. 104, rote 5.
20Elliot & Voss (note 5), p. 63.
2lSee Berger (note 10).
22Sellen & w::>lfgCID3" (note 10).
23Berger (note 10).
24The canplete interview guide is available on request fran the authors at the cost of duplication and postage.
25These data are being prepared for FUblication. See note 5.
26 'I __ .:1 I' , al J .W.C. Johnstone, The Fanu. y C1lA.4 De mquency: A Reapprcus , 1976, unpublished draft cited. with pennission of the author arx1 the Institute for Juvenile Research.
- 31 -

27L•E• Cohen, Pre-crlju::licatory Detention in Three Juvenile Courts: An Empirical Analysis Qf tie Factors Related to Detention Decision Qltcane, Analytic Report SD-AR-8, u.s. Depart:rcent. of Justice, Law Enforcenent Assistance Mministration, National Cr:iminal Justice Infonnation Statistics Service, 1975.
28Sellin & W:)lfgan;, p. 268 (oote 10).
29See note 25.
3°That is, each itan in a scale was requir.·e::1 to have a rrean seriousness rating higher than all the prior itans in the .scale. Criterion 4 was incltrled because it was felt that a progression into delinquent behavior is irrport>1>nt only if successive bahaviors are nore serious than previous behaviors.
31lt is w:>rth noting I ~er, that three other sc..ues \\Ere identifie::1 which were fairly good. A second scale differed fran the first only in that its fifth itan was different: used uppers (DR4). This scale net all the same criteria as the first, rut had slightly lower cc..-efficients of reproducibility am scalability" Like the first scale, these met the minimal standards for the PS group:s, l:ut failed. to achieve the standards for the JD group.
Tv.u scales were identified which failed. to satisfy criterion 4, rut which met Guttman starrlards for reproducibility an::l scalability for the PS groups, am failooi;o meet th:>se stan::lards for the JD sample. These scales shared. the sarre first three items as the b;o scales already rrentione::1. The fourth itan for roth was took m:mey with force (CR3). The scales differed in their fifth items: stole a car (CR4), am used uppers (DR4).
32The max~ cor.relation between x and y theoretically is:
" Ir, Ir r ~-max = xx yy
33For a summary of TSD an::l its application to the pred.iction of delinquency, see D.M. Fergusson, J.K. Fifield & S.W. Slater, "Signal Detectability Theory an::l the Evaluation of Prediction Tables," Journal of Crime am Delinquency, 14 (1977), 237-246.
34Both scales happened to. divide equally into 17 intervals. 'Nr:f n\mlber of intervals nay be uS€rl for the analysis; the nore that are use:3., the nore exact the final result.
35Elliot & Voss (note 5), Dentler & M:ore (note 5), and M.L. Erickson & W.B. Smith, Jr. "Ch the Relationship Between Self-reported am Actual Deviance: An Bnpirical Test,," Hurnl:::oldt Journal of Social Relations, 2 (1974), 106-113 .•
36Dentler & Moore (note 5).
- 32 -

37 See Elliot & Voss (note 5).
38See Berger (note 10).
, .
- 33 -

Figure Captions
Figure 1. TSD CUrve for Seriousness Scale
- 34 -

Table 1
Effective Sarrple Sizes (N) for Delinquency M:asures
CPS
Full Sample 161
Mean log Frequency 161
Number of Categories 161
Seriousness Scale 155
Unidimensional Scale 161
OPS . = Onaha Public Sch:>Ol 3PS '=' 3-City Public School 3JD . = 3-City Del:inquents
- 35 -
3PS 3JD
1,030 665
1,004 652
1,030 665
947 536
1,030 665

Mean Log Frequency
Number of Categories
Seriousness Scale
Unidimensional, Scale
Table 2
Delinquency Measures Scaling Characteristics
OPS 3PS
~ .19 .19 S.D. .19 .20
~an 3.49 . 3.49 S.D. 1.75 1.80
Mean 17.56 17.26 S.D. 13.95 14.06
M3an 1.16 1.15 S.D. 1.20 1.28
OPS :::: Qnaha Public School 3PS = 3-city Puplic SChool 3JD = 3-city Delinquents
F 3JD OPS v.-3PS
.50 .000
.34 NS
5.59 .000 1.64 NS
40.42 .047 19.59 NS
2.67 .008 1.50 NS
CPS = Ccrnbined (Quaha + 3-City) Public School
- 36 -
F CPS v-: 3JD D.F.
636.78 1,1817 E ~.Ol
621.88 1,1853 12. ~.01
746.08 1,1635 E o£.01
538.04 1,1853 R. "-.01

Table 3
Self-report Item Characteristics
Item M:an log Freq. % Ever Ccmni. ttms Rated Code OPS 3PS 3JD OPS 3PS 3JD Seriousness
ALl .676 .423 .427 78.3 52.0 42.9 1.47 ST4 .379 .527 .587 54.7 66.2 61.8 1. 74 ST1 .596 .536 .592 68.9 57.6 56.7 1.7~ ST2 .243 .295 1.029 36.6 36.6 73.8 1.94 MIl .395 .332 .503 50.9 36.6 45.9 2.22 MI2 .352 .333 .774 45.3 45.8 68.6 2.62 AUl .183 , .190 .687 28.0 21.8 58.3 2.64 1lli2 .454 .445 1.128 52.2 46.4 73.5 2.68 ST3 .006 .155 .622 1.9 28.0 77.0 2.70 AIA .149 .• 070 .476 16.8 8.4 39.8 2.74 MI3 .279 .228 .593 39.1 36.2 60.5 2.78 VI3 .104 .140 .406 21.1 23.9 48.6 2.80 AIJ .288 .232 .794 38.5 27.3 62.7 2.92 Am .011 : .027 ' .264 2.5 4.1 37.9 3.04 MI4 .394 .242 .365 53.4 34.4 43.3 3.08 AU4 .029 .021 .118 5.0 3.8 14.0 3.14 AU2 .073 .062 .224 13.0 8.2 28.3 3.19 VI2 .165 .298 .610 18.0 31.0 54.4 3.23 VII .067 .128 .349 16.1 23.7 51.6 3.34 CR3 .090 .068 .174 13 • ..1 10.3 22.1 3.36 CRl .058 .060 .570 9.3 10.0 59.8 3.46 DRl .188 .257 1.092 16.8 ;'3.5 64.1 3.56 VI4 .050 .096 .299 8.1 16.0 40.0 3.72 CR4 .002 .013 .191 0.6 1.9 26.9 3.77 DR3 .017 .028 .350 2.5 3.1 28.3 3.83 DR4 .021 .032 .338 4.3 3.3 27.8 4.05 CR2 .023 .042 .432 5.6 7.4 53.2 4.08 DR2 .008 .020 .226 1.9 1.7 20.6 4.31
OPS = Qnaha Public Sch::>ol 3PS = 3-City Public Scr:001 3JD = 3-City Delinquents
\,1
- 37 -

---.
Tcilile 4
Correlations with Rated Seriousness
Group/Variable
Onaha Public SChool M::an IDg Frequency of .Act Percent Ever [bing .Act
3-City Public School M::an IDg Frequency of .Act· Percent Ever [bing .Act;
3-City Delinquents M=an Log Frequency of .Act Percent Ever [bing .Act
N=28 items for all correlations * p L. .05
** E. L .01
- 38 -
COrrelation
-.79** -.81**
-.80** -.82**
-.40* -.48**

Table 5
Unidimensional Offenses Scale Characteristics
Scale Statistics:
COefficient of Reproducibility Mini:mum Marginal Reprcxlucibility Cbefficient of Scalability
Score Frequencies:
Score = 0 1 4 3
·4 5
!
f
65 37 34 19
5 1
161
OPS = Onaha Public School 3PS = 3-city Public School 3JD = 3-City De1.:inq\.lents
OPS
.96
.78
.81
%
40 23 21 12
3 1
100
- 39 :-
3PS
.92
.77
.63
f % f
447 43 74 230 22 83 165 16 118 137 13 180
40 4 132 11 1 78
1030 99 665
3JD
.84
.67
.50
%
11 12 18 27 20 12
100
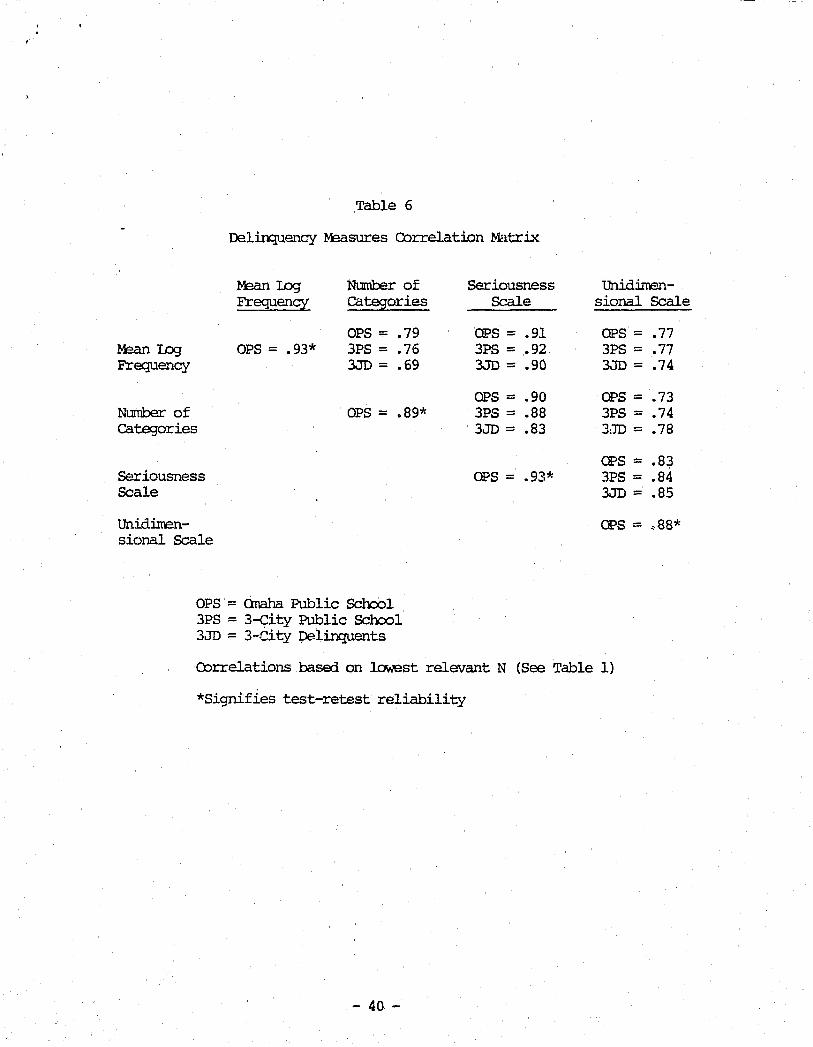
Table 6
Delinquency M:asures Correlation Ma:trix
Number of categories
Seriousness Scale
Unidirre.nsional Scale
M:an IDg Frequency
oPS= .93*
NL1mber of cate:gories
CPS = .79 3PS = .76 3JD = .69
OPS = .89*
oPS == Onaha Public School 3PS == 3-City Public School 3JD == 3-City pelinquents
Seriousness Scale
CPS == .91 3PS == .92 3JD == .90
CPS == .90 3PS == .88 3JD == .83
CPS == .93*
Unidirre.nsional Scale
CPS == .77 3PS == .77 3JD==.74
CPS == .73 3PS == .74 3JD == .78
CPS :::: .83 3PS == .84 3JD :::: .85
CPS == .. 88*
Correlations baserl on l~st relevant N (See Table 1)
*Signifies test-retest reliability
- 40 -

Table 7
TSD Sensitivity M:asures of the Four Del:i.rx;Iuency Mea.sures
Number of categories
Seriousness Scale
UnidimensioriaJ. Scale
- 41 -
Area
.80
.81
.83
.77

Table 8
Sex Q:nq?a.risons on Delinquency ~sures for the Qnaha Public Sch:::lol Children
M=an S.D. N F D.F.
~ I.og Males .22 .18 82 5.70 1,159 Frequency Females .15 .19 79 t: L. 05
Number of Mlies 3.98 1.67 82 13.92 1,159 Categories Fenales 2.99 1.69 79 E. ".01
Seriousness Males 21.20 14.85 81 12.36 1,153 Scale Fanales 13.58 11.75 74 P ".01
Unid:imcnsiona1 Males 1.37 1.27 82 4.94 1,159 Scale Females .95 1.10 79 t: ".05
- 42 -

Table 9
Ratio of Percents of M3.le~ to Fe:na.les Admitting Carrnission of At:::ts within Each Delinquency category
category
Status At:::ts Miscellaneous At:::ts Drug Acts Alcoool-Related Acts Auto-Related Acts Criminal Acts Violent Acts
Mean Percents M3.le to Fe:na.le Ratio
1.32 1.52 1.51 1.23 1.83 2.36 4.70
N:>te -- These data are for Qnaha Public School sanple
- 43 -

Table 10
h;]e Q:mparisons on Delinquency Measures for the Qtlaha Public School Children
h;]e ~ S.D. N F D.F.
12 .11 .19 33 7.72 3,157 Mean IDg 13 .16 .13 65 E.-L.Ol Frequency 14 .26 .22 50
l5 .32 .30 13
12 2.85 1.48 33 2.83 3,157 Number-of 13 3.42 1.62 65 E. "'.05 categories 14 ,3.94 1.93 50
15 3.77 1.88 13
12 12.07 8.76 32 3.12 3,151 SerioilSheSS 13 16.94 12.78 61 E. L.05 Scale 14 20.70 15.25 49
15 2i.17 20.13 13 j :
12 .58 .83 33 5.70 3,157 Unidill:ensional 13 -1.06 1.06 65 p L.01 Scale l4 1.60 1.32 50
15 1.46 1.56 13
- 44 -

Table 11
Birth Order Ccrrparisons on Delinquency M=a.sures for the Qraha Public School Children
Birth Order M=an S.D. N F D.F.
Only .13 .04 4 2.80 3,157 Mean Log Oldest .12 .14 39 E £.05 Frequency Middle .23 .23 51
YoUngest .20 .18 67
cnJ,y 3.50 1.00 4 3.16 3,157 l'lI.lrn}y:>-r of Oldest 2.77 1.65 39 I? L.05 categories Middle 3.82 1.85 51
YoUngest 3.66 1.67 67
cniy 16.65 8.06 4 1.98 3,151 Seriousness Oldest 12.79 12.98 37 N.S. Scale Middle 19.34 14.80 48
Youngest 19.00 13.74 66
cnly .75 .50 4 4.17 3,157 Unidimensional Oldest .62 .82 39 E. L.01 Scale Middle 1.29 1.28 51
YoUngest 1.40 1.27 67
- 45 -

>-u Z w :::» 0 z --' w c u.. 0 IV) V; z .... 05: - --.... u -c w 0:: ~
.... u w 0:: 0:: 0 u
.90
.80
.70
.60
. 50
.40
.30
.20
.10
AREA=.83
.10 .20 .30 .40 .50 .60 .70 .80 .90
FALSE PREDICTIONS OF DELINQUENCY
(FALSE ALARMS)
- 46 -

APPENDIX A
Self-Report Itans arrl Itan Codes
Itan Code Status Acts
STI
ST2
ST3 ST4
l,uscellaneous Acts MIl
MI2 MI3
MI4
Drug Acts DRl DR2 DR3
DR4
Alcohol Acts ALJ.
AL2
AL3 AIA
Auto Acts AUl AU2 AU3
AU4
Criminal Acts CRl
CR2
CR3
CR4
Itan
(lbw many times have you ever) cheated on an exam in sclxlol or turned in \>,Ork that was not your CMn.?
Stayerl away fran sch:::>Dl for at least part of the day because you wanterl to?
Been suspended fran sclxlol? Been thrown out of class py a teacher?
Taken things that didn I t cost too much fran h:me or sclxlol without pel:miss ion ?
Taken sarethin::J small fran a store? Kept or used sarething that yOt:l knew had
reen stolen? Deliberately damaged private o~ public property?
Used marijuana or hashish (grass, pot, hash)? Used LSD, rrescaline, or other psyc:oodelics? Used downers or barbituates (without a
prescription)? Used r-Ethedrine (speed) or othe:c uppers or
amphetamines (wi thout. a pr~~scr iption) ? " I
,
Drank reer, wine, or liquor wi tJl1 parent's permission? -1-
Drank beer, wine, or liquor witknut -1--parent's permission? i Been drunk? I
Bought l::eer, wine, or liquor?
Driven a car on the streets by iyourself? Driven a car too fast or recklE~ssly? Ridden arourrl in a car that wal!) stolen
for the ride? ! Stripperi sareone else's car ofl parts to
use or sell?
Taken at least $20 or sarething w:)rth $20 that did not l:elong to you?
Broken into saneone' s fane or a store, or sara other place in order to steal sanething?
Used force or threatenerl to use force to get llOney fran cmother person?
Stole>.l1 a car?
- 47 -

· Violent Acts VIl
VI2
VI3 VI4
Had a fist fight in Which someone got hurt badly enough to go to a doctor or oospital?
carrierl a weapon like a gun, knife, or razor in case you had to use it against.another person?
Taken part in a gang fight? Used a weapon like a brick, knife, or
razor in a fight?
- 48 -

