“if we cannot mine safely, we will not mine” filetelephone: +27 (0) 11 562 9700 facsimile: +27...
TRANSCRIPT

Gold Fields: Agnew Gold Mine – Technical Short Form Report 2011 1
Registered Office South Africa:150 Helen RoadSandownSandton, 2196 JohannesburgGautengPrivate Bag X30500Houghton, 2041 South Africa
Website: http://www.goldfields.co.za Telephone: +27 (0) 11 562 9700Facsimile: +27 (0) 11 562 9838
“If we cannot mine safely, we will not mine”
Gold Fields Safety Value

2
Agnew Gold MineTechnical Short Form Report31 December 2011
Gold Fields: Agnew Gold Mine – Technical Short Form Report 2011 3
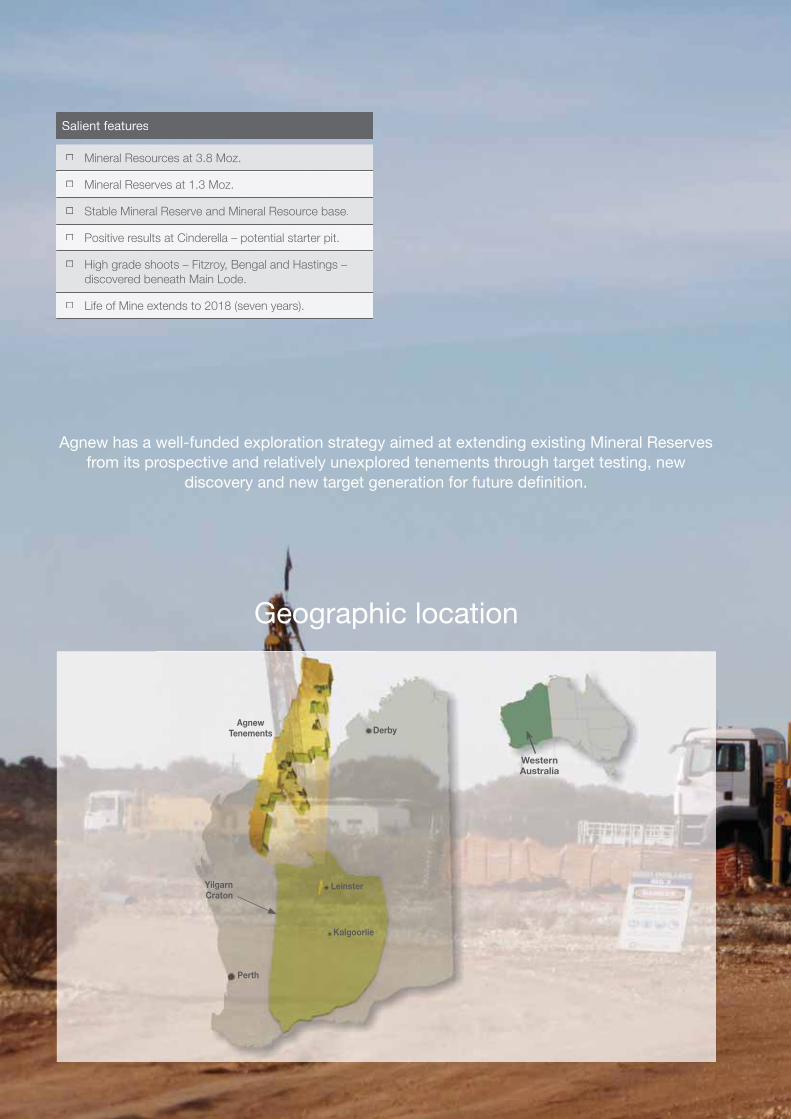
Salient features
� Mineral Resources at 3.8 Moz.
� Mineral Reserves at 1.3 Moz.
� Stable Mineral Reserve and Mineral Resource base.
� Positive results at Cinderella – potential starter pit.
� High grade shoots – Fitzroy, Bengal and Hastings –
discovered beneath Main Lode.
� Life of Mine extends to 2018 (seven years).
Agnew has a well-funded exploration strategy aimed at extending existing Mineral Reserves from its prospective and relatively unexplored tenements through target testing, new
discovery and new target generation for future definition.
Geographic location
Yilgarn
Craton
Perth
Kalgoorlie
Leinster
DerbyAgnew
Tenements
Western
Australia

Geographic location IFC
1. Overview Page 1
2. Key aspects Page 2
3. Operating statistics Page 3
4. Geological setting and mineralisation Page 4
5. Mining Page 6
6. Projects Page 7
7. Mineral processing Page 7
8. Sustainable development Page 8
9. Mineral Resources and Mineral Reserves Page 9
10. Regulatory codes Page 13
11. Competent Persons Page 13
12. Key technical staff Page 14
13. Brief history Page 17
Res
ourc
e co
nver
sion
dril
ling,
War
oong
a C
omp
lex,
Agn
ew
1. OverviewThe Agnew Gold Mining Company Pty
Limited is wholly owned by Gold Fields
Limited and currently holds tenements
covering an area of approximately
68,138 hectares. Agnew is located some
375 kilometres north of Kalgoorlie in the
same geological region as St Ives Gold
Mine, and exploits shear-hosted auriferous
zones from the highly mineralised
Norseman-Wiluna Greenstone Belt.
Agnew represents a solid base for Gold
Fields’ growth in the region and is an
important contributor to the stated vision,
“To be the global leader in sustainable gold
mining”, with a target contribution from the
Australasia Region of ~1.0 Moz per annum
by 2015 in production or development.
Main strategic aims for the company are the
discovery of additional Mineral Reserve
sources to supplement Waroonga in the
short term and the discovery of a significant
new ore complex to replace Waroonga in
the medium to long term.
Reported Mineral Reserves at Agnew were
maintained at 1.3 Moz from December 2010
to December 2011, including the impact of
depletion at 224 koz, indicating an effective
increase of 205 koz. Changes from
December 2010 were dominated by
extensions to the main ore body at the
Waroonga Underground Complex and the
impact of higher gold price assumptions for
the December 2011 statement.
This Technical Short Form Report reflects
the latest Life of Mine plan input parameters,
coupled with an updated Mineral Resource
and Mineral Reserve statement as at
31 December 2011. All Mineral Resource
and Mineral Reserve figures reported
are managed unless otherwise stated
and Mineral Resources are inclusive of
Mineral Reserves.
Note: For abbreviations refer to page 28 and for glossary of terms refer to page 29 – “Mineral Resources and Mineral Reserves Overview 2011”.
1
Cover image:
CIP processing plant, Agnew Gold Mine
Gold Fields: Agnew Gold Mine – Technical Short Form Report 2011 2
2. Key aspects
Independent audit Figures reported in this declaration are as reviewed by independent external consultants as at
31 December 2011 [Optiro Pty Ltd for Mineral Resources and AMC Consultants (Pty) Ltd for Mineral
Reserves]. Gold Fields has been informed that the audit identified no material shortcomings in any
process by which the Agnew Mineral Resources and Mineral Reserves were evaluated
Prepared by Gold Fields Limited in compliance with the SAMREC Code (2007 edition)
Effective date 31 December 2011
Source of information This Technical Statement is a summary of the detailed internally sourced document entitled December 2011 Agnew Competent Persons Report
Personal inspection Personal inspection is conducted by the Competent Persons as listed, who are full-time employees of
Gold Fields Limited
General location Agnew is situated at latitude 27° 55’ S and longitude 120° 42’ E in the Norseman-Wiluna Greenstone
Belt, 23 kilometres west of the town of Leinster in Western Australia, which is approximately 1,100
kilometres north east of Perth. Well-established power, access roads and supporting infrastructure are
in place
Licence status and
holdings
The Agnew Gold Mining Company Pty Limited (AGMC), ACN 098-385-883, was incorporated in
Australia in 2001 as the legal entity holding and conducting mining activity on the Agnew mineral
leases. The Gold Fields Limited group holds 100% of the issued shares of AGMC through its 100%
holding in the issued shares of Orogen Holding (BVI) Limited. Agnew controls exploration and mineral
rights over a total area of 68,138 hectares (total of granted tenements) and has security of tenure for
all current exploration and mining leases that contribute to future Mineral Reserves
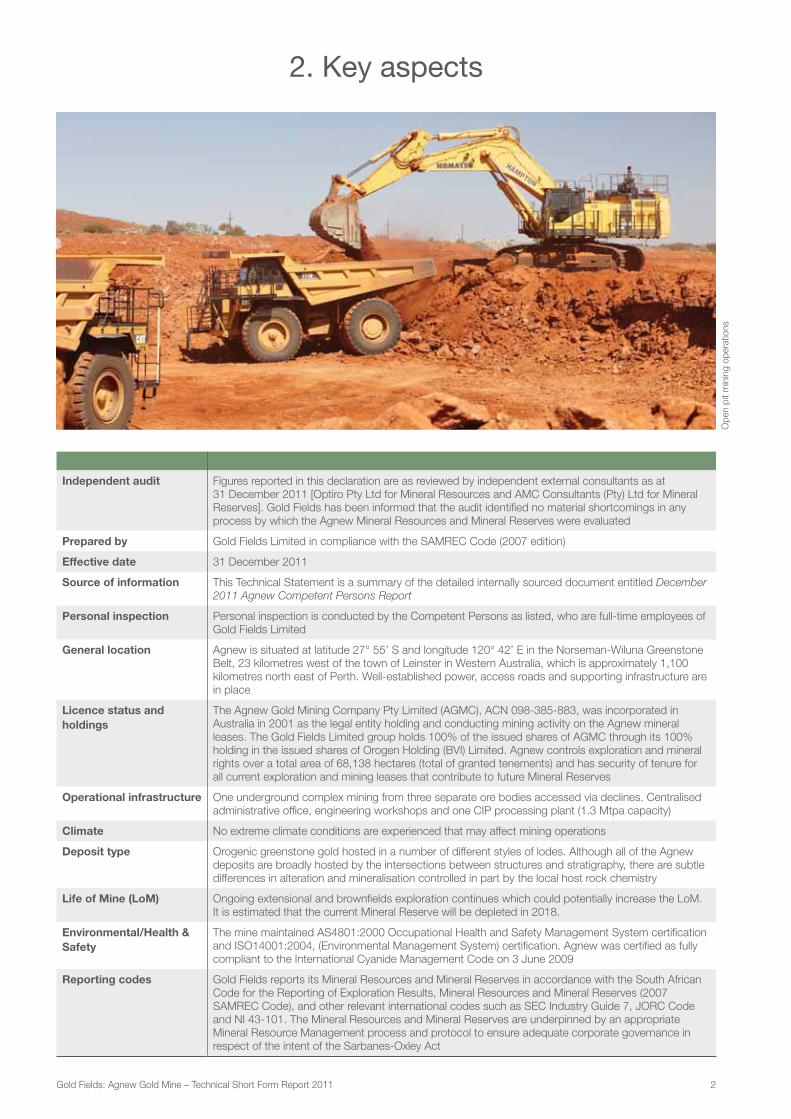
Operational infrastructure One underground complex mining from three separate ore bodies accessed via declines. Centralised
administrative office, engineering workshops and one CIP processing plant (1.3 Mtpa capacity)
Climate No extreme climate conditions are experienced that may affect mining operations
Deposit type Orogenic greenstone gold hosted in a number of different styles of lodes. Although all of the Agnew
deposits are broadly hosted by the intersections between structures and stratigraphy, there are subtle
differences in alteration and mineralisation controlled in part by the local host rock chemistry
Life of Mine (LoM) Ongoing extensional and brownfields exploration continues which could potentially increase the LoM.
It is estimated that the current Mineral Reserve will be depleted in 2018.
Environmental/Health &
Safety
The mine maintained AS4801:2000 Occupational Health and Safety Management System certification
and ISO14001:2004, (Environmental Management System) certification. Agnew was certified as fully
compliant to the International Cyanide Management Code on 3 June 2009
Reporting codes Gold Fields reports its Mineral Resources and Mineral Reserves in accordance with the South African
Code for the Reporting of Exploration Results, Mineral Resources and Mineral Reserves (2007
SAMREC Code), and other relevant international codes such as SEC Industry Guide 7, JORC Code
and NI 43-101. The Mineral Resources and Mineral Reserves are underpinned by an appropriate
Mineral Resource Management process and protocol to ensure adequate corporate governance in
respect of the intent of the Sarbanes-Oxley Act
Op
en p
it m
inin
g o
pera
tio
ns

3
3. Operating statistics
UnitsDec
2011
Dec20101
June2010
June2009
June2008
Open pit mining
Total mined kt 1,610 – – – 393
– Waste mined kt 1,024 – – – 191
– Ore mined kt 586 – – – 202
Mined grade g/t 1.6 – – – 3.2
Strip ratio (tonnes) waste : ore 2.1 – – – 1.0
Underground mining
Ore mined kt 621 312 581 737 505
Mined grade g/t 9.7 8.4 8.9 7.9 9.3
Processing
– Mill tonnes kt 935 417 883 1,066 1,315
– Mill head grade g/t 7.0 6.5 6.2 5.8 5.3
– Yield g/t 6.5 5.9 5.8 5.6 4.8
– Plant recovery factor % 94.0 93.7 93.4 92.6 92.9
Gold produced
– Milling koz 194 80 165 192 204
– Heap leach koz N/A N/A N/A N/A N/A
Total gold producedkoz 194 80 165 192 204
kg 6,035 2,258 4,685 5,253 5,873
Gold sold oz 194 80 165 192 204
Financials
Operating cost A$/oz 692 680 614 526 452
Total cash costA$/oz 675 662 611 541 496
US$/oz 696 621 539 401 445
Capital expenditure A$ million 71.8 26.6 62.6 41.6 37.0
Notional cash expenditure
(NCE)
A$/oz 1,062 1,013 992 743 632
US$/oz 1,096 951 875 550 567
General
Employees (TEC) number 440 364 375 343 314
Mineral Reserves Mt 7.1 6.9 6.7 2.9 2.5
Mineral Reserve Head Grade g/t 5.7 6.0 5.7 7.7 7.7
Mineral Reserves Moz 1.3 1.3 1.2 0.7 0.6
Expected Life of Mine years 7 7 7 4 3
1Figures shown represent the six months to 31 December 2010. Rounding off of figures presented in this report may result in minor computational discrepancies. Where this occurs it is not deemed significant.
Ag
new
CIP
pla
nt
co
mp
lex

Gold Fields: Agnew Gold Mine – Technical Short Form Report 2011 4
In comparison to other greenstone belts in the Yilgarn Craton, the Norseman-Wiluna
Greenstone Belt is highly mineralised, particularly in gold and nickel.
4
Agnew is situated in the northern portion of the Norseman-
Wiluna Greenstone Belt, which is part of the Yilgarn Craton,
a 2.6 Ga granite greenstone terrain in Western Australia.
The rock types in the belt comprise abundant tholeiitic
and komatiitic volcanic rocks, chert, sulphidic and albitic
sedimentary rocks, and a chain of discrete felsic volcanic
centres.
The greenstones of the Agnew area have been
metamorphosed to upper greenschist, lower amphibolite
metamorphic grades. Gold mineralisation is found in quartz
breccia lodes, quartz tensional veining and disseminated
arsenopyrite-pyrite-biotite mineralisation developed along the
lithological contact between a sandstone and ultramafic
conglomerate and on other contacts within the ultramafic
conglomerates package. High-grade ore shoots plunge
steeply to the north along these contacts. The controls on
mineralisation are dilational zones at the intersection of
steeply dipping N-S axial planar structures with the
stratigraphy. The stronger the contrast in rock competency in
these zones, the greater is the potential for mineralisation.
Much of the Yilgarn Craton is deeply weathered and partially
covered by Tertiary and Quaternary regolith. Pre-Tertiary
lateritic horizons are variably exposed, stripped or buried by
later deposits that have in turn been lateritised. The depth of
weathering is strongly controlled by original rock types, with
mafic rocks generally being more susceptible to weathering
than felsic rocks.
Local geology
The Agnew-Wiluna section of the Norseman-Wiluna
Greenstone Belt is bounded by large granitoid bodies and the
Ida fault to the west. The Ida fault, locally termed the Waroonga
shear, is a major regional scale shear zone that defines the
western edge of the Kalgoorlie terrain. The majority of the
Agnew ore bodies are on the western limb of the Lawlers
anticline, a large open fold, plunging 30° to the north, although
economic mineralisation is also formed on the eastern limb
(e.g. Vivien), in axial planar positions to the north (e.g. Cams)
and in the adjacent Mt White syncline (e.g. Maria).
The Agnew anticline and the Mt White syncline are large-
scale folds plunging 30° to the north. The dip of the limbs’
range from moderate at the nose and shoulders of the folds
(e.g. at Waroonga) to steep and slightly overturned along the
limbs (e.g. at Songvang).
Although all of the Agnew deposits are broadly hosted by the
intersections between structures and stratigraphy, there are
subtle differences in alteration and mineralisation controlled in
part by the local host rock chemistry. Songvang is unusual in
its relatively high lead, silver and fluorine content, possibly
reflecting input from tonalite and porphyry intrusions. There
also appears to have been a slight decline in mineralisation
temperatures from south to north through the Agnew area,
associated with the north plunge of the Lawlers Anticline and
resultant erosion of the overlying lower temperature rocks to
the south. This temperature change is reflected in the
changing mineralisation styles from south to north, with
biotite/garnet assemblages dominating to the south and
quartz veining to the north.
4. Geological setting and mineralisation
Schem
atic o
f g
old
min
era
lisatio
n o
ccurr
ences
Geo
log
y o
f th
e A
gnew
Law
lers
reg
ion s
ho
win
g t
he A
gnew
anticlin
e
The stratigraphy of the Agnew-Wiluna belt appears to be
broadly similar to the stratigraphy of the Kalgoorlie region.
The following section provides a detailed description of the
general stratigraphy for the Agnew mining leases and the
stratigraphic location of various ore bodies.
Exploration and drilling
At Agnew there is considerable endowment potential within
the current tenement holdings to add significantly to current
Mineral Resources and Mineral Reserves, through a
combination of on-mine (extensions to known Mineral
Resource) and near-mine exploration. In terms of the extent
of its tenement holdings and the exploration undertaken
Sandstone
Scotty Creek Sandstone
Ultramafic Conglomerate (North)Mafic Conglomerate (South)
Agnew Ultramafic
Lawlers Basalt
New Holland Genesis
Zone 2/3
Kim/Rajah/Main
Pilgrim
Vivien
Songvang
Crusader
Deliverer
Claudius
Gold Mineralisation Granite/Porphyry
Cams Camp
Maria North
Maria
Vivien
Lawlers
Songvang
Donegal North
Goldilocks
Miranda Fault
Alice
Cinderella North
Waroonga Complex
Surprise
Redeemer-Crusader
Endeavour-South
Target 20U
Pinnacles
Pinnacles South 0 5km
N
55
thus far, Agnew cannot yet be considered advanced in
exploration terms, and recent geological studies have
identified numerous prospective areas yet to be tested
effectively.
Mine exploration for the 12 months to December 2011
continued to focus on extensional drilling and reserve
delineation at Waroonga, specifically at Main Lode, where a
programme of surface drilling below Main North and South
was undertaken (exploration triangle below). Directional
surface drilling technology was successfully used and a total
of 17,446 metres was completed during the year. Drilling,
although initially designed to delineate ore for a possible
sub-level caving operation at Main North, was soon altered to
target the newly interpreted high-grade shoots – Fitzroy,
Bengal and Hastings (FBH) – between 700 and 1,200 metres
below surface.
Results and interpretation during 2011 have confirmed the
continuity of the three shoots down to the 9,300 mRL where
they remain open at depth. A fourth high-grade shoot –
Yeoman – has also recently been identified beneath Main
South with a few boreholes, but the dimensions still need to
be determined.
Exploration success in delineating high grade shoots beneath
Main Lode will see the Waroonga Complex continue to be the
focus of activity during 2012. Significant potential for
additional resource ounces exists between the Kim and the
Fitzroy shoots (Link target) as well as depth extensions to the
Fitzroy, Bengal, Hastings and Yeoman shoots.
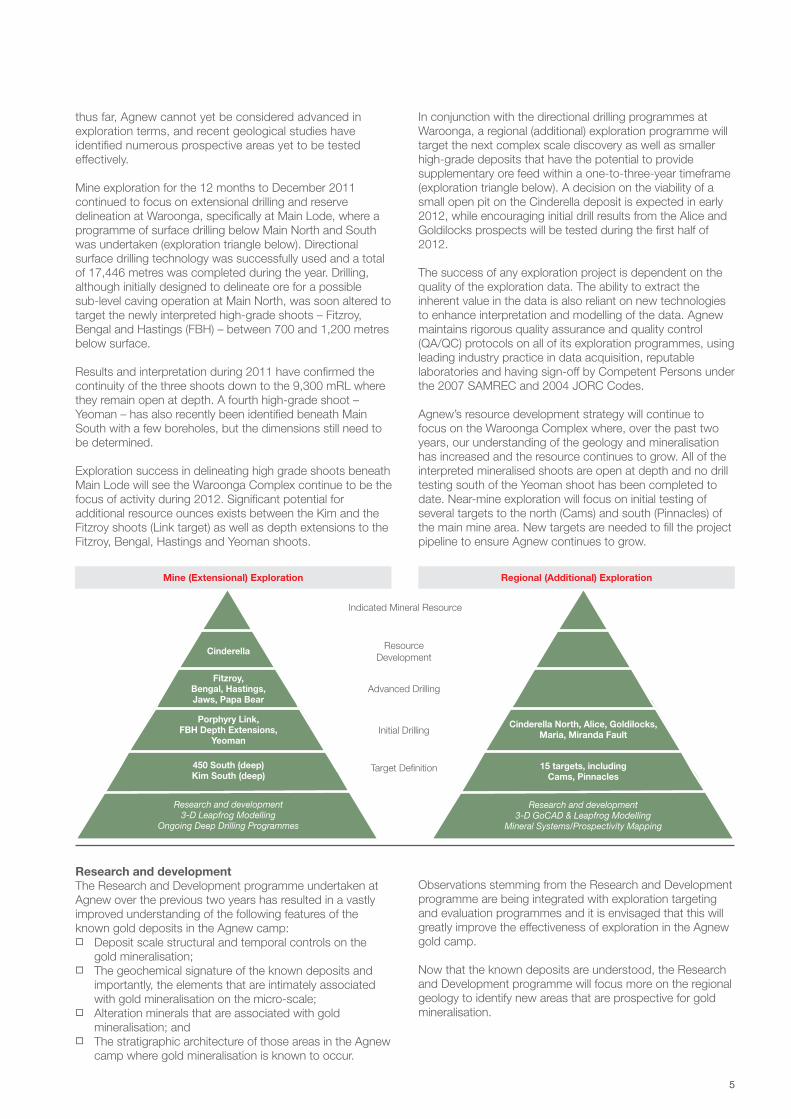
In conjunction with the directional drilling programmes at
Waroonga, a regional (additional) exploration programme will
target the next complex scale discovery as well as smaller
high-grade deposits that have the potential to provide
supplementary ore feed within a one-to-three-year timeframe
(exploration triangle below). A decision on the viability of a
small open pit on the Cinderella deposit is expected in early
2012, while encouraging initial drill results from the Alice and
Goldilocks prospects will be tested during the first half of
2012.
The success of any exploration project is dependent on the
quality of the exploration data. The ability to extract the
inherent value in the data is also reliant on new technologies
to enhance interpretation and modelling of the data. Agnew
maintains rigorous quality assurance and quality control
(QA/QC) protocols on all of its exploration programmes, using
leading industry practice in data acquisition, reputable
laboratories and having sign-off by Competent Persons under
the 2007 SAMREC and 2004 JORC Codes.
Agnew’s resource development strategy will continue to
focus on the Waroonga Complex where, over the past two
years, our understanding of the geology and mineralisation
has increased and the resource continues to grow. All of the
interpreted mineralised shoots are open at depth and no drill
testing south of the Yeoman shoot has been completed to
date. Near-mine exploration will focus on initial testing of
several targets to the north (Cams) and south (Pinnacles) of
the main mine area. New targets are needed to fill the project
pipeline to ensure Agnew continues to grow.
Research and development
The Research and Development programme undertaken at
Agnew over the previous two years has resulted in a vastly
improved understanding of the following features of the
known gold deposits in the Agnew camp: � Deposit scale structural and temporal controls on the
gold mineralisation; � The geochemical signature of the known deposits and
importantly, the elements that are intimately associated
with gold mineralisation on the micro-scale; � Alteration minerals that are associated with gold
mineralisation; and � The stratigraphic architecture of those areas in the Agnew
camp where gold mineralisation is known to occur.
Observations stemming from the Research and Development
programme are being integrated with exploration targeting
and evaluation programmes and it is envisaged that this will
greatly improve the effectiveness of exploration in the Agnew
gold camp.
Now that the known deposits are understood, the Research
and Development programme will focus more on the regional
geology to identify new areas that are prospective for gold
mineralisation.
Regional (Additional) ExplorationMine (Extensional) Exploration
Cinderella North, Alice, Goldilocks,
Maria, Miranda Fault
Porphyry Link,
FBH Depth Extensions,
Yeoman
Fitzroy,
Bengal, Hastings,
Jaws, Papa Bear
Cinderella
15 targets, including
Cams, Pinnacles
450 South (deep)
Kim South (deep)
Research and development3-D GoCAD & Leapfrog Modelling
Mineral Systems/Prospectivity Mapping
Research and development3-D Leapfrog Modelling
Ongoing Deep Drilling Programmes
Indicated Mineral Resource
Resource
Development
Initial Drilling
Target Definition
Advanced Drilling
Gold Fields: Agnew Gold Mine – Technical Short Form Report 2011 6
Develo
pin
g o
re d
rive
Exam
ple
o
f m
ine d
esig
n m
od
el
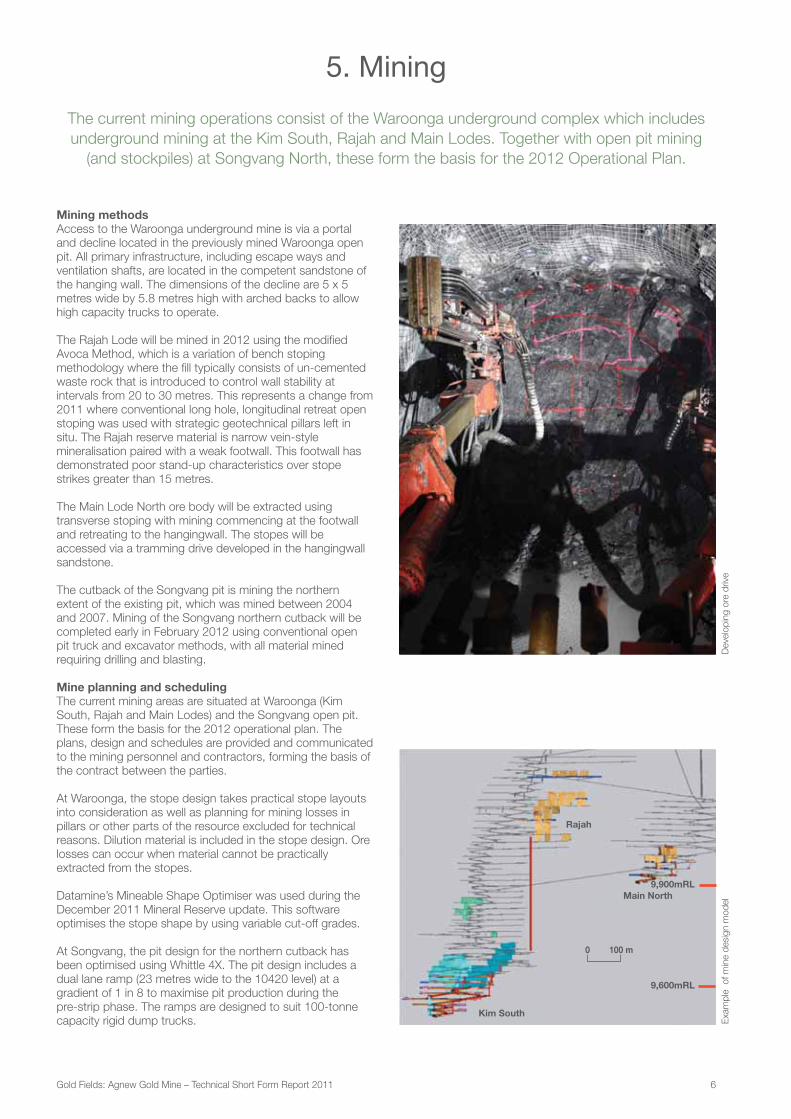
5. Mining
Mining methods
Access to the Waroonga underground mine is via a portal
and decline located in the previously mined Waroonga open
pit. All primary infrastructure, including escape ways and
ventilation shafts, are located in the competent sandstone of
the hanging wall. The dimensions of the decline are 5 x 5
metres wide by 5.8 metres high with arched backs to allow
high capacity trucks to operate.
The Rajah Lode will be mined in 2012 using the modified
Avoca Method, which is a variation of bench stoping
methodology where the fill typically consists of un-cemented
waste rock that is introduced to control wall stability at
intervals from 20 to 30 metres. This represents a change from
2011 where conventional long hole, longitudinal retreat open
stoping was used with strategic geotechnical pillars left in
situ. The Rajah reserve material is narrow vein-style
mineralisation paired with a weak footwall. This footwall has
demonstrated poor stand-up characteristics over stope
strikes greater than 15 metres.
The Main Lode North ore body will be extracted using
transverse stoping with mining commencing at the footwall
and retreating to the hangingwall. The stopes will be
accessed via a tramming drive developed in the hangingwall
sandstone.
The cutback of the Songvang pit is mining the northern
extent of the existing pit, which was mined between 2004
and 2007. Mining of the Songvang northern cutback will be
completed early in February 2012 using conventional open
pit truck and excavator methods, with all material mined
requiring drilling and blasting.
Mine planning and scheduling
The current mining areas are situated at Waroonga (Kim
South, Rajah and Main Lodes) and the Songvang open pit.
These form the basis for the 2012 operational plan. The
plans, design and schedules are provided and communicated
to the mining personnel and contractors, forming the basis of
the contract between the parties.
At Waroonga, the stope design takes practical stope layouts
into consideration as well as planning for mining losses in
pillars or other parts of the resource excluded for technical
reasons. Dilution material is included in the stope design. Ore
losses can occur when material cannot be practically
extracted from the stopes.
Datamine’s Mineable Shape Optimiser was used during the
December 2011 Mineral Reserve update. This software
optimises the stope shape by using variable cut-off grades.
At Songvang, the pit design for the northern cutback has
been optimised using Whittle 4X. The pit design includes a
dual lane ramp (23 metres wide to the 10420 level) at a
gradient of 1 in 8 to maximise pit production during the
pre-strip phase. The ramps are designed to suit 100-tonne
capacity rigid dump trucks.
The current mining operations consist of the Waroonga underground complex which includes
underground mining at the Kim South, Rajah and Main Lodes. Together with open pit mining
(and stockpiles) at Songvang North, these form the basis for the 2012 Operational Plan.
Rajah
Main North
Kim South
0 100 m
9,600mRL
9,900mRL

7
Cin
dere
lla c
oncep
t p
it d
esig
n
6. Projects
Underground production from Waroonga does not fully utilise
the processing plant capacity. To fully utilise the milling
capacity, a cutback of the Songvang pit commenced in
January 2011. The mining of the project is scheduled for
completion in February 2012 and stockpiled ore will provide
supplementary mill feed until Quarter 4, 2012.
The possibility of opportunistically exploiting small-scale open
pittable deposits for supplementary mill feed continues to be
examined and reviewed. In this regard a small “starter” pit at
Cinderella will be assessed early in 2012. Possible cutbacks
on existing open pits include New Woman and Redeemer.
Near-mine exploration on the extensive Agnew land holdings
will focus on the Scotty Creek sediments and the Alice and
Goldilocks prospects. The objective is to discover and bring
into production an open pit operation to supplement the
Waroonga complex ore, thus fully utilising available
processing plant capacity.
Extensional exploration within the Waroonga Complex is targeting known and extrapolated
mineralisation trends. Increasing the Mineral Resource and Mineral Reserve will extend
the mine life of the Waroonga Complex and increase production flexibility by opening
new areas for exploitation.
7. Mineral processing
The comminution circuit comprises a contractor-owned and
operated three-stage crushing plant, feeding a fine ore
stockpile, ahead of a two-stage closed circuit ball milling
circuit. Milled ore proceeds to a three-stage leaching train
feeding the six-stage carbon in pulp (CIP) circuit. Carbon
elution is by pressure Zadra with gold being electrowon and
smelted. In February 2003 a gravity circuit, comprising a
Knelson gravity concentrator in conjunction with an
intensive leach reactor (ILR) for intensive cyanidation of the
gravity concentrate, was retrofitted. The gravity circuit was
upgraded and retrofitted in September 2011 to incorporate
a second 26” Knelson gravity concentrator, an Intensive
Leach Reactor 2000BA and two Magscreen 1000 units. The
processing capacity at the plant is 1.3 Mtpa.
Quantitative analysis of recovery improvements will be
evaluated and included in future resources and reserve
calculations in accordance with the grade/recovery model
currently adapted.
Tailings disposal and impoundment have historically been to
a conventional dam constructed using the upstream lift
method sourcing wall material from dried tailings. The
original tailing storage facility (TSF) was located in an area
some 1.5 kilometres southwest of the Agnew plant.
Deposition to this facility ceased in early 2004 and a large
section of this decommissioned facility has been capped
with waste rock. The remaining exposed sections are being
harvested for use as underground paste fill. Following
completion of mining activities at the Redeemer Mine, the
abandoned pit has been converted to a tailings storage
impoundment for tailings arising from the Agnew plant
(TSF3). Although situated seven kilometres south of the
Agnew plant, the static head is negative, thus pumping of
the tailings material is achieved with no additional cost from
the previous deposition technique. The pontoon-mounted
decant pump recovers water from the supernatant pond,
which forms due to liberation of water from the tailings slurry
as it settles and consolidates.
TSF3 is projected to last until 2015 based on deposition
rates of 1.3 million tonnes per annum and historical
deposition levels from December 2004 to February 2011.
Upgrade of the gravity recovery circuit was completed in September 2011.
Ag
new
pla
nt
and
sett
ler
dam
s
Gold Fields: Agnew Gold Mine – Technical Short Form Report 2011 8
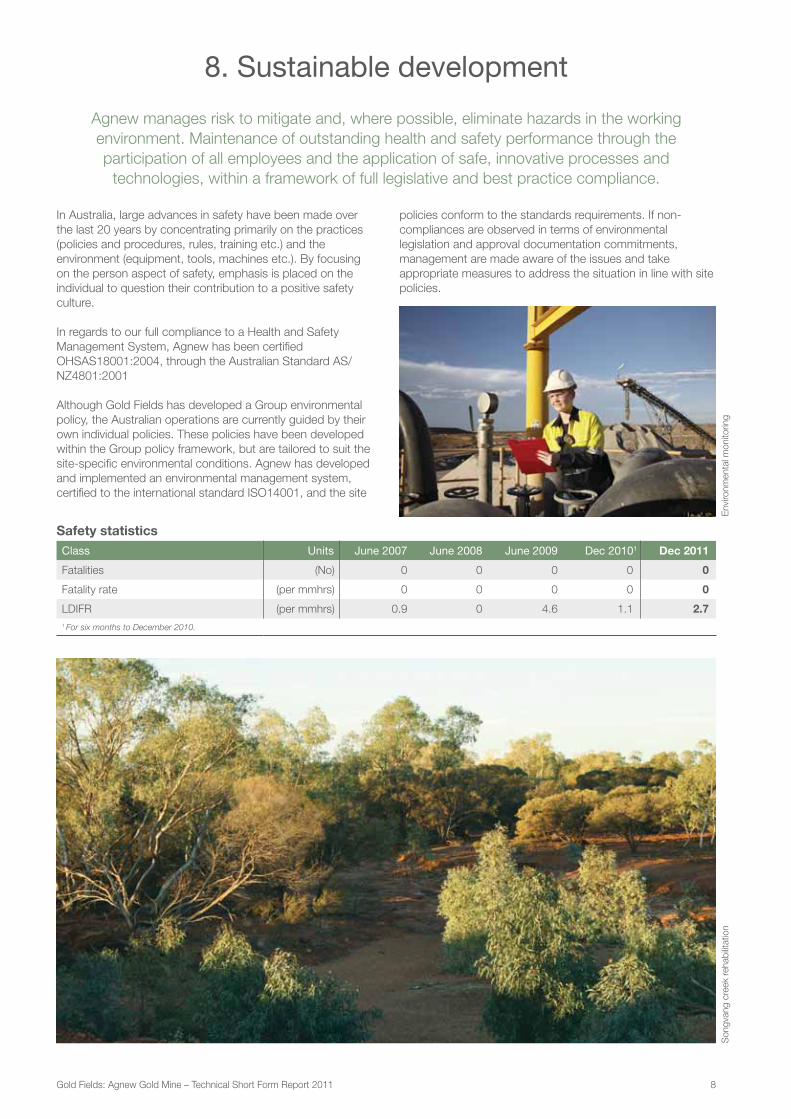
8. Sustainable development
In Australia, large advances in safety have been made over
the last 20 years by concentrating primarily on the practices
(policies and procedures, rules, training etc.) and the
environment (equipment, tools, machines etc.). By focusing
on the person aspect of safety, emphasis is placed on the
individual to question their contribution to a positive safety
culture.
In regards to our full compliance to a Health and Safety
Management System, Agnew has been certified
OHSAS18001:2004, through the Australian Standard AS/
NZ4801:2001
Although Gold Fields has developed a Group environmental
policy, the Australian operations are currently guided by their
own individual policies. These policies have been developed
within the Group policy framework, but are tailored to suit the
site-specific environmental conditions. Agnew has developed
and implemented an environmental management system,
certified to the international standard ISO14001, and the site
Agnew manages risk to mitigate and, where possible, eliminate hazards in the working
environment. Maintenance of outstanding health and safety performance through the
participation of all employees and the application of safe, innovative processes and
technologies, within a framework of full legislative and best practice compliance.
Enviro
nm
enta
l m
onito
ring
So
ng
vang
cre
ek r
ehab
ilita
tio
n
policies conform to the standards requirements. If non-
compliances are observed in terms of environmental
legislation and approval documentation commitments,
management are made aware of the issues and take
appropriate measures to address the situation in line with site
policies.
Safety statistics
Class Units June 2007 June 2008 June 2009 Dec 20101 Dec 2011
Fatalities (No) 0 0 0 0 0
Fatality rate (per mmhrs) 0 0 0 0 0
LDIFR (per mmhrs) 0.9 0 4.6 1.1 2.7
1 For six months to December 2010.
9
Ag
new
Min
e g
old
po
ur
Mineral Resource
classification
Tonnes (Mt) Grade (g/t) Gold (’000 oz)
Dec
2011
Dec 2010
June 2010
Dec
2011
Dec 2010
June 2010
Dec
2011
Dec 2010
June 2010
Open pit and underground
Measured 3.5 4.5 4.4 4.7 4.1 4.1 540 597 584
Indicated 12.9 13.6 14.7 5.3 5.2 5.0 2,199 2,265 2,368
Inferred 7.5 7.4 7.7 4.5 4.1 4.3 1,082 981 1,075
Total open pit and underground 23.9 25.5 26.8 5.0 4.7 4.7 3,820 3,843 4,027
Surface stockpiles
Measured 0.3 0.0 0.0 1.7 6.3 6.1 17 2 2
Total surface stockpiles 0.3 0.0 0.0 1.7 6.3 6.1 17 2 2
Grand total 24.2 25.5 26.8 4.9 4.7 4.7 3,838 3,845 4,028
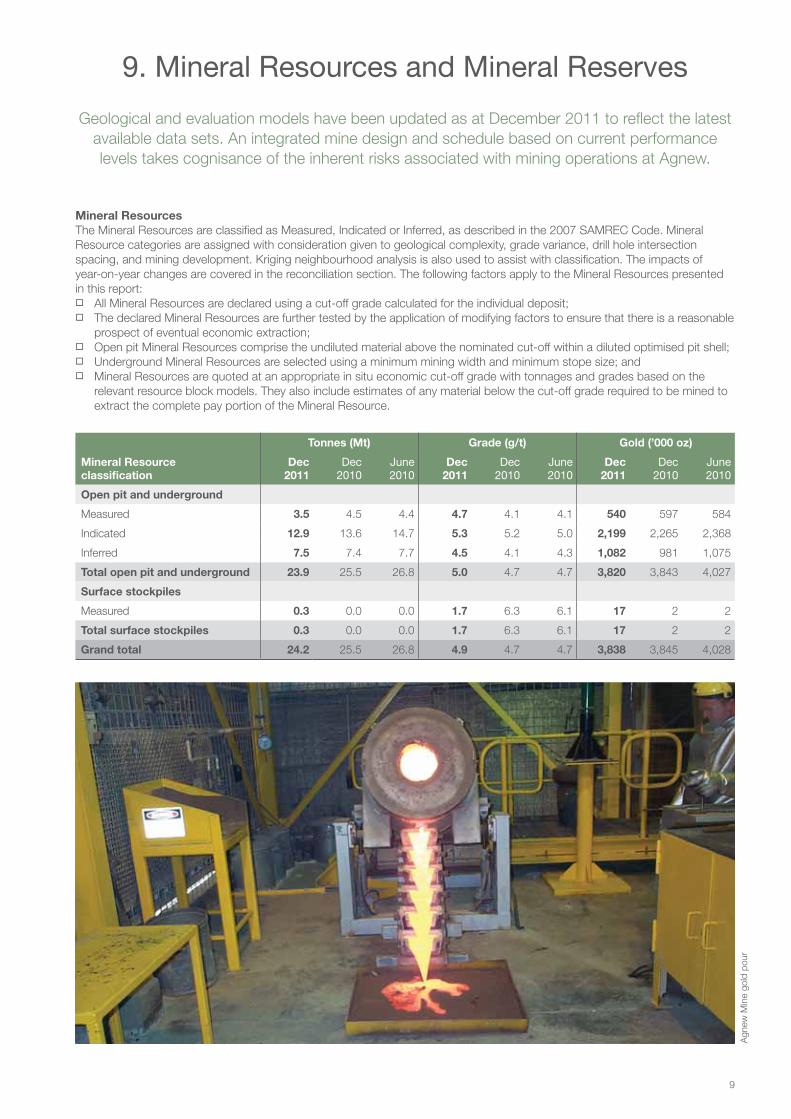
9. Mineral Resources and Mineral Reserves
Mineral Resources
The Mineral Resources are classified as Measured, Indicated or Inferred, as described in the 2007 SAMREC Code. Mineral
Resource categories are assigned with consideration given to geological complexity, grade variance, drill hole intersection
spacing, and mining development. Kriging neighbourhood analysis is also used to assist with classification. The impacts of
year-on-year changes are covered in the reconciliation section. The following factors apply to the Mineral Resources presented
in this report: � All Mineral Resources are declared using a cut-off grade calculated for the individual deposit; � The declared Mineral Resources are further tested by the application of modifying factors to ensure that there is a reasonable
prospect of eventual economic extraction; � Open pit Mineral Resources comprise the undiluted material above the nominated cut-off within a diluted optimised pit shell; � Underground Mineral Resources are selected using a minimum mining width and minimum stope size; and � Mineral Resources are quoted at an appropriate in situ economic cut-off grade with tonnages and grades based on the
relevant resource block models. They also include estimates of any material below the cut-off grade required to be mined to
extract the complete pay portion of the Mineral Resource.
Geological and evaluation models have been updated as at December 2011 to reflect the latest
available data sets. An integrated mine design and schedule based on current performance
levels takes cognisance of the inherent risks associated with mining operations at Agnew.
DATA TO COME
Gold Fields: Agnew Gold Mine – Technical Short Form Report 2011 10
Modifying factors � The Measured and Indicated Mineral Resources are
inclusive of those Mineral Resources modified to produce
Mineral Reserves; � All quoted Mineral Resources and Mineral Reserves are
100% Agnew ownership; � Mineral Reserves are quoted in terms of run-of-mine (RoM)
grades and tonnages as delivered to the metallurgical
processing facility and are therefore fully diluted; � Mineral Reserve statements include only Measured and
Indicated Mineral Resources, modified to produce Mineral
Reserves and contained within the LoM plan; and � Mineral Resource and Mineral Reserve undergo both
internal and external audits annually. Any issues identified
are rectified at the earliest opportunity.
Mineral Resource parameters
Dec 2010
Dec
2011
Mineral Resource gold price
US$/oz
US$/A$
A$/oz
1,100
1.23
1,350
1,450
1.07
1,550
Cut-off for mill feed g/t 0.3 0.3
Cut-off for open pit g/t 0.3 – 0.4 0.3
Cut-off for underground g/t 1.5 – 4.0 0.3 – 4.0
Mineral Reserve parameters
Mineral Reserve gold price
US$/oz
US$/A$
A$/oz
1,000
1.23
1,225
1,300
1.07
1,400
Cut-off for mill feed
underground g/t 1.5 – 4.4 3.1 – 4.4
Cut-off for mill feed open pit g/t 0.4 0.4
MCF % 100 100
Dilution % 26 26
Plant recovery factor % 94.5 94.5
Processing capacity Mtpa 1.3 1.3
Grade tonnage curves
Grade tonnage curves for the total and open pit Mineral
Resource is presented. The total chart illustrates the relatively
high-grade characteristic of the Agnew camp where historical
grades have been in the region of 5 to 6 g/t.
25
20
15
10
5
0
16
14
12
10
8
6
4
2
00 1 2 3 4 5 96 7 8
Cut-off grade (g/t)
— A
vera
ge g
rade
abo
ve c
ut-o
ff (g
/t)
— T
onne
s (m
illio
ns)
Underground
Total (underground and open pits)
32
28
24
20
16
12
8
4
0
16
14
12
10
8
6
4
2
00 1 2 3 4 5 6 7 98
Cut-off grade (g/t)
— A
vera
ge g
rade
abo
ve c
ut-o
ff (g
/t)
— T
onne
s (m
illio
ns)
So
ng
vang
cut-
back
11
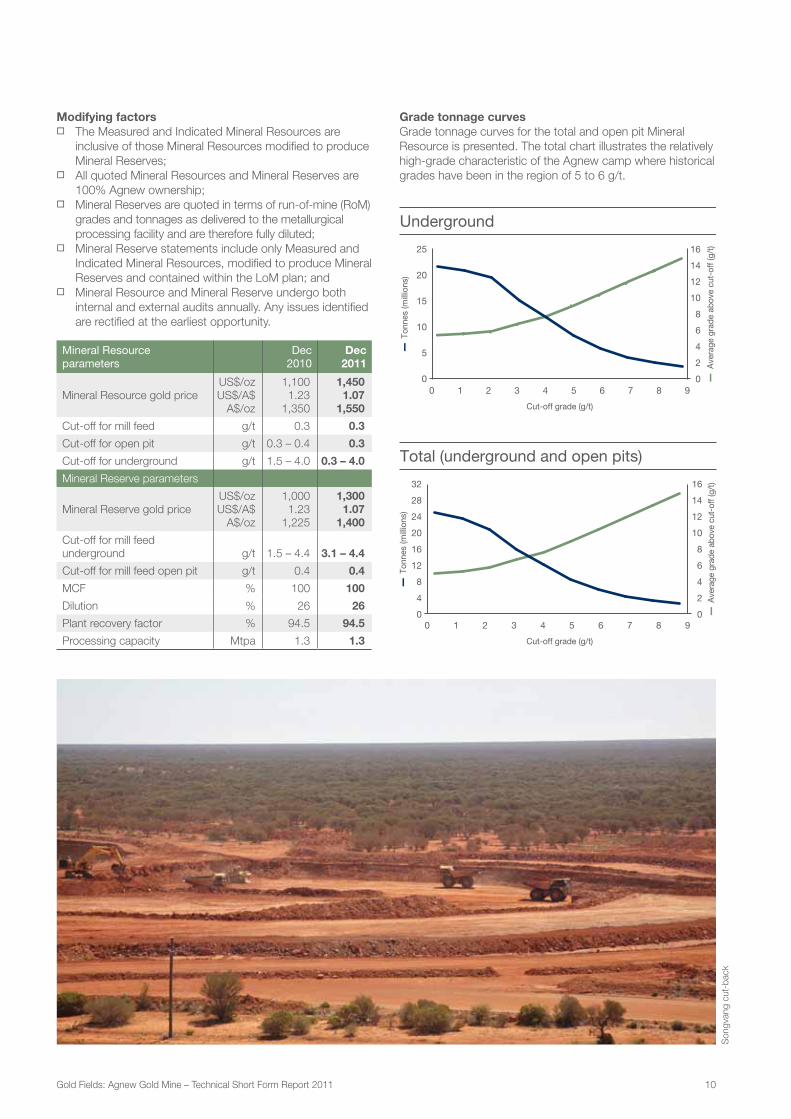
Mineral Reserves
The Mineral Reserve estimate for Agnew is based on an appropriately detailed and engineered LoM plan. All design and
scheduling work is undertaken to an appropriate level of detail by experienced engineers using appropriate mine planning
software. The planning process incorporates appropriate modifying factors and the use of cut-off grades and other technical-
economic investigations.
The table in this section summarises the Agnew statement of Mineral Reserves. The terms and definitions are those given in the
2007 SAMREC Code prepared by the South African Mineral Resource Committee under the auspices of the South African
Institute of Mining and Metallurgy. The current Operational Plan has mining occurring in the Kim South, Rajah and Main Lode at
the Waroonga Complex.
The Mineral Reserves are derived following the production of the LoM plan by incorporating modifying factors into the resource
model.
Mineral Reserve
classification
Tonnes (Mt) Grade (g/t) Gold (’000 oz)
Dec
2011
Dec 2010
June 2010
Dec
2011
Dec 2010
June 2010
Dec
2011
Dec 2010
June 2010
Open pit and underground
Proved 1.4 1.3 0.7 5.5 4.8 6.9 239 195 166
Probable 5.4 5.6 6.0 6.0 6.2 5.5 1,046 1,126 1,061
Total open pit and underground 6.8 6.9 6.7 5.9 6.0 5.7 1,285 1,321 1,227
Surface stockpiles
Proved low-grade stockpiles 0.3 – – 1.7 – – 17 – –
Total surface stockpiles 0.3 – – 1.7 – – 17 – –
Grand total 7.1 6.9 6.7 5.7 6.0 5.7 1,302 1,321 1,227
Mineral Reserve classified
per mining area
Proved Probable Total Mineral Reserve
Tonnes
(kt)
Grade
(g/t)
Gold
(koz)
Tonnes
(kt)
Grade
(g/t)
Gold
(koz)
Tonnes
(kt)
Grade
(g/t)
Gold
(koz)
Underground
Waroonga - Kim Lode 294 13.4 127 2,831 7.4 677 3,125 8.0 804
Waroonga - Rajah Lode 179 4.2 24 265 3.7 32 444 3.9 56
Waroonga - Main Lode 671 3.7 79 2,351 4.5 338 3,022 4.3 417
Total underground 1,144 6.2 230 5,447 6.0 1,046 6,591 6.0 1,276
Surface
Songvang open pit 208 1.4 9 – – – 208 1.4 9
Surface stockpiles 306 1.7 17 – – – 306 1.7 17
Total surface 514 1.6 26 – – – 514 1.6 26
Grand total 1,658 4.8 255 5,447 6.0 1,046 7,105 5.7 1,302
Pano
ram
ic v
iew
of C
IP p
lant
Gold Fields: Agnew Gold Mine – Technical Short Form Report 2011 12
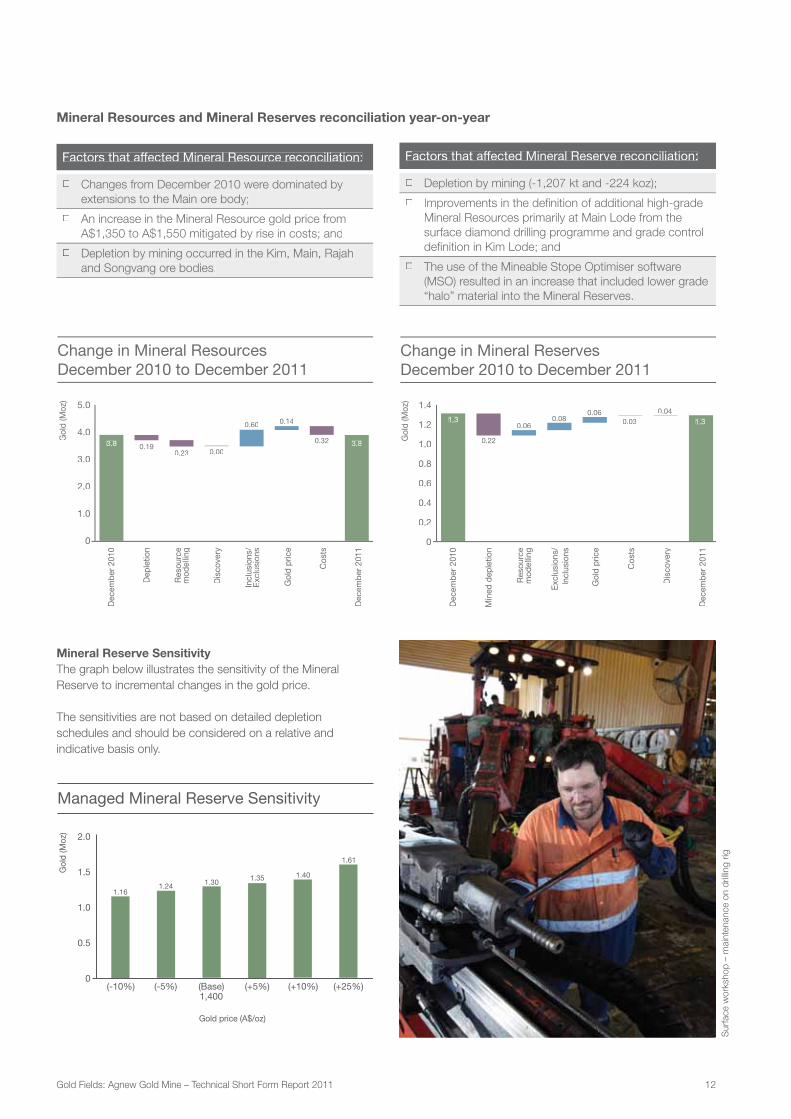
Factors that affected Mineral Resource reconciliation:
� Changes from December 2010 were dominated by
extensions to the Main ore body;
� An increase in the Mineral Resource gold price from
A$1,350 to A$1,550 mitigated by rise in costs; and
� Depletion by mining occurred in the Kim, Main, Rajah
and Songvang ore bodies.
5.0
4.0
3.0
2.0
1.0
0
Change in Mineral Resources December 2010 to December 2011
Gol
d (M
oz)
Res
ourc
em
odel
ling
Incl
usio
ns/
Exc
lusi
ons
Gol
d pr
ice
Cos
ts
Dep
letio
n
Dis
cove
ry
Dec
embe
r 20
10
Dec
embe
r 20
11
3,845
0.193.8 3.8
3,652
0.23 0.00
0.60 0.14
0.32
3,838
Factors that affected Mineral Reserve reconciliation:
� Depletion by mining (-1,207 kt and -224 koz);
� Improvements in the definition of additional high-grade
Mineral Resources primarily at Main Lode from the
surface diamond drilling programme and grade control
definition in Kim Lode; and
� The use of the Mineable Stope Optimiser software
(MSO) resulted in an increase that included lower grade
“halo” material into the Mineral Reserves.
Change in Mineral ReservesDecember 2010 to December 2011
1.4
1.2
1.0
0.8
0.6
0.4
0.2
0
Res
ourc
em
odel
ling
Exc
lusi
ons/
Incl
usio
ns
Gol
d pr
ice
Cos
ts
Dis
cove
ry
Min
ed d
eple
tion
Dec
embe
r 20
10
Dec
embe
r 20
11
1.3
0.22
0.060.08
0.060.03
0.041.3
Gol
d (M
oz)
Mineral Reserve Sensitivity
The graph below illustrates the sensitivity of the Mineral
Reserve to incremental changes in the gold price.
The sensitivities are not based on detailed depletion
schedules and should be considered on a relative and
indicative basis only.
(-10%) (-5%) (+5%) (+10%) (+25%)(Base)1,400
Managed Mineral Reserve Sensitivity
Gol
d (M
oz)
1.161.24 1.30
1.35 1.40
1.61
Gold price (A$/oz)
2.0
1.5
1.0
0.5
0
Surf
ace w
ork
sho
p –
main
tenance o
n d
rilling
rig
Mineral Resources and Mineral Reserves reconciliation year-on-year
13
10. Regulatory codes
SAMREC
This technical statement has been prepared in compliance
with the South Africa Code for the Reporting of Exploration
Results, Mineral Resources and Mineral Reserves (2007
SAMREC Code).
JSE
This technical statement has been prepared in compliance
with the Listings Requirements of the JSE Limited, South
Africa (JSE), specifically Section 12.
Sarbanes-Oxley Act
The Mineral Resources and Mineral Reserves are
underpinned by an appropriate Mineral Resource
management process and protocol to ensure adequate
corporate governance in respect of the intent of the
Sarbanes-Oxley Act.
Environmental
Agnew has an environmental management team that is
supported by specialists from the regional office
in Perth. The systems, procedures, training etc. are at
international leading practice levels.
11. Competent Persons
Competent Persons
Peter Johansen: Mineral Resource Manager BSc (Hons) Geology. AusIMM membership number 108674. Industry experience: 23 years in exploration and mining in
Australia and PNG. Commodities: gold, iron ore. 5 years at Agnew.
Alan Pedersen: Resource Modelling ManagerGraduate Certificate in Geostatistics. MAusIMM membership number: 222422. Industry experience: 29 years in mining and
exploration in Australia, PNG and Ghana. Commodities: gold, nickel and copper. 14 years at Agnew.
Jason Sander: Mine Planning Manager BEng (Hons) Mining Engineering. LoM strategic planning, reserve estimation and LoM planning. MAusIMM membership
number: 111818. Industry experience: 16 years in mining in Australia. Commodities: gold, copper, iron ore. 6 years at Agnew.
James Emslie: Technical Services ManagerBSc (Hons) Geology. AusIMM membership number 205418. Industry experience: 15 years in mining in Australia Commodities:
gold, iron ore. 3 years at Agnew.
Internal technical reviews have been conducted by the Competent Persons as listed, who are
full-time employees of Gold Fields Limited.A
erial vie
w o
f Lein
ste
r
Gold Fields: Agnew Gold Mine – Technical Short Form Report 2011 14
Post Incumbent Qualifications Years Key responsibilities
General Manager Timothy Gilbert BEng (Hons) Mining Engineering 24 Responsible for overall strategic
direction, leadership and management
of the mine site
Mining Manager
(Underground and
Open Pit Mining)
David Vemer B App Sci (Hons) Extractive Metallurgy 16 Management of mining operations
Financial Management
and Accounting
Commercial Manager
Eric Asubonteng BSc Administration (Accounting)
ACCA
8 Financial management, reporting and
compliance
Sustainable
Development Manager
Greg Yarrick B App Sci (Environmental Health)
Post-grad Diploma (Health Sciences
– OHS)
24 Management of health, safety
environmental and community
Human Resources
Manager
Sean Redmond MBa 15 Human resources management
Metallurgy and
Engineering Manager
Alex Kraan BBa 4 Engineering, logistics and infrastructure
management. Mineral Processing and
Metallurgy CIL and Tailings
management.
Mineral Resources
Manager:
Mine Planning
and Resource
Management
Peter Johansen BSc (Hons) Geology 23 Mineral Resources and Mineral
Reserves and compilation of CPR
12. Key technical staff
Fin
e o
re s
tockp
ile
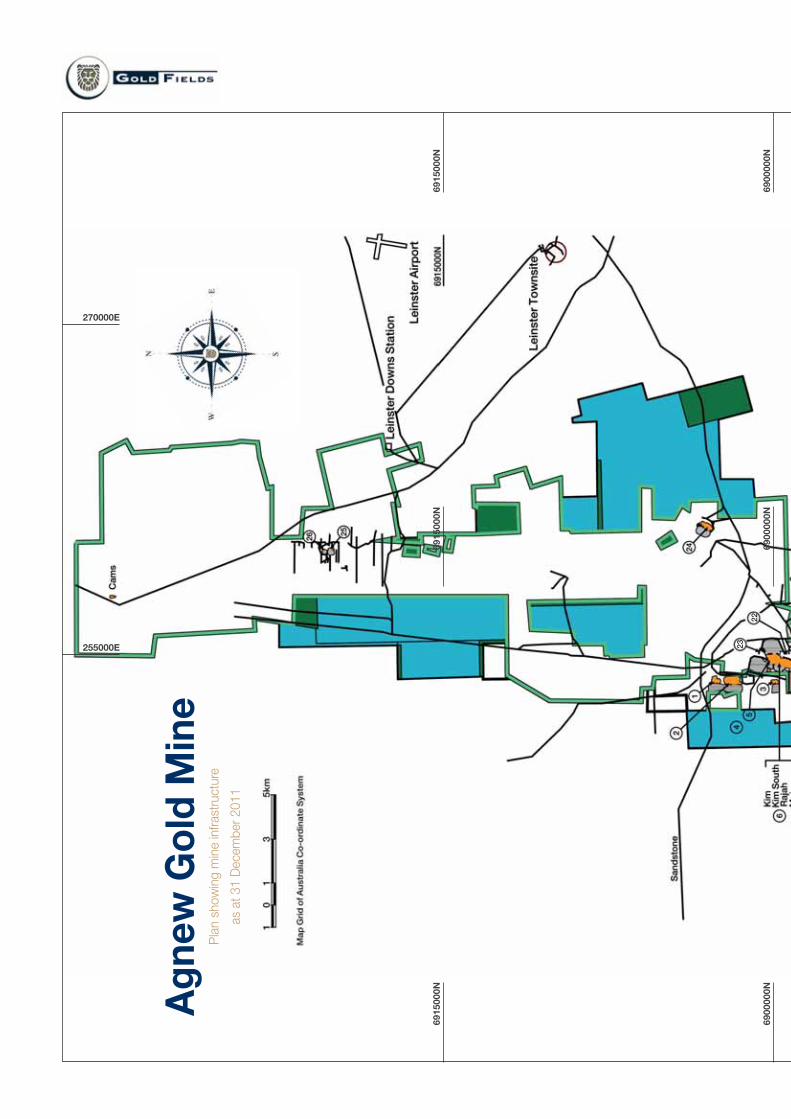
Ag
ne
w G
old
Min
eP
lan s
how
ing m
ine in
frastr
uctu
re
as a
t 31 D
ecem
ber
2011
69
15
00
0N
69
00
00
0N
69
15
00
0N
69
00
00
0N
69
15
00
0N
69
00
00
0N
270000E
255000E
22
23
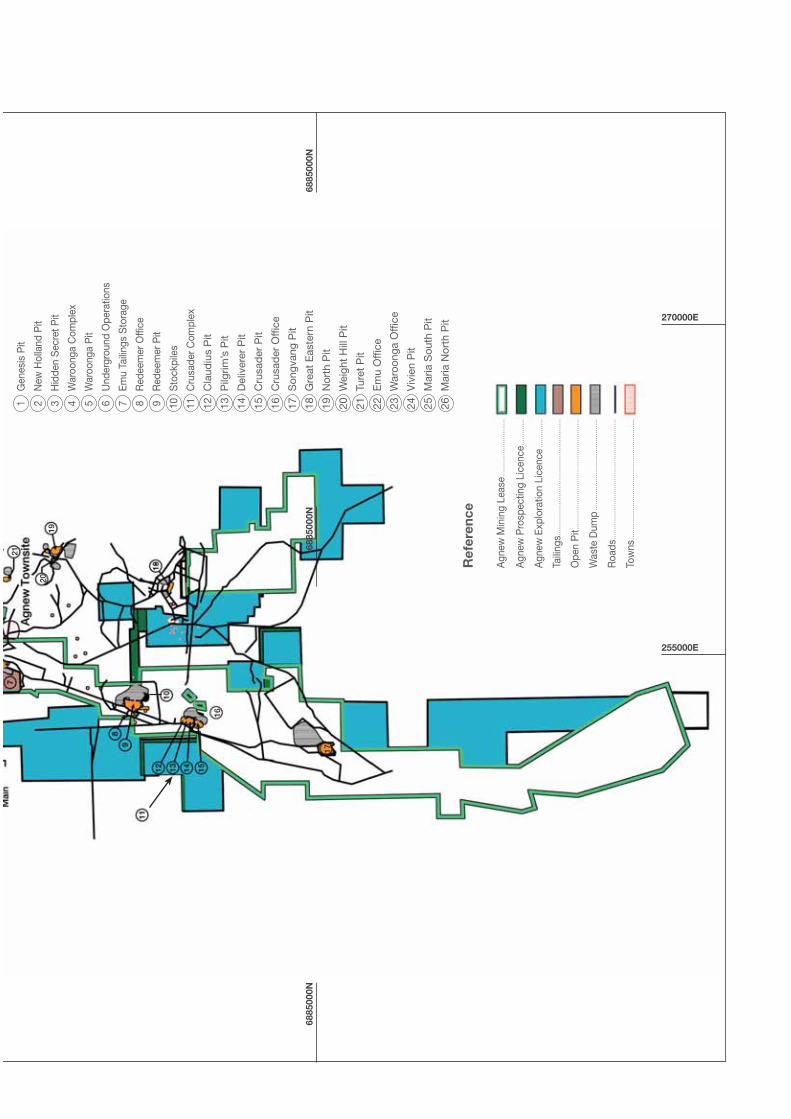
1G
enes
is P
it
2N
ew H
olla
nd P
it
3H
idde
n S
ecre
t Pit
4W
aroo
nga
Com
plex
5W
aroo
nga
Pit
6U
nder
grou
nd O
pera
tions
7Em
u Ta
iling
s S
tora
ge
8R
edee
mer
Offi
ce
9R
edee
mer
Pit
10S
tock
pile
s
11C
rusa
der C
ompl
ex
12C
laud
ius
Pit
13P
ilgrim
’s P
it
14D
eliv
erer
Pit
15C
rusa
der
Pit
16C
rusa
der
Offi
ce
17S
ongv
ang
Pit
18G
reat
Eas
tern
Pit
19N
orth
Pit
20W
eigh
t H
ill P
it
21Tu
ret
Pit
22E
mu
Offi
ce
23W
aroo
nga
Offi
ce
24V
ivie
n P
it
25M
aria
Sou
th P
it
26M
aria
Nor
th P
it
Re
fere
nc
e
Agn
ew M
inin
g Le
ase .
....
....
....
....
...........
Agn
ew P
rosp
ectin
g Li
cenc
e ...
..........
Agn
ew E
xplo
ratio
n Li
cenc
e ..
....
........
Taili
ngs .
....
....
....
....
....
....
....
....
....
....
....
....
........
Ope
n P
it ...
....
....
....
....
....
....
....
....
....
....
...........
Was
te D
ump
....
....
....
....
....
....
....
....
....
.........
Roa
ds ..
....
....
....
....
....
....
....
....
....
....
....
....
.........
Tow
ns ..
....
....
....
....
....
....
....
....
....
....
....
....
.........
6885000N
6885000N
6885000N
270000E
255000E
17
16
1920
21
Gold Fields: Agnew Gold Mine – Technical Short Form Report 2011 17
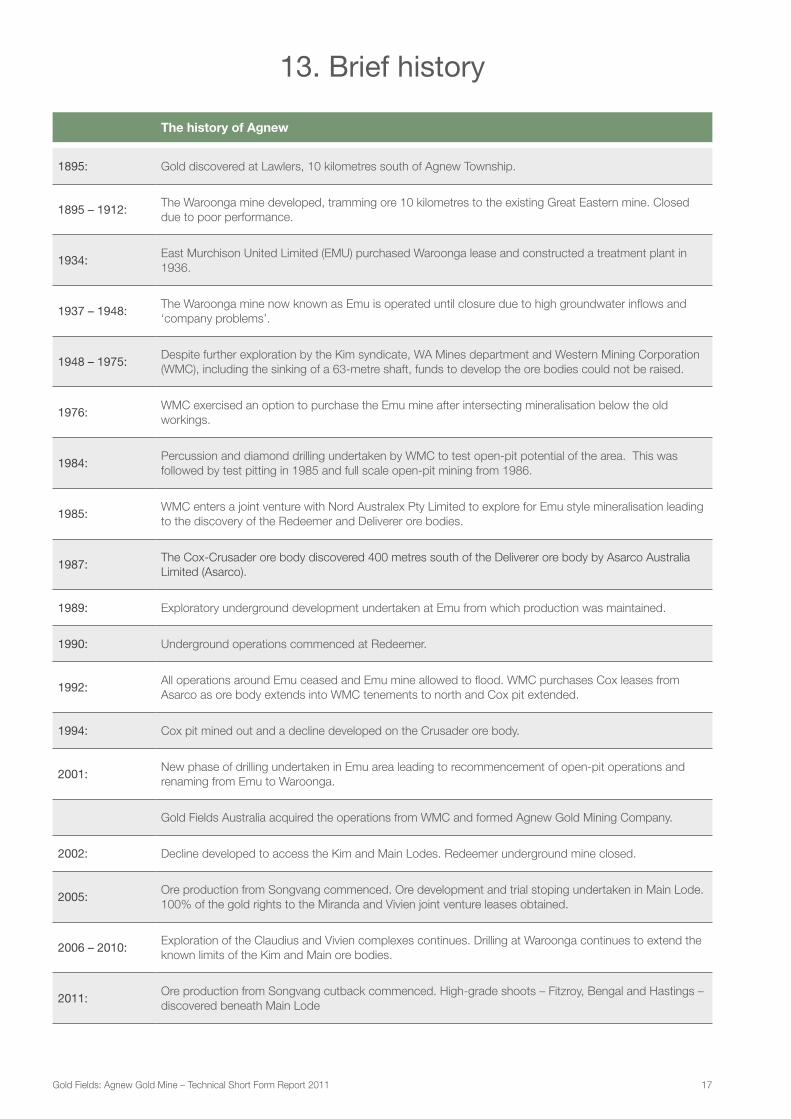
13. Brief history
The history of Agnew
1895: Gold discovered at Lawlers, 10 kilometres south of Agnew Township.
1895 – 1912:The Waroonga mine developed, tramming ore 10 kilometres to the existing Great Eastern mine. Closed
due to poor performance.
1934:East Murchison United Limited (EMU) purchased Waroonga lease and constructed a treatment plant in
1936.
1937 – 1948:The Waroonga mine now known as Emu is operated until closure due to high groundwater inflows and
‘company problems’.
1948 – 1975:Despite further exploration by the Kim syndicate, WA Mines department and Western Mining Corporation
(WMC), including the sinking of a 63-metre shaft, funds to develop the ore bodies could not be raised.
1976:WMC exercised an option to purchase the Emu mine after intersecting mineralisation below the old
workings.
1984:Percussion and diamond drilling undertaken by WMC to test open-pit potential of the area. This was
followed by test pitting in 1985 and full scale open-pit mining from 1986.
1985:WMC enters a joint venture with Nord Australex Pty Limited to explore for Emu style mineralisation leading
to the discovery of the Redeemer and Deliverer ore bodies.
1987:The Cox-Crusader ore body discovered 400 metres south of the Deliverer ore body by Asarco Australia
Limited (Asarco).
1989: Exploratory underground development undertaken at Emu from which production was maintained.
1990: Underground operations commenced at Redeemer.
1992:All operations around Emu ceased and Emu mine allowed to flood. WMC purchases Cox leases from
Asarco as ore body extends into WMC tenements to north and Cox pit extended.
1994: Cox pit mined out and a decline developed on the Crusader ore body.
2001:New phase of drilling undertaken in Emu area leading to recommencement of open-pit operations and
renaming from Emu to Waroonga.
Gold Fields Australia acquired the operations from WMC and formed Agnew Gold Mining Company.
2002: Decline developed to access the Kim and Main Lodes. Redeemer underground mine closed.
2005:Ore production from Songvang commenced. Ore development and trial stoping undertaken in Main Lode.
100% of the gold rights to the Miranda and Vivien joint venture leases obtained.
2006 – 2010: Exploration of the Claudius and Vivien complexes continues. Drilling at Waroonga continues to extend the
known limits of the Kim and Main ore bodies.
2011:Ore production from Songvang cutback commenced. High-grade shoots – Fitzroy, Bengal and Hastings –
discovered beneath Main Lode
Gold Fields: Agnew Gold Mine – Technical Short Form Report 2011 18
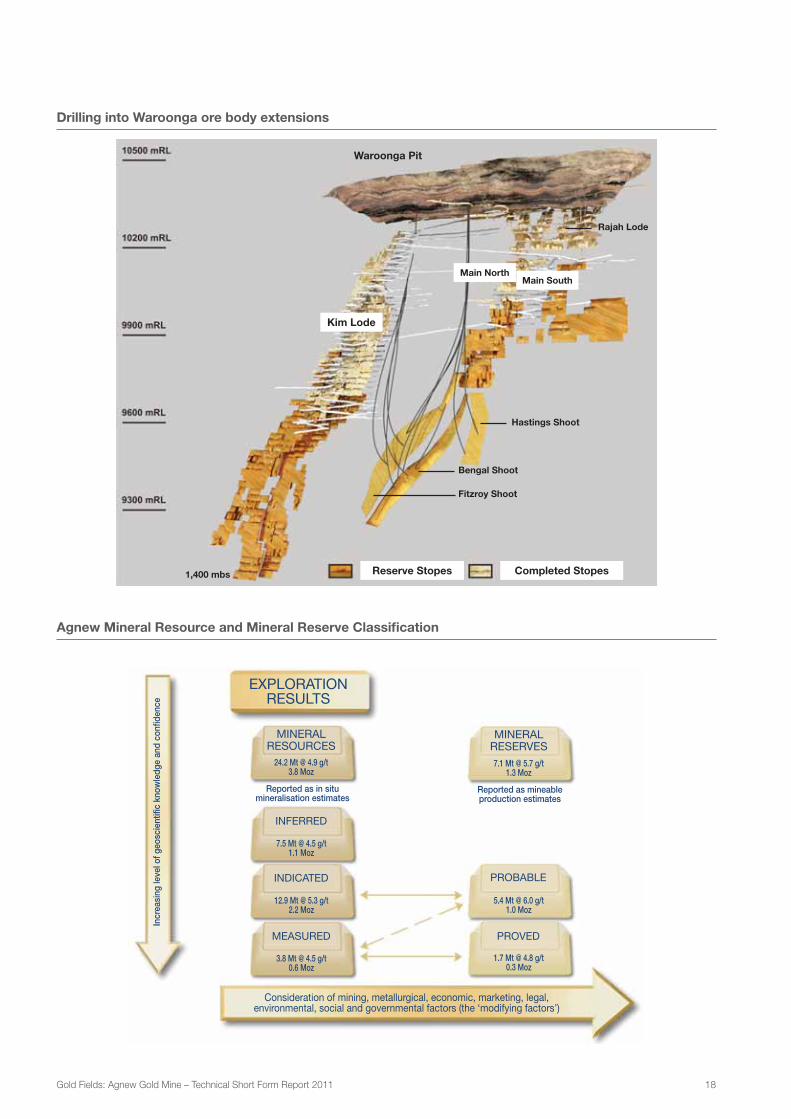
Agnew Mineral Resource and Mineral Reserve Classification
Drilling into Waroonga ore body extensions
EXPLORATIONRESULTS
MINERALRESERVES
MINERALRESOURCES
Reported as in situmineralisation estimates
Consideration of mining, metallurgical, economic, marketing, legal,environmental, social and governmental factors (the ‘modifying factors’)
24.2 Mt @ 4.9 g/t3.8 Moz
7.1 Mt @ 5.7 g/t1.3 Moz
5.4 Mt @ 6.0 g/t1.0 Moz
1.7 Mt @ 4.8 g/t0.3 Moz
7.5 Mt @ 4.5 g/t1.1 Moz
12.9 Mt @ 5.3 g/t2.2 Moz
3.8 Mt @ 4.5 g/t0.6 Moz
Reported as mineableproduction estimates
Incr
easi
ng le
vel o
f geo
scie
ntifi
c kn
owle
dge
and
confi
denc
e
MEASURED PROVED
PROBABLEINDICATED
INFERRED
1,400 mbs
Waroonga Pit
Main NorthMain South
Kim Lode
Reserve Stopes Completed Stopes
Hastings Shoot
Bengal Shoot
Fitzroy Shoot
Rajah Lode

19
Notes
Reso
urc
e c
onvers
ion d
rilling
at
Waro
ong
a C
om
ple
x
This Technical Short Form Report (“the Report”) contains information as at 31 December 2011 (“the Effective Date of this Report”). The
statements and information set out in this Report speak only as of the Effective Date of this Report. Shareholders and other interested and
affected parties are therefore urged to review all public disclosures made by Gold Fields after the Effective Date of this Report, as some of the
information contained in the Report may have changed or have been updated. Gold Fields does not undertake any obligation to update publicly
or release any revisions to statements and information set out in this Report to reflect events or circumstances after the Effective Date of this
Report or to reflect the occurrence of unanticipated events, unless obliged to do so pursuant to law or regulation. In such event, Gold Fields
does not undertake to refer back to any information contained in this Report.