ies webinar: the hidden value of complex payables
TRANSCRIPT

The Hidden Value of Complex Payables
Presenters: Patrick Jones, Product Management Director, Expense and Data Management and Britta Martinez, Senior Energy Analyst, both with Ecova
April 14, 2016
Today’s Goals
Understanding of the complexity of invoices Best practices for auditing Automation tools How to accurately create and hit budget targets Case study
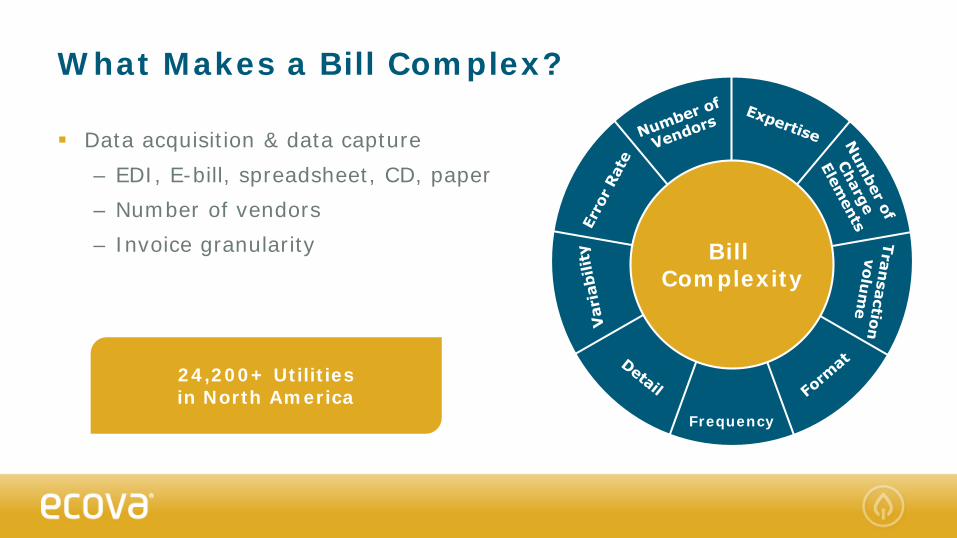
What Makes a Bill Complex?
Data acquisition & data capture– EDI, E-bill, spreadsheet, CD, paper– Number of vendors– Invoice granularity
Frequency
Bill ComplexityBill Complexity
24,200+ Utilities in North America

Frequency & Variability– Is receipt monthly, quarterly, yearly, fixed or variable?– What is the error rate for the vendor, industry, and type
of charge?– Are the price points fixed or variable?
Expense Expertise– How much industry knowledge is needed to audit the bills?– Are charge details simpler terms or complex with many acronyms?
Bill Complexity

Time Is Not on Your Side
The average time for companies to process a single invoice is 17.4-29.8 days
But the average due date on a utility bills is 21.5 days
Very little time to get everything done without really good processes & automation tools

Best Practices for Waste Bills
Waste costs have increased by 28% over the past decade Extra trip charges Duplicate charges Fuel charges Stray fees
Source: Bureau of Labor Statistics (BLS) 2014

Best Practices for Water & Energy Bills
Estimated meter reads Inaccurate consumption Incorrect unit price Errors in unit of measure Water leaks/sewer fees Stray fees

Best Practices for Telecom Bills
Price to contract errors Extra services Extra repair and installation charges Duplicate line and circuit charges Crammed charges Usage optimization

Automation Tools Are Here
Software automation can help simplify the complexity of invoice processing particularly in the areas that have repeatable predictable processes but also to simplify complex areas.
Benefits include: Efficiency gains Improved data quality Improve morale Ability to collect more data Cost savings
Decreased cycle time Data normalization Tracking and audit trail More time for value added activities

Automation Software Examples
Optical Character Recognition (OCR) Workflow tools that can replicate
and assist in process flows Big Data and analytic tools Reporting engines

BudgetingAdding complex payables to an already complex process

labo
r
mat
eria
ls
utili
ties
Budget Significance
Facility costs are a top operating expense Complexity of payables add challenges Internal external drivers Accuracy is critical
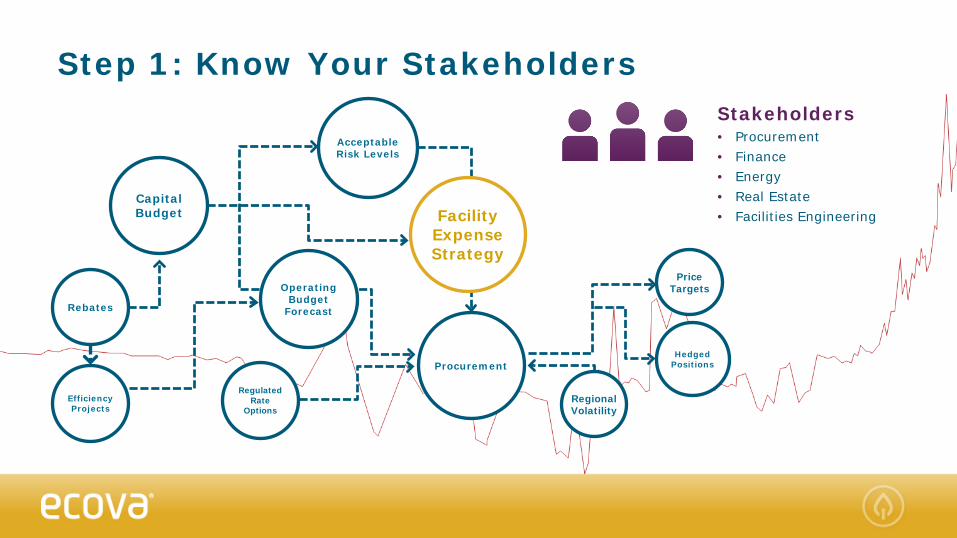
Step 1: Know Your StakeholdersStakeholders• Procurement• Finance• Energy• Real Estate• Facilities Engineering
CapitalBudget
Rebates
EfficiencyProjects
RegulatedRate
OptionsRegionalVolatility
HedgedPositions
Price TargetsOperating
BudgetForecast
Procurement
FacilityExpenseStrategy
Acceptable Risk Levels

Step 2: Create Your Baseline
Normalize data to fiscal calendar Pay attention to seasonality Review for anomalies and trends
0
5,000
10,000
15,000
20,000
25,000
USAGE
Budget
2015
2014
2013
2012
2011A Budget is Only as Good as the Data & Assumptions
That Lie Within It
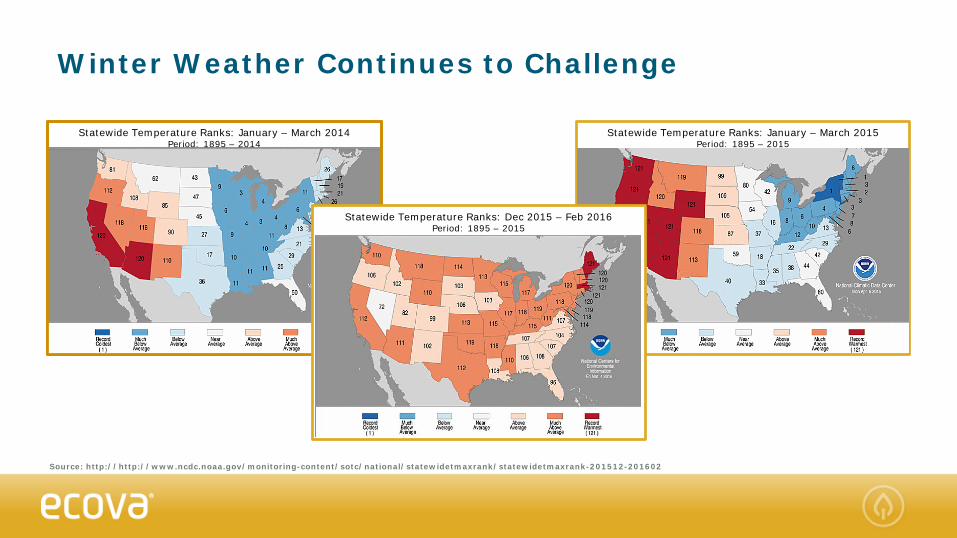
Winter Weather Continues to Challenge
Source: http://http://www.ncdc.noaa.gov/monitoring-content/sotc/national/statewidetmaxrank/statewidetmaxrank-201512-201602
Statewide Temperature Ranks: January – March 2014Period: 1895 – 2014
Statewide Temperature Ranks: January – March 2015Period: 1895 – 2015
Statewide Temperature Ranks: Dec 2015 – Feb 2016Period: 1895 – 2015

Include Market Influencers & Regional Intelligence
Wholesale markets are volatile Trends in Natural Gas, pipeline
expansion and decommissioning of coal and nuclear power plants affect regional pricing
Infrastructure changes/upgrades at the vendor
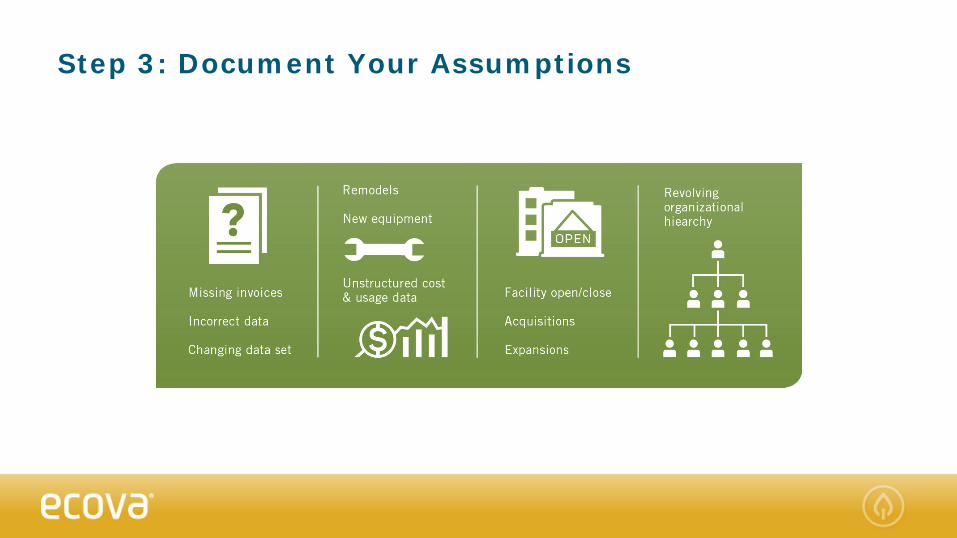
Step 3: Document Your Assumptions

Case Study: Data Acquisition/Budgeting
ABC Corporation AP department strained Frequently missed invoices, resulting in
“shut offs” Late fees were 8% of utility spend Pay invoices as received, lacked critical
expertise and technology to audit or optimize Large variances in budget causing missed
financial goals

Upcoming Webinars
INSIDE ENERGY & SUSTAINABILITY Starving the Landfill: Food Waste 201 – April 26th, 11A PST
Q2 Energy Outlook – May 12th, 11A PST

Q&A

Thank You!