ieee transactions on nuclear science, vol. 59, no. 4, …members.noa.gr/anastasi/papers/b35.pdf ·...
TRANSCRIPT
IEEE TRANSACTIONS ON NUCLEAR SCIENCE, VOL. 59, NO. 4, AUGUST 2012 1105
Unfolding and Validation of SREM FluxesI. Sandberg, I. A. Daglis, A. Anastasiadis, P. Bühler, P. Nieminen, and H. Evans
Abstract—The Standard Radiation Environment Monitor(SREM) belongs to a second generation of instruments in aprogram established by the European Research and TechnologyCentre of the European Space Agency (ESA) to provide minimumintrusive particle radiation detectors on ESA spacecraft for spaceweather applications, which are also suitable for scientific investi-gations.SREM detects high-energy electrons and protons and bins the
measurements in fifteen counters characterized by overlapping en-ergy bands, resulting in the appearance of strong correlation andcontamination effects among the binned count-rates.In this work a novel method to unfold measurements of SREM,
i.e., to convert SREM counts to fluxes, is presented. The method isbased on the derivation ofmultiple solutions of the inverse problemover various proton and electron energy ranges using the powerfultechnique of the Singular Value Decomposition (SVD).Results and validation studies for measurements of Solar Ener-
getic Particle Events are also presented.
Index Terms—Deconvolution, inverse problems, protons, radia-tion monitoring, semiconductor radiation detectors, solar system,space charge, sun.
I. INTRODUCTION
T HE ESA Standard Radiation Environment Monitor(SREM) [1] belongs to a second generation of instru-
ments in a program established by the European Research andTechnology Centre of the European Space Agency (ESA) toprovide minimum intrusive particle radiation detectors on ESAspacecraft for space weather applications. SREM units mon-itor the radiation environment and provide suitable functionsrelated to hazard for the host spacecraft and its payload. Analarm flag can be set whenever high radiation levels are reachedduring the spacecraft’s orbit and the payload instruments mayreact accordingly entering, if necessary, in a special safe modethat protects them from possible radiation damages.SREM was designed to measure electrons with energiesMeV and protons with energies MeV with fair
spectral and angular resolution. Seven SREM units have been
Manuscript received September 15, 2011; revised January 13, 2012; acceptedFebruary 01, 2012. Date of publication March 02, 2012; date of current versionAugust 14, 2012.I. Sandberg, I. A. Daglis, and A. Anastasiadis are with the Institute for Space
Applications and Remote Sensing, National Observatory of Athens, 152 36 Pen-teli, Greece (e-mail: [email protected]; [email protected]; [email protected]).P. Bühler is with the Paul Scherrer Institute, 1130 Vienna, Austria (e-mail:
[email protected]).P. Nieminen and H. Evans are with the ESTEC, European Space Agency,
2200 AGNoordwijk, The Netherlands (e-mail: [email protected]; [email protected]).Color versions of one or more of the figures in this paper are available online
at http://ieeexplore.ieee.org.Digital Object Identifier 10.1109/TNS.2012.2187216
already launched on-board STRV-1C, Proba-1, INTEGRAL,Rosetta, GIOVE-B, Herschel and Planck spacecraft.SREM consists of three silicon detectors. As charged parti-
cles traverse the Si crystal, they interact with the valence bandelectrons and promote them to the conduction band, where thecarriers are free to move in response to an externally appliedelectric field. The resulting current, which is proportional to theenergy loss of the incident particles is fed into a charge-sensitivepre-amplifier that converts it into a voltage pulse. The pre-am-plified pulses are scrutinized by fast comparators, and countedinto 15 detector channels. Each channel has its own character-istic proton and electron energy response. As a consequence ofthis scheme, proton and electron events counted in each channelare mixed. In addition, events recorded in high-energy channelsappear also in channels with lower energy thresholds.SREM provides reliable measurements for characterization
of space radiation environment [2]–[4]. However, in all previousstudies based on SREM data the environment was described ei-ther in terms of SREM count-rates or in terms of particle fluxesin rather wide energy windows. This is attributed to the reasonthat the SREM counts to flux calculation is not trivial as theassociated inversion is unstable. There are several conversionmethods that have been considered which provide a first esti-mate on the fluxes. A standard approach is to assume a para-metric form for the particle fluxes and apply standard minimiza-tion techniques, such as the maximum likelihood or the leastsquares fit, to estimate the values of the free parameters. How-ever, this method is limited since it requires an assumption of thespectral form and as a consequence it can provide successful re-sults only when the assumed spectral form fits to the measuredspectra. The simple conversion factor (SCF) method is based onthe mean of the integral transform of the response function witha sampling of space environment spectra [3]. This method is ap-plicable only for count-rates attributed solely to a single particlespecies, i.e., protons or electrons, and allows a fast estimationof the fluxes within the wide sensitivity energy ranges of SREMcounters.For the efficient conversion of SREM counts to charged par-
ticle fluxes with high spectral resolution we have developed anovel method. The method is based on the Singular Value De-composition (SVD) technique but includes additional schemesthat permits the derivation of smooth and hard spectrum overlarge energy ranges. In order to validate the results of the devel-oped method, we have unfolded several SREM measurementsfrom the unit on board INTEGRAL associated with measure-ments of Solar Energetic Particle Events (SEPEs) and comparedthem with the Solar Energetic Particle Environment Modelling(SEPEM) dataset [5] which includes well-processed, inter-cali-brated, cleaned dataset of SEPEs based on measurements fromdifferent scientific instruments. The comparisons indicate that
0018-9499/$31.00 © 2012 IEEE

1106 IEEE TRANSACTIONS ON NUCLEAR SCIENCE, VOL. 59, NO. 4, AUGUST 2012
TABLE ILIST OF THE SREM CHANNELS AND THE CORRESPONDING ENERGY RANGES
OF DETECTED PROTONS AND ELECTRONS [3]
the developed method is rather successful and allows the recon-struction of reliable proton spectra with the highest spectral res-olution compared to all available methods used for SREM dataso far.
II. CHARACTERISTICS OF THE SREM INSTRUMENT
The SREM unit consists of three silicon diode detectors (D1,D2 and D3) in a two-detectors-head configuration. One systemis a single silicon diode detector (D3) and the other systemuses two silicon diodes (detectors D1/D2) one after the other,in a co-axial configuration (detector telescope configuration).Each SREM unit is contained in a box of 20 12 10 cm andweighs 2.6 kg.The aperture of the detector has an opening angle of
. However, ultra high energy particles may pen-etrate from any direction. For the coincidence counters theacceptance is essentially restricted by the aperture. The detectorelectronics are capable of processing a detection rate of 100kHz with dead-time correction below 20%. The main entranceof the D3 window is covered with 0.7 mm aluminum layer,which defines the lower energy threshold for electrons to
MeV and for protons to MeV. The D1/D2detector is covered with a 2 mm aluminum layer giving aproton and electron threshold of 20 and 1.5 MeV, respectively.The diodes of the telescope configuration are separated by a1.7-mm-thick aluminum and 0.7 mm thick tantalum layer. Inaddition, the shielding between the two diodes in the telescopeprevents the passage of electrons. However, protons with ener-gies greater than 43 MeV go through, depositing energy in bothdetectors. Thus, using the two diodes in coincidence gives pureproton count-rates. All pre-amplified detector pulses are scru-tinized by a set of fifteen fast comparators (channels)—elevenfor single events and four for coincidences—providing energyspectral information (Table I). SREM channels identify particleenergies by the energy deposited in the detector.SREM has been calibrated with protons at the Proton Irradi-
ation Facility (PIF) of the Paul Scherrer Institute and electronsfrom radioactive sources such as and [6]. In addi-tion. the measurements were simulated with the Monte Carlocode GEANT3 from CERN [7] and a good agreement between
Fig. 1. The SREM unit on-board the INTEGRAL mission.
Fig. 2. The proton (left column) and the electron (right column) response func-tions of the INTEGRAL/SREMunit for the D1, D1/D2 andD3 groupof counters.
measurements and simulations was found. The response ma-trix for each SREM unit has been derived by simulationsof omni-directional fluxes of electrons and protons using theGEANT SREM model which was supplemented with a massmodel of the corresponding host spacecraft. In Fig. 2, we presentthe response functions for the INTEGRAL/SREMunit [8].The minimum energy in the “total count-rate” channels of de-
tectors 1 and 3 (TC1 and TC3) correspond to the threshold pen-etration of the shields. All the channels are sensitive to protons,while the coincidence channels C1-C4, S25 and the S15 canbe considered as pure proton channels (see Table I). However,in the presence of high-energy electrons (with energies above
MeV) also S15 and C4 can be contaminated by electroncounts. Obviously, there are no pure electron channels. Note,
SANDBERG et al.: UNFOLDING AND VALIDATION OF SREM FLUXES 1107
that unlike spectrometers, which are able to measure incidentspectra in narrow distinct energy intervals, SREM samples thespectra in broad and overlapping energy bands; e.g., channelsTC1, S12 and S12 (or TC3, S32, S33 and S34). As a conse-quence, the count-rates of the channels are strongly dependenton each other; e.g., counts in S15 are also counted in S14, S13,S12 and TC1.
III. UNFOLDING SREM COUNTS
The measured count-rates in SREM counter ,are given by the sum
(1)
where each term of the sum is attributed to the incident protonand electron fluxes. Here, denotes the omni-directionalfluxes in cm MeV units and the corre-sponding response function for , . The calculation of
requires the inversion of (1). This equation is a Fredholmintegral equation of the first kind and is a classical example ofan ill-posed problem as its solution is not unique and nota continuous function of the counts .If we consider a step function form for the charged particle
fluxes, and discretize into the proton (electron) flux andenergy levels the integral equation takes the form of a linearsystem of equations which can be written in the following ma-trix form . Here is a vector containing the mea-sured count-rates, is a vector containing the
values of the unknown differential fluxesand contains the elements of the response ma-trix for the selected energy bins.The measured fluxes change by several orders of magnitude
over the range of energies covered by the SREM device. Thus, alogarithmic binning is applied to the proton and electron energyranges. The averaged values of the response matrix are consid-ered, which are calculated via a numerical integration within theenergy range of each bin. Errors attributed to the discretizationof the energies and to the uncertainties of the calculated responsefunctions are not taken into account.In order to give equal weight to all equations of the linear
system , we rescale the individual equations ac-cording to their statistical significance by dividing the elementsof and with the square root of the associated count-rate.This transformation preserves the form of the system of equa-tions leaving the unknown vector unchanged. For the sake ofsimplicity, the same notations to the untransformed system arekept.The linear system can be numerically solved and the flux
levels can be estimated. However, such a system of equationsbelongs to the class of discrete ill-posed problems which areunstable against small variations due to the limited resolutionof the detector and the uncertainties of the measurements.As a consequence its numerical solution is widely oscillating(presents large variations of fluxes in neighboring energy bins)and may receive unphysical negative values for particle fluxes.There are various techniques that are being used, e.g., in the
field of high energy particle physics [9], allowing unfolding offolded distributions from (1).In what follows, we present an unfolding method which uses
the efficient and fast semi-analytical approach presented in [10]as a starting point. However, the direct application of this ap-proach for the unfolding of SREM data is not successful due tothe strongly overlapping energy bands, the electron-proton con-tamination effects and the fact that the measured spectra decayover logarithmic scales.
A. SVD Approach to Data Unfolding
In order to avoid the oscillatory behavior of the numericalsolution of equation , we follow the work of [10],and we consider the following regularized system of equations
(2)
which introduces a regularisation condition through the inclu-sion of the matrix that allows the solution to be smooth,with small bin-to-bin variation. The regularisation mini-mizes a priori the curvature—defined here as the differencein the derivatives between two successive energy bins, i.e.,
. As a consequence the unwantedoscillations are suppressed.Matrix has non-zero elements only in the main and the
first diagonals: , , for , . Thefirst columns regularize the proton flux levels, while the last
columns regularize the electron flux levels. For the edgepoints of the proton and the electron spectra the curvature cannotbe defined and the suppression of large differences
is required instead by setting, , for , and ,
, for , since the protonand electron spectra are independent functions. The parameterdetermines the relative weight of the regularisation condition
and is termed as the regularisation parameter.The regularized system of equations can be solved using basic
properties of the Singular Value Decomposition (SVD) tech-nique. The decomposition of the productinto its left , right singular vec-tors, and the diagonal singular value matrix (withpositive diagonal elements in descending order) permits theanalytic expression of the solution of the regularized equationsin the following form [10]:
(3)
It should be noted that the matrix is degenerate and cannotbe inverted. Thus, a small numerical value 0.001 has been addedto the non-zero elements of prior to its numerical inversion.Note, that the covariance matrix of the solution can be con-
sistently calculated and is given [10] by
(4)
providing the corresponding error estimates (error bars).
1108 IEEE TRANSACTIONS ON NUCLEAR SCIENCE, VOL. 59, NO. 4, AUGUST 2012
The rank of the system (2) is actually equal to the numberof significant singular values. The regularized solution maysuppress the unwanted unphysical oscillatory depending on thevalue of the parameter with respect to . For theimpact of the regularisation is negligible, and as a consequencethe solutions remain oscillatory and thus unacceptable. For
the solutions get over-smoothed leading to a largebias. As it can be seen from (3) physically meaningful valuesof belong in the interval . However, only aproper selection of may regularize the singularities—small’s—which appear for large values of index acting as a
cut-off low pass Fourier filter.There have been several suggestions for the optimum selec-
tion of the regularisation parameter. For histograms with largenumber of bins and smooth distributions, the effective rank ofthe system can be estimated graphically and used as an op-timum choice for the regularisation parameter, , pro-viding smooth solutions with a sufficiently small bias [10]. Wehave tested the suggestions presented in the papers by [10] and[11] using SREMmeasurements associated to SEPEs. However,the derived spectra were unphysical, as they were receivingeither negative values or they were strictly monotonically in-creasing. In the majority of all the studied cases, it turns out thatthe minimum regularisation parameter that can provide positiveand smooth spectra through (3) receives values within intervalsbounded by the largest squares of the singular values . As aconsequence, the regularized solution is expected to be signifi-cantly suppressed according to (3). The relatively large value ofthe minimum regularisation parameter reflects the large degen-eration degree of the particular inverse problem attributed to thecharacteristics of the response of SREM units.Any rescaling of the unknown equations that changes the
distribution of the singular values of the system might lead tobetter estimates for the spectra. In reference [10] it is proposedthat the response matrix should be rescaled with the expectedvalues of the solutions—as calculated independently throughMonte Carlo (MC) simulations studies. However, MC simula-tions for the unfolding of a continuous flow of SREM data at-tributed to events of different size and characteristics is not pos-sible. Since we expect the flux levels to decrease in logarithmicscales with energy, we have selected to re-scale the regularisa-tion matrix by multiplying its elements with the width of thecorresponding energy bins. In this case, the bin-to-bin variationsin the regularized solutions are smoothed-out by suppressing acurvature defined here by
.For the selection of , we perform a scanning in the range
and choose as optimum value the smallest thatprovides positive and decaying values of the differential spectrafor the first out of discrete proton(electron) energy levels. The right edge , 2 flux levelsin the spectrum may present significant oscillations due to in-sufficient edge regularisation and/or due to the relatively poorstatistics. Thus, we do not include them in the selection criteriaof in order to decrease the suppression of the overall solution.The particular selections in the regularisation scheme turn tobe rather useful as they permit us to derive smooth spectra thatreconstruct sufficiently the measured count-rates. However, the
selection of the total proton and electron energy ranges turn tobe rather essential parameters for the hardness of the derivedspectra.
B. The Selection of Energy Ranges
A natural choice for the selection of the total proton and elec-tron energy range for the spectra to be unfolded would be thedetection energy ranges of SREM units. However, the selectionof a wide energy range—with respect to the characteristic en-ergy of the true spectrum—may lead to significant suppressionat the low energy flux levels of the derived spectrum as a re-sult of the regularisation over (wide) energy ranges that mighthave relatively insufficient contribution to the total number ofthe measured count-rates per counter. This is particularly truefor hard proton spectra and especially for the proton countersthat present a local maximum in their response function before
MeV (cf. Fig. 2). On the contrary, the selectionof a relatively narrow energy range for the electron spectrummay lead to the derivation of an erroneous proton spectrum asa significant part of the measured count-rates originated fromincident electrons within the excluded energy ranges may be at-tributed to the protons.It is evident that the selection of the total proton and elec-
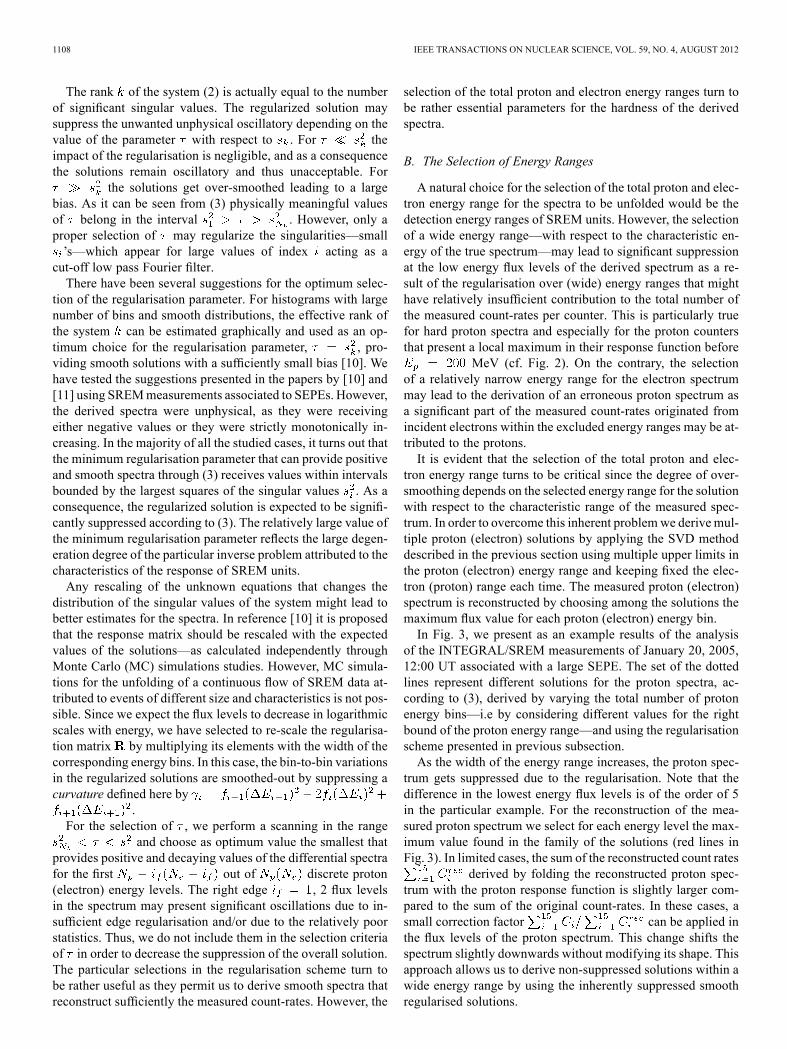
tron energy range turns to be critical since the degree of over-smoothing depends on the selected energy range for the solutionwith respect to the characteristic range of the measured spec-trum. In order to overcome this inherent problemwe derivemul-tiple proton (electron) solutions by applying the SVD methoddescribed in the previous section using multiple upper limits inthe proton (electron) energy range and keeping fixed the elec-tron (proton) range each time. The measured proton (electron)spectrum is reconstructed by choosing among the solutions themaximum flux value for each proton (electron) energy bin.In Fig. 3, we present as an example results of the analysis
of the INTEGRAL/SREM measurements of January 20, 2005,12:00 UT associated with a large SEPE. The set of the dottedlines represent different solutions for the proton spectra, ac-cording to (3), derived by varying the total number of protonenergy bins—i.e by considering different values for the rightbound of the proton energy range—and using the regularisationscheme presented in previous subsection.As the width of the energy range increases, the proton spec-
trum gets suppressed due to the regularisation. Note that thedifference in the lowest energy flux levels is of the order of 5in the particular example. For the reconstruction of the mea-sured proton spectrum we select for each energy level the max-imum value found in the family of the solutions (red lines inFig. 3). In limited cases, the sum of the reconstructed count rates
derived by folding the reconstructed proton spec-trum with the proton response function is slightly larger com-pared to the sum of the original count-rates. In these cases, asmall correction factor can be applied inthe flux levels of the proton spectrum. This change shifts thespectrum slightly downwards without modifying its shape. Thisapproach allows us to derive non-suppressed solutions within awide energy range by using the inherently suppressed smoothregularised solutions.

SANDBERG et al.: UNFOLDING AND VALIDATION OF SREM FLUXES 1109
Fig. 3. Estimation of proton spectra (red lines) using the SVD solutions fordifferent energy windows (black dotted lines). The flux levels derived with theSCF method (green lines) and from the SEPEM proton dataset (blue lines) areplotted for comparison.
The green and the blue lines in Fig. 3 denote the flux levelsderived using the SCF method [3] and the associated SEPEM[5] dataset values interpolating at the INTEGRAL/SREM mea-surements times. It is evident that the level of agreement withthe reconstructed spectrum is much better compared to any ofthe individual solutions.
IV. RESULTS AND COMPARISONS
In the following, we present results of the method describedabove using very large datasets of INTEGRAL/SREMmeasure-ments associated with two of the largest sequence of SEPEs thatoccurred during the last solar cycle. In order to validate our find-ings, we have performed extensive comparisons with SEPEMdataset [5].In Fig. 4, we present the INTEGRAL/SREM count rates as-
sociated to the large SEPEs that took place during January 2005.The enhancements in the measurements just before January 19and 22 are attributed to the crossings of spacecraft through theouter Radiation Belt. Using the steps described in the previoussection we have calculated the charged particle fluxes based onthe SREM measurements presented in Fig. 4 and using the IN-TEGRAL/SREM response function (cf. Fig. 2). The total protonenergy was ranging up to 400 MeV and was logarithmicallysplit to , while the selected total electron rangewas ranging up to 15 MeV and was logarithmically binned to
values.A necessary condition that should be hold for a successful
evaluation of the derived fluxes is the agreement betweenthe measured and the reconstructed count-rates. The latterones can be calculated by folding the derived fluxes withthe response matrix according to (1). In Fig. 5, we present acomparison between the count-rate datasets by using a scatterplot of 7277 15 out of 9473 15 points for the fifteen SREMcounters.The missing points include (manually extracted) measure-
ments within the Radiation Belts and measurements charac-terized by low intensity. For the characterization of low in-
Fig. 4. Measurements of INTEGRAL/SREM for the January 2005 SEPEs,versus the Days of Year (DOY) 2005.
Fig. 5. Reconstructed count-rates derived by folding the SVD based derivedfluxes for the January 2005 SEPEs with the INTEGRAL/SREM response matrixfunction versus the measured ones.
tensity we have set as a threshold the omni-differential protonflux not to exceed the MeV cm within the energybin MeV which is logarithmically centered at 12.6MeV. Note, that this filtering criterion has been applied to allthe scatter plots presented throughout this paper.In Fig. 6, we present the unfolded proton flux series interpo-
lated at the logarithmic centers of the proton energy bins usedin the SEPEM dataset. The proton flux series of the SEPEMdataset are presented in Fig. 7.Before proceeding to the comparisons between the derived
fluxes and the SEPEM dataset one it is necessary to verify thatthe SREM/INTEGRAL count-rate dataset matches well withthe SEPEM flux dataset. This can be achieved independentlyfrom the counts to flux inversion method by comparing the IN-TEGRAL/SREM data with the SEPEM/SREM count-rates de-

1110 IEEE TRANSACTIONS ON NUCLEAR SCIENCE, VOL. 59, NO. 4, AUGUST 2012
Fig. 6. The SVD-derived INTEGRAL/SREM proton flux series interpolated atselected SEPEM energy bins for the January 2005 SEPEs.
Fig. 7. Proton flux series of the SEPEM dataset for the January 2005 SEPEsfor proton energies above 10 MeV.
rived by interpolating the SEPEM fluxes at INTEGRAL/SREMmeasurements times and folding the resulted SEPEM fluxeswith the SREM response function. In Fig. 8 we present a scatterplot which shows a consistency between the count-rate datasets.Since the SEPEM/SREM counts are attributed solely to protonfluxes it is easy to conclude that the electron contribution (out-side the filtered Radiation Belts) in the SREM data for the par-ticular event is not dominant.Provided the association of the measured count-rates with
both reconstructed INTEGRAL/SREM (cf. Fig. 5) and SEPEM/SREM count-rates (cf. Fig. 8) it is meaningful to perform thecomparison between the unfolded and the SEPEM proton fluxesusing the scatter plot presented in Fig. 9.
Fig. 8. Scatter plot of INTEGRAL/SREM versus SEPEM/SREM count-ratesfor the January 2005 SEPEs.
Fig. 9. Scatter plot of INTEGRAL/SREM and SEPEM proton fluxes for theJanuary 2005 SEPEs.
It should be noted that the band covered by the count-ratescatter plot in Fig. 8 (which involves folded distributions) iswider compared to that of the associated proton fluxes scatterplot in Fig. 9 (which involves unfolded distributions). Onewould expect the opposite since the errors and uncertaintiesattributed to the unfolding method are much larger compared tothe folded distributions—which are guaranteed by constructionto have small residuals. This indicates that the differences inthe count-rate scatter plot (Fig. 8) can be partially attributedto uncertainties in the measurements and/or to the responsefunction of individual SREM channels. Moreover, in contrastto the SEPEM counts, a fraction of the SREM counts in Fig. 8can be due to the incident electron fluxes. Remarkably, theunfolding procedure for the proton fluxes smears out theseeffects and despite the uncertainties of the inversion methodthe band covered by the scatter plot of proton fluxes in Fig. 9 isrelatively smaller than that of Fig. 8. The consistency between

SANDBERG et al.: UNFOLDING AND VALIDATION OF SREM FLUXES 1111
Fig. 10. Count-rates of INTEGRAL/SREM for the sequence of Oc-tober-November 2003 SEPEs, versus the Day of Year (DOY) 2003.
the proton flux datasets verifies both the results of the methodand the method per se at least for the unfolding of proton fluxesin proton dominated radiation environments.The sum of the reconstructed proton count-rates exceeded the
sum of the measured ones in 2165 out of the 7277 unfoldedspectra. In all cases the difference was slight and a factor ofabout 0.8–1 was applied to match the sum of the measuredcount-rates. In the rest of the cases, the sum of the reconstructedproton count-rates was less than the sum of the measured ones.The difference is presumably attributed to count-rates triggeredby incident electron fluxes. Taking into account that the de-rived proton fluxes are consistent with the SEPEM fluxes, onecan conclude that the contribution of the electron count-rates inthese cases is not dominant.In what follows, we briefly present some results using similar
analysis for the measurements of the INTEGRAL/SREM unitduring the occurrence of the multiple October-November 2003SEPEs. In Fig. 10 we present themeasurements by INTEGRAL/SREM, in Fig. 11 the unfolded proton flux series derived bythe developed method and interpolated at SEPEM characteristicenergies, and finally a comparison plot with the SEPEM datasetis presented in Fig. 12. This scatter plot contains 11429 8 outof the 22281 8 points for the eight proton flux levels. Note,that a small correction factor of about was applied to3352 out of the 11429 unfolded spectra in order to match thetotal number of the reconstructed count-rates with the measuredones. The derived proton fluxes are consistent with the SEPEMdataset for this sequence of SEPEs as well.In order to provide additional quantitative comparison be-
tween the derived fluxes and SEPEM fluxes, we have calculatedthe sum for each proton energy bin.The summation is performed over the considered flux series forthe selected SEPEs presented in Figs. 9 and 12. It is expectedthat themeasured fluxes will present differences attributed to thedifferent orbits of the spacecraft and the spatial complexity ofthe evolving in time solar energetic particle fluxes. In Table II
Fig. 11. The SVD-derived INTEGRAL/SREM proton flux series for the se-quence of October-November 2003 SEPEs interpolated at SEPEM energy bins.
Fig. 12. Scatter plot between the unfolded and the SEPEM proton fluxes forthe sequence of October-November 2003 SEPEs.
we present the values of the total fluxes of each event at dif-ferent energy windows. The values between the datasets are invery good agreement with each other, considering the uncer-tainties of the measurements and the errors associated with theprocessing of both datasets.In summary, we have compared about 20000 unfolded IN-
TEGRAL/SREM proton flux spectra of SEPEs with associatedspectra extracted from the SEPEM dataset. The comparativescatter plots indicate a very good agreement between thedatasets. This finding shows that proper analysis of SREM datalead to the derivation of high energy proton fluxes of similarreliability with other processed datasets based on scientificinstrument measurements.
V. THE SOLAR ENERGETIC PARTICLE FLUX TOOL
Using the method described above, we have developed aweb-based tool which provides solar energetic proton flux se-

1112 IEEE TRANSACTIONS ON NUCLEAR SCIENCE, VOL. 59, NO. 4, AUGUST 2012
TABLE IITOTAL FLUXES cm
ries based on SREM data to the space scientific and engineeringcommunity. The Solar Energetic Proton Flux (SEPF) [12] tooldisplays results from various locations in space through theanalysis of multi-point count-rate measurements of SREMunits on-board INTEGRAL, Herschel, Planck, and Rosetta.The SEPF tool downloads SREM data [1], calculates the differ-ential proton fluxes using the scheme presented in Section IIIand publishes the latest results for the current year and themost recent week on a daily basis. The fact that the developedmethod is linear, enables the SEPF tool to provide results in fasttimes. The unfolding of a single set of data requires time lessthan 0.2 sec in a PC with a moderate single CPU. The SEPFtool has been developed and is operated by the Institute forSpace Applications & Remote Sensing, National Observatoryof Athens (http://proteus.space.noa.gr/sepf_tool/).
VI. CONCLUSION
A novel method for the calculation of reliable proton fluxesusing measurements from SREM units was presented. The de-rived results:• exhibit enhanced spectral resolution;• successfully reconstruct the original SREM count-rates;• are in very good agreement with processed datasets basedon scientific instruments.
The proposed method provides to the scientific communitya simple approach for the solution of a rather ill-defined classof inverse problems. It should be stressed, that the validity ofthe method has been confirmed so far for SREM proton fluxesmeasured in radiation environments where electron count-ratesdo not dominate.The described method permits also the characterization of the
SREMmeasurements, i.e., if they correspond to a proton or to anelectron dominated environment. Using measurements duringSEPEs and spacecraft crossings through proton and electron ra-diation belts, we have verified (not shown here) that the ratio be-tween the sums of reconstructed proton and electron count-rates
(for the D1 and D3 set of counters) provides a reliable indexfor the characterization of SREM measurements. However, itshould be noted that further studies and a suitable electron ref-erence dataset would be required for the validation of the de-veloped unfolding method in electron dominated environments,since the electron response matrix of SREM units has differentcharacteristics than that of protons.The application of the proposed method permits the ex-
traction of reliable proton flux series from the SREM unitson-board ESA spacecraft on different orbits (LEO, MEO,IP and L2 point), which encounter different radiation envi-ronments. The construction of a solar energetic proton fluxdatabase using the measurements of multiple SREM units isexpected to provide new insights in the studies of the propertiesof SEPEs.
ACKNOWLEDGMENT
The authors would like to thank the SEPEM project http://sepem.aeronomie.be/ for providing access to the SEPEM appli-cation server.
REFERENCES
[1] SREM. [Online]. Available: http://srem.web.psi.ch/[2] A. Mohammadzadeh, E. Evans, P. Nieminen, E. Daly, P. Vuilleumier,
P. Bühler, C. Eggel, W. Hajdas, N. Schlumpf, A. Zehnder, J. Schneider,and R. Fear, “The ESA Standard Radiation Environment Monitor Pro-gram first results from PROBA-1 and Integral,” IEEE Trans. Nucl. Sci.,vol. 50, no. 6, pp. 2272–2275, 2003.
[3] H. D. R. Evans, P. Bühler, W. Hajdas, E. J. Daly, P. Nieminen, and A.Mohammadzadeh, “Results from the ESA SREM monitors and com-parison with existing radiation belt models,” Adv. Space Res., vol. 42,pp. 1527–1537, 2008.
[4] A. Hajdas, P. Bühler, C. Eggel, P. Favre, A. Mchedlishvili, andA. Zehnder, “Radiation environment along the INTEGRAL orbitmeasured with the IREM monitor,” Astro. Astrophys., vol. 411, pp.L43–L47, 2003.
[5] Solar Energetic Particle Environment Modelling Dataset. [Online].Available: http://dev.sepem.oma.be/
[6] W. Hajdas, A. Zehnder, L. Adams, and B. Nickson, “The proton irra-diation facility at the Paul Scherrer Institut.,” Nucl. Instrum. MethodsPhys. Res. B, vol. 113, pp. 54–54, 1996.
[7] S. Agostinelli, J. Allison, and K. Amako, “GEANT4—A simulationtoolkit,” Nucl. Instrum. Methods Phys. Res. A, vol. 506, no. 3, pp.250–303, 2003.
[8] Communication with Dr. Laurent Desorgher. [email protected],Space-IT GmbH, CH-3012 Bern, Switzerland.
[9] G. Cowan, Statistical Data Analysis. Oxford, U.K.: Oxford Univ.Press, 1998.
[10] A. Höcker and V. Kartvelishvili, “SVD approach to data unfolding,”Nucl. Instrum. Methods Phys. Res., vol. A 372, pp. 469–481, 1996.
[11] P. C. Hansen and D. P. O’Leary, “The use of L-curve in the regulari-sation of discrete ill-posed problems,” SIAM J. Sci. Comput., vol. 14,pp. 1487–1503, 1996.
[12] Solar Energetic Particle Flux Tool. [Online]. Available: http://proteus.space.noa.gr/sepf tool/