ieee transactions on knowledge and data engineering … · users in online services, such as...
TRANSCRIPT

arX
iv:1
308.
1817
v1 [
cs.M
M]
8 A
ug 2
013
IEEE TRANSACTIONS ON KNOWLEDGE AND DATA ENGINEERING 1
Semantic Computing of Moods Based on Tagsin Social Media of Music
Pasi Saari and Tuomas Eerola
Abstract—Social tags inherent in online music services such as Last.fm provide a rich source of information on musicalmoods. The abundance of social tags makes this data highly beneficial for developing techniques to manage and retrieve moodinformation, and enables study of the relationships between music content and mood representations with data substantiallylarger than that available for conventional emotion research. However, no systematic assessment has been done on the accuracyof social tags and derived semantic models at capturing mood information in music. We propose a novel technique called AffectiveCircumplex Transformation (ACT) for representing the moods of music tracks in an interpretable and robust fashion based onsemantic computing of social tags and research in emotion modeling. We validate the technique by predicting listener ratings ofmoods in music tracks, and compare the results to prediction with the Vector Space Model (VSM), Singular Value Decomposition(SVD), Nonnegative Matrix Factorization (NMF), and Probabilistic Latent Semantic Analysis (PLSA). The results show that ACTconsistently outperforms the baseline techniques, and its performance is robust against a low number of track-level mood tags.The results give validity and analytical insights for harnessing millions of music tracks and associated mood data availablethrough social tags in application development.
Index Terms—Semantic analysis, social tags, music, Music Information Retrieval, moods, genres, prediction.
✦
1 INTRODUCTION
M INING moods inherent in online content, suchas web forums and blogs [1], [2], images [3],
and news stories [4], brings benefits to documentcategorization and retrieval due to the availability oflarge data. The need for automatic mood-based musicmanagement is increasingly important as music listen-ing, consumption and music-related social behaviorsare shifting to online sources, and a large proportionof all recorded music is found online. An extensivebody of research in music psychology has shown thatmoods1 are, in many aspects, fundamental to music[5]: music expresses and evokes moods, appeals topeople through moods, and is conceptualized andorganized according to moods. Online music servicesbased on social tagging, such as Last.fm,2 exhibit richinformation about moods related to music listeningexperience. Last.fm has attracted wide interest frommusic researchers, since crowd-sourced social tagsenable study of the links between moods and music-listening in large music collections; these links havebeen unattainable in the past research, which hastypically utilized laborious survey-based annotations.
Social tags can be defined as free-form labels orkeywords collaboratively applied to documents byusers in online services, such as Del.icio.us (web
• P. Saari and T. Eerola are with the Department of Music, Universityof Jyvaskyla, Jyvaskyla, Finland.E-mail: [email protected].
This work was funded by the Academy of Finland (Finnish Centre ofExcellence in Interdisciplinary Music Research).
1. In this paper, we use terms mood, emotion, and affect inter-changeably.
2. Last.fm: http://www.last.fm/.
bookmarks), Flickr (photos), and Pinterest (images,videos, etc.)3. Obtaining semantic information fromsocial tags is, in general, a challenge not yet met. Dueto the free-form nature of social tags, they containa large amount of user error, subjectivity, polysemyand synonymy [6]. In particular, the sparsity of socialtags, referring to the fact that a typical document isassociated to only a subset of all relevant tags, isa challenge to the indexing and retrieval of taggeddocuments. Various techniques in semantic comput-ing, such as Latent Semantic Analysis (LSA) [7],that infer semantic relationships between tags fromwithin-document tag co-occurences, provide solutionsto tackle these problems, and techniques have beenproposed to automatically predict or recommend newtags to documents bearing incomplete tag information[8], [9]. However, no agreement exists on how to maptags to the space of semantic concepts, as indicatedby the large number of approaches dedicated to thetask [10].
In the music domain, the majority of social tags aredescriptors of the type of music content, referring typ-ically to genres [11], but also to moods, locales and in-strumentations, which are well represented in the dataas well. In particular, moods are estimated to accountfor 5% of the most prevalent tags [12]. Several studiesin the field of Music Information Retrieval (MIR) haveapplied bottom-up semantic computing techniques,such as LSA to uncover mood representations emerg-ing from the semantic relationships between socialtags [13], [14]. These representations have resembled
3. Del.icio.us: http://www.delicious.com; Flickr:http://www.flickr.com; Pinterest: http://pinterest.com.

IEEE TRANSACTIONS ON KNOWLEDGE AND DATA ENGINEERING 2
mood term organizations in the dimensional [15] orcategorical [16], [17] emotion models, which haveregularly been used to model moods in music [18].However, we claim that the previous studies in tag-based music mood analysis have not given compre-hensive evaluation of the models proposed, utilizedknowledge emerging from emotion modeling to thefull potential, or presented systematic evaluation ofthe accuracy of the models at the track level.
In this paper we propose a novel technique calledAffective Circumplex Transformation (ACT), opti-mized to uncover the mood space of music by bottom-up semantic analysis of social tags. The key aspectof ACT is that it is a predictive model that canbe used to predict the expressed moods in noveltracks based on associated tags. We train ACT witha large collection of approximately 250,000 tracks andassociated mood tags from Last.fm and evaluate itspredictive performance with a separate test set of 600tracks according to the perceived moods rated by agroup of participants. We compare ACT to predictivemodels devised based on various semantic analysistechniques, as well as to the predictions based on rawtag data. We also estimate the applicability of ACT tolarge collections of weakly-labeled tracks by assessingACT performance as a factor of the number of tagsassociated to tracks. Furthermore, we gain insightsinto the general views on mood modeling in music byexamining the structure of the mood semantic spaceinherent in social tags.
The rest of the paper is organized as follows: Section2 goes through related work in semantic computingand emotion modeling. Section 3 describes the processof obtaining tracks and associated social tags fromLast.fm and details the method for semantic analy-sis of the data. The semantic structures of the dataare examined in Section 3.6. Section 4 presents theACT technique and Section 5 introduces the baselinetechniques for comparatively evaluating its predictionperformance on listener ratings of the perceived moodin music. The test set used in the evaluation is de-scribed in Section 6. The results are presented anddiscussed in Section 7 and conclusions are drawn inSection 8.
2 RELATED WORK
2.1 Semantic Analysis of Social Tags
Latent Semantic Analysis (LSA) [7], has been widelyused to infer semantic information from tag data. Toenable computational analysis, tag data is first trans-formed into the Vector Space Model (VSM) [19], repre-senting associations between documents and tags ina sparse term-document matrix. Semantically mean-ingful information is then inferred from a low-rankapproximation of the VSM, alleviating the problemswith synonymy, polysemy and data sparsity. Low-rank approximation is typically computed by Singu-
lar Value Decomposition (SVD), but other techniquessuch as Nonnegative Matrix Factorization (NMF) [20]and Probabilistic Latent Semantic Analysis (PLSA)[21] have been proposed for the task as well.
SVD has been used in past research for music auto-tagging [22] and music mood modeling [13], [14].Variants of NMF have been exploited for collaborativetagging of images [23] and user-centered collaborativetagging of web sites, research papers and movies[24]. PLSA has been used for collaborative taggingof web sites [25] and topic modeling of social tags inmusic [26]. In the latter paper, SVD and PLSA werecompared in a task of genre and artist retrieval basedon social tags for music, showing the advantage ofPLSA in these tasks. Performance of SVD and NMFwere compared in [27], in a bibliographic metadataretrieval task, but no significant difference was found.On the other hand, NMF outperformed SVD andPLSA in classification of text documents into moodcategories [28].
2.2 Structure of Moods
Emotion modeling in psychology and music psychol-ogy research typically relies on explicit – textual orscale-based – participant assessments of emotion termrelationships [15], [29], [30] and their applicability tomusic [31], [16], [32]. Based on these assessments,dimensional [15] and categorical [17] models of emo-tions have been proposed. Categorical emotion mod-els either stress the existence of a limited set of univer-sal and innate basic emotions [17], or explain the vari-ance between moods by means of a few underlyingaffect dimensions [30] or a larger number of emotiondimensions based on factor analyses [16]. With re-gards to music, an ongoing related theoretical debateconsiders whether moods in music can most realis-tically be described as categories or dimensions [33].Two variants of the dimensional models of emotions[15], [30] are particularly interesting here since thesehave received support in music-related research [18].Russell’s [15] affective circumplex postulates two or-thogonal dimensions, called Valence and Arousal, andthese dimensions are thought to have distinct physio-logical substrates. Thayer’s popular variant [30] of thisdimensional model assumes the two dimensions to berotated by 45◦, labeling them as Tension and Energy.However, divergent views exist as to whether twodimensions is enough to represent affect. In particular,a three-dimensional model of Sublimity, Vitality andUnease has been proposed as underlying dimensionsof affect in music [16], whereas a model of Arousal,Valence and Dominance has been proposed as a nor-mative reference for English words [34].
Importantly, these models lend themselves to acoherent spatial representation of the individual affectterms, which is valuable property with respect tosemantic analysis of mood-related social tags.

IEEE TRANSACTIONS ON KNOWLEDGE AND DATA ENGINEERING 3
Past accounts of mood detection in MIR have ap-plied the various emotion models coupled with ad-vanced techniques of machine learning and signalprocessing to identify acoustic substrates for moods.Both categorical [35] and dimensional [36] modelsof emotions have been used to represent the moodin music tracks. These studies prove that insightsand findings from emotion modeling research areuseful to new computational approaches to automaticmood modeling. Moreover, and as noted above, paststudies have recovered mood spaces based on seman-tic analysis of social tags that resemble the emotionmodels [13], [14]. Here, we go further by quantifyingthe predictive value of applying insights from thepsychology of emotion to the analysis of large-scaleand diffuse meta-data, such as information providedby social tags.
3 SEMANTIC ANALYSIS
This section describes the process of collecting tracksand associated social tags from Last.fm, and detailsthe semantic analysis method to infer spatial repre-sentation of tags.
3.1 Gathering Vocabularies
To obtain the corpus of tracks and associated tagsfrom Last.fm, we systematically crawled the Last.fmonline database through a dedicated API4. We usedextensive vocabularies of mood- and music genre-related terms as search words for populating the cor-pus. This approach suits our purposes since it controlsthe relevance of the track content and to some degreebalances the data according to mood and genre.
The mood vocabulary was aggregated from sev-eral research papers and from an expert-generatedword list. A number of research fields provided rele-vant sources: affective sciences [37], music psychologystudying the use of emotion words in music [16], [38],[15] and MIR [39], [14], studying the mood prevalencein social tags. As an expert-generated source we usedan extensive mood word list at Allmusic5 web service.The vocabulary was then edited manually to identifyinflected terms, such as “depressed”, “depressing”,“depression” and “depressive”.
Genre vocabulary was aggregated from severalexpert-generated sources. A reference for music gen-res and styles available through Allmusic6 was usedas the main source. This included over 1,000 popularand classical music styles. Moreover, we includedseveral Finnish music styles out of curiosity. Manualediting was then carried out for the genre vocabu-lary to aggregate regular alternate spellings, such as
4. http://www.last.fm/api, accessed during November - Decem-ber 2011.
5. http://www.allmusic.com/moods6. http://www.allmusic.com/genres
“rhythm and blues”, “R’n’B”, and “R&B” as well as“indie pop” and “indiepop”.
The number of terms in the resulting vocabularieswas 568 for moods and 864 for genres (1,083 and 1,603including the inflected forms, respectively).
Moreover, the following reference vocabularieswere collected for evaluating the mood structures inSection 3.6: Locations – 464 terms: Country names in-cluding nationality-related nouns and adjectives (e.g.,“Finland”, “Finn”, “Finnish”), as well as continentsand certain geographical terms (e.g., “arctic”). Instru-ments – 147 terms: Comprehensive list of instrumentnames. Opinions – 188 terms: Manually identifiedfrom the tags associated to more than 1,000 tracks, andnot included in the other vocabularies (e.g., “favorite”,“one star”, “wicked”, “check out”).
3.2 Fetching Tags and Tracks from Last.fm
The mood and genre vocabularies, including the in-flected terms, were used as search words via theLast.fm API7 to populate the track corpus. The processis visualized in Fig. 1.
The tracks were collected using two tag-specificAPI functions: tag.getTopTracks returning up to 50 toptracks and tag.getSimilar returning up to 50 mostsimilar tags. First, the top tracks for each term wereincluded in the corpus, amounting to up to 2, 686 ×100 = 134, 300 tracks. In parallel, for each term wefetched the similar tags and included the associatedtop tracks. This process potentially visited up to2, 686 × 50 × 50 = 6, 715, 000 tracks, and using bothfetching processes combined we were able to fetch upto approximately 7M tracks. In practice, the numberwas reduced by many overlapping tracks and similartags.
Finally, track-level tags in the final corpus werefetched using the function track.getTopTags, returningup to 100 tags. The returned track-level tags arerepresented by normalized “counts” indicating therelative number of times each tag has been appliedto a track. Although the exact definition of thesecounts is not publicly available, they are often used insemantic analysis [12], [14]. All tags were cleaned bylemmatizing [40] and by removing non-alphanumericcharacters. The final set consisted of 1,338,463 tracksand 924,230 unique tags.
3.3 Vector Space Modeling
A standard Vector Space Model (VSM) [19] was builtseparately for each of the vocabularies. Tags related tothe vocabulary terms were identified from the corpusfollowing the bag-of-words approach also taken in[26]. All tags that included a term as a separate word(or separate consecutive words in the case of multi-word terms) were associated with the corresponding
7. Find detailed information on the used functions from the APIdocumentation referenced above.

IEEE TRANSACTIONS ON KNOWLEDGE AND DATA ENGINEERING 4
Fetching data from Last.fm Vector space
modeling
Vocabularies
TERMS(mood and genre)
n=2,686 VSM
SIMILAR
TAGS
TOP TRACKSn ≤ 2,686 × 50
TOP TRACKSn ≤ 2,686 × 50 × 50
∪ tag.getTopTracks
∪ tag.getSimilar TRACKSn = 1,338,463
TAGSn =924,230
Identify vocabulary terms
Filter terms and tracks
Normalize data
TAGS =
∪ search(term)term ∈ TERMS
tag ∈ TAGS
tag ∈ TAGS
∪ tag.getTopTrackstag ∈ SIMILAR TAGS
∪ track.getTopTagstrack ∈ TOP TRACKS
Fig. 1. Data collection process.
0 5 10 15 20 250
50K
100K
|TR
AC
KS
|
|TERMS|
Fig. 2. Distribution of the number of mood termsassociated to tracks in the test set.
terms. We also filtered out those track-specific termassociations where a term was included in either tracktitle or artist name. This was due to the fact that manysocial tags describe these actual track metadata.
To avoid obtaining overly sparse and uncertain in-formation, we excluded all terms that were associatedto less than 100 tracks. At this point 493,539 trackswere associated to at least one mood term. However,we excluded tracks associated to only one mood term,as it was assumed that these tracks would providelittle additional information for the further semanticanalysis of mood term relationships. This resulted ina corpus of 259,593 tracks and 357 mood terms. Asshown in Fig. 2, distribution of the number of termsassociated to each track was exponential, indicatingthe sparsity of the data. Similar procedures wereapplied to all other vocabularies as well. Statisticalmeasures related to the resulting corpora are shownin Table 1. The five most frequently applied withineach corpora are as follows: Moods: “chill”, “mellow”,“relaxing”, “dark” and “melancholy”; Genres: “rock”,“pop”, “alternative”, “electronic” and “metal”; Instru-ments: “guitar”, “bass”, “drum”, “piano” and “acous-tic guitar”; Locales: “British”, “UK”, “American”,“USA” and “German”; and Opinions: “favorite”,“love”, “beautiful”, “awesome” and “favourite”.
Finally, the normalised counts ni,j provided byLast.fm for term (wi) – track (tj) associations wereused to form the VSM N defined by Term Frequency-Inverse Document Frequency (TF-IDF) weights n in asimilar manner as in [26]:
ni,j = (ni,j + 1) log(R
fi), (1)
where R is the total number of tracks, fi is the numberof tracks term wi has been applied to. Separate models
TABLE 1Statistical measures related to each
vocabulary-related corpus.
|Tracks| |Terms| # Terms per track (Avg.)Moods 259,593 357 4.44Genres 746,774 557 4.83Instruments 46,181 53 4.44Locales 72,229 126 2.26Opinions 305,803 192 5.67
were formed for each vocabulary-related corpora.
3.4 Singular Value Decomposition
SVD is the typical low-rank matrix approximationtechnique utilized in LSA to reduce the rank of the TF-IDF matrix, alleviating problems related to term syn-onymy, polysemy and data sparsity. SVD decomposesa sparse matrix N so that N = USV T , where matricesU and V are orthonormal and S is the diagonal matrixcontaining the singular values of N . Rank k approx-imation of N is computed by Nk = UkSk(V k)T ,where the i:th row vector Uk
i represents a term wi asa linear combination of k dimensions. Similarly, V k
j
represents track tj in k dimensions. Based on a rankk approximation, dissimilarity between terms wi andwi is computed by the cosine distance between Uk
i Sk
and Uk
iSk.
In the present study, all data sets summarized inTable 1 are subjected to LSA. While the main contentof this paper deals with the Mood corpus, we useGenres to balance our data sampling in Section 6, andthe other sets for comparison of different concepts inSection 3.6.
3.5 Multidimensional Scaling
Past research in emotion modeling, reviewed above,suggests two to three underlying dimensions of emo-tions, which indicates that very concise representa-tion of the mood data at hand would successfullyexplain most of its variance. Therefore, we developfurther processing steps to produce a semantic spaceof moods congruent with the dimensional emotionmodel. Genres, Locales, Instruments and Opinionswere subjected to the same procedures to allow com-parative analysis described in Section 3.6.

IEEE TRANSACTIONS ON KNOWLEDGE AND DATA ENGINEERING 5
We applied non-metric Multidimensional Scaling(MDS) [41] according to Kruskal’s Stress-1 criterioninto three dimensions on the term dissimilarities pro-duced by SVD with different rank k-values. MDS is aset of mathematical techniques for exploring dissimi-larity data by representing objects geometrically in aspace of a desired dimensionality, where the distancesbetween objects in the obtained space approximate amonotonic transformation of the corresponding dis-similarities in the original data. When used with alow number of dimensions, MDS allows for conciserepresentation of data, which is why it is a typicaltool for data visualization. In particular, [42] showedwith several high-dimensional biochemical data setsthat the combination of SVD followed by MDS is moreefficient at dimension reduction than either techniquealone.
The resulting mood and genre term configurationswith k = 16 are shown in Fig. 3. The stress φk ,indicating the goodness-of-fit varied between (φ4 =0.02, φ256 = 0.29) depending on the rank k. Similarvalues were obtained for both moods and genres.
To represent a track in the MDS term space, weapplied projection based on the positions of the as-sociated terms. Given an MDS term configurationyi = (yi1, yi2, yi3), i ∈ (1, ..., |w|), position of a trackrepresented by a sparse term vector q is computed bythe center-of-mass:
t =Σiqiyi
Σiqi. (2)
For example, the position of a track associated to“happy”, with no other terms assigned, coincides withthe position of the term. On the other hand, a trackwith “happy” and “atmospheric” is positioned alongthe segment happy–atmospheric. In general, tracks arelocated in the MDS space within a convex polyhedronwith vertices defined by positions of the associatedterms.
3.6 Mood Structures Emerging from the SemanticData
Because of the different views on how to treat mood-related data, whether as categories or dimensions, weused semantic information of music tracks obtainedby the MDS analysis to gain evidence on this issue.If tracks in the MDS space would have clear clusterstructure, we should choose the categorical repre-sentation; whereas, if tracks would scatter somewhatevenly across the space, continuous description ofmoods would be appropriate.
Hopkins’ index [43] can be used to estimate thedegree of clusterability of multidimensional data. Itis based on the hypothesis that the clustering ten-dency of a set of objects is directly reflected in adegree of non-uniformity in their distribution. Non-uniformity is estimated by comparing the sum ofnearest-neighbor distances Rj within a set of real
!"# !"$ ! !"$ !"# !"% !"&
!"%
!"#
!"$
!
!"$
!"#
!"%
'()
(*+,-.
/-**0
*-1.0
'-2.
3-)45)6
6(57.08(5190
',,7:6;;3
+1(.-7
*7,-2(1,
(*75'.5)6
,),16,.54
2,<0
2;(7'(7
2=;;./
7;(3
,-20
756/.
5):7;>,
*;?,1
2?,,.
5)2*51,3
?-1=
'1,,
-)6105).,1,2.5)6
+7-49
,*54
*(1,
1;=-).54
2;;./5)6
5).,)2,
2;'.
3,,*
2,).5=,).-7
);2.-765-
1,7-<5)6
=,77;?
2,)2(-7
*,-4,'(7
4-7=
+5..,12?,,. ,=;.5;)-7
7;),75),22
.15**0
4/577
27;?
=;;30
/0*);.54 8(5,.
=,35.-.5;)
,47,4.54
/-().5)6
3-19
31,-=0
2-3
3,*1,225>,
=,7-)4/;70
-.=;2*/,154
,./,1,-7
-0.6
0.6
3rd dim.
(a)
!"# !"$ !"% ! !"% !"$ !"#
!"#
!"$
!"%
!
!"%
!"$
!"#
&'()*'+,-./0
-/&-.*121
/.3*'4.
,(-0121
'+,-./0
56'77-5'6
-/&-.*(25)
62*8-
/.3*3'9.
121*(25)
1270*(25)
71'5.
7:/0;121
/2-7.
'9'/0*4'(&.
826)*(25)
.<1.(-+./0'6
1270*1=/)
17:5;.&.6-5
7280*(25)
.+2
7-/4.(*72/43(-0.(72=/&0('5)
'60.(/'0-9.
1=/)
'60.(/'0-9.*(25)
-&+
6'0-/
.'7:*6-70./-/4
.6.50(2/-5'
4(=/4.
&23/0.+12
4'('4.
.6.50(2
62=/4.
0('/5.
8=7-2/
&'/5.
-/&=70(-'6
7+220;*>'??
73-/4
(25)*'/&*(266
0.5;/2
56=,
;2=7.
&-752'+.(-5'/'
1(24(.77-9.*+.0'6
&.'0;*+.0'6;'(&*(25)
0(-1*;21
'60*52=/0(:
4(229.
123.(*+.0'6;.'9:*+.0'6
52=/0(:
&=,
,6=.7*(25)
,6=.7
8=/)
7)'
;-1*;21
('1
(/,
(.44'.
72=6 (220
METAL
ROCK
JAZZ
FOLK
ELECTRONIC
POP
-0.6
0.6
3rd dim.
(b)
Fig. 3. MDS configurations (k = 16) of (a) mood and(b) genre terms in three dimensions (bubble size =prevalence, where prevalence ≥ 4,000 and 10,000 for(a) and (b)). Six highlighted genres refer to listeningexperiment (see Section 6).
objects to the sum of distances Aj between artificialobjects and their nearest real neighbors:
H =
∑Aj∑
Aj +∑
Rj
. (3)
Following an extension by [44], artificial objects aresampled from univariate distributions that matchthose of the real objects. Value H ≈ 0.50 indicates

IEEE TRANSACTIONS ON KNOWLEDGE AND DATA ENGINEERING 6
4 8 16 32 64 128 256 |terms|0.5
0.6
0.7
0.75
0.8
0.9
1
H
K
MOODSGENRESLOCALESINSTRUMENTSOPINIONS
Fig. 4. The mean Hopkins’ indices for eachvocabulary-related corpus across various k (sd ≤.0067 ∀ k).
uniform structure (∑
Rj ≈∑
Aj), whereas H ≈ 1.0indicates perfect clusterability. In particular, the valueH = 0.75 indicates that null hypothesis of uniformstructure can be rejected at 90% confidence level.
For each corpus, we computed Hopkins’ index forthe track positions in the MDS spaces (see Eq. 2)obtained with ranks k = (4, 8, 16, ..., 256) and k =|terms|. The latter corresponds to computing MDSwithout LSA, i.e. based on term distances in the orig-inal TF-IDF matrices. Preliminary analyses indicatedthat Hopkins’ index is affected by the number of termsassociated to each track. Since the characteristics ofthe vocabulary-related corpora differed in this respect,we randomly sampled for each corpus a subset of4088 tracks with exponential terms-per-track distribu-tion (2048 + 1024 + 512 + ... + 8 tracks associated to2, 3, 4, ..., 10 terms, respectively) and computed H forthe subset. The results shown in Fig. 4 are computedas an average of ten separate runs of this process.
The results showed that Hopkins’ indices for Moodsremained at the range of 0.6 < H < 0.7, whichmeans that track positions are uniformly distributedacross the mood space. This suggests that the optimalrepresentation of Moods is continuous rather thancategorical. Comparison to other corpora supportsthis view, as mood values remain at a clearly lowerlevel than those of any other set. Genre-related valuesindicated that genre-data is fairly clusterable (H > .75,when k ≤ 128), supporting the common practiceof assigning songs categorically into genres. Further-more, semantic spaces of Instruments and Localeshad the clearest cluster structure. This is in line withthe intuition that music tracks can, in general, becharacterized with distinct instruments or instrumen-tations and geographical locations. Clusterability ofdata related to Opinions was in general at the samelevel as that of Genres. However, Opinions yieldedparticularly high values of H with low k. We consider
this high dependence on k as an artefact causedby ill-conditioned distances between Opinion terms:almost all of the most prevalent terms were highlypositive (“favorite”, “killer”, “amazing”, “awesome”,etc.), and the computed distances between these termsmay not reflect any true semantic relationships.
In summary, the results support the use of thedimensional representation of mood information ofmusic tracks. In the next section we develop furtherprocessing steps to comply with this finding.
4 AFFECTIVE CIRCUMPLEX TRANSFORMA-TION
Typical MDS operations, described above, may not beadequate to characterize moods, since the dimensionsobtained do not explicitly represent the dimensionalmodels of emotion. We therefore propose a novel tech-nique called Affective Circumplex Transformation (ACT)influenced by Russell’s affective circumplex model ofemotions [15] to conceptualize the dimensions of theMDS mood spaces. First, reference positions for moodterms on the Valence-Arousal (VA) space are obtainedfrom past research on emotion modeling. Then, theMDS space is linearly transformed to conform tothe reference. Finally, explicit mood information ofmusic tracks is computed by projecting those onto thetransformed space.
4.1 ACT of Mood Term Space
Reference locations for a total of 101 unique moodterms on the VA space were extracted from Rus-sell’s [15, p. 1167] and Scherer’s [29, p. 54] studies. Inthe case of seven overlapping mood terms betweenthe two studies, Scherer’s term positions were chosensince they are scattered on a larger part of the planeand thus may provide more information. Further-more, the model by [30] was projected on the spacediagonally against the negative valence and positivearousal to obtain explicit representation of the tensiondimension.
Three-dimensional MDS spaces were conformed tothe extracted VA space by first identifying the corre-sponding mood terms in the semantic data. Identifica-tion of mood terms resulted in a set of 47 mood termsout of the 101 candidates. The fact that less than halfof the mood terms used in the past studies exist inthe semantic mood data may indicate the differencebetween affect terms used to describe everyday expe-riences in general versus terms used in the context ofthe aesthetic experience.
Transformation of the MDS space to optimally con-form to the VA reference was determined by classicalProcrustes analysis [45], using sum of squared er-rors as goodness-of-fit. Given the MDS configurationyi = (yi1, yi2, yi2) and VA reference xi = (xi1, xi2) formood terms i matched between the two, Procrustes

IEEE TRANSACTIONS ON KNOWLEDGE AND DATA ENGINEERING 7
transformation gives xi = ByiT + C, where B is anisotropic scaling component, T is an orthogonal rota-tion and reflection component, and C is a translationcomponent. B, T , and C minimize the goodness-of-fitmeasure X2 = Σi(xi− xi)
2. Based on the components,configuration xi including all mood terms can beobtained by
xi = ByiT + C. (4)
Procrustes retains the relative distances between ob-jects since it allows only translation, reflection, or-thogonal rotation and isotropic scaling. Therefore, therelative configuration of the terms in the original MDSspace is not affected. Changing the rank parameter inSVD had no significant effect on the goodness-of-fitof the Procrustes transformation. The criterion variedbetween 0.75 < X2 < 0.79.
A peculiarity of ACT is in conforming the three-dimensional MDS space to two-dimensional reference.The transformation is thus provided with an addi-tional degree of freedom, producing two explicitlylabeled dimensions and a third residual dimension.Using three dimensions in the MDS space is basedon the unresolved debate of whether the underlyingemotion space is actually two- or three-dimensional(see Section 2.2).
Fig. 5 shows the transformed mood term config-uration based on SVD with rank 16, also indicatingRussell’s dimensions of Arousal and Valence, andThayer’s dimensions of Energy and Tension. VA-reference and the transformed term positions corre-spond well, in general, as they are located roughly atthe same area of the space. For example, positions ofterms “happy”, “joy”, “sad”, “tense” and “peaceful”have only minor discrepancy between the reference.Moreover, dimension labels and the dimensions im-plied by the mood term organization correspond aswell and the positions of popular mood terms notused as reference for the transformation make sensein general. For example, “fun”, “party” and “upbeat”all have positive valence and arousal, “dark” has neg-ative valence and negative arousal, whereas “brutal”has negative valence and positive arousal.
However, certain terms such as “solemn”, “de-light”, “distress” and “anxious” show larger discrep-ancy, and the terms “atmospheric” and “ethereal”,which could intuitively be considered as neutral oreven positive, both have negative valence. The causeof these inconsistencies could again be traced back tothe difference between aesthetic and everyday affec-tive experience, but could also be due to the subjec-tivity of mood-related associations in music listening.For example, a solemn or atmospheric track that oneenjoys may be regarded as depressing by another. Thismulti-faceted aspect of music listening is discussed in[32].
ATMOSPHERIC
BLACK
CHILL
DARK
DEEP
DREAMY
EASY EMOTIONAL
ENERGETIC
EPIC
ETHEREAL
FEEL GOOD
FREE
FUN
MELLOW
NOSTALGIA
PARTY
POWER
ROMANTIC
SEXY
SLOW
SMOOTH
SOFT
SWEET
UPBEAT
afraid
alarm
ambitious amusing
angry
anxious
astonishing
at ease
bitter
bored
calm
confident
content
defiant
delight
depressive
desperate
determined
distress
exciting
frustration
glad
gloomy
happy
hope
jealousy joy
loathing
loneliness longing
melancholy
miserable
passionate
peaceful
pensive
pleasure
relaxing
sad
satisfying
serious
sleepy
solemn
tense
tired
triumphant
worry
Russell
Thayer
ENERGY ( ) TENSION ( )
ENERGY (+) TENSION (+)
AROUSAL (+)
AROUSAL ( )
VALENCE (+)
VALENCE ( )
BITTERSWEET
BRUTAL
DANCING
ECLECTIC
FAST
GUILTY
HAUNTING
HYPNOTIC IN LOVE
INSPIRED
INTENSE
INTERESTING
LIGHT
LOUD
MEDITATION
MOODY
PURE
QUIET
QUIRKY
SENSUAL
SENTIMENTAL SOOTHING
SOULFUL
TRIPPY
UPLIFTING
WARM
Fig. 5. Mood space obtained by ACT based on rank16 semantic space. Mood term positions are shown inblack dots and the reference positions in grey circles.Mood terms having no reference, but that are associ-ated to at least 4,000 tracks are shown in grey stars.Highlighted terms relate to the seven scales rated inlistening experiment (see Section 6).
4.2 Mood Prediction of Tracks with ACT
In this section we describe how ACT can be used topredict the prevalence of moods in novel tracks thathave been associated to one or more mood terms.The prediction performance of ACT related to mooddimensions and individual mood terms is evaluatedlater in Section 7 with listener ratings of the perceivedmood in a separate test set.
Projection in Eq. 2 can be used in itself to estimatethe valence and arousal of a track – the estimations arerepresented explicitly by the dimensions in the pro-jection. However, in order to estimate the prevalenceof a certain mood term in a track, another projectionis needed.
We assigned continuous mood term-specific weightfor a track by projecting the track position given byEq. 2 in the MDS space along the direction determinedby the term. A track with position t = (t1, t2, t3) inthe transformed mood space was projected accordingto the direction of a mood term with position xi =(xi1, xi2, xi3) by
Pi =xi
|xi|· t, (5)
where | · | denotes the l2-norm. To obtain an estimatefor Tension we projected the track along the direction(−1, 1, 0) (note the inverted valence axis according toa convention used in emotion modeling).

IEEE TRANSACTIONS ON KNOWLEDGE AND DATA ENGINEERING 8
5 BASELINE TECHNIQUES FOR MOOD PRE-DICTION
We compared the performance of ACT in predictingmoods of tracks to several techniques based on low-rank matrix approximation. For a track t representedby a sparse term vector q, we computed rank k moodweight related to term wi with SVD, NMF and PLSA.All of the techniques involve computing the low-rankapproximation of the TF-IDF matrix, transforming anunknown track t to the VSM by Eq. 1 and folding itinto the low-rank semantic space, and approximatingthe weight of a mood wi related to the track. Inaddition to the low-rank approximation of the VSM,we used the original sparse VSM representation q asa baseline as well.
5.1 Singular Value Decomposition
Track represented with a sparse term vector q =(q1, q2, ..., q|w|, ) is first folded in to the rank k spaceobtained with SVD by:
qk = (Sk)−1(Uk)T q. (6)
The weight Nki related to the track and a mood term
wi is then computed by
Nki = Uk
i Sk(qk)T . (7)
5.2 Nonnegative Matrix Factorization
NMF [20] is a method proposed for low-rank ap-proximation of a term-document matrix. The methoddistinguishes from SVD by its use of nonnegativeconstraints to learn parts-based representation of ob-ject semantics. Given a nonnegative TF-IDF matrixN ⊂ R
C×D and a desired rank parameter k, NMFconstructs nonnegative matrices W k ⊂ R
C×k contain-ing k basis components and Hk ⊂ R
k×D such thatN ≈ W kHk. This is done by optimizing
minWk,Hk
f(W k, Hk) =1
2||N−W kHk||2F , s.t. W
k, Hk > 0,
(8)where F denotes the Frobenius norm. We solve theoptimization problem using multiplicative updatingrules in an iterative manner [20]. The ith row of W canbe interpreted as containing k “importance” weights amood term wi has in each basis component. Similarly,the jth column of H can be regarded as containing k
corresponding weighting coefficients for track tj .Folding in a new track represented by vector q
to obtain qk is achieved by solving an optimizationproblem by keeping Hk fixed:
minqk
f(qk, Hk) =1
2||q − qkHk||2F , s.t. qk > 0. (9)
Finally, to estimate the weight Nki related to track t
and mood term wi, we compute
Nki = W k
i qk. (10)
5.3 Probabilistic Latent Semantic Analysis
In the core of PLSA [21], is the statistical aspect model,a latent variable model for general co-occurrence data.Aspect model associates an unobserved class variablez ∈ Z = (z1, ..., zk) with each occurrence of a term wi
in a track tj .PLSA states that the probability P (tj , wi) that term
wi is associated with a track tj can be expressed as ajoint probability model using latent class variable z:
P (tj , wi) = P (tj)P (wi|tj) = P (tj)∑
z∈Z
P (wi|z)P (z|tj),
(11)where P (t) is the probability of a track tj , P (z|tj)is the probability of a latent class z in track tj , andP (wi|z) is the probability of a term wi in the latentclass. The model is fitted to the collection of tracks bymaximizing log-likelihood function
L =∑
t
∑
w
Ni,j logP (tj, wi), (12)
where Ni,j is the nonnegative TF-IDF matrix. Theprocedure for fitting the model to training data isthe Expectation Maximization (EM) algorithm [21]. Toestimate the probability P (q, wi) of a mood term wi
for a new track represented by term weights, we firstfold in the track using EM, keeping the parameters ofP (wi|z) fixed and then calculate weights P (z|q). Themood weight for the track is finally computed by
P (q, wi) = P (wi|z)P (z|q). (13)
5.4 Predicting the Mood Dimensions
Since all baseline techniques predict mood primarilyaccording to explicit mood terms, the techniques mustbe optimised to achieve mood dimension predictionscomparable to ACT. We considered that a mood termrepresentative of a mood dimension would yield thehighest predictive performance for the correspondingdimension. We assessed the representativeness of themood terms by computing the angle between eachmood dimension and mood term location in the ACTconfigurations with k ∈ [4, 8, 16, ..., 256], and limitedthe choice to terms associated to at least 10% of alltracks in the corpus. This yielded the following terms,indicating the number of track associations and themaximum angle across k between the term position inthe ACT configurations and the corresponding dimen-sion: “happy” for Valence (n = 28, 982, αk ≤ 9.29◦),“melancholy” for Arousal (n = 31, 957, αk ≤ 5.11◦)and “mellow” for Tension (n = 46, 815, αk ≤ 4.48◦)
6 GROUND-TRUTH DATA OF MOODS IN MU-SIC
We evaluated the performance of ACT and the base-line techniques by comparing the estimates producedby these methods to listener ratings of the perceived
IEEE TRANSACTIONS ON KNOWLEDGE AND DATA ENGINEERING 9
moods in music tracks. Participants listened to shortmusic clips (15s) and rated their perception of moodsexpressed by music in terms of ten scales. The test setof tracks was retrieved from the Last.fm in a randomfashion, balancing the sampling to cover semanticgenre and mood spaces. This section describes theground-truth collection process in detail8.
6.1 Choosing Moods and Genres as Focus
To systematically cover the concurrent characteriza-tions of moods in music, ratings were done for boththe dimensional mood model and individual moodterms. All ratings were given in nine-step Likert-scalesto capture the continuous nature of mood uncoveredin Section 3.6. We used bipolar and unipolar scales forthe mood dimensions and terms, respectively.
For dimensional model we used three scales: Va-lence, Arousal and Tension, later denoted as VAT;whereas for the mood term representation we usedseven scales: Atmospheric, Happy, Dark, Sad, Angry,Sensual and Sentimental. The choice was based onseveral criteria: i) to cover the semantic space as wellas the basic emotion model; ii) to use representativeterms as implied by high prevalence in the data (“sen-timental” used 4,957 times – “dark” 33,079 times); andiii) to comply with research in the affect prevalenceand applicability in music [31], [16], [32].
Six popular and distinct genres according to theLast.fm track collection (see Fig. 3 (b)) – Rock, Pop,Electronic, Metal, Jazz and Folk – were chosen as thefocus of the study to retain a wide variance in thestylistic characteristics of popular music.
6.2 Sampling of Tracks
We fetched a set of 600 tracks from Last.fm, separate tothe mood track corpus used in the semantic modeling,to be rated in the listening experiment. To obtain atrack collection that allows multifaceted comparisonbetween tag information and the ratings, we utilizedbalanced random sampling of tracks based on: i)mood coverage – reciprocal of the track density in therank 16-based MDS mood space; and ii) genre cover-age – closeness of track positions in the MDS genrespace to one of the six chosen genre terms. Moreover,quality and variability of semantic information in thedata was ensured by: i) favoring tracks associatedto many mood tags; ii) favoring tracks with manylisteners according to statistics provided by Last.fm;and iii) choosing no more than one track from eachartist.
Tracks in the resulting test set are associated with8.7 mood terms on average, which is a higher numberthan that of the larger mood set due to samplingaccording to the number of associated mood terms.
8. Ground-truth and semantic mood data are publicly availableat http://hdl.handle.net/1902.1/21618.
0 5 10 15 20 250
20
40
60
|TR
AC
KS
|
|TERMS|
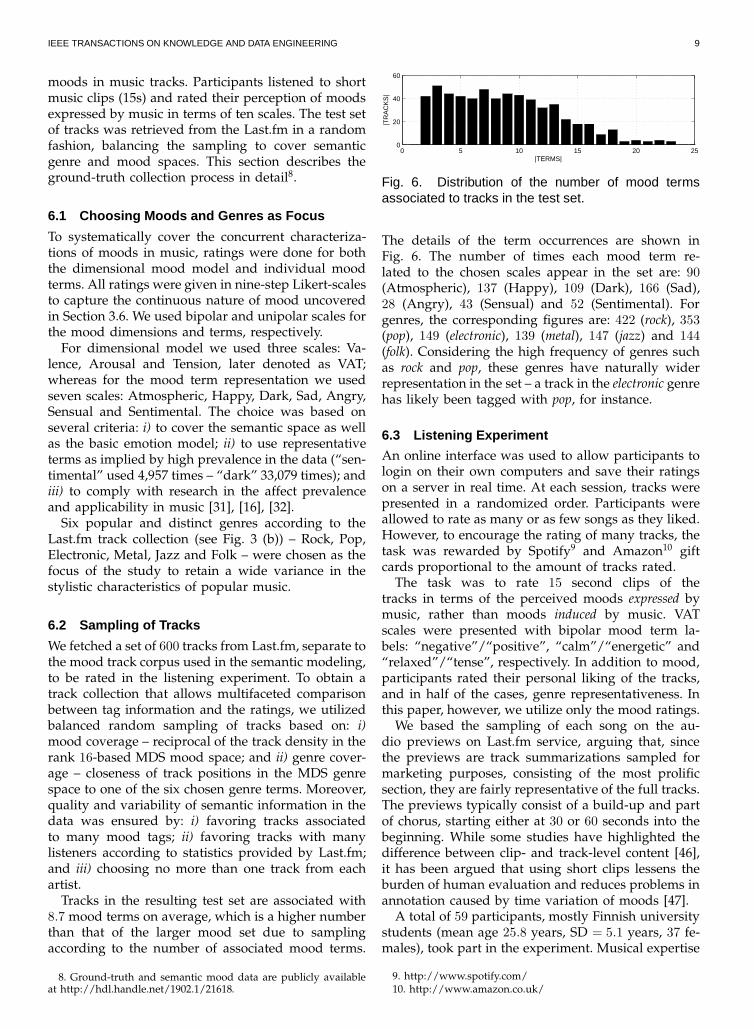
Fig. 6. Distribution of the number of mood termsassociated to tracks in the test set.
The details of the term occurrences are shown inFig. 6. The number of times each mood term re-lated to the chosen scales appear in the set are: 90(Atmospheric), 137 (Happy), 109 (Dark), 166 (Sad),28 (Angry), 43 (Sensual) and 52 (Sentimental). Forgenres, the corresponding figures are: 422 (rock), 353(pop), 149 (electronic), 139 (metal), 147 (jazz) and 144(folk). Considering the high frequency of genres suchas rock and pop, these genres have naturally widerrepresentation in the set – a track in the electronic genrehas likely been tagged with pop, for instance.
6.3 Listening Experiment
An online interface was used to allow participants tologin on their own computers and save their ratingson a server in real time. At each session, tracks werepresented in a randomized order. Participants wereallowed to rate as many or as few songs as they liked.However, to encourage the rating of many tracks, thetask was rewarded by Spotify9 and Amazon10 giftcards proportional to the amount of tracks rated.
The task was to rate 15 second clips of thetracks in terms of the perceived moods expressed bymusic, rather than moods induced by music. VATscales were presented with bipolar mood term la-bels: “negative”/“positive”, “calm”/“energetic” and“relaxed”/“tense”, respectively. In addition to mood,participants rated their personal liking of the tracks,and in half of the cases, genre representativeness. Inthis paper, however, we utilize only the mood ratings.
We based the sampling of each song on the au-dio previews on Last.fm service, arguing that, sincethe previews are track summarizations sampled formarketing purposes, consisting of the most prolificsection, they are fairly representative of the full tracks.The previews typically consist of a build-up and partof chorus, starting either at 30 or 60 seconds into thebeginning. While some studies have highlighted thedifference between clip- and track-level content [46],it has been argued that using short clips lessens theburden of human evaluation and reduces problems inannotation caused by time variation of moods [47].
A total of 59 participants, mostly Finnish universitystudents (mean age 25.8 years, SD = 5.1 years, 37 fe-males), took part in the experiment. Musical expertise
9. http://www.spotify.com/10. http://www.amazon.co.uk/

IEEE TRANSACTIONS ON KNOWLEDGE AND DATA ENGINEERING 10
TABLE 2Correlations (rs) between mood ratings.
Valence Arousal TensionValence −.073 −.639∗∗∗
Arousal .697∗∗∗
Atmospheric .180∗∗∗ −.901∗∗∗ −.687∗∗∗
Happy .940∗∗∗ .114∗∗ −.478∗∗∗
Dark −.940∗∗∗ .059 .640∗∗∗
Sad −.413∗∗∗ −.662∗∗∗ −.253∗∗∗
Angry −.687∗∗∗ .633∗∗∗ .876∗∗∗
Sensual .320∗∗∗ −.733∗∗∗ −.688∗∗∗
Sentimental .114∗∗ −.722∗∗∗ −.621∗∗∗
Note: ∗p < .05; ∗∗p < .01; ∗∗∗p < .001, df = 599.
of the participants spanned from listeners (N = 23), tomusicians (N = 28) and trained professionals (N = 8).Each participant rated 297 clips on average, and 22participants rated all 600 clips. Cronbach’s alpha formood scales vary between 0.84 (sentimental) and 0.92(arousal), which indicates high internal consistency[48]. Such high agreement among the participantsgives support for (a) using all participants in furtheranalysis, and (b) representing each song by singlevalue on each mood scale, computed as the averageacross participants.
Spearman’s rho correlations (rs) between mood rat-ings in different scales, presented in Table 2, showedno correlation between valence and arousal, whichsupports treating these moods as separate dimen-sions. On the other hand, tension is highly correlatedwith arousal and negative valence, which in turnsupports projecting tension diagonally against thesedimensions. Ratings of all 7 mood terms are highlyrelated to valence (happiness, darkness), arousal (at-mospheric, sentimental), or a combination of these(sad, angry, sensual). This extends previous findingsabout high congruence between term-based and di-mensional emotion models in emotion ratings of filmsoundtracks [49] to a large variety of tracks in popularmusic genres.
7 RESULTS AND DISCUSSION
We compared the prediction rates of ACT with var-ious rank values k ∈ (4, 8, 16, ..., 256) to those of thebaseline techniques SVD, NMF, PLSA and VSM. Allprediction rates were computed by correlating theestimates with the listener ratings of moods, usingSpearman’s rank correlation (rs). Fig. 7 shows theresults in detail with different rank k values, whileTable 3 summarizes the results into the average per-formance across k, assessing also the significance ofthe performance differences between ACT and thebaseline techniques. Section 7.3 (Table 3: ACT alt.) pro-vides results obtained with alternative configurationsof ACT. Finally, Section 7.4 assesses the performanceof ACT as a factor of the number of terms applied totracks in the test set.
7.1 Performance for VAT Dimensions
Fig. 7 shows that ACT yielded the highest perfor-mance for all VAT scales, outperforming the baselinetechniques consistently across k. For Valence the me-dian performance of ACT was rs = .576, varying be-tween .519 < rs < .606. The performance was slightlyhigher for Arousal (Mdn rs = .643, .620 < rs < .683)and Tension (Mdn rs = .622, .585 < rs < .642).Performance difference to the baseline techniques wassignificant for all scales – NMF gave the highestmedian performances (rs = .348, .514, .579), whileSVD performed the worst (rs = .302, .414, .443) atpredicting Valence, Arousal and Tension, respectively.VSM yielded performance levels comparable to thebaseline methods, outperforming SVD for all threescales, and PLSA for Valence and Arousal. However,devising baseline techniques to infer predictions forVAT scales from highly prevalent mood terms pos-sibly benefits VSM more than the other techniques.While SVD, NMF and PLSA utilize the semanticrelationships with other terms in making predictions,VSM predictions rely solely on the individual terms.The chosen mood terms are popular also within thetest set (n = 137, 189, 227 for “happy”, “melancholy”and “mellow”, respectively).
The results also show that ACT is less sensitive tothe value of k than SVD, NMF and PLSA. While ACTperformance varied by ∆rs ≤ .087, SVD (∆rs ≤ .222)and PLSA (∆rs ≤ .412) were clearly more inconsis-tent. For Valence and Arousal, PLSA yielded particu-larly low performance with k < 16. NMF was morerobust than other baseline techniques against k asshown by the performance differences of ∆rs ≤ .112.
The high prediction rate of Arousal compared tothat of Valence bears similarity to the results from pre-diction of affect dimensions from the musical featuresacross different genres of music [50]. This was alsohighlighted by an analysis of ACT prediction rates atthe genre-level. The median rs across k for subsetsof the test tracks associated to different main genreswas consistently high for Arousal regardless of genre(.585 < rs < .701), whereas for Valence the ratesspanned rs = .390 (Jazz) and rs = .614 (Metal).
In summary, the results suggest that conventionaltechniques of semantic analysis are inadequate atreliably inferring mood predictions congruent withthe dimensional model of emotions, whereas ACTyields consistently high performance at this task.
7.2 Performance for Individual Mood Terms
Since the rated mood term scales relate to the moodterm associations explicitly represented in the test set,comparison between ACT and the baseline techniquesis more direct than with VAT dimensions. Still, thesame patterns in the performances were prevalent.ACT, again, clearly gave the highest overall perfor-mance, while NMF was the most successful baseline

IEEE TRANSACTIONS ON KNOWLEDGE AND DATA ENGINEERING 11
4 8 16 32 64 128 2560
0.1
0.2
0.3
0.4
0.5
0.6
VALENCE
r s
K
(a)
4 8 16 32 64 128 2560
0.1
0.2
0.3
0.4
0.5
0.6
AROUSAL
K
(b)
4 8 16 32 64 128 2560
0.1
0.2
0.3
0.4
0.5
0.6
TENSION
K
ACTSVDNMFPLSAVSM
(c)
4 8 16 32 64 128 2560
0.1
0.2
0.3
0.4
0.5
0.6
ATMOSPHERIC
K
(d)
4 8 16 32 64 128 2560
0.1
0.2
0.3
0.4
0.5
0.6
HAPPY
K
(e)
4 8 16 32 64 128 2560
0.1
0.2
0.3
0.4
0.5
0.6
0.7DARK
r s
K
(f)
4 8 16 32 64 128 2560
0.1
0.2
0.3
0.4
0.5
0.6
0.7SAD
K
(g)
4 8 16 32 64 128 2560
0.1
0.2
0.3
0.4
0.5
0.6
0.7ANGRY
K
(h)
4 8 16 32 64 128 2560
0.1
0.2
0.3
0.4
0.5
0.6
0.7SENSUAL
K
(i)
4 8 16 32 64 128 2560
0.1
0.2
0.3
0.4
0.5
0.6
0.7SENTIMENTAL
K
(j)
Fig. 7. Prediction rates (rs) of listener ratings in (a – c) VAT scales and (d – j) mood term scales.
TABLE 3Comparison of the performances of ACT, baseline techniques, and alternative ACT implementations (Mdn =
median across k). Significances of the performance differences were computed by Wilcoxon rank sum test forequal medians between ACT and SVD, NMF and PLSA, and Wilcoxon signed rank test for median rs between
ACT and VSM, SVD only, and MDS only.
ACT BASELINE ACT alt.SVD NMF PLSA VSM SVD-only MDS-only
rs (Mdn) rs (min) rs (max) rs (Mdn) rs (Mdn) rs (Mdn) rs rs rsValence .576 .519 .606 .302∗∗∗ .348∗∗∗ .313∗∗∗ .326∗ .475∗ .558Arousal .643 .620 .683 .414∗∗∗ .514∗∗∗ .416∗∗∗ .429∗ .373∗ .643Tension .622 .585 .642 .443∗∗ .579∗∗ .534∗∗ .469∗ .591∗ .596∗
Atmospheric .525 .482 .640 .112∗∗∗ .229∗∗∗ .186∗∗∗ .161∗ .247∗ .581Happy .552 .506 .612 .330∗∗∗ .419∗∗∗ .373∗∗∗ .376∗ .279∗ .455∗
Dark .552 .425 .630 .334 .472 .401∗ .409∗ .595∗ .239∗
Sad .496 .361 .563 .396 .516 .445 .455 .328∗ .469Angry .576 .480 .644 .241∗∗∗ .258∗∗∗ .265∗∗∗ .286∗ −.131∗ .432∗
Sensual .603 .446 .643 .319∗∗ .520∗ .424∗∗ .226∗ .589 .542Sentimental .498 .334 .568 .380 .486 .309 .220∗ .420 .356
Note: ∗p < .05; ∗∗p < .01; ∗∗∗p < .001, df = 6.
method. NMF outperformed ACT only at predictingSad, but this difference was not, however, statisticallysignificant.
In general, median performances of ACT werelower for the individual mood scales than for VATdimensions, ranging from rs = .496 (Sad) to rs =.603 (Sensual). Performance difference between ACTand baseline techniques was the most notable forAtmospheric and Angry. While ACT yielded medianperformances rs = .525 for the former scale andrs = .576 for the latter, the most successful baselinetechniques (NMF and VSM, respectively) produced
only rs = .229 and rs = .286.
ACT performance was generally more sensitive tothe value of k for the individual mood terms thanfor the VAT dimensions. The performance range wassmallest for Happy (∆rs = .105, .506 ≤ rs ≤ .612) andlargest for Sentimental (∆rs = .234, .334 ≤ rs ≤ .568).However, the corresponding numbers were higher forall baseline techniques.
All in all, these results show that ACT is efficientat predicting the individual mood terms and givesconsistent performance for mood terms (Atmospheric,Angry), which the baseline techniques fail at predict-

IEEE TRANSACTIONS ON KNOWLEDGE AND DATA ENGINEERING 12
ing. Together with the findings for VAT dimensions,this suggests that domain knowledge on moods canbe utilized to great benefit in semantic computing.
7.3 ACT with Alternative Implementations
While ACT clearly outperformed the baseline tech-niques at predicting the perceived mood, we carriedout further comparative performance evaluation withACT to assess the optimality of the technique. Inparticular, we were interested to find whether it isbeneficial to implement ACT with dimension reduc-tion in two stages, involving low-rank approximationwith SVD and mood term configuration with MDS.For this evaluation we analyzed the performance oftwo models: a) SVD-only applying Procrustes directlyon the SVD mood term configuration ui = Uk
i Sk
(k = 3) without the MDS stage; and b) MDS-onlyapplying MDS on the cosine distances between moodterms computed from the raw TF-IDF matrix insteadof the low-rank representation. In must be noted,however, that the latter model effectively correspondsto the original ACT with k = |terms| but is computa-tionally heavier than the original ACT when the TF-IDF matrix is large.
The results presented in Table 3 show that bothACT implementations yielded performance mostlycomparable to that of the original ACT. The originalACT generally outperformed both alternative imple-mentations. This difference was statistically significantin seven moods for SVD-only and in four moodsfor MDS-only. SVD-only outperformed the originalACT for Dark, whereas MDS-only yielded the highestperformance for Arousal and Atmospheric. However,the performance differences for MDS-only were notstatistically significant. The clearest difference wasbetween ACT and SVD-only for Angry, where SVD-only failed to produce positive correlation.
The results suggest that mood prediction perfor-mance of ACT is significantly boosted by utilizingboth SVD and MDS.
7.4 The Effect of Tag Sparsity on ACT Perfor-mance
As noted in the introduction, social tag data is sparse,meaning that a typical document is associated toonly a subset of all relevant tags. In the mood datafetched from Last.fm 493,539 tracks are associated toat least one mood term, whereas only 38,450 tracksare associated to at least 8 terms, which is approxi-mately the average within the test set. If we consideronly the level of data sparsity, we can assume thatthe performance presented above extends to approxi-mately 38,000 tracks. The question is, how high couldprediction performance be expected for the larger setof almost 500,000 tracks?
To study this question, we carried out systematicperformance assessment with ACT as a factor of the
1 2 3 4 5 6 7 80
0.1
0.2
0.3
0.4
0.5
0.6
0.7
# TERMS / TRACK
r s
VALENCE
(a)
1 2 3 4 5 6 7 80
0.1
0.2
0.3
0.4
0.5
0.6
0.7
# TERMS / TRACK
s
AROUSAL
(b)
Fig. 8. The relationship between the number of tagsfor each track and the ACT performance (k = 32) for(a) Valence and (b) Arousal.
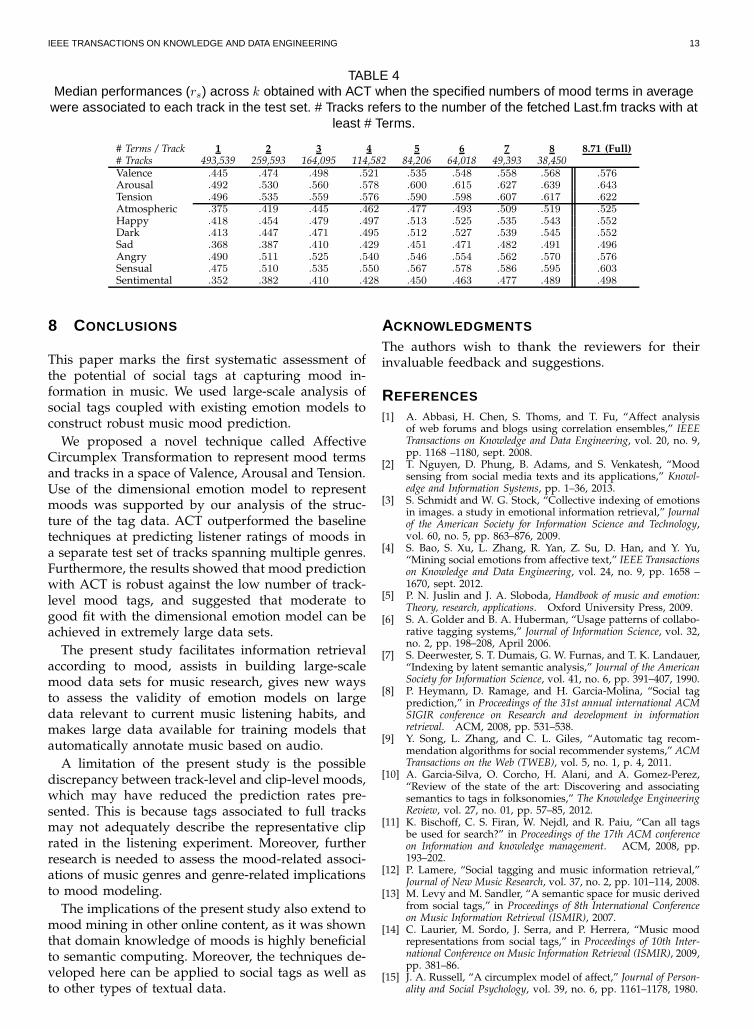
number of mood terms associated to the test tracks.Starting with the full test set, we iteratively removedone term-track association at a time until all trackswere associated to only one term. The association tobe removed was sampled in a weighted random man-ner at each iteration, weighting tracks directly propor-tional to the number of associated terms, and termswith lower raw within-track counts. We recordedACT performance at each iteration, and calculatedthe mean performance across ten separate runs. Theprocess can be seen as imitating user tagging, where anovel track in a system is most likely first applied withclearly descriptive tags. The results of the analysis aresummarized in Table 4, showing the median perfor-mance across k obtained with 1, 2, 4, 6 and 8 termsassociated to each track in average.
The results suggest that tag sparsity and predictionperformance are in a strong linear positive relation-ship, supporting the assumption that tag sparsityprimes the ACT prediction performance. This rela-tionship held also at each of the ten separate runs(see Fig. 8). Depending on the mood, performanceachieved with only one tag in each track was ap-proximately rs = .433 and varied between rs = .352(Sentimental) and rs = .496 (Tension). Differencebetween the performances obtained with the full testset to that with only one term for each track was onaverage ∆rs = .132, .086 ≤ ∆rs ≤ .151, which is nota drastic drop considering that the prediction basedon one term alone deals with a lot less track-levelinformation.
These results suggest that ACT prediction is robustagainst the low number of track-level mood tags.Based on the results, we estimate that the correlationsof rs = .433 between the perceived mood and ACTmood predictions extend to the large set of almost500,000 tracks extracted from Last.fm. This gives pos-itive implications for utilizing sparse but abundantsocial tags to manage and retrieve music.
IEEE TRANSACTIONS ON KNOWLEDGE AND DATA ENGINEERING 13
TABLE 4Median performances (rs) across k obtained with ACT when the specified numbers of mood terms in average
were associated to each track in the test set. # Tracks refers to the number of the fetched Last.fm tracks with atleast # Terms.
# Terms / Track 1 2 3 4 5 6 7 8 8.71 (Full)# Tracks 493,539 259,593 164,095 114,582 84,206 64,018 49,393 38,450Valence .445 .474 .498 .521 .535 .548 .558 .568 .576Arousal .492 .530 .560 .578 .600 .615 .627 .639 .643Tension .496 .535 .559 .576 .590 .598 .607 .617 .622Atmospheric .375 .419 .445 .462 .477 .493 .509 .519 .525Happy .418 .454 .479 .497 .513 .525 .535 .543 .552Dark .413 .447 .471 .495 .512 .527 .539 .545 .552Sad .368 .387 .410 .429 .451 .471 .482 .491 .496Angry .490 .511 .525 .540 .546 .554 .562 .570 .576Sensual .475 .510 .535 .550 .567 .578 .586 .595 .603Sentimental .352 .382 .410 .428 .450 .463 .477 .489 .498
8 CONCLUSIONS
This paper marks the first systematic assessment ofthe potential of social tags at capturing mood in-formation in music. We used large-scale analysis ofsocial tags coupled with existing emotion models toconstruct robust music mood prediction.
We proposed a novel technique called AffectiveCircumplex Transformation to represent mood termsand tracks in a space of Valence, Arousal and Tension.Use of the dimensional emotion model to representmoods was supported by our analysis of the struc-ture of the tag data. ACT outperformed the baselinetechniques at predicting listener ratings of moods ina separate test set of tracks spanning multiple genres.Furthermore, the results showed that mood predictionwith ACT is robust against the low number of track-level mood tags, and suggested that moderate togood fit with the dimensional emotion model can beachieved in extremely large data sets.
The present study facilitates information retrievalaccording to mood, assists in building large-scalemood data sets for music research, gives new waysto assess the validity of emotion models on largedata relevant to current music listening habits, andmakes large data available for training models thatautomatically annotate music based on audio.
A limitation of the present study is the possiblediscrepancy between track-level and clip-level moods,which may have reduced the prediction rates pre-sented. This is because tags associated to full tracksmay not adequately describe the representative cliprated in the listening experiment. Moreover, furtherresearch is needed to assess the mood-related associ-ations of music genres and genre-related implicationsto mood modeling.
The implications of the present study also extend tomood mining in other online content, as it was shownthat domain knowledge of moods is highly beneficialto semantic computing. Moreover, the techniques de-veloped here can be applied to social tags as well asto other types of textual data.
ACKNOWLEDGMENTS
The authors wish to thank the reviewers for theirinvaluable feedback and suggestions.
REFERENCES
[1] A. Abbasi, H. Chen, S. Thoms, and T. Fu, “Affect analysisof web forums and blogs using correlation ensembles,” IEEETransactions on Knowledge and Data Engineering, vol. 20, no. 9,pp. 1168 –1180, sept. 2008.
[2] T. Nguyen, D. Phung, B. Adams, and S. Venkatesh, “Moodsensing from social media texts and its applications,” Knowl-edge and Information Systems, pp. 1–36, 2013.
[3] S. Schmidt and W. G. Stock, “Collective indexing of emotionsin images. a study in emotional information retrieval,” Journalof the American Society for Information Science and Technology,vol. 60, no. 5, pp. 863–876, 2009.
[4] S. Bao, S. Xu, L. Zhang, R. Yan, Z. Su, D. Han, and Y. Yu,“Mining social emotions from affective text,” IEEE Transactionson Knowledge and Data Engineering, vol. 24, no. 9, pp. 1658 –1670, sept. 2012.
[5] P. N. Juslin and J. A. Sloboda, Handbook of music and emotion:Theory, research, applications. Oxford University Press, 2009.
[6] S. A. Golder and B. A. Huberman, “Usage patterns of collabo-rative tagging systems,” Journal of Information Science, vol. 32,no. 2, pp. 198–208, April 2006.
[7] S. Deerwester, S. T. Dumais, G. W. Furnas, and T. K. Landauer,“Indexing by latent semantic analysis,” Journal of the AmericanSociety for Information Science, vol. 41, no. 6, pp. 391–407, 1990.
[8] P. Heymann, D. Ramage, and H. Garcia-Molina, “Social tagprediction,” in Proceedings of the 31st annual international ACMSIGIR conference on Research and development in informationretrieval. ACM, 2008, pp. 531–538.
[9] Y. Song, L. Zhang, and C. L. Giles, “Automatic tag recom-mendation algorithms for social recommender systems,” ACMTransactions on the Web (TWEB), vol. 5, no. 1, p. 4, 2011.
[10] A. Garcia-Silva, O. Corcho, H. Alani, and A. Gomez-Perez,“Review of the state of the art: Discovering and associatingsemantics to tags in folksonomies,” The Knowledge EngineeringReview, vol. 27, no. 01, pp. 57–85, 2012.
[11] K. Bischoff, C. S. Firan, W. Nejdl, and R. Paiu, “Can all tagsbe used for search?” in Proceedings of the 17th ACM conferenceon Information and knowledge management. ACM, 2008, pp.193–202.
[12] P. Lamere, “Social tagging and music information retrieval,”Journal of New Music Research, vol. 37, no. 2, pp. 101–114, 2008.
[13] M. Levy and M. Sandler, “A semantic space for music derivedfrom social tags,” in Proceedings of 8th International Conferenceon Music Information Retrieval (ISMIR), 2007.
[14] C. Laurier, M. Sordo, J. Serra, and P. Herrera, “Music moodrepresentations from social tags,” in Proceedings of 10th Inter-national Conference on Music Information Retrieval (ISMIR), 2009,pp. 381–86.
[15] J. A. Russell, “A circumplex model of affect,” Journal of Person-ality and Social Psychology, vol. 39, no. 6, pp. 1161–1178, 1980.

IEEE TRANSACTIONS ON KNOWLEDGE AND DATA ENGINEERING 14
[16] M. Zentner, D. Grandjean, and K. Scherer, “Emotions evokedby the sound of music: Characterization, classification, andmeasurement,” Emotion, vol. 8, no. 4, pp. 494–521, 2008.
[17] P. Ekman, “An argument for basic emotions,” Cognition &Emotion, vol. 6, pp. 169–200, 1992.
[18] T. Eerola and J. K. Vuoskoski, “A review of music and emotionstudies: Approaches, emotion models and stimuli,” MusicPerception, vol. 30, no. 3, pp. 307–340, 2012.
[19] G. Salton, A. Wong, and C. S. Yang, “A vector space modelfor automatic indexing,” Communications of the ACM, vol. 18,no. 11, pp. 613–620, Nov. 1975.
[20] D. Seung and L. Lee, “Algorithms for non-negative matrixfactorization,” Advances in neural information processing systems,vol. 13, pp. 556–562, 2001.
[21] T. Hofmann, “Unsupervised learning by probabilistic latentsemantic analysis,” Machine learning, vol. 42, no. 1-2, pp. 177–196, 2001.
[22] E. Law, B. Settles, and T. Mitchell, “Learning to tag fromopen vocabulary labels,” in Machine Learning and KnowledgeDiscovery in Databases, ser. Lecture Notes in Computer Science,J. Balcazar, F. Bonchi, A. Gionis, and M. Sebag, Eds. SpringerBerlin Heidelberg, 2010, vol. 6322, pp. 211–226.
[23] N. Zhou, W. Cheung, G. Qiu, and X. Xue, “A hybrid proba-bilistic model for unified collaborative and content-based im-age tagging,” IEEE Transactions on Pattern Analysis and MachineIntelligence, vol. 33, no. 7, pp. 1281–1294, 2011.
[24] J. Peng, D. D. Zeng, and Z. Huang, “Latent subject-centeredmodeling of collaborative tagging: An application in socialsearch,” ACM Transactions on Management Information Systems,vol. 2, no. 3, pp. 15:1–15:23, Oct. 2008.
[25] R. Wetzker, W. Umbrath, and A. Said, “A hybrid approachto item recommendation in folksonomies,” in Proceedings ofthe WSDM’09 Workshop on Exploiting Semantic Annotations inInformation Retrieval. ACM, 2009, pp. 25–29.
[26] M. Levy and M. Sandler, “Learning latent semantic models formusic from social tags,” Journal of New Music Research, vol. 37,no. 2, pp. 137–150, 2008.
[27] R. Peter, G. Shivapratap, G. Divya, and K. Soman, “Evaluationof svd and nmf methods for latent semantic analysis,” Inter-national Journal of Recent Trends in Engineering, vol. 1, no. 3, pp.308–310, 2009.
[28] R. A. Calvo and S. Mac Kim, “Emotions in text: Dimensionaland categorical models,” Computational Intelligence, 2012.
[29] K. R. Scherer, Emotion as a multicomponent process: A model andsome cross-cultural data. Beverly Hills: CA: Sage, 1984, pp.37–63.
[30] R. E. Thayer, The Biopsychology of Mood and Arousal. OxfordUniversity Press, New York, USA, 1989.
[31] P. Juslin and P. Laukka, “Expression, perception, and inductionof musical emotions: A review and a questionnaire study ofeveryday listening,” Journal of New Music Research, vol. 33, pp.217–238, 2004.
[32] P. Juslin, S. Liljestrom, P. Laukka, D. Vastfjall, andL. Lundqvist, “Emotional reactions to music in a nationallyrepresentative sample of swedish adults prevalence and causalinfluences,” Musicae scientiae, vol. 15, no. 2, pp. 174–207, 2011.
[33] M. R. Zentner and T. Eerola, Handbook of Music and Emotion.Boston, MA: Oxford University Press, 2010, ch. Self-reportmeasures and models, pp. 187–221.
[34] M. M. Bradley and P. J. Lang, “Affective norms for englishwords (anew): Instruction manual and affective ratings,” Tech-nical Report C-1, The Center for Research in Psychophysiol-ogy, University of Florida, Tech. Rep., 1999.
[35] P. Saari, T. Eerola, and O. Lartillot, “Generalizability andsimplicity as criteria in feature selection: Application to moodclassification in music,” IEEE Transactions on Speech and AudioProcessing, vol. 19, no. 6, pp. 1802 –1812, aug. 2011.
[36] Y. H. Yang, Y. C. Lin, Y. F. Su, and H. H. Chen, “A regressionapproach to music emotion recognition,” IEEE Transactions onAudio, Speech, and Language Processing, vol. 16, no. 2, pp. 448–457, Feb. 2008.
[37] P. Shaver, J. Schwartz, D. Kirson, and C. O’Connor, “Emotionknowledge: further exploration of a prototype approach.”Journal of Personality and Social Psychology, vol. 52, no. 6, pp.1061–86, 1987.
[38] K. Hevner, “Experimental studies of the elements of expres-sion in music,” The American Journal of Psychology, vol. 48, no. 2,pp. 246–268, 1936.
[39] X. Hu and J. S. Downie, “Exploring mood metadata: relation-ships with genre, artist and usage metadata,” in Proceedingsof the 8th International Conference on Music Information Retrieval(ISMIR), 2007.
[40] C. Fellbaum, Ed., WordNet: An Electronic Lexical Database.Cambridge, MA: MIT Press, 1998.
[41] J. Kruskal, “Multidimensional scaling by optimizing goodnessof fit to a nonmetric hypothesis,” Psychometrika, vol. 29, pp. 1–27, 1964.
[42] C. Becavin, N. Tchitchek, C. Mintsa-Eya, A. Lesne, and A. Be-necke, “Improving the efficiency of multidimensional scalingin the analysis of high-dimensional data using singular valuedecomposition,” Bioinformatics, vol. 27, no. 10, pp. 1413–1421,May 2011.
[43] B. Hopkins and J. G. Skellam, “A new method for determiningthe type of distribution of plant individuals,” Annals of Botany,vol. 18, no. 2, pp. 231–227, 1954.
[44] R. G. Lawson and P. C. Jurs, “New index for clusteringtendency and its application to chemical problems,” Journalof Chemical Information and Computer Sciences, vol. 30, no. 1,pp. 36–41, 1990.
[45] J. C. Gower and G. B. Dijksterhuis, Procrustes problems. OxfordUniversity Press Oxford, 2004, vol. 3.
[46] M. I. Mandel, R. Pascanu, D. Eck, Y. Bengio, L. M. Aiello,R. Schifanella, and F. Menczer, “Contextual tag inference,”ACM Transactions on Multimedia Computing, Communicationsand Applications, vol. 7S, no. 1, pp. 32:1–32:18, October 2011.
[47] X. Hu, J. S. Downie, C. Laurier, M. Bay, and A. F. Ehmann,“The 2007 mirex audio mood classification task: Lessonslearned,” in Proceedings of 9th International Conference on MusicInformation Retrieval (ISMIR), 2008, pp. 462–467.
[48] J. Nunnally, Psychometric theory. New York: McGraw-Hill,1978.
[49] T. Eerola and J. Vuoskoski, “A comparison of the discreteand dimensional models of emotion in music.” Psychol. Music,vol. 39, no. 1, pp. 18–49, 2011.
[50] T. Eerola, “Are the emotions expressed in music genre-specific? an audio-based evaluation of datasets spanning clas-sical, film, pop and mixed genres,” Journal of New MusicResearch, vol. 40, no. 4, pp. 349–366, 2011.
Pasi Saari received MSc degree in Com-puter Science in 2008 and MA degree inMusicology in 2010 from the University ofJyvaskyla, Finland.
He is currently working as a Doctoral Stu-dent at the Finnish Centre of Excellencein Interdisciplinary Music Research withinthe University of Jyvaskyla, Finland. His re-search interests are in semantic computingof moods in music and content-based analy-sis of musical audio.
Tuomas Eerola received a PhD in musicol-ogy from the University of Jyvaskyla, Finlandand is currently a full Professor of Music atthis institution. He is also affiliated with theFinnish Centre of Excellence in Interdisci-plinary Music Research.
His research interest are in music cogni-tion, particularly the perception of melody,rhythm, timbre, and induction of emotions bymusic.