ieee transactions on human-machine · pdf filesystems in urban search and rescue scenarios...
TRANSCRIPT
IEEE
Proo
f
IEEE TRANSACTIONS ON HUMAN-MACHINE SYSTEMS 1
A Systems Analysis of the Introduction of UnmannedAircraft Into Aircraft Carrier Operations
1
2
Jason C. Ryan and Mary L. Cummings3
Abstract—Recent advances in unmanned and autonomous vehi-4cle technology are accelerating the push to integrate these vehicles5into environments, such as the National Airspace System, the na-6tional highway system, and many manufacturing environments.7These environments will require close collaboration between hu-8mans and vehicles, and their large scales mean that real-world field9trials may be difficult to execute due to concerns of cost, availabil-10ity, and technological maturity. This paper describes the use of an11agent-based model to explore the system-level effects of unmanned12vehicle implementation on the performance of these collaborative13human–vehicle environments. In particular, this paper explores14the introduction of three different unmanned vehicle control archi-15tectures into aircraft carrier flight deck operations. The different16control architectures are tested under an example mission scenario17using 22 aircraft. Results show that certain control architectures18can improve the rate of launches, but these improvements are lim-19ited by the structure of flight deck operations and nature of the20launch task (which is defined independently of vehicles). Until the21launch task is improved, the effects of unmanned vehicle control22architectures on flight deck performance will be limited.23
Index Terms—Agent-based modeling, decision support system,24human–automation interaction, human supervisory control.25
I. INTRODUCTION26
IMPROVING the capabilities of unmanned vehicles has been27
a key area of research over the past several years, but it is28
only relatively recently that they have improved to the point that29
integrating unmanned systems into civilian environments has30
become realistic. Several current examples exist: the Rio Tinto31
mining corporation is currently fielding autonomous hauling32
trucks in several locations [1], [2]; the Kiva systems order ful-33
fillment system, which utilizes robotic pallet carriers, is used34
by online retailers Amazon and Zappos.com, among others [3];35
automobile manufacturers continue to introduce new automated36
features, such as adaptive cruise control, lane departure warn-37
ings, and other technology while continuing to pursue automated38
road train and more advanced driverless technologies. Current39
initiatives by the defense advanced research projects agency40
(DARPA) seek to advance the capabilities of humanoid robotic41
Manuscript received May 1, 2014; revised July 13, 2014 and October 1, 2014;accepted November 1, 2014. This work was supported by the Office of NavalResearch Science of Autonomy program under Contract #N000140910625. Theopinions expressed in this paper are those of the authors and do not necessarilyreflect the opinions of the sponsoring agency. This paper was recommended byAssociate Editor D. Gillan.
J. C. Ryan is with the Humans and Automation Lab, Massachusetts Instituteof Technology, Cambridge, MA 02139 USA (e-mail: [email protected]).
M. L. Cummings is with the Humans and Autonomy Lab, Department ofMechanical Engineering and Materials Science, Duke University, Durham, NC27708 USA (e-mail: [email protected]).
Color versions of one or more of the figures in this paper are available onlineat http://ieeexplore.ieee.org.
Digital Object Identifier 10.1109/THMS.2014.2376355
systems in urban search and rescue scenarios (the DARPA 42
Robotics Challenge), while other research seeks to address how 43
robotic manufacturing systems cannot only work more safely 44
near humans, but how they can also have a better understanding 45
of the roles and tasks of their human collaborators [4]. 46
Each of the domains described above can be characterized 47
as a human centered, or heterogeneous manned-unmanned en- 48
vironment (HMUE): places where unmanned vehicles, human 49
collaborators, and manned vehicles interact in the same physical 50
space. A variety of heterogeneous manned environments, such 51
as airport operations and aircraft carrier flight decks, already ex- 52
ist today. As unmanned vehicles transition into these domains, 53
new paradigms of interaction will be required for human col- 54
laborators to work effectively with these unmanned vehicles. 55
Changes to operating procedures may also be required to ac- 56
commodate differences in capabilities between unmanned and 57
manned vehicles. Very little research has addressed what these 58
changes might be and how these changes, and the resulting in- 59
troduction of unmanned vehicles, might affect the performance 60
of the broader system. 61
Insight into the effects of unmanned vehicle integration on 62
the performance of these larger scale systems could be gained 63
by field testing prototype systems, but these environments are of 64
such large scale (in physical size and number of active elements) 65
that testing them in any meaningful manner would require sig- 66
nificant investments of time, money, and physical resources. 67
Even if these resources could be provided, if the unmanned 68
vehicle systems being tested are not sufficiently similar to the 69
future systems that would be deployed, the results may not be 70
useful. Such tests might also place the autonomous systems, 71
the researchers involved, and other by-standers in unforeseen 72
danger, while also being limited in the number and types of 73
conditions that could be explored. 74
Agent-based modeling [5] is one potential approach for ad- 75
dressing such limitations; these models attempt to replicate the 76
behavior of individual actors within a given environment. Con- 77
structing such models of the real-world system provides an av- 78
enue for testing unmanned vehicle performance under a variety 79
of test conditions that may not be easily achievable in live condi- 80
tions. This paper examines the use of an agent-based simulation 81
of a candidate HMUE, the aircraft carrier flight deck, for which 82
the United States Navy is currently testing an unmanned carrier 83
fighter aircraft that is expected to integrate fully into operations 84
with manned aircraft and human crew [6], [7]. Flight deck op- 85
erations are in many ways analogous to airport operations; in 86
both environments, aircraft begin parked in a designated area, 87
then coordinate with crew (or other controllers) to taxi to one of 88
a few designated launch areas. With the Federal Aviation Ad- 89
ministration’s (FAA’s) mandate to introduce unmanned aircraft 90
2168-2291 © 2014 IEEE. Personal use is permitted, but republication/redistribution requires IEEE permission.See http://www.ieee.org/publications standards/publications/rights/index.html for more information.

IEEE
Proo
f
2 IEEE TRANSACTIONS ON HUMAN-MACHINE SYSTEMS
into the national airspace system by 2015, inserting unmanned91
vehicles into ground operations will be a paramount concern.92
While the FAA has recognized the importance of ground oper-93
ations in this integration, their major focus at this time appears94
to be on airborne operations [8]. While there are differences in95
the structure of airport and aircraft carrier operations (runways96
versus an open deck) and the role of human collaborators in97
those environments, lessons learned from the carrier flight deck98
should be applicable to airport operations.99
This paper begins with a brief description of agent-based sim-100
ulation and its applicability to modeling these environments.101
The three different unmanned vehicle control architectures of102
interest are then described, followed by a discussion of cur-103
rent aircraft carrier flight deck operations and how they are104
modeled within the Multi-Agent Safety and Control Simula-105
tion (MASCS). The modeling of the unmanned vehicle control106
architectures within MASCS is then described, followed by a107
description of the testing of these vehicles under mission con-108
ditions utilizing sets of 22 aircraft. Additional tests then ex-109
plored how improvements to the launch task (with properties110
independent of vehicle control architecture) affect flight deck111
performance, as well as how changes to key control architecture112
design parameters can improve vehicle performance under these113
new conditions.114
II. RELATED WORK115
A. Agent-Based Modeling116
As described by Bonabeau [5], agent-based modeling is as117
much a perspective as it is a methodology, whereas the use118
of discrete-event or systems dynamics models may elicit spe-119
cific ideas of structure and constituent components, agent-based120
models vary widely in content and in methods of application.121
Examples range from human decision-making (e.g., [9]) to epi-122
demiology and disease transmission (e.g., [10]) to transportation123
systems involving both ground and aerial vehicles (e.g., [11]),124
among many others. The common theme is that, in each case,125
the agent-based modeling paradigm views the world “from the126
perspective of its constituent units” [5]—that the agents retain127
the same independence and exhibit similar decision-making out-128
comes as the real-world entities they are intended to replicate.129
The agents are then placed into the simulated environment, given130
a set of goals (which may be self-generated during the simula-131
tion), and allowed to make decisions independently from that132
point forward. An additional key to agent-based simulation de-133
velopment is the use of simple rules of behavior [5], [12]: agents134
are given limited options in any given decision they make. The135
simultaneous application of these simple decisions by the sim-136
ulated agents is typically sufficient to replicate the behavior of137
the real-world system.138
While agent-based modeling has been used to validate con-139
trol and sensing algorithms for a variety of Unmanned Aerial140
Vehicle (UAV) systems (e.g., [13]), these studies have primarily141
addressed systems involving the collaboration of multiple ve-142
hicles in performing tasks, such as searching for and tracking143
targets. Another common area of interest is in the modeling and144
control of UAV “swarms” (large groups of robots coordinat-145
ing on a specific task) [14]. Agent-based models have also been146
built to test unmanned vehicle survivability [15] and single UAV 147
search [16]. However, none of these examples has considered 148
the role of the human in interacting with the vehicle system, al- 149
though other nonagent-based models of human-UAV interaction 150
have been constructed [17], [18]. These latter models focused 151
on the human as a processing server working within a queuing 152
system, considering the behavior of the vehicle only in that it 153
requires the operator to provide it a task. These latter models 154
only, however, examined a single system of interest and did not 155
construct models over a range of different vehicle control ar- 156
chitectures. These models typically included only a few (4–8) 157
aircraft in their models, as well. 158
No prior work could be located regarding the models of air- 159
craft carrier flight deck operations, nor of agent-based models of 160
similar collaborative human–vehicle domains (such as airport 161
ground operations or mining environments) that included mod- 162
els of unmanned vehicle behaviors. The agent-based models 163
cited in the earlier paragraph provided only general guidance on 164
model development: the reliance on states, parameters, and sim- 165
ple rules of decision-making and motion. This formed the core 166
approach to modeling the different unmanned vehicle architec- 167
tures, with a focus on the features of UAV behavior that would 168
have the most impact on the flight deck: physical motion, task ex- 169
ecution, and interactions with operators and other human collab- 170
orators in the world. These techniques were used to develop the 171
models of three different UAV control architectures—gestural 172
control (GC), vehicle-based supervisory control (VBSC), and 173
system-based supervisory control (SBSC), which are discussed 174
in the following sections—to determine their effects on flight 175
deck launch performance. 176
B. Gesture Control Systems 177
GC systems replace a human operator with a set of stereo- 178
vision cameras and a sophisticated computer algorithm that 179
replicates a subset of visual tasks performed by the human oper- 180
ator. In practice, this means that the system must be able to detect 181
human collaborators in the world, track their movement, then 182
track the motion of their hands, arms, and sometimes fingers. 183
These motions are then translated into specific gesture defini- 184
tions, which are correlated with specific tasks for the vehicles 185
(e.g., “stop” or “turn left”). The vehicle’s onboard autonomy 186
then decomposes these actions into specific low-level control 187
commands for sensors and effectors (throttle, steering, etc.). 188
While gesture recognition technology is available commer- 189
cially in systems, such as the XBOX Kinect, the utilization of 190
this technology for vehicle control remains in the research and 191
development phase. One example of this is research currently 192
being conducted by Song et al. that aims to construct a GC sys- 193
tem specifically for aircraft carrier flight deck operations [19], 194
[20]. This carrier environment is a unique case in that commands 195
to human pilots are already provided solely through hand ges- 196
tures, providing a natural mapping to gesture control systems. 197
C. Supervisory Control Systems 198
Sheridan’s original definition of supervisory control systems 199
defined them as systems in which one or more human operators 200
are commanding and receiving feedback from an autonomous 201

IEEE
Proo
f
RYAN AND CUMMINGS: A SYSTEMS ANALYSIS OF THE INTRODUCTION OF UNMANNED AIRCRAFT INTO AIRCRAFT CARRIER OPERATIONS 3
or robotic system that is performing tasks in the world [21]. This202
paper uses the term in a stricter sense: systems in which the hu-203
man operator issues commands and receives feedback through a204
graphical user interface that translates symbolic inputs into ac-205
tions for the robotic systems, which then decompose the actions206
into specific low-level control inputs. This typically requires207
substantial computational intelligence onboard the vehicle, as208
well as a variety of high-fidelity sensors to observe the world209
(GPS, LIDAR, and other range and sensing systems), cameras,210
high-accuracy inertial measurement devices, along with intelli-211
gent planning algorithms to handle vehicle routing and translate212
operator commands into low-level control inputs.213
This paper classifies these systems into two forms. The first214
form is referred to as VBSCin which supervisors supply com-215
mands to a single vehicle at a time, working iteratively through216
the queue of vehicles waiting for instruction (e.g., [22]). The217
operator functions as a processing server within the system,218
maintaining a queue of vehicles awaiting task assignments and219
interacting with them individually. These systems have been a220
subject of significant prior work, a common theme of which has221
been the examination of the “fan-out” problem: how many ve-222
hicles the operator can manage without significant performance223
degradation. Past research has shown that operators can control224
up to eight ground vehicles or 12 aircraft at a time [23], an225
acceptable number for aircraft flight deck operations in which226
there are no more than 8–12 vehicles taxiing at one time.227
Controlling more than 8 to 12 vehicles requires the introduc-228
tion of additional autonomy in the form of intelligent planning229
and scheduling systems. These are integrated with additional230
decision support displays to form the class of SBSC systems,231
in which the operator works with the planning algorithms to232
replan all tasks for all vehicles simultaneously (e.g., [24]). Typi-233
cally, the operator will provide goals for the planning algorithm234
(e.g., weights for the objective function) and may also insert235
additional constraints (e.g., time windows for the execution of236
certain tasks). The planning algorithm generates a candidate set237
of assignments that is then reviewed by the operator, who has a238
chance to reject the plan or make modifications. Once the plan239
is accepted, tasks are transmitted to vehicles, which then fol-240
low the prescribed motion paths and execute the assigned tasks.241
The human supervisor’s responsibility is to monitor the execu-242
tion of the plan and create new plans in the event of failures or243
performance degradation.244
III. MULTIAGENT SAFETY AND CONTROL245
SIMULATION MODEL246
As the unmanned vehicle systems described in Section II247
do not yet exist for flight deck operations, simulations of their248
behavior cannot be validated directly. Instead, MASCS was cre-249
ated first as a model of manual control (MC) flight deck op-250
erations, with the unmanned vehicle architectures defined as251
modifications from this model. MASCS was then partially val-252
idated against empirical data in prior work [25] because of the253
limitations on accessible data on flight deck operations, pilot be-254
havior, and other factors, full validation of this simulation is not255
possible at this time. Constructing the model required defining256
agents that replicate the behavior of human crew, pilots, aircraft,257
planning supervisors, flight deck equipment, as well as models 258
of the tasks that they perform. Agent and task models consist of 259
decision-making rules that govern agent behavior, parameters 260
that describe how agents view and execute tasks in the world, 261
and states that are viewable by other agents and are used in the 262
decision-making routines. 263
The validation process compared the performance of indi- 264
vidual aircraft and missions of multiple aircraft with empirical 265
data on operations. This included the average time to complete 266
launch missions of 18 to 34 aircraft, the interdeparture times 267
of launches within those missions, and response of the sys- 268
tem to changes in vehicle behaviors (e.g., speed). Additionally, 269
a team of subject matter experts (SMEs) reviewed animations 270
of simulation execution. SMEs had a range of experience on 271
the flight deck, each over multiple years (two pilots each with 272
more than 800 flight hours in fighter aircraft; another individ- 273
ual with over 3000 h as a Naval Flight Officer and 2 years as 274
a launch and recovery officer). All were currently employed 275
by Navy research organizations. SMEs were allowed to review 276
repeated executions of the simulation in order to critique the 277
activity of agents on the flight deck. SMEs were also shown 278
quantitative results from validation testing to provide feedback 279
on the accuracy of the simulation in terms of mission comple- 280
tion times. SMEs judged that the simulation was a reasonable 281
replication of flight deck operations and did not find any ma- 282
jor errors in modeling that required correction. Modeling pro- 283
ceeded to include the unmanned vehicles reported here, which 284
were created by modifying six key parameters of the MC air- 285
craft models: aircraft routing methods, visual detection accu- 286
racy, command comprehension rates, catapult alignment failure 287
rates, camera field of view, and system latencies. This section 288
first describes the basics of flight deck operations relevant to this 289
paper and how these operations were modeled within MASCS 290
before discussing the modeling of the unmanned vehicle control 291
architectures. 292
A. Aircraft Carrier Flight Deck Operations 293
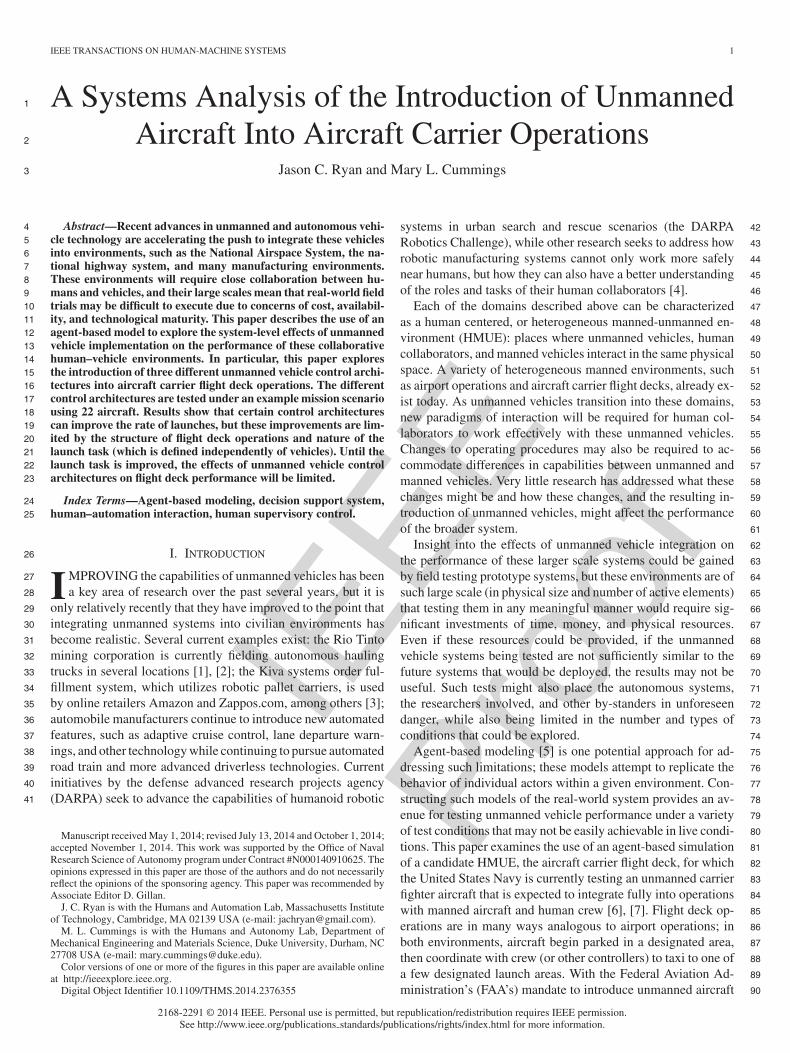
A digitized map of the flight deck appears in Fig. 1. Labels 294
in the figure highlight the important features of the flight deck 295
environment relevant to launch operations. Aircraft begin parked 296
at the edges of the flight deck in the aft and starboard areas of 297
deck; aircraft not able to fit in those areas are parked in the 298
area known as “The Street.” Aircraft will be assigned to launch 299
from one of the four launch catapults (orange lines in the figure, 300
numbered one to four). Each catapult is capable of launching 301
a single aircraft at a time, but adjacent pairs of aircraft (1,2 or 302
3,4) are not able to operate in parallel, for two reasons. The first 303
is that a single set of crew operates each pair of catapults and 304
can only manage one catapult at a time. The second, and more 305
important, is that the catapults are angled toward one another— 306
simultaneous launches would result in a collision and loss of 307
both aircraft. Catapults alternate launches within each pair, but 308
the two pairs can process in parallel (e.g., 1 and 3 or 2 and 309
4). Operations typically allow one aircraft on the catapult and 310
another waiting behind a protective barrier that rises from the 311
deck during a launch. As such, each pair of catapults (if both 312
are active) can queue up to four aircraft in the area at any time, 313
but only one aircraft will be in the process of launching. 314
IEEE
Proo
f
4 IEEE TRANSACTIONS ON HUMAN-MACHINE SYSTEMS
Fig. 1. Digital map of the aircraft carrier flight deck. Labels indicate important features for launch operations. Yellow dots represent Aircraft Director crew activeon the flight deck.
The process of launching an aircraft requires that several315
tasks can be done in parallel. The aircraft must taxi forward316
on to the catapult, aligning its front wheel (nose gear) with the317
catapult centerline. The nose wheel is then physically attached318
to a part of the catapult known as “the pendant.” While this is319
occurring, other crew are confirming the aircraft’s current fuel320
level and total weight to calibrate the catapult for launch. The321
pilot also completes a set of control surface checks to ensure322
that the aircraft is ready for flight. These simultaneous tasks323
are modeled within MASCS as a single time distribution (N324
(109.65, 57.802)), based on prior research and discussions with325
SMEs.326
Once these preparatory actions are complete, the catapult is327
triggered and the pendant begins pushing the nose gear and328
the aircraft forward up to flight speed. This acceleration task,329
also based on observations of flight deck operations, is modeled330
as a single time distribution (lognormal with location param-331
eter μ = 1.005 and shape parameter σ = 0.0962). Once the332
launch is complete, the aircraft at the adjacent catapult begins333
launch preparations, while the aircraft originally parked behind334
now taxis onto the catapult and waits for the adjacent catapult335
to complete its launch. Each of these tasks is independent of336
the type of vehicle being launched and is influenced primarily337
by the equipment and crew involved, rather than the control338
architecture.339
Getting aircraft from parking places to catapults requires in-340
teractions with human crew on the flight deck. A senior enlisted341
person, termed the Deck Handler, and his staff are responsible342
for creating the schedule of operations and allocating aircraft to343
launch catapults. At the start of operations, assignments will be344
made such that queues at all catapults are filled. As launches oc-345
cur and slots open at catapult queues, aircraft are dynamically346
allocated, assigning the next highest priority aircraft that has347
an open taxi route to a catapult. Aircraft assignments are then348
passed to a set of crew on the flight deck, termed Aircraft Di-349
rectors (yellow circles in Fig. 1), who provide taxi instructions350
to aircraft. These crew work in a form of “zone coverage,” each351
controlling a specific area of the deck (which may overlap with352
others). A Director will taxi the aircraft through their area, then353
hand the aircraft over to an adjacent Director before accepting354
another aircraft into their area. Directors communicate instruc-355
tions to pilots using a set of hand gestures, informing the pilot356
when to drive forward, stop, turn, and to whom they are being357
passed off. Directors also must maintain an understanding of 358
current traffic conditions on the flight deck, delaying some air- 359
craft to allow other aircraft to taxi by. This may be because the 360
other aircraft has a higher priority, or that failing to do so would 361
“lock” the deck, with aircraft unable to taxi to their required 362
destinations. 363
Models of these actors were constructed within the MASCS 364
model, each with their own sets of decision rules to replicate the 365
behaviors described in the previous paragraphs. Table I provides 366
a summary list of agents modeled in MASCS and the relevant 367
decision making rules and parameters of each. As noted previ- 368
ously, the goal in agent-based modeling is typically to make the 369
decision rules as simple as possible [5]. In MASCS, this was 370
done by building decision rules that had only a limited number 371
of options in each decision. Most decision-making models in 372
MASCS are binary (yes/no) and based on the current locations 373
and states of agents on the deck. Options are often reviewed it- 374
eratively, selecting the first feasible option. If no feasible option 375
exists, no action is taken and the system waits until conditions 376
change. 377
The Deck Handler agent’s scheduling rules are based on a 378
set of assignment heuristics elicited from SMEs as part of prior 379
work [26]. Given a list of aircraft waiting to launch, their lo- 380
cations, and their priorities, simple rules attempt to assign the 381
highest priority aircraft to the nearest available catapult. Air- 382
craft Director agents include a data structure describing to which 383
other Directors they can pass aircraft to and rules that determine 384
whether or not an aircraft can be passed off to the desired next 385
Director, whether the Director can accept new aircraft them- 386
selves, as well as how to align to the aircraft they are currently 387
instructing so that they are visible to the pilot. Aircraft and pilots 388
are modeled within MASCS as a single unit at this time. Their 389
models primarily concern physical motion on the flight deck 390
and their ability to follow instructions from the Aircraft Direc- 391
tor crew. Of greatest importance are rules that describe whether 392
they can “see” a Director. Whether a pilot can “see” a Director 393
is a simple check of whether the Director is in the visible area 394
of the aircraft, as defined by a field-of-view parameter. 395
Aircraft Directors and Aircraft/Pilot models both require 396
models of their motion on the flight deck. These models require 397
both the definition of speed of travel and rules that describe 398
the paths they should take on the flight deck. These rules were 399
placed into separate task models that are assigned to agents for 400
IEEE
Proo
f
RYAN AND CUMMINGS: A SYSTEMS ANALYSIS OF THE INTRODUCTION OF UNMANNED AIRCRAFT INTO AIRCRAFT CARRIER OPERATIONS 5
TABLE ILIST OF AGENTS REQUIRED BY THE MASCS SIMULATION OF FLIGHT DECK LAUNCH OPERATIONS, THE IMPORTANT FEATURES (PARAMETERS AND LOGIC
STRUCTURES) INVOLVED IN THEIR MODELING, AND THE VALUES OF THOSE PARAMETERS
Agent Feature Description
Aircraft/Pilot Speed Rate at which vehicles taxi forward on the flight deck; N (3.5, 1.02)Turn Rate Rate at which vehicles rotate during taxi operations; 18° /sSight Angle Area in front of vehicle to view Directors; 85°
Aircraft Director Speed Rate at which crew walk on the flight deck; N (3.5, 1.02)Alignment logic Determines when and to what location Directors should align to aircraft
Deck Handler Routing Logic When and to what Director the vehicle should next be sentTraffic Management logic How to deconflict taxi paths on the flight deckRouting Logic Determines whether or not a taxi route exists between an aircraft and a catapult. Defined by
heuristics that examine whether aircraft are parked in key places on flight deck.Planning Logic Given rules of routing logic, assigns highest priority aircraft to nearest available catapult.
Prioritize sending aircraft to catapults with no aircraft in queue.Catapults Launch Constraints How launches alternate between catapults and when obstructions in the nearby area should
stop a launch in progressQueue Structure List of aircraft currently assigned to this catapult (maximum 2) and how aircraft are promoted
in the queue
execution. These task models determine, for a given agent with401
an assigned destination, what combination of straight line and402
turn actions is required. During execution, the models contin-403
ually check the conditions of the deck to make sure that the404
transit path is clear. For an aircraft taxiing on the flight deck,405
the “Taxi” task model continually checks 1) whether this action406
should be delayed due to traffic conditions and 2) if another407
aircraft is physically blocking the current vehicle, as well as 3)408
if the aircraft can “see” the Director. If any of these conditions409
is true, the motion is paused until conditions permit movement.410
All aircraft and crew execute such rules simultaneously during411
their operations.412
Modeling the UAV control architectures described in413
Section II within MASCS requires changes to the models de-414
scribed above. The general planning methods do not differ sub-415
stantially, nor do the models of physical motion. However, the416
rules governing task execution and taxi routing for MC opera-417
tions may not apply to unmanned vehicles due to the differences418
in control architecture capabilities. Other parameters describing419
the vehicles’ physical characteristics might also vary from the420
baseline MC model. The differences that define the unmanned421
vehicle control architectures used in this paper are discussed in422
the next section.423
B. Models of Unmanned Vehicle Behavior424
In the context of flight deck operations and the models of425
agent behavior, the important activities of a pilot that must be426
replicated by an unmanned vehicle control architecture involve427
three key aspects: visual detection of an Aircraft Director that is428
attempting to provide instructions, correctly interpreting task in-429
structions, and correctly executing the commanded tasks. Each430
of these corresponds to a related parameter: the probability of431
observing the Director if within the vehicle’s field of view, the432
probability of correctly interpreting the command, and the prob-433
ability of correctly executing a task. For the baseline MC model434
of current flight deck operations described in the previous sec-435
tion, the likelihoods of these failures are so low that SMEs con-436
sider them nonexistent (0% likelihoods). A fourth difference437
in behavior comes from the fact that the Director is providing438
instructions in this “zone coverage” routing; this may not occur 439
for some forms of UAV control, and thus how vehicles are routed 440
forms a fourth behavioral parameter of “routing method.” 441
Two other parameters relate to the physical characteristics 442
of design of the vehicle: the field of view of the pilot/aircraft, 443
which describes where the Director should be in order to provide 444
commands, and the latency in processing commands and exe- 445
cuting tasks. The field of view for manual operations is related 446
to human sight range and the constraints of being in the cockpit; 447
for unmanned vehicles, field of view is related to the cameras 448
used on the vehicle. The latency in processing commands could 449
come from a number of sources: delays in the communication 450
of signals between operator and vehicle, the time required for 451
the vehicle’s computer system to process, or time required for 452
the human operator to interact with the system. Each of these 453
can also be modeled as variables within the MASCS simulation 454
environment, and a full list of these six design parameters ap- 455
pears below. The following paragraphs describe the settings and 456
variations of these six performance parameters in the context of 457
the different vehicle control architectures. 458
1) Vehicle behavior parameters. 459
a) How aircraft are routed on the flight deck (with or 460
without the Aircraft Director crew). 461
b) Visual detection: the probability of failing to detect 462
an operator when they are within the field of view. 463
c) Task comprehension: the probability of failing to 464
comprehend an issued task. 465
d) Catapult alignment (task) execution: the probability 466
of failing to properly align to a catapult. 467
2) System Design parameters. 468
a) The field of view of the pilot/autonomous vehicle, 469
which affects how Aircraft Directors align to aircraft 470
during operations. 471
b) Latency and lag present in the system due to com- 472
munications latencies, processing times, or limita- 473
tions of the human operator. 474
1) Unmanned Aerial Vehicle Routing Methods: The first ma- 475
jor difference between UAV Control Architectures involves how 476
they are issued taxi commands and routed through the flight 477

IEEE
Proo
f
6 IEEE TRANSACTIONS ON HUMAN-MACHINE SYSTEMS
deck. GC systems interact with the crew on the flight deck in478
a similar fashion as MC vehicles, which requires modeling the479
three remaining vehicle behavior parameters in the list above.480
The two supervisory control systems leverage their centralized481
network to perform tasks in a different manner. VBSC systems482
would rely on commands issued from the Handler through a483
graphical user interface, which requires modeling the behavior484
of the Handler in operating such a system. In this form of system,485
the operator functions as a queuing server, which requires the486
definition of both a service time and a server policy for manag-487
ing tasks. For SBSC systems, the operator interacts periodically488
with a planning algorithm that replans all tasks for all vehicles489
at once. Once the plan is updated, the aircraft are allowed to490
execute tasks until such a time as a new plan is required.491
The planning heuristics used currently by experienced plan-492
ners aim to keep traffic moving on the flight deck in an orderly493
fashion, minimizing the occurrence of routing conflicts or other494
blockages that limit aircraft taxi motions [26]. To ensure this495
continuity in VBSC systems, experienced Handlers would likely496
operate in a “highest priority first” fashion, prioritizing aircraft497
nearest to their assigned catapults in order to keep traffic flowing498
on the deck. The time required to process tasks is taken from499
prior research by Nehme [17], whose research involved opera-500
tors controlling a team of unmanned vehicles through a VBSC-501
style interface, requiring them to define waypoints that defined502
vehicle transit paths, among other task assignments. Nehme503
characterized the “idle” task, in which operators assigned a new504
transit task to a waiting vehicle, as normally distributed with505
a mean of 3.19 s and standard deviation of 7.19 s (bounded506
[0, inf]).507
The interaction of the Handler’s interaction time with each508
vehicle and the current number of vehicles in the queue also509
generates latencies for VBSC systems: not only must a VBSC510
vehicle wait N (3.19, 7.192) seconds at the start of each of511
its own tasks, it must wait for all other vehicles ahead of it512
in the queue to be processed. If four vehicles are ahead in the513
queue, the fifth vehicle must wait (on average) 3.19 ∗ 5 = 15.95514
s before starting its next task. Thus, there is a significant penalty515
for including additional vehicles in the VBSC queueing system,516
which has been characterized in many previous studies (see [22],517
[23] for examples).518
Additionally, since this style of routing does not rely on the519
network of crew on the flight deck, the Handler can also assign520
longer taxi tasks on the flight deck—taxiing from aft to for-521
ward, barring other constraints, could be done in a single motion522
rather than requiring multiple handoffs between Directors. The523
taxi paths, however, would largely stay the same. These same524
routing changes also would occur for the SBSC architecture,525
which enable a single operator, with the help of a scheduling526
algorithm, to simultaneously define task lists for all vehicles. In527
the SBSC architecture, once assignments are made, just as with528
VBSC vehicles, tasks are carried out without the assistance of529
the Aircraft Directors in taxi operations. Prior work in this area530
[26] demonstrated that even complex planning algorithms have531
trouble decomposing the geometric constraints on the flight deck532
and provide little benefit over human planning. The appropriate533
development and testing of planning algorithms for the flight534
deck lies outside the scope of this research; for SBSC systems, 535
the same Handler planning heuristics applied to the other con- 536
trol architectures (CAs), which performed as well or better than 537
other planning algorithms in prior work [26], are applied here. 538
2) Visual Detection, Task Comprehension, and Task Execu- 539
tion: For the Gesture control systems that rely on visual in- 540
formation, the processes of visual detection of Aircraft Direc- 541
tors, comprehension of the commanded tasks, and the execu- 542
tion of those tasks must also be modeled. There is a chance 543
of failure in each individual recognition task, most impor- 544
tantly in recognizing and the Director and identifying the com- 545
mands they are providing. As these systems are still largely 546
in the research and development phase, there is no true fail- 547
ure rate known for gesture control activity in the flight deck 548
environment. A review of several papers [20], [27]–[33], most 549
of which incorporated data for multiple tests and trials and 550
references multiple prior studies, provided a picture of the 551
current general state of gesture recognition research. Out of 552
the 124 different experimental results reported, eight report 553
accuracies of 99% or better (all from a dataset using only 554
ten actions and a simple, homogeneous background), 32 re- 555
ported results better than 95%, and 77 reported better than 556
90% accuracy. Overall, the studies report an average failure rate 557
of 11.16%. It is not clear how this failure rate translates into 558
realistic future operations; while the technology will certainly 559
improve, a variety of environmental conditions (sun glare, ob- 560
structions, large numbers of moving vehicles) will limit perfor- 561
mance in the real world. While future real-world failure rates 562
are still not known, the median failure rate of 11.16% observed 563
in the research is used as the failure rate of the baseline GC 564
system. 565
A logical implementation of GC could imply that a failure to 566
recognize a Director might only happen once, after which the 567
Director would have the authority to force control of the vehicle. 568
If a vehicle fails to recognize a task, however, there may not be 569
a simple method to force the system to recognize that specific 570
task. It may take several attempts for the vehicle to register the 571
correct command, with each failure accruing a time penalty. For 572
the baseline MASCS model of GC, the penalty for failing to ac- 573
quire a new Director is set at 5 s, representing the time required 574
to realize the vehicle has not recognized the Director and for 575
the Director to issue an override. The time penalty for failing to 576
acquire task is modeled as a uniform distribution between 5 and 577
10 s, representing the time for the operator to stop, issue a cancel 578
command, and wait for the system to become ready to accept 579
new instructions. However, the original latency in processing is 580
not applied to these failures. The number of failures in com- 581
mand comprehension is determined at the start of each action 582
commanded by a Director by a Bernoulli trial generator, after 583
which the total time penalty is solved by randomly sampling the 584
uniform interval [5], [10] once for each failure incurred. 585
3) Latencies: One form of latency in the control architectures 586
occurs for the VBSC systems, due to the way in which the opera- 587
tor manages the queue of waiting vehicles (described previously 588
in Section III-B1). GC systems will also experience a form of 589
latency due to software processing, as the system attempts to 590
translate the hand gestures of the Director into understandable 591

IEEE
Proo
f
RYAN AND CUMMINGS: A SYSTEMS ANALYSIS OF THE INTRODUCTION OF UNMANNED AIRCRAFT INTO AIRCRAFT CARRIER OPERATIONS 7
TABLE IICOMPARISON OF UAV CONTROL ARCHITECTURE DESIGN PARAMETERS DEFINED FOR MASCS
Manual Control Gesture Control Vehicle-Based Supervisory Control System-Based Supervisory Control
Routing Method Zone coverage Zone coverage Centralized control Centralized controlVisual detection rate P(fail) = 0 P(fail) = 0.1118 N/A (central control) N/A (central control)Task Comprehension Rate P(fail) = 0 P(fail) = 0.1118 N/A (central control) N/A (central control)Task Execution Rate P(fail) = 0 P(fail) = 0.05 P(fail) = 0.025 P(fail) = 0.025Field of View 85° 65° N/A (central control) N/A (central control)Lag/Latency None 0–3 s (computation) N (3.19, 7.192) per task None
action commands. The prior research reviewed for error rates592
[20], [27]–[33] also shows this requires anywhere from <<1 to593
3 s; this is modeled as a uniform distribution over the range [0,594
3], randomly sampled and applied to the start of every action595
commanded by a Director.596
C. Performance Comparisons597
Table II provides a comparison of the four UAV control ar-598
chitectures to the baseline MC model in terms of the six primary599
design parameters described earlier. For the MC model, SMEs600
report that failures on these tasks are so rare that they do not601
really recognize them as occurring in the system: pilots rarely602
fail to see a Director if they are within their field of view, rarely603
fail to interpret a command, and rarely fail to properly align to604
a catapult. The field of view parameter was calibrated in prior605
work to a value of 85°. These settings were utilized in the model606
and partially validated in prior work [25] and are considered to607
be representative of the highly skilled pilots that work within608
the aircraft carrier flight deck.609
Each of the unmanned vehicle control architectures defined610
in previous sections can be modeled in MASCS by changes611
to the six design parameters listed in Table II. As compared612
with a baseline MC vehicle, GC systems will still operate under613
the crew’s “zone coverage” operating paradigm, but will intro-614
duce both a small to moderate processing latency at the start615
of each action and a chance to fail to recognize either the per-616
son issuing the command or the command itself (these are akin617
to another small delay at the start of operations). As noted in618
Sections III-B2 and III-B3, this latency ranges from 0–3 s and619
the average failure rates are slightly over 10%. The processing620
latency is randomly sampled over the defined interval at the621
start of the attempted task. Task failures can occur repeatedly,622
with each failure resulting in a time penalty between 5 and 10 s623
to resubmit commands to a GC vehicle. The time penalties are624
also sampled randomly over the defined interval. The use of625
cameras by the gesture recognition system might also constrain626
the applicable field of view for these vehicles, and the lack of627
a practiced pilot in aligning the aircraft to the catapult at the628
end of taxi operations will likely increase the rate of error on629
this task. However, there is no current evidence to suggest what630
this failure rate may be in real life. A catapult alignment failure631
rate of 5%, translating to roughly one failure per mission (once632
launch of a 22 aircraft sortie), was selected for the GC vehicles633
based on SME opinions.634
As VBSC and SBSC systems are centrally controlled, they635
receive no instructions from the crew. Thus, the visual detec-636
tion and task comprehension rates are not applicable for these637
two systems, nor is the modeling of a field of view. Both are 638
expected to at least have a nonzero failure rate in aligning to 639
aircraft catapults, set at once per two missions. SBSC systems 640
have no latency, as vehicles are sufficiently autonomous to ex- 641
ecute the series of tasks provided to them quickly and without 642
human interaction and any replanning occurs in parallel to ve- 643
hicle operations. VBSC systems, however, rely on a human 644
operator to supply tasks individually to aircraft, which must 645
wait in a queue for further instructions. This introduces latency 646
in the form of a wait time for operator interaction, which for 647
large numbers of aircraft may lead to significant delays in task 648
execution. 649
The differences in performance of individual vehicles under 650
these control architectures should thus be a function of the cu- 651
mulative delays and latencies experienced in task recognition 652
and execution. The GC and VBSC systems both experience a 653
greater level of latencies and delays than MC and SBSC systems 654
and should thus perform more poorly. For GC systems, these 655
arise from the chances of repeated errors and processing delays 656
on the part of the vehicles, while for VBSC they are due to 657
the need for repeated interactions with the human supervisors. 658
However, the impact of these delays and latencies when multiple 659
aircraft are included in flight deck operations will be influenced 660
by the structure of modern aircraft carrier flight deck operations. 661
The model of operations constructed for this paper was partially 662
validated in [25] and is discussed in the next section. 663
IV. EFFECTS ON OPERATIONS ON UNMANNED AERIAL 664
VEHICLE PERFORMANCE 665
The models of unmanned vehicle control architectures de- 666
scribed in the previous section were implemented into the 667
MASCS environment and verified through a set of tests that 668
examined the behavior of an individual aircraft on the flight 669
deck. The same mission scenario was executed for each of the 670
four control architectures (MC, GC, VBSC, and SBSC) with 671
300 replications performed in each case. A diagram of this task 672
appears in Fig. 2: the aircraft begins parked in the aftarea of the 673
flight deck and is assigned to launch from catapult 3, requiring 674
a series of straight-line and turning motions before culminat- 675
ing with the launch preparation and launch acceleration tasks. 676
This same scenario was used previously in the development and 677
testing of the baseline MC model [25]. The results of these sim- 678
ulations appear in Fig. 3, which shows the average time for a 679
single aircraft to complete the launch mission (from taxi through 680
launch acceleration) for each the four control architectures, with 681
whiskers indicating ±1 standard error in the data. 682

IEEE
Proo
f
8 IEEE TRANSACTIONS ON HUMAN-MACHINE SYSTEMS
Fig. 2. Diagram of mission executed in the single aircraft performance com-parisons.
Fig. 3. Values for launch event duration (LD) for single aircraft testing formanual control (MC), gestural control (GC), vehicle-based supervisory control(VBSC), and system-based supervisory control (SBSC). Bars indicate mean LDfor sets of 300 replications, with whiskers showing ±1 standard error.
In general, the responses of four control architectures match683
the expectations described earlier: the GC and vehicle-based684
supervisory control (VBSC) cases being the slowest and MC685
and SBSC being the fastest. An analysis of variance (ANOVA)686
test demonstrates that the differences between the MC, GC,687
SBSC, and VBSC cases are significant at the α = 0.05 level688
(F (3, 1196) = 66.07, p < 0.0001), and a Tukey test reveals that689
all pairwise comparisons are significant. In terms of practical690
differences, GC vehicles take 0.64 min longer to complete the691
task, VBSC 0.44 min, and SBSC are 0.22 min faster. While692
these are indeed small differences, percentagewise these trans-693
late into percentage differences of 18.4%, 12.5%, and −6.3%,694
respectively, from the MC baseline.695
However, the structure of flight deck operations may affect696
how these variations in individual vehicle performance are felt697
in missions using many aircraft. Flight deck operations, as well698
as airport operations, are such that aircraft depart an initial park-699
ing area and are sent to queue at a specific launch site. In terms700
of system performance, as long as another aircraft arrives at the701
site prior to the launch of the previous aircraft, the flight deck (or702
airport) is working effectively. In order for the differences in the703
individual control architectures to be observed at the mission704
level, the delays and latencies that affect GC and VBSC per-705
formance must disrupt taxi operations upstream of the catapult706
sufficiently to break the chain of queuing that occurs.707
Fig. 4. Results for Launch event Duration (LD) for each control architecturefor missions using 22 aircraft under the original launch preparation time model.Whiskers indicate ±1 standard error.
To test whether or not this occurs, the four control architec- 708
tures were tested in missions using 22 aircraft. In these missions, 709
all 22 aircraft begin parked at the edges of the flight deck. The 710
Deck Handler agent then dynamically assigns aircraft in real 711
time based on current aircraft priority and whether nearby cat- 712
apults are open and accessible to the aircraft. Each mission 713
utilized the same initial conditions (vehicle parking locations 714
and priorities) and used a completely homogeneous vehicle set 715
(all MC, or all Gesture Control, etc.). Thirty replications of each 716
mission were performed and the total time to complete the mis- 717
sion (from initialization to completion of the last launch) was 718
logged for each. Fig. 4 provides a column chart of the average 719
time to complete missions for each control architecture, with 720
whiskers indicating ±1 standard error in each dataset. 721
The data in the figure suggests no real variations occur in 722
system performance, with an ANOVA test returning marginally 723
significant results (F (3, 116) = 2.57, p = 0.058). This suggests 724
that the effects of GC and VBSC system delays are not suffi- 725
ciently disruptive to cause differences at the mission level, nor 726
are the benefits of the SBSC system, which does not rely on 727
the crew “zone coverage” routing, sufficient to improve perfor- 728
mance at a highly significant level. 729
One interpretation of these results is that an error exists either 730
within the aircraft models, the routing of aircraft to catapults, or 731
the processing of tasks at the catapults. However, the individual 732
models of aircraft (see Fig. 3) showed that differences in perfor- 733
mance do exist on an individual vehicle level; some mechanism 734
at the mission level is preventing these differences in individ- 735
ual performance from having an aggregate effect. One possible 736
explanation regards how aircraft queue at launch catapults, as 737
described in Section III-A: each catapult can allow one aircraft 738
onto the catapult and another to queue behind. At a catapult pair, 739
only one aircraft is actively preparing for launch at any given 740
time. Once this aircraft launches, the aircraft parked behind it 741
moves forward onto the catapult and the aircraft sitting on the 742
paired catapult begins preparing for launch. A new aircraft is 743
then taxied to the empty place in the catapult queue. 744
The actions of the Deck Handler create this queueing pattern 745
immediately and keep it in existence throughout the mission. 746
IEEE
Proo
f
RYAN AND CUMMINGS: A SYSTEMS ANALYSIS OF THE INTRODUCTION OF UNMANNED AIRCRAFT INTO AIRCRAFT CARRIER OPERATIONS 9
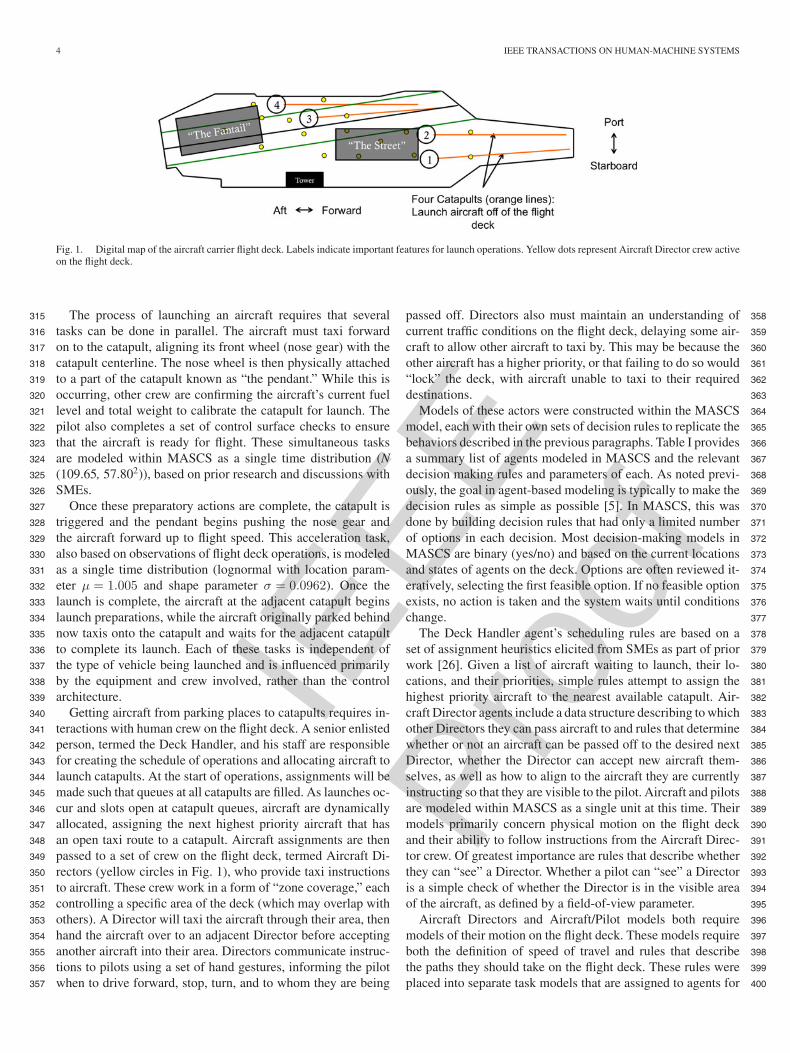
Fig. 5. Column chart of breakdown of tasks in a 22 aircraft mission usingmanual control (MC) or gesture control (GC).
With this queueing pattern in place, new aircraft arrive at747
catapults only to wait a period of time in the queue. If all control748
architectures are efficient enough in taxi operations to supply749
aircraft to catapults before the queues empty, then differences in750
launch event durations across control architectures at the mis-751
sion level will not be observed. Emptying a queue means that752
a catapult pair would have to process all three prior aircraft in753
the time it takes the new (fourth) aircraft to reach the queue.754
Additional output data from the MASCS simulation suggests755
that this does not occur and the queues remain in place through-756
out the mission (see Fig. 5). In a 22 aircraft mission using only757
MC aircraft, the average time for an aircraft to taxi to a catapult758
is just under 4 min. At an average launch time of 2 min, the759
queue would be cleared in 6 min, greater than the average taxi760
time. This implies that aircraft should be encountering queues761
at catapults, and data demonstrates that they are, at an average762
wait time of 3.32 min. The figure also includes the same data763
for Gesture Control, the worst performer in the single aircraft764
testing described earlier, which provides similar results for taxi765
times, launch times, and wait times.766
These data suggest that the manner in which aircraft are767
queued at catapults, combined with the current launch prepara-768
tion process, serves to bottleneck operations. Reducing the time769
required to complete the launch preparation task should provide770
conditions in which queues are eliminated, allowing differences771
to appear between control architectures at the mission level.772
The next section examines how decreasing the mean and vari-773
ance of the launch preparation task affects the performance of774
the different UAV control architectures.775
A. Effects of Launch Preparation Time776
The launch preparation task is a highly manual process exe-777
cuted by several members of the deck crew, a key component778
of which is the physical attachment of the aircraft nosegear to779
the catapult. The pilot must first correctly align the aircraft to780
the catapult before a crew member connects a piece of the cat-781
apult mechanism to the aircraft nosegear; after this occurs, the782
catapult pulls the aircraft forward to test the connection. Other783
tasks performed by other crew involve information processing,784
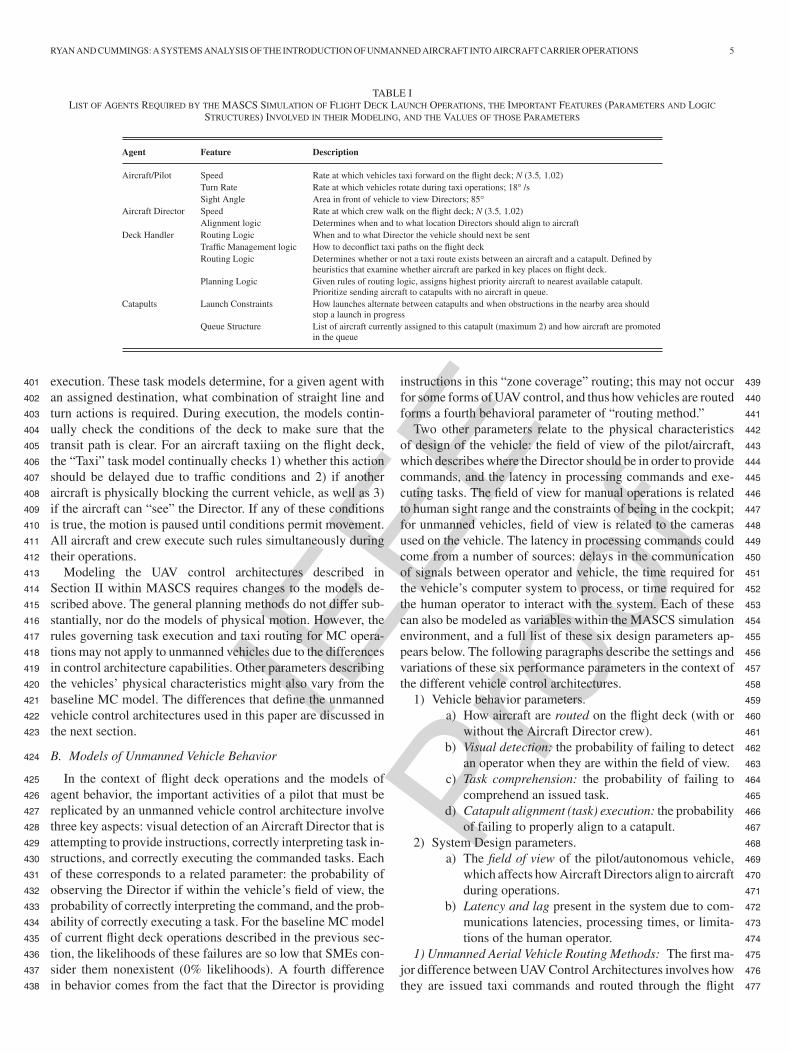
Fig. 6. Results for launch event duration (LD) for each control architecture formissions using 22 aircraft under the automated launch preparation time model.Whiskers indicate ±1 standard error.
setting the strength of the catapult based on the current weight 785
of the aircraft. Since all vehicles connect to the same catapult 786
mechanism and perform the same checks, the time to complete 787
this task is defined independently of the types of aircraft be- 788
ing connected. Additionally, because these tasks occur largely 789
in parallel, the entire process was modeled as a single normal 790
distribution with MASCS. Decreasing the mean value of this 791
process could potentially be accomplished through better train- 792
ing of the crew, while decreasing the variance might be done by 793
automating certain aspects of the task and removing the more 794
variable human components of the task. 795
A new series of tests were conducted using a “reduced” launch 796
preparation time with significantly reduced mean and variance. 797
In this reduced model, the mean was reduced by half and the 798
variance by three-quarters (to N (54.82, 28.92)). All four con- 799
trol architectures were tested under this launch preparation time 800
model using 22 aircraft. Thirty replications were again per- 801
formed for each case, and the results of these tests appear in 802
Fig. 6 with whiskers denoting ±1 standard error. 803
At these settings (μ = 54.82 s, σ = 28.9 s), an ANOVA 804
reveals that significant differences do exist within the data 805
(F (3, 116) = 18.63, p < 0.0001). A Tukey test reveals signifi- 806
cant differences between two pairs of control architectures: GC 807
(μ = 15.55) and VBSC (μ = 15.34) are both significantly dif- 808
ferent from MC (μ = 14.17) and SBSC (μ = 13.82). However, 809
no significant differences exist within each pair (e.g., GC and 810
VBSC). In terms of practical effects, the difference between the 811
averages of the fastest (SBSC) and slowest (GC) control archi- 812
tectures is 1.73 min, equivalent to 12.2% of the MC baseline. 813
That variations in control architecture performance do arise 814
with this automated launch preparation time model suggests that 815
the characteristics of the launch preparation time do have signifi- 816
cant effects on operations. The original launch preparation time, 817
with its high mean and variance, serves to bottleneck flight deck 818
operations; regardless of what is occurring, aircraft must always 819
queue behind other aircraft at the catapults. While this makes 820
the system robust to variations in unmanned vehicle behavior 821
(the delays that occur in GC and VBSC systems), it also means 822
that beneficial effects of unmanned vehicle introduction are also 823

IEEE
Proo
f
10 IEEE TRANSACTIONS ON HUMAN-MACHINE SYSTEMS
obscured. Improving operations on the flight deck would first824
require improving the performance of this vehicle-independent825
processing task, rather than improving the performance of indi-826
vidual vehicles.827
These results are also important for other similar domains,828
such as future airport operations. Given the first set of results829
under the original launch preparation model, the introduction of830
unmanned vehicle systems provided no benefit whatsoever to831
system operations due to the settings of the vehicle-independent832
launch preparation task. Given this data, a stakeholder would833
likely decide that UAV integration provides no tangible benefits834
to operations. They might also decide that because there are no835
differences, all types of unmanned vehicles provide the same836
level of performance in the system; the choice might then be837
made based on other factors. If this occurs, and the system moves838
to a faster tempo of operation, this decision might have severe839
consequences. In aircraft carrier operations, tempo increases840
during wartime combat operations; in airports, increasing the841
tempo could help relieve the congestion common at many U.S.842
airports. At this increased tempo setting, if stakeholders have843
already locked in to using a GC or VBSC system based on the844
previous data, operations will not perform to the level that was845
originally expected.846
The use of simulations like MASCS, as presented here, can847
help to clarify what differences can be expected from these848
systems in the real world and how their performance might849
be influenced by other process-level tasks independent of the850
UAV system control architecture itself. They can also help to851
explore under what conditions performance of these systems852
could be improved. While the results shown above demonstrated853
that the GC architecture performed poorly under the “reduced”854
launch preparation time model, the GC system also had the855
most changes from the MC baseline, varying on five of the six856
design parameters listed in Section III-C. Improvements along857
some combination of these parameters should be sufficient to858
provide GC performance equivalent to that of the baseline MC859
architecture. The next section demonstrates how simulations like860
MASCS can be used to examine the effects of changing vehicle861
performance parameters for the control architecture models in862
an example design space exploration.863
B. Design Space Exploration864
In future systems, stakeholders may seek to understand what865
changes to unmanned system control architectures are required866
to improve the performance under certain system conditions.867
This section examines how this might occur for the case of the868
GC architecture, which previous results showed as having the869
worst performance of the modeled architectures. The most im-870
portant changes in the Gesture Control architecture involve the871
increased failure rates of these vehicles in recognizing Aircraft872
Directors and their commands and the processing lag in recog-873
nizing those commands. The failures also carry with them time874
penalties that delay vehicle activity on the flight deck and that,875
as demonstrated, can sometimes be detrimental to flight deck876
performance. Improving the accuracy of these systems and re-877
ducing their processing times should improve the performance878
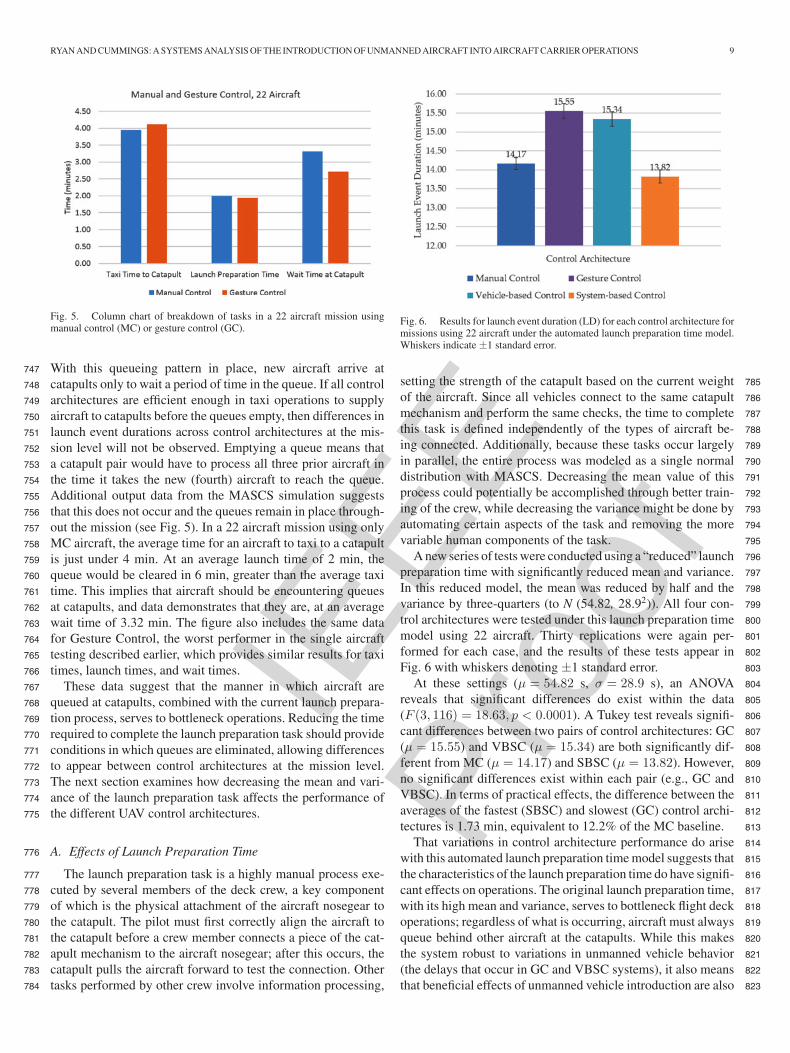
Fig. 7. Results for launch event duration (LD) for variations of 22 aircraft Ges-tural Control (GC) model using the “reduced” (mean-50%, standard deviation-50%) launch preparation time distribution. Whiskers indicate ±1 standard error.
of the GC system, but it is not known which of these carries 879
more weight in terms of improving mission performance. 880
Three new GC models are tested in this section over a va- 881
riety of mission conditions. First, a “Low Failure” case is cre- 882
ated in which the failure rate is reduced from 11.16% to 1%, 883
modeling a “best-case scenario” of system accuracy. Second, a 884
“Low Latency” is created in which commands are processed at 885
a maximum of 0.5 s. A third model combines the two cases, 886
generating a Low Latency + Low Failure condition that should 887
show improvement in performance. A first series of tests ad- 888
dressed the effects of these models in missions involving 22 889
aircraft under the original launch preparation model (N (109.65, 890
57.802)), but no significant differences were observed (ANOVA, 891
F (4, 145) = 0.51, p = 0.73). This is to be expected, given the 892
effectiveness of the original launch preparation time distribution 893
in obscuring variations between control architectures. 894
A second round of testing then proceeded to the “reduced” 895
launch preparation model (N (54.82, 28.92)), reducing both the 896
mean and standard deviation by 50%. Thirty replications of the 897
same 22 aircraft mission used previously were conducted for 898
each of the three new GC models (Low Failure, Low Latency, 899
Low Latency + Low Failure). Given the results of the previous 900
section, the variations in performance were expected to appear 901
at this faster launch preparation time model. The results of these 902
tests appear in Fig. 7 and include results for the baseline GC and 903
MC models for comparison. 904
The figure shows that the data exhibits a noticeable trend 905
from the baseline GC model to Low Latency, then Low Failure, 906
then Low Latency + Failure, then the baseline MC model. An 907
ANOVA shows that significant differences do exist between the 908
five test cases (F (4, 145) = 8.12, p = 0.0001). A Tukey post 909
hoc test shows that, most importantly, the GC Low Latency + 910
Low Failure and MC cases are not significantly different from 911
one another (p = 0.60). The MC data is significantly different 912
from the GC Baseline (p < 0.0001), Low Failure (p = 0.017), 913
and Low Latency (p = 0.034) cases. The Low Latency + Low 914
Failure case is also significantly different from the GC baseline 915
model (p = 0.0012), but is not different from the Low Failure 916
(p = 0.17) and Low Latency (p = 0.10) cases. This is fairly 917
IEEE
Proo
f
RYAN AND CUMMINGS: A SYSTEMS ANALYSIS OF THE INTRODUCTION OF UNMANNED AIRCRAFT INTO AIRCRAFT CARRIER OPERATIONS 11
interesting and highlights the significance of the earlier issues918
with the baseline GC models: the GC architecture requires sub-919
stantial improvements to both the gesture recognition accuracy920
and processing speeds to achieve performance equivalent to MC921
operations. Improvements to either of these elements individ-922
ually were not strong enough to generate significant improve-923
ments in GC performance.924
V. CONCLUSION925
This paper has described the use of an agent-based simulation926
model of aircraft carrier flight deck operations that allowed for a927
systems-level analysis of the key features of unmanned vehicle928
behavior that influence aircraft carrier flight deck performance.929
Testing demonstrated that the launch preparation process, whose930
execution times are independent of any specific unmanned ve-931
hicle control architecture, heavily influenced system behavior932
and effectively obscured differences between control architec-933
tures. Differences in control architecture performance were only934
observed under a task model with significantly reduced mean935
and variance. However, this launch preparation process is not936
slated for improvement in the near future. Ultimately, these re-937
sults suggest that failure to reexamine the structure of flight938
deck operations and the system as whole will ultimately limit939
the effectiveness of introducing autonomy into aircraft on the940
flight deck.941
Additional testing examined how, under such a reduced942
launch preparation time, the simulation could be used to inves-943
tigate the effects of modifying control architecture parameters.944
These results showed that Gesture Control systems required945
improvements to both accuracy rates and processing times in946
order to achieve performance equivalent to manual control op-947
erations in a 22 aircraft mission. Overall, these results suggest948
that the structure and definition of parameters within the broader949
system (the flight deck and tasks defined independently of the950
control architectures) has a significant impact on the behavior of951
the control architectures modeled in this paper. For stakeholders952
making decisions regarding which types of control architectures953
to implement in future operations, for environments with similar954
structure to the carrier flight deck, the definition of tasks like the955
launch preparation time (the final task performed by vehicles956
before exiting the system) greatly affects control architecture957
performance.958
The focus of MASCS at this time has been a general exami-959
nation of how different unmanned vehicle control architectures960
affect operations on the aircraft carrier flight deck, using mod-961
els of future UAV control architectures that have reached some962
level of maturity in operations. A significant limitation of this963
modeling and this research has been the exclusion of rare and964
safety-critical events from the system. These are an important965
aspect of operations in any complex system, and models of rare966
events, failures, and other issues could be included in the mod-967
eling of the physical environment (weather conditions, damage968
to the ship and flight deck), the vehicle models (mechanical969
or electrical failures, etc.) or in the modeling of the human970
actors (poor decision making, random accidents, etc.). These971
are all important areas of future work that can be addressed in972
future research, but until formally validated, MASCS cannot be 973
considered a true predictor of real-world system performance. 974
Ultimately, as unmanned systems move from operating in 975
isolated environments to more complex human-centered ones, 976
understanding the drivers of performance for both unmanned 977
vehicles and the systems in which they operate is key. This 978
research has demonstrated how this can be achieved through the 979
use of agent-based modeling of unmanned vehicle systems and 980
provided results that suggest that, for future aircraft carrier flight 981
deck and airport operations, improving aspects of the system 982
itself are as important, if not more so, than UAV improving 983
the performance of the UAV systems being introduced. Future 984
work will address how these control architectures interact with 985
changes to the operational structure, examining how changes 986
to the nature of planning and routing of aircraft tasks in the 987
flight deck environment interact with other elements to drive 988
variations not only in mission durations, but in terms of safety 989
and efficiency as well. 990
REFERENCES 991
[1] R. Tinto, “Mine of the future,” 2011. Q1992[2] A. Topf, “Rio Tinto boosts driverless truck fleet for use in Pilbara,” 2011. 993[3] J. Scanlon, “How KIVA robots help Zappos and Walgreens,” 2009. 994[4] S. Nikolaidis and J. Shah, “Human-Robot interactive planning using cross- 995
training-a human team training approach,” presented at the AIAA In- 996fotech@Aerospace, Garden Grove, CA, 2012. 997
[5] E. Bonabeau, “Agent-based modeling: Methods and techniques for sim- 998ulating human systems,” Proc. Nat. Academy Sci. United States Amer., 999vol. 99, no. Suppl. 3, pp. 7280–7287, 2002. 1000
[6] B. McKinney, “Unmanned combat air system carrier demonstration 1001(UCAS-D),” 2011. 1002
[7] W. J. Hennigan, “Navy drone X-47B lands on carrier deck in historic first,” 1003Jul. 2013. 1004
[8] “Integration of Civil Unmanned Aircraft Systems (UAS) in the National 1005Airspace System (NAS) Roadmap,” Tech. Rep., Federal Aviation Admin., 1006Washington, DC, USA, 2013. Q21007
[9] K. Sycara and M. Lewis, “Agent-based approaches to dynamic team sim- 1008ulation,” Tech. Rep. NPRST-TN-08-9, Navy Personnel Research, Studies, 1009and Technology Division, Bureau of Naval Personnel, Millington, TN, 1010USA, 2008. 1011
[10] K. Carley, D. Fridsma, E. Casman, N. Altman, J. Chang, B. Kaminsky, 1012D. Nave, and A. Yahja, “BioWar: Scalable multi-agent social and epi- 1013demiological simulation of bioterrorism events,” IEEE Trans. Syst., Man 1014Cybern. Part A, Syst. Humans, vol. 36, no. 2, pp. 252–265, 2006. 1015
[11] S. M. Lee, A. R. Pritchett, and K. M. Corker, “Evaluating transformations 1016of the air transportation system through agent-based modeling and sim- 1017ulation,” in Proc. 7th FAA/Eurcontrol Seminar Air Traffic Manage. Res. 1018Develop., 2007. Q31019
[12] J. M. Epstein and R. M. Axtell, Growing Artificial Societies: Social Science 1020From the Bottom Up. Washington, DC, USA: Brookings Institution, 1996. 1021
[13] S. J. Rasmussen and P. R. Chandler, “MultiUAV: A Multiple UAV Simu- 1022lation for Investigation of Cooperative Control,” presented at the Winter 1023Simulation Conf., San Diego, CA, USA, 2002. 1024
[14] J. J. Corner and G. B. Lamont, “Parallel simulation of UAV swarm sce- 1025narios,” presented at the Winter Simulation Conf., Washington, DC, USA, 10262004. 1027
[15] R. E. Weibel and R. J. Hansman Jr., “Safety considerations for operation 1028of different classes of UAVs in the NAS,” in presented at the AIAA’s 10294th Aviation Technol., Integration, Operations Forum, Chicago, IL, USA, 10302004. 1031
[16] B. Schumann, J. Scanlan, and K. Takeda, “Evaluating design decisions 1032in real-time using operations modelling,” presented at the Air Transport 1033Operations Symp., Delft, The Netherlands, 2011. 1034
[17] C. Nehme, “Modeling human supervisory control in heterogeneous un- 1035manned vehicle systems,” Ph.D. thesis, Massachusetts Inst. Technol., 1036Cambridge, MA, USA, 2009. 1037

IEEE
Proo
f
12 IEEE TRANSACTIONS ON HUMAN-MACHINE SYSTEMS
[18] A. A. Mkrtchyan, “Modeling operator performance in low task load super-1038visory domains,” M.S. thesis, Massachusetts Inst of Technol., Cambridge,1039MA, USA, 2011.1040
[19] Y. Song, D. Demirdjian, and R. Davis, “Multi-Signal gesture recognition1041using temporal smoothing hidden conditional random fields,” presented1042at the 9th IEEE Conf. Automat. Face Gesture Recog., Santa Barbara, CA,1043USA, 2011.1044
[20] Y. Song, D. Demirdjian, and R. Davis, “Continuous body and hand ges-1045ture recognition for natural human-computer interaction,” ACM Trans.1046Interactive Intell. Syst., vol. 2, no. 1, article 5, 2012.1047
[21] T. B. Sheridan, Telerobotics, Automation and Human Supervisory Control.1048Cambridge, MA, USA: The MIT Press, 1992.1049
[22] M. L. Cummings and S. Guerlain, “Developing operator capacity estimates1050for supervisory control of autonomous vehicles,” Human Factors, vol. 49,1051no. 1, pp. 1–15, 2007.1052
[23] M. L. Cummings and P. J. Mitchell, “Predicting controller capacity in1053remote supervision of multiple unmanned vehicles,” IEEE Trans. Syst.,1054Man, Cybern. Part A, Syst. Humans, vol. 38, no. 2, pp. 451–460, 2008.Q4 1055
[24] M. L. Cummings, J. How, A. Whitten, and O. Toupet, “The impact of1056human-automation collaboration in decentralized multiple unmanned ve-1057hicle control,” Proc. IEEE, vol. 100, no. 3, pp. 660–671, Mar. 2012.1058
[25] J. C. Ryan and M. L. Cummings, “Development of an agent-based model1059for aircraft carrier flight deck operations,” Model. Simulation J., 2014.Q5 1060
[26] J. C. Ryan, A. G. Banerjee, M. L. Cummings, and N. Roy, “Comparing1061the performance of expert user heuristics and an integer linear program1062in aircraft carrier deck operations,” IEEE Trans. Cybern., vol. 44, no. 6,1063pp. 761–773, Jun. 2014.1064
[27] M. Blank, L. Gorelick, E. Shechtman, M. Irani, and R. Basri, “Action1065as Space-Time Shapes,” presented at the 10th IEEE Int. Conf. Comput.1066Vision, Beijing, China, 2005.1067
[28] Z. Lin, Z. Jiang, and L. S. Davis, “Recognizing actions by shape- motion1068prototypes,” presented at the 12th Int. Conf. Comput. Vision, Kyoto, Japan,10692009.1070
[29] H. Jhuang, T. Serre, L. Wolf, and T. Poggio, “A biologically inspired1071system for action recognition,” presented at the IEEE 11th Int. Conf.1072Comput. Vision, Rio de Janeiro, Brazil, 2007.1073
[30] P. Scovanner, S. Ali, and M. Shah, “A 3-Dimensional SIFT Descriptor and1074its application to action recognition,” presented at the ACM Multimedia,1075Augsburg, Bavaria, Germany, 2007.1076
[31] I. Laptev, M. Marszalek, C. Schimd, and B. Rozenfeld, “Learning realistic1077human action from movies,” presented at the IEEE Conf. Comput. Vision1078Pattern Recog., Anchorage, AK, USA, 2008.1079
[32] K. Schindler and L. van Gool, “Action Snippets: How many frames does 1080human action recognition require?,” presented at the IEEE Conf. Comput. 1081Vision Pattern Recog., Anchorage, AK, USA, 2008. 1082
[33] J. Yuan, Z. Liu, and Y. Wu, “Discriminative subvolume search for efficient 1083action detection,” presented at the IEEE Conf. Comput. Vision Pattern 1084Recog., Miami, FL, USA, 2009. 1085
Jason C. Ryan (M’12) received the Bachelor’s of 1086Science degree in aerospace engineering from the 1087University of Alabama, Tuscaloosa, AL, USA, in 10882007, the Master’s of Science degree in aeronautics 1089and astronautics and the Ph.D. degree in human sys- 1090tems engineering both from the Massachusetts Insti- 1091tute of Technology, Cambridge, MA, USA, in 2011, 1092and 2014, respectively. 1093
He is currently with Aurora Flight Sciences. 10941095
Mary L. Cummings (SM’03) received the B.S. de- 1096gree in mathematics from the United States Naval 1097Academy, Annapolis, MD, USA, in 1988, the M.S. 1098degree in space systems engineering from the Naval 1099Postgraduate School, Monterey, CA, USA, in 1994, 1100and the Ph.D. degree in systems engineering from the 1101University of Virginia, Charlottesville, VA, USA, in 11022004. 1103
She is currently a Visiting Professor with the 1104Department of Aeronautics and Astronautics, Mas- 1105sachusetts Institute of Technology and an Associate 1106
Professor in the Department of Mechanical Engineering and Materials Science 1107at Duke University, Durham, NC, USA. 1108
1109

IEEE
Proo
f
QUERIES 1110
Q1. Author: Please provide full bibliographic details in Refs. [1], [2], [3], [6] and [7]. 1111
Q2. Author: Please provide report number in Ref. [8]. 1112
Q3. Author: Please provide page range in Ref. [11]. 1113
Q4. Author: Please provide month in Ref. [23]. 1114
Q5. Author: Please provide volume and page range in Ref. [25]. 1115

IEEE
Proo
f
IEEE TRANSACTIONS ON HUMAN-MACHINE SYSTEMS 1
A Systems Analysis of the Introduction of UnmannedAircraft Into Aircraft Carrier Operations
1
2
Jason C. Ryan and Mary L. Cummings3
Abstract—Recent advances in unmanned and autonomous vehi-4cle technology are accelerating the push to integrate these vehicles5into environments, such as the National Airspace System, the na-6tional highway system, and many manufacturing environments.7These environments will require close collaboration between hu-8mans and vehicles, and their large scales mean that real-world field9trials may be difficult to execute due to concerns of cost, availabil-10ity, and technological maturity. This paper describes the use of an11agent-based model to explore the system-level effects of unmanned12vehicle implementation on the performance of these collaborative13human–vehicle environments. In particular, this paper explores14the introduction of three different unmanned vehicle control archi-15tectures into aircraft carrier flight deck operations. The different16control architectures are tested under an example mission scenario17using 22 aircraft. Results show that certain control architectures18can improve the rate of launches, but these improvements are lim-19ited by the structure of flight deck operations and nature of the20launch task (which is defined independently of vehicles). Until the21launch task is improved, the effects of unmanned vehicle control22architectures on flight deck performance will be limited.23
Index Terms—Agent-based modeling, decision support system,24human–automation interaction, human supervisory control.25
I. INTRODUCTION26
IMPROVING the capabilities of unmanned vehicles has been27
a key area of research over the past several years, but it is28
only relatively recently that they have improved to the point that29
integrating unmanned systems into civilian environments has30
become realistic. Several current examples exist: the Rio Tinto31
mining corporation is currently fielding autonomous hauling32
trucks in several locations [1], [2]; the Kiva systems order ful-33
fillment system, which utilizes robotic pallet carriers, is used34
by online retailers Amazon and Zappos.com, among others [3];35
automobile manufacturers continue to introduce new automated36
features, such as adaptive cruise control, lane departure warn-37
ings, and other technology while continuing to pursue automated38
road train and more advanced driverless technologies. Current39
initiatives by the defense advanced research projects agency40
(DARPA) seek to advance the capabilities of humanoid robotic41
Manuscript received May 1, 2014; revised July 13, 2014 and October 1, 2014;accepted November 1, 2014. This work was supported by the Office of NavalResearch Science of Autonomy program under Contract #N000140910625. Theopinions expressed in this paper are those of the authors and do not necessarilyreflect the opinions of the sponsoring agency. This paper was recommended byAssociate Editor D. Gillan.
J. C. Ryan is with the Humans and Automation Lab, Massachusetts Instituteof Technology, Cambridge, MA 02139 USA (e-mail: [email protected]).
M. L. Cummings is with the Humans and Autonomy Lab, Department ofMechanical Engineering and Materials Science, Duke University, Durham, NC27708 USA (e-mail: [email protected]).
Color versions of one or more of the figures in this paper are available onlineat http://ieeexplore.ieee.org.
Digital Object Identifier 10.1109/THMS.2014.2376355
systems in urban search and rescue scenarios (the DARPA 42
Robotics Challenge), while other research seeks to address how 43
robotic manufacturing systems cannot only work more safely 44
near humans, but how they can also have a better understanding 45
of the roles and tasks of their human collaborators [4]. 46
Each of the domains described above can be characterized 47
as a human centered, or heterogeneous manned-unmanned en- 48
vironment (HMUE): places where unmanned vehicles, human 49
collaborators, and manned vehicles interact in the same physical 50
space. A variety of heterogeneous manned environments, such 51
as airport operations and aircraft carrier flight decks, already ex- 52
ist today. As unmanned vehicles transition into these domains, 53
new paradigms of interaction will be required for human col- 54
laborators to work effectively with these unmanned vehicles. 55
Changes to operating procedures may also be required to ac- 56
commodate differences in capabilities between unmanned and 57
manned vehicles. Very little research has addressed what these 58
changes might be and how these changes, and the resulting in- 59
troduction of unmanned vehicles, might affect the performance 60
of the broader system. 61
Insight into the effects of unmanned vehicle integration on 62
the performance of these larger scale systems could be gained 63
by field testing prototype systems, but these environments are of 64
such large scale (in physical size and number of active elements) 65
that testing them in any meaningful manner would require sig- 66
nificant investments of time, money, and physical resources. 67
Even if these resources could be provided, if the unmanned 68
vehicle systems being tested are not sufficiently similar to the 69
future systems that would be deployed, the results may not be 70
useful. Such tests might also place the autonomous systems, 71
the researchers involved, and other by-standers in unforeseen 72
danger, while also being limited in the number and types of 73
conditions that could be explored. 74
Agent-based modeling [5] is one potential approach for ad- 75
dressing such limitations; these models attempt to replicate the 76
behavior of individual actors within a given environment. Con- 77
structing such models of the real-world system provides an av- 78
enue for testing unmanned vehicle performance under a variety 79
of test conditions that may not be easily achievable in live condi- 80
tions. This paper examines the use of an agent-based simulation 81
of a candidate HMUE, the aircraft carrier flight deck, for which 82
the United States Navy is currently testing an unmanned carrier 83
fighter aircraft that is expected to integrate fully into operations 84
with manned aircraft and human crew [6], [7]. Flight deck op- 85
erations are in many ways analogous to airport operations; in 86
both environments, aircraft begin parked in a designated area, 87
then coordinate with crew (or other controllers) to taxi to one of 88
a few designated launch areas. With the Federal Aviation Ad- 89
ministration’s (FAA’s) mandate to introduce unmanned aircraft 90
2168-2291 © 2014 IEEE. Personal use is permitted, but republication/redistribution requires IEEE permission.See http://www.ieee.org/publications standards/publications/rights/index.html for more information.

IEEE
Proo
f
2 IEEE TRANSACTIONS ON HUMAN-MACHINE SYSTEMS
into the national airspace system by 2015, inserting unmanned91
vehicles into ground operations will be a paramount concern.92
While the FAA has recognized the importance of ground oper-93
ations in this integration, their major focus at this time appears94
to be on airborne operations [8]. While there are differences in95
the structure of airport and aircraft carrier operations (runways96
versus an open deck) and the role of human collaborators in97
those environments, lessons learned from the carrier flight deck98
should be applicable to airport operations.99
This paper begins with a brief description of agent-based sim-100
ulation and its applicability to modeling these environments.101
The three different unmanned vehicle control architectures of102
interest are then described, followed by a discussion of cur-103
rent aircraft carrier flight deck operations and how they are104
modeled within the Multi-Agent Safety and Control Simula-105
tion (MASCS). The modeling of the unmanned vehicle control106
architectures within MASCS is then described, followed by a107
description of the testing of these vehicles under mission con-108
ditions utilizing sets of 22 aircraft. Additional tests then ex-109
plored how improvements to the launch task (with properties110
independent of vehicle control architecture) affect flight deck111
performance, as well as how changes to key control architecture112
design parameters can improve vehicle performance under these113
new conditions.114
II. RELATED WORK115
A. Agent-Based Modeling116
As described by Bonabeau [5], agent-based modeling is as117
much a perspective as it is a methodology, whereas the use118
of discrete-event or systems dynamics models may elicit spe-119
cific ideas of structure and constituent components, agent-based120
models vary widely in content and in methods of application.121
Examples range from human decision-making (e.g., [9]) to epi-122
demiology and disease transmission (e.g., [10]) to transportation123
systems involving both ground and aerial vehicles (e.g., [11]),124
among many others. The common theme is that, in each case,125
the agent-based modeling paradigm views the world “from the126
perspective of its constituent units” [5]—that the agents retain127
the same independence and exhibit similar decision-making out-128
comes as the real-world entities they are intended to replicate.129
The agents are then placed into the simulated environment, given130
a set of goals (which may be self-generated during the simula-131
tion), and allowed to make decisions independently from that132
point forward. An additional key to agent-based simulation de-133
velopment is the use of simple rules of behavior [5], [12]: agents134
are given limited options in any given decision they make. The135
simultaneous application of these simple decisions by the sim-136
ulated agents is typically sufficient to replicate the behavior of137
the real-world system.138
While agent-based modeling has been used to validate con-139
trol and sensing algorithms for a variety of Unmanned Aerial140
Vehicle (UAV) systems (e.g., [13]), these studies have primarily141
addressed systems involving the collaboration of multiple ve-142
hicles in performing tasks, such as searching for and tracking143
targets. Another common area of interest is in the modeling and144
control of UAV “swarms” (large groups of robots coordinat-145
ing on a specific task) [14]. Agent-based models have also been146
built to test unmanned vehicle survivability [15] and single UAV 147
search [16]. However, none of these examples has considered 148
the role of the human in interacting with the vehicle system, al- 149
though other nonagent-based models of human-UAV interaction 150
have been constructed [17], [18]. These latter models focused 151
on the human as a processing server working within a queuing 152
system, considering the behavior of the vehicle only in that it 153
requires the operator to provide it a task. These latter models 154
only, however, examined a single system of interest and did not 155
construct models over a range of different vehicle control ar- 156
chitectures. These models typically included only a few (4–8) 157
aircraft in their models, as well. 158
No prior work could be located regarding the models of air- 159
craft carrier flight deck operations, nor of agent-based models of 160
similar collaborative human–vehicle domains (such as airport 161
ground operations or mining environments) that included mod- 162
els of unmanned vehicle behaviors. The agent-based models 163
cited in the earlier paragraph provided only general guidance on 164
model development: the reliance on states, parameters, and sim- 165
ple rules of decision-making and motion. This formed the core 166
approach to modeling the different unmanned vehicle architec- 167
tures, with a focus on the features of UAV behavior that would 168
have the most impact on the flight deck: physical motion, task ex- 169
ecution, and interactions with operators and other human collab- 170
orators in the world. These techniques were used to develop the 171
models of three different UAV control architectures—gestural 172
control (GC), vehicle-based supervisory control (VBSC), and 173
system-based supervisory control (SBSC), which are discussed 174
in the following sections—to determine their effects on flight 175
deck launch performance. 176
B. Gesture Control Systems 177
GC systems replace a human operator with a set of stereo- 178
vision cameras and a sophisticated computer algorithm that 179
replicates a subset of visual tasks performed by the human oper- 180
ator. In practice, this means that the system must be able to detect 181
human collaborators in the world, track their movement, then 182
track the motion of their hands, arms, and sometimes fingers. 183
These motions are then translated into specific gesture defini- 184
tions, which are correlated with specific tasks for the vehicles 185
(e.g., “stop” or “turn left”). The vehicle’s onboard autonomy 186
then decomposes these actions into specific low-level control 187
commands for sensors and effectors (throttle, steering, etc.). 188
While gesture recognition technology is available commer- 189
cially in systems, such as the XBOX Kinect, the utilization of 190
this technology for vehicle control remains in the research and 191
development phase. One example of this is research currently 192
being conducted by Song et al. that aims to construct a GC sys- 193
tem specifically for aircraft carrier flight deck operations [19], 194
[20]. This carrier environment is a unique case in that commands 195
to human pilots are already provided solely through hand ges- 196
tures, providing a natural mapping to gesture control systems. 197
C. Supervisory Control Systems 198
Sheridan’s original definition of supervisory control systems 199
defined them as systems in which one or more human operators 200
are commanding and receiving feedback from an autonomous 201

IEEE
Proo
f
RYAN AND CUMMINGS: A SYSTEMS ANALYSIS OF THE INTRODUCTION OF UNMANNED AIRCRAFT INTO AIRCRAFT CARRIER OPERATIONS 3
or robotic system that is performing tasks in the world [21]. This202
paper uses the term in a stricter sense: systems in which the hu-203
man operator issues commands and receives feedback through a204
graphical user interface that translates symbolic inputs into ac-205
tions for the robotic systems, which then decompose the actions206
into specific low-level control inputs. This typically requires207
substantial computational intelligence onboard the vehicle, as208
well as a variety of high-fidelity sensors to observe the world209
(GPS, LIDAR, and other range and sensing systems), cameras,210
high-accuracy inertial measurement devices, along with intelli-211
gent planning algorithms to handle vehicle routing and translate212
operator commands into low-level control inputs.213
This paper classifies these systems into two forms. The first214
form is referred to as VBSCin which supervisors supply com-215
mands to a single vehicle at a time, working iteratively through216
the queue of vehicles waiting for instruction (e.g., [22]). The217
operator functions as a processing server within the system,218
maintaining a queue of vehicles awaiting task assignments and219
interacting with them individually. These systems have been a220
subject of significant prior work, a common theme of which has221
been the examination of the “fan-out” problem: how many ve-222
hicles the operator can manage without significant performance223
degradation. Past research has shown that operators can control224
up to eight ground vehicles or 12 aircraft at a time [23], an225
acceptable number for aircraft flight deck operations in which226
there are no more than 8–12 vehicles taxiing at one time.227
Controlling more than 8 to 12 vehicles requires the introduc-228
tion of additional autonomy in the form of intelligent planning229
and scheduling systems. These are integrated with additional230
decision support displays to form the class of SBSC systems,231
in which the operator works with the planning algorithms to232
replan all tasks for all vehicles simultaneously (e.g., [24]). Typi-233
cally, the operator will provide goals for the planning algorithm234
(e.g., weights for the objective function) and may also insert235
additional constraints (e.g., time windows for the execution of236
certain tasks). The planning algorithm generates a candidate set237
of assignments that is then reviewed by the operator, who has a238
chance to reject the plan or make modifications. Once the plan239
is accepted, tasks are transmitted to vehicles, which then fol-240
low the prescribed motion paths and execute the assigned tasks.241
The human supervisor’s responsibility is to monitor the execu-242
tion of the plan and create new plans in the event of failures or243
performance degradation.244
III. MULTIAGENT SAFETY AND CONTROL245
SIMULATION MODEL246
As the unmanned vehicle systems described in Section II247
do not yet exist for flight deck operations, simulations of their248
behavior cannot be validated directly. Instead, MASCS was cre-249
ated first as a model of manual control (MC) flight deck op-250
erations, with the unmanned vehicle architectures defined as251
modifications from this model. MASCS was then partially val-252
idated against empirical data in prior work [25] because of the253
limitations on accessible data on flight deck operations, pilot be-254
havior, and other factors, full validation of this simulation is not255
possible at this time. Constructing the model required defining256
agents that replicate the behavior of human crew, pilots, aircraft,257
planning supervisors, flight deck equipment, as well as models 258
of the tasks that they perform. Agent and task models consist of 259
decision-making rules that govern agent behavior, parameters 260
that describe how agents view and execute tasks in the world, 261
and states that are viewable by other agents and are used in the 262
decision-making routines. 263
The validation process compared the performance of indi- 264
vidual aircraft and missions of multiple aircraft with empirical 265
data on operations. This included the average time to complete 266
launch missions of 18 to 34 aircraft, the interdeparture times 267
of launches within those missions, and response of the sys- 268
tem to changes in vehicle behaviors (e.g., speed). Additionally, 269
a team of subject matter experts (SMEs) reviewed animations 270
of simulation execution. SMEs had a range of experience on 271
the flight deck, each over multiple years (two pilots each with 272
more than 800 flight hours in fighter aircraft; another individ- 273
ual with over 3000 h as a Naval Flight Officer and 2 years as 274
a launch and recovery officer). All were currently employed 275
by Navy research organizations. SMEs were allowed to review 276
repeated executions of the simulation in order to critique the 277
activity of agents on the flight deck. SMEs were also shown 278
quantitative results from validation testing to provide feedback 279
on the accuracy of the simulation in terms of mission comple- 280
tion times. SMEs judged that the simulation was a reasonable 281
replication of flight deck operations and did not find any ma- 282
jor errors in modeling that required correction. Modeling pro- 283
ceeded to include the unmanned vehicles reported here, which 284
were created by modifying six key parameters of the MC air- 285
craft models: aircraft routing methods, visual detection accu- 286
racy, command comprehension rates, catapult alignment failure 287
rates, camera field of view, and system latencies. This section 288
first describes the basics of flight deck operations relevant to this 289
paper and how these operations were modeled within MASCS 290
before discussing the modeling of the unmanned vehicle control 291
architectures. 292
A. Aircraft Carrier Flight Deck Operations 293
A digitized map of the flight deck appears in Fig. 1. Labels 294
in the figure highlight the important features of the flight deck 295
environment relevant to launch operations. Aircraft begin parked 296
at the edges of the flight deck in the aft and starboard areas of 297
deck; aircraft not able to fit in those areas are parked in the 298
area known as “The Street.” Aircraft will be assigned to launch 299
from one of the four launch catapults (orange lines in the figure, 300
numbered one to four). Each catapult is capable of launching 301
a single aircraft at a time, but adjacent pairs of aircraft (1,2 or 302
3,4) are not able to operate in parallel, for two reasons. The first 303
is that a single set of crew operates each pair of catapults and 304
can only manage one catapult at a time. The second, and more 305
important, is that the catapults are angled toward one another— 306
simultaneous launches would result in a collision and loss of 307
both aircraft. Catapults alternate launches within each pair, but 308
the two pairs can process in parallel (e.g., 1 and 3 or 2 and 309
4). Operations typically allow one aircraft on the catapult and 310
another waiting behind a protective barrier that rises from the 311
deck during a launch. As such, each pair of catapults (if both 312
are active) can queue up to four aircraft in the area at any time, 313
but only one aircraft will be in the process of launching. 314

IEEE
Proo
f
4 IEEE TRANSACTIONS ON HUMAN-MACHINE SYSTEMS
Fig. 1. Digital map of the aircraft carrier flight deck. Labels indicate important features for launch operations. Yellow dots represent Aircraft Director crew activeon the flight deck.
The process of launching an aircraft requires that several315
tasks can be done in parallel. The aircraft must taxi forward316
on to the catapult, aligning its front wheel (nose gear) with the317
catapult centerline. The nose wheel is then physically attached318
to a part of the catapult known as “the pendant.” While this is319
occurring, other crew are confirming the aircraft’s current fuel320
level and total weight to calibrate the catapult for launch. The321
pilot also completes a set of control surface checks to ensure322
that the aircraft is ready for flight. These simultaneous tasks323
are modeled within MASCS as a single time distribution (N324
(109.65, 57.802)), based on prior research and discussions with325
SMEs.326
Once these preparatory actions are complete, the catapult is327
triggered and the pendant begins pushing the nose gear and328
the aircraft forward up to flight speed. This acceleration task,329
also based on observations of flight deck operations, is modeled330
as a single time distribution (lognormal with location param-331
eter μ = 1.005 and shape parameter σ = 0.0962). Once the332
launch is complete, the aircraft at the adjacent catapult begins333
launch preparations, while the aircraft originally parked behind334
now taxis onto the catapult and waits for the adjacent catapult335
to complete its launch. Each of these tasks is independent of336
the type of vehicle being launched and is influenced primarily337
by the equipment and crew involved, rather than the control338
architecture.339
Getting aircraft from parking places to catapults requires in-340
teractions with human crew on the flight deck. A senior enlisted341
person, termed the Deck Handler, and his staff are responsible342
for creating the schedule of operations and allocating aircraft to343
launch catapults. At the start of operations, assignments will be344
made such that queues at all catapults are filled. As launches oc-345
cur and slots open at catapult queues, aircraft are dynamically346
allocated, assigning the next highest priority aircraft that has347
an open taxi route to a catapult. Aircraft assignments are then348
passed to a set of crew on the flight deck, termed Aircraft Di-349
rectors (yellow circles in Fig. 1), who provide taxi instructions350
to aircraft. These crew work in a form of “zone coverage,” each351
controlling a specific area of the deck (which may overlap with352
others). A Director will taxi the aircraft through their area, then353
hand the aircraft over to an adjacent Director before accepting354
another aircraft into their area. Directors communicate instruc-355
tions to pilots using a set of hand gestures, informing the pilot356
when to drive forward, stop, turn, and to whom they are being357
passed off. Directors also must maintain an understanding of 358
current traffic conditions on the flight deck, delaying some air- 359
craft to allow other aircraft to taxi by. This may be because the 360
other aircraft has a higher priority, or that failing to do so would 361
“lock” the deck, with aircraft unable to taxi to their required 362
destinations. 363
Models of these actors were constructed within the MASCS 364
model, each with their own sets of decision rules to replicate the 365
behaviors described in the previous paragraphs. Table I provides 366
a summary list of agents modeled in MASCS and the relevant 367
decision making rules and parameters of each. As noted previ- 368
ously, the goal in agent-based modeling is typically to make the 369
decision rules as simple as possible [5]. In MASCS, this was 370
done by building decision rules that had only a limited number 371
of options in each decision. Most decision-making models in 372
MASCS are binary (yes/no) and based on the current locations 373
and states of agents on the deck. Options are often reviewed it- 374
eratively, selecting the first feasible option. If no feasible option 375
exists, no action is taken and the system waits until conditions 376
change. 377
The Deck Handler agent’s scheduling rules are based on a 378
set of assignment heuristics elicited from SMEs as part of prior 379
work [26]. Given a list of aircraft waiting to launch, their lo- 380
cations, and their priorities, simple rules attempt to assign the 381
highest priority aircraft to the nearest available catapult. Air- 382
craft Director agents include a data structure describing to which 383
other Directors they can pass aircraft to and rules that determine 384
whether or not an aircraft can be passed off to the desired next 385
Director, whether the Director can accept new aircraft them- 386
selves, as well as how to align to the aircraft they are currently 387
instructing so that they are visible to the pilot. Aircraft and pilots 388
are modeled within MASCS as a single unit at this time. Their 389
models primarily concern physical motion on the flight deck 390
and their ability to follow instructions from the Aircraft Direc- 391
tor crew. Of greatest importance are rules that describe whether 392
they can “see” a Director. Whether a pilot can “see” a Director 393
is a simple check of whether the Director is in the visible area 394
of the aircraft, as defined by a field-of-view parameter. 395
Aircraft Directors and Aircraft/Pilot models both require 396
models of their motion on the flight deck. These models require 397
both the definition of speed of travel and rules that describe 398
the paths they should take on the flight deck. These rules were 399
placed into separate task models that are assigned to agents for 400

IEEE
Proo
f
RYAN AND CUMMINGS: A SYSTEMS ANALYSIS OF THE INTRODUCTION OF UNMANNED AIRCRAFT INTO AIRCRAFT CARRIER OPERATIONS 5
TABLE ILIST OF AGENTS REQUIRED BY THE MASCS SIMULATION OF FLIGHT DECK LAUNCH OPERATIONS, THE IMPORTANT FEATURES (PARAMETERS AND LOGIC
STRUCTURES) INVOLVED IN THEIR MODELING, AND THE VALUES OF THOSE PARAMETERS
Agent Feature Description
Aircraft/Pilot Speed Rate at which vehicles taxi forward on the flight deck; N (3.5, 1.02)Turn Rate Rate at which vehicles rotate during taxi operations; 18° /sSight Angle Area in front of vehicle to view Directors; 85°
Aircraft Director Speed Rate at which crew walk on the flight deck; N (3.5, 1.02)Alignment logic Determines when and to what location Directors should align to aircraft
Deck Handler Routing Logic When and to what Director the vehicle should next be sentTraffic Management logic How to deconflict taxi paths on the flight deckRouting Logic Determines whether or not a taxi route exists between an aircraft and a catapult. Defined by
heuristics that examine whether aircraft are parked in key places on flight deck.Planning Logic Given rules of routing logic, assigns highest priority aircraft to nearest available catapult.
Prioritize sending aircraft to catapults with no aircraft in queue.Catapults Launch Constraints How launches alternate between catapults and when obstructions in the nearby area should
stop a launch in progressQueue Structure List of aircraft currently assigned to this catapult (maximum 2) and how aircraft are promoted
in the queue
execution. These task models determine, for a given agent with401
an assigned destination, what combination of straight line and402
turn actions is required. During execution, the models contin-403
ually check the conditions of the deck to make sure that the404
transit path is clear. For an aircraft taxiing on the flight deck,405
the “Taxi” task model continually checks 1) whether this action406
should be delayed due to traffic conditions and 2) if another407
aircraft is physically blocking the current vehicle, as well as 3)408
if the aircraft can “see” the Director. If any of these conditions409
is true, the motion is paused until conditions permit movement.410
All aircraft and crew execute such rules simultaneously during411
their operations.412
Modeling the UAV control architectures described in413
Section II within MASCS requires changes to the models de-414
scribed above. The general planning methods do not differ sub-415
stantially, nor do the models of physical motion. However, the416
rules governing task execution and taxi routing for MC opera-417
tions may not apply to unmanned vehicles due to the differences418
in control architecture capabilities. Other parameters describing419
the vehicles’ physical characteristics might also vary from the420
baseline MC model. The differences that define the unmanned421
vehicle control architectures used in this paper are discussed in422
the next section.423
B. Models of Unmanned Vehicle Behavior424
In the context of flight deck operations and the models of425
agent behavior, the important activities of a pilot that must be426
replicated by an unmanned vehicle control architecture involve427
three key aspects: visual detection of an Aircraft Director that is428
attempting to provide instructions, correctly interpreting task in-429
structions, and correctly executing the commanded tasks. Each430
of these corresponds to a related parameter: the probability of431
observing the Director if within the vehicle’s field of view, the432
probability of correctly interpreting the command, and the prob-433
ability of correctly executing a task. For the baseline MC model434
of current flight deck operations described in the previous sec-435
tion, the likelihoods of these failures are so low that SMEs con-436
sider them nonexistent (0% likelihoods). A fourth difference437
in behavior comes from the fact that the Director is providing438
instructions in this “zone coverage” routing; this may not occur 439
for some forms of UAV control, and thus how vehicles are routed 440
forms a fourth behavioral parameter of “routing method.” 441
Two other parameters relate to the physical characteristics 442
of design of the vehicle: the field of view of the pilot/aircraft, 443
which describes where the Director should be in order to provide 444
commands, and the latency in processing commands and exe- 445
cuting tasks. The field of view for manual operations is related 446
to human sight range and the constraints of being in the cockpit; 447
for unmanned vehicles, field of view is related to the cameras 448
used on the vehicle. The latency in processing commands could 449
come from a number of sources: delays in the communication 450
of signals between operator and vehicle, the time required for 451
the vehicle’s computer system to process, or time required for 452
the human operator to interact with the system. Each of these 453
can also be modeled as variables within the MASCS simulation 454
environment, and a full list of these six design parameters ap- 455
pears below. The following paragraphs describe the settings and 456
variations of these six performance parameters in the context of 457
the different vehicle control architectures. 458
1) Vehicle behavior parameters. 459
a) How aircraft are routed on the flight deck (with or 460
without the Aircraft Director crew). 461
b) Visual detection: the probability of failing to detect 462
an operator when they are within the field of view. 463
c) Task comprehension: the probability of failing to 464
comprehend an issued task. 465
d) Catapult alignment (task) execution: the probability 466
of failing to properly align to a catapult. 467
2) System Design parameters. 468
a) The field of view of the pilot/autonomous vehicle, 469
which affects how Aircraft Directors align to aircraft 470
during operations. 471
b) Latency and lag present in the system due to com- 472
munications latencies, processing times, or limita- 473
tions of the human operator. 474
1) Unmanned Aerial Vehicle Routing Methods: The first ma- 475
jor difference between UAV Control Architectures involves how 476
they are issued taxi commands and routed through the flight 477
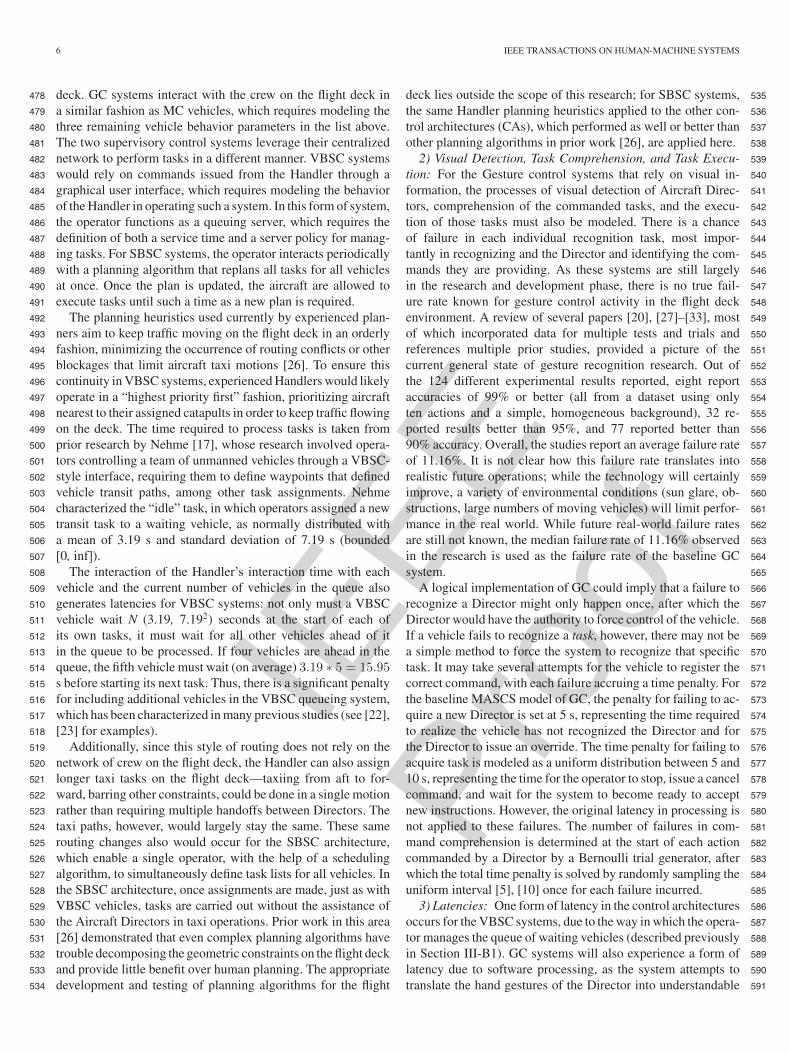
IEEE
Proo
f
6 IEEE TRANSACTIONS ON HUMAN-MACHINE SYSTEMS
deck. GC systems interact with the crew on the flight deck in478
a similar fashion as MC vehicles, which requires modeling the479
three remaining vehicle behavior parameters in the list above.480
The two supervisory control systems leverage their centralized481
network to perform tasks in a different manner. VBSC systems482
would rely on commands issued from the Handler through a483
graphical user interface, which requires modeling the behavior484
of the Handler in operating such a system. In this form of system,485
the operator functions as a queuing server, which requires the486
definition of both a service time and a server policy for manag-487
ing tasks. For SBSC systems, the operator interacts periodically488
with a planning algorithm that replans all tasks for all vehicles489
at once. Once the plan is updated, the aircraft are allowed to490
execute tasks until such a time as a new plan is required.491
The planning heuristics used currently by experienced plan-492
ners aim to keep traffic moving on the flight deck in an orderly493
fashion, minimizing the occurrence of routing conflicts or other494
blockages that limit aircraft taxi motions [26]. To ensure this495
continuity in VBSC systems, experienced Handlers would likely496
operate in a “highest priority first” fashion, prioritizing aircraft497
nearest to their assigned catapults in order to keep traffic flowing498
on the deck. The time required to process tasks is taken from499
prior research by Nehme [17], whose research involved opera-500
tors controlling a team of unmanned vehicles through a VBSC-501
style interface, requiring them to define waypoints that defined502
vehicle transit paths, among other task assignments. Nehme503
characterized the “idle” task, in which operators assigned a new504
transit task to a waiting vehicle, as normally distributed with505
a mean of 3.19 s and standard deviation of 7.19 s (bounded506
[0, inf]).507
The interaction of the Handler’s interaction time with each508
vehicle and the current number of vehicles in the queue also509
generates latencies for VBSC systems: not only must a VBSC510
vehicle wait N (3.19, 7.192) seconds at the start of each of511
its own tasks, it must wait for all other vehicles ahead of it512
in the queue to be processed. If four vehicles are ahead in the513
queue, the fifth vehicle must wait (on average) 3.19 ∗ 5 = 15.95514
s before starting its next task. Thus, there is a significant penalty515
for including additional vehicles in the VBSC queueing system,516
which has been characterized in many previous studies (see [22],517
[23] for examples).518
Additionally, since this style of routing does not rely on the519
network of crew on the flight deck, the Handler can also assign520
longer taxi tasks on the flight deck—taxiing from aft to for-521
ward, barring other constraints, could be done in a single motion522
rather than requiring multiple handoffs between Directors. The523
taxi paths, however, would largely stay the same. These same524
routing changes also would occur for the SBSC architecture,525
which enable a single operator, with the help of a scheduling526
algorithm, to simultaneously define task lists for all vehicles. In527
the SBSC architecture, once assignments are made, just as with528
VBSC vehicles, tasks are carried out without the assistance of529
the Aircraft Directors in taxi operations. Prior work in this area530
[26] demonstrated that even complex planning algorithms have531
trouble decomposing the geometric constraints on the flight deck532
and provide little benefit over human planning. The appropriate533
development and testing of planning algorithms for the flight534
deck lies outside the scope of this research; for SBSC systems, 535
the same Handler planning heuristics applied to the other con- 536
trol architectures (CAs), which performed as well or better than 537
other planning algorithms in prior work [26], are applied here. 538
2) Visual Detection, Task Comprehension, and Task Execu- 539
tion: For the Gesture control systems that rely on visual in- 540
formation, the processes of visual detection of Aircraft Direc- 541
tors, comprehension of the commanded tasks, and the execu- 542
tion of those tasks must also be modeled. There is a chance 543
of failure in each individual recognition task, most impor- 544
tantly in recognizing and the Director and identifying the com- 545
mands they are providing. As these systems are still largely 546
in the research and development phase, there is no true fail- 547
ure rate known for gesture control activity in the flight deck 548
environment. A review of several papers [20], [27]–[33], most 549
of which incorporated data for multiple tests and trials and 550
references multiple prior studies, provided a picture of the 551
current general state of gesture recognition research. Out of 552
the 124 different experimental results reported, eight report 553
accuracies of 99% or better (all from a dataset using only 554
ten actions and a simple, homogeneous background), 32 re- 555
ported results better than 95%, and 77 reported better than 556
90% accuracy. Overall, the studies report an average failure rate 557
of 11.16%. It is not clear how this failure rate translates into 558
realistic future operations; while the technology will certainly 559
improve, a variety of environmental conditions (sun glare, ob- 560
structions, large numbers of moving vehicles) will limit perfor- 561
mance in the real world. While future real-world failure rates 562
are still not known, the median failure rate of 11.16% observed 563
in the research is used as the failure rate of the baseline GC 564
system. 565
A logical implementation of GC could imply that a failure to 566
recognize a Director might only happen once, after which the 567
Director would have the authority to force control of the vehicle. 568
If a vehicle fails to recognize a task, however, there may not be 569
a simple method to force the system to recognize that specific 570
task. It may take several attempts for the vehicle to register the 571
correct command, with each failure accruing a time penalty. For 572
the baseline MASCS model of GC, the penalty for failing to ac- 573
quire a new Director is set at 5 s, representing the time required 574
to realize the vehicle has not recognized the Director and for 575
the Director to issue an override. The time penalty for failing to 576
acquire task is modeled as a uniform distribution between 5 and 577
10 s, representing the time for the operator to stop, issue a cancel 578
command, and wait for the system to become ready to accept 579
new instructions. However, the original latency in processing is 580
not applied to these failures. The number of failures in com- 581
mand comprehension is determined at the start of each action 582
commanded by a Director by a Bernoulli trial generator, after 583
which the total time penalty is solved by randomly sampling the 584
uniform interval [5], [10] once for each failure incurred. 585
3) Latencies: One form of latency in the control architectures 586
occurs for the VBSC systems, due to the way in which the opera- 587
tor manages the queue of waiting vehicles (described previously 588
in Section III-B1). GC systems will also experience a form of 589
latency due to software processing, as the system attempts to 590
translate the hand gestures of the Director into understandable 591

IEEE
Proo
f
RYAN AND CUMMINGS: A SYSTEMS ANALYSIS OF THE INTRODUCTION OF UNMANNED AIRCRAFT INTO AIRCRAFT CARRIER OPERATIONS 7
TABLE IICOMPARISON OF UAV CONTROL ARCHITECTURE DESIGN PARAMETERS DEFINED FOR MASCS
Manual Control Gesture Control Vehicle-Based Supervisory Control System-Based Supervisory Control
Routing Method Zone coverage Zone coverage Centralized control Centralized controlVisual detection rate P(fail) = 0 P(fail) = 0.1118 N/A (central control) N/A (central control)Task Comprehension Rate P(fail) = 0 P(fail) = 0.1118 N/A (central control) N/A (central control)Task Execution Rate P(fail) = 0 P(fail) = 0.05 P(fail) = 0.025 P(fail) = 0.025Field of View 85° 65° N/A (central control) N/A (central control)Lag/Latency None 0–3 s (computation) N (3.19, 7.192) per task None
action commands. The prior research reviewed for error rates592
[20], [27]–[33] also shows this requires anywhere from <<1 to593
3 s; this is modeled as a uniform distribution over the range [0,594
3], randomly sampled and applied to the start of every action595
commanded by a Director.596
C. Performance Comparisons597
Table II provides a comparison of the four UAV control ar-598
chitectures to the baseline MC model in terms of the six primary599
design parameters described earlier. For the MC model, SMEs600
report that failures on these tasks are so rare that they do not601
really recognize them as occurring in the system: pilots rarely602
fail to see a Director if they are within their field of view, rarely603
fail to interpret a command, and rarely fail to properly align to604
a catapult. The field of view parameter was calibrated in prior605
work to a value of 85°. These settings were utilized in the model606
and partially validated in prior work [25] and are considered to607
be representative of the highly skilled pilots that work within608
the aircraft carrier flight deck.609
Each of the unmanned vehicle control architectures defined610
in previous sections can be modeled in MASCS by changes611
to the six design parameters listed in Table II. As compared612
with a baseline MC vehicle, GC systems will still operate under613
the crew’s “zone coverage” operating paradigm, but will intro-614
duce both a small to moderate processing latency at the start615
of each action and a chance to fail to recognize either the per-616
son issuing the command or the command itself (these are akin617
to another small delay at the start of operations). As noted in618
Sections III-B2 and III-B3, this latency ranges from 0–3 s and619
the average failure rates are slightly over 10%. The processing620
latency is randomly sampled over the defined interval at the621
start of the attempted task. Task failures can occur repeatedly,622
with each failure resulting in a time penalty between 5 and 10 s623
to resubmit commands to a GC vehicle. The time penalties are624
also sampled randomly over the defined interval. The use of625
cameras by the gesture recognition system might also constrain626
the applicable field of view for these vehicles, and the lack of627
a practiced pilot in aligning the aircraft to the catapult at the628
end of taxi operations will likely increase the rate of error on629
this task. However, there is no current evidence to suggest what630
this failure rate may be in real life. A catapult alignment failure631
rate of 5%, translating to roughly one failure per mission (once632
launch of a 22 aircraft sortie), was selected for the GC vehicles633
based on SME opinions.634
As VBSC and SBSC systems are centrally controlled, they635
receive no instructions from the crew. Thus, the visual detec-636
tion and task comprehension rates are not applicable for these637
two systems, nor is the modeling of a field of view. Both are 638
expected to at least have a nonzero failure rate in aligning to 639
aircraft catapults, set at once per two missions. SBSC systems 640
have no latency, as vehicles are sufficiently autonomous to ex- 641
ecute the series of tasks provided to them quickly and without 642
human interaction and any replanning occurs in parallel to ve- 643
hicle operations. VBSC systems, however, rely on a human 644
operator to supply tasks individually to aircraft, which must 645
wait in a queue for further instructions. This introduces latency 646
in the form of a wait time for operator interaction, which for 647
large numbers of aircraft may lead to significant delays in task 648
execution. 649
The differences in performance of individual vehicles under 650
these control architectures should thus be a function of the cu- 651
mulative delays and latencies experienced in task recognition 652
and execution. The GC and VBSC systems both experience a 653
greater level of latencies and delays than MC and SBSC systems 654
and should thus perform more poorly. For GC systems, these 655
arise from the chances of repeated errors and processing delays 656
on the part of the vehicles, while for VBSC they are due to 657
the need for repeated interactions with the human supervisors. 658
However, the impact of these delays and latencies when multiple 659
aircraft are included in flight deck operations will be influenced 660
by the structure of modern aircraft carrier flight deck operations. 661
The model of operations constructed for this paper was partially 662
validated in [25] and is discussed in the next section. 663
IV. EFFECTS ON OPERATIONS ON UNMANNED AERIAL 664
VEHICLE PERFORMANCE 665
The models of unmanned vehicle control architectures de- 666
scribed in the previous section were implemented into the 667
MASCS environment and verified through a set of tests that 668
examined the behavior of an individual aircraft on the flight 669
deck. The same mission scenario was executed for each of the 670
four control architectures (MC, GC, VBSC, and SBSC) with 671
300 replications performed in each case. A diagram of this task 672
appears in Fig. 2: the aircraft begins parked in the aftarea of the 673
flight deck and is assigned to launch from catapult 3, requiring 674
a series of straight-line and turning motions before culminat- 675
ing with the launch preparation and launch acceleration tasks. 676
This same scenario was used previously in the development and 677
testing of the baseline MC model [25]. The results of these sim- 678
ulations appear in Fig. 3, which shows the average time for a 679
single aircraft to complete the launch mission (from taxi through 680
launch acceleration) for each the four control architectures, with 681
whiskers indicating ±1 standard error in the data. 682

IEEE
Proo
f
8 IEEE TRANSACTIONS ON HUMAN-MACHINE SYSTEMS
Fig. 2. Diagram of mission executed in the single aircraft performance com-parisons.
Fig. 3. Values for launch event duration (LD) for single aircraft testing formanual control (MC), gestural control (GC), vehicle-based supervisory control(VBSC), and system-based supervisory control (SBSC). Bars indicate mean LDfor sets of 300 replications, with whiskers showing ±1 standard error.
In general, the responses of four control architectures match683
the expectations described earlier: the GC and vehicle-based684
supervisory control (VBSC) cases being the slowest and MC685
and SBSC being the fastest. An analysis of variance (ANOVA)686
test demonstrates that the differences between the MC, GC,687
SBSC, and VBSC cases are significant at the α = 0.05 level688
(F (3, 1196) = 66.07, p < 0.0001), and a Tukey test reveals that689
all pairwise comparisons are significant. In terms of practical690
differences, GC vehicles take 0.64 min longer to complete the691
task, VBSC 0.44 min, and SBSC are 0.22 min faster. While692
these are indeed small differences, percentagewise these trans-693
late into percentage differences of 18.4%, 12.5%, and −6.3%,694
respectively, from the MC baseline.695
However, the structure of flight deck operations may affect696
how these variations in individual vehicle performance are felt697
in missions using many aircraft. Flight deck operations, as well698
as airport operations, are such that aircraft depart an initial park-699
ing area and are sent to queue at a specific launch site. In terms700
of system performance, as long as another aircraft arrives at the701
site prior to the launch of the previous aircraft, the flight deck (or702
airport) is working effectively. In order for the differences in the703
individual control architectures to be observed at the mission704
level, the delays and latencies that affect GC and VBSC per-705
formance must disrupt taxi operations upstream of the catapult706
sufficiently to break the chain of queuing that occurs.707
Fig. 4. Results for Launch event Duration (LD) for each control architecturefor missions using 22 aircraft under the original launch preparation time model.Whiskers indicate ±1 standard error.
To test whether or not this occurs, the four control architec- 708
tures were tested in missions using 22 aircraft. In these missions, 709
all 22 aircraft begin parked at the edges of the flight deck. The 710
Deck Handler agent then dynamically assigns aircraft in real 711
time based on current aircraft priority and whether nearby cat- 712
apults are open and accessible to the aircraft. Each mission 713
utilized the same initial conditions (vehicle parking locations 714
and priorities) and used a completely homogeneous vehicle set 715
(all MC, or all Gesture Control, etc.). Thirty replications of each 716
mission were performed and the total time to complete the mis- 717
sion (from initialization to completion of the last launch) was 718
logged for each. Fig. 4 provides a column chart of the average 719
time to complete missions for each control architecture, with 720
whiskers indicating ±1 standard error in each dataset. 721
The data in the figure suggests no real variations occur in 722
system performance, with an ANOVA test returning marginally 723
significant results (F (3, 116) = 2.57, p = 0.058). This suggests 724
that the effects of GC and VBSC system delays are not suffi- 725
ciently disruptive to cause differences at the mission level, nor 726
are the benefits of the SBSC system, which does not rely on 727
the crew “zone coverage” routing, sufficient to improve perfor- 728
mance at a highly significant level. 729
One interpretation of these results is that an error exists either 730
within the aircraft models, the routing of aircraft to catapults, or 731
the processing of tasks at the catapults. However, the individual 732
models of aircraft (see Fig. 3) showed that differences in perfor- 733
mance do exist on an individual vehicle level; some mechanism 734
at the mission level is preventing these differences in individ- 735
ual performance from having an aggregate effect. One possible 736
explanation regards how aircraft queue at launch catapults, as 737
described in Section III-A: each catapult can allow one aircraft 738
onto the catapult and another to queue behind. At a catapult pair, 739
only one aircraft is actively preparing for launch at any given 740
time. Once this aircraft launches, the aircraft parked behind it 741
moves forward onto the catapult and the aircraft sitting on the 742
paired catapult begins preparing for launch. A new aircraft is 743
then taxied to the empty place in the catapult queue. 744
The actions of the Deck Handler create this queueing pattern 745
immediately and keep it in existence throughout the mission. 746
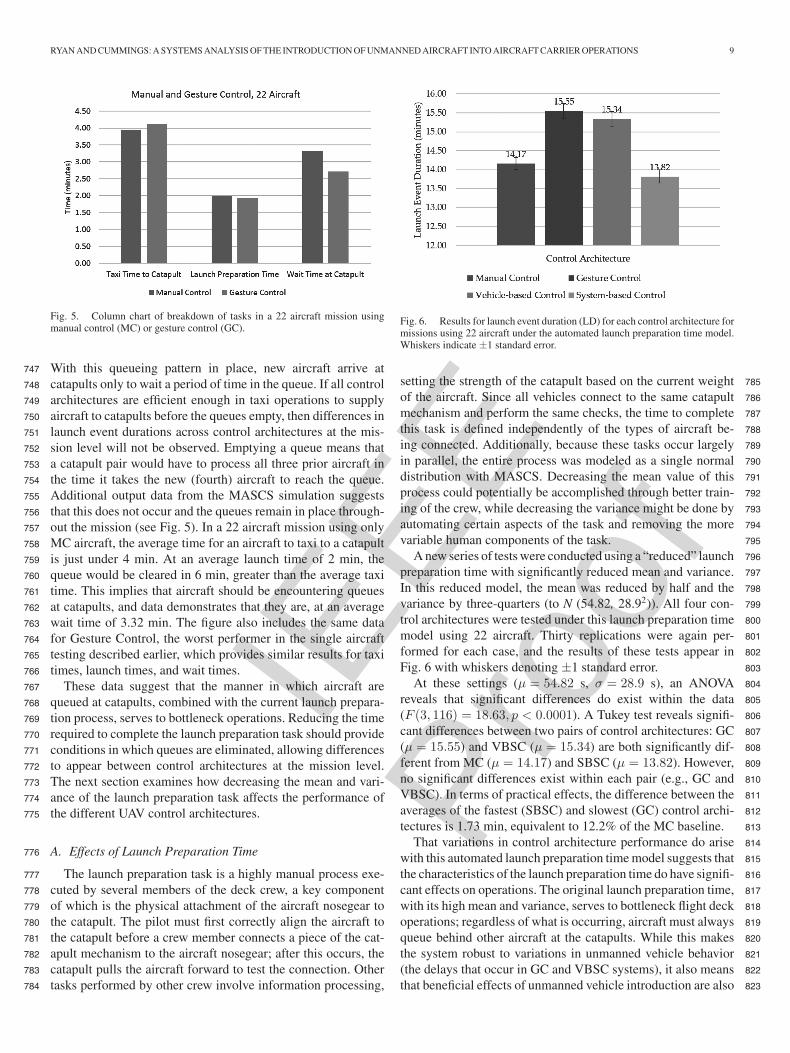
IEEE
Proo
f
RYAN AND CUMMINGS: A SYSTEMS ANALYSIS OF THE INTRODUCTION OF UNMANNED AIRCRAFT INTO AIRCRAFT CARRIER OPERATIONS 9
Fig. 5. Column chart of breakdown of tasks in a 22 aircraft mission usingmanual control (MC) or gesture control (GC).
With this queueing pattern in place, new aircraft arrive at747
catapults only to wait a period of time in the queue. If all control748
architectures are efficient enough in taxi operations to supply749
aircraft to catapults before the queues empty, then differences in750
launch event durations across control architectures at the mis-751
sion level will not be observed. Emptying a queue means that752
a catapult pair would have to process all three prior aircraft in753
the time it takes the new (fourth) aircraft to reach the queue.754
Additional output data from the MASCS simulation suggests755
that this does not occur and the queues remain in place through-756
out the mission (see Fig. 5). In a 22 aircraft mission using only757
MC aircraft, the average time for an aircraft to taxi to a catapult758
is just under 4 min. At an average launch time of 2 min, the759
queue would be cleared in 6 min, greater than the average taxi760
time. This implies that aircraft should be encountering queues761
at catapults, and data demonstrates that they are, at an average762
wait time of 3.32 min. The figure also includes the same data763
for Gesture Control, the worst performer in the single aircraft764
testing described earlier, which provides similar results for taxi765
times, launch times, and wait times.766
These data suggest that the manner in which aircraft are767
queued at catapults, combined with the current launch prepara-768
tion process, serves to bottleneck operations. Reducing the time769
required to complete the launch preparation task should provide770
conditions in which queues are eliminated, allowing differences771
to appear between control architectures at the mission level.772
The next section examines how decreasing the mean and vari-773
ance of the launch preparation task affects the performance of774
the different UAV control architectures.775
A. Effects of Launch Preparation Time776
The launch preparation task is a highly manual process exe-777
cuted by several members of the deck crew, a key component778
of which is the physical attachment of the aircraft nosegear to779
the catapult. The pilot must first correctly align the aircraft to780
the catapult before a crew member connects a piece of the cat-781
apult mechanism to the aircraft nosegear; after this occurs, the782
catapult pulls the aircraft forward to test the connection. Other783
tasks performed by other crew involve information processing,784
Fig. 6. Results for launch event duration (LD) for each control architecture formissions using 22 aircraft under the automated launch preparation time model.Whiskers indicate ±1 standard error.
setting the strength of the catapult based on the current weight 785
of the aircraft. Since all vehicles connect to the same catapult 786
mechanism and perform the same checks, the time to complete 787
this task is defined independently of the types of aircraft be- 788
ing connected. Additionally, because these tasks occur largely 789
in parallel, the entire process was modeled as a single normal 790
distribution with MASCS. Decreasing the mean value of this 791
process could potentially be accomplished through better train- 792
ing of the crew, while decreasing the variance might be done by 793
automating certain aspects of the task and removing the more 794
variable human components of the task. 795
A new series of tests were conducted using a “reduced” launch 796
preparation time with significantly reduced mean and variance. 797
In this reduced model, the mean was reduced by half and the 798
variance by three-quarters (to N (54.82, 28.92)). All four con- 799
trol architectures were tested under this launch preparation time 800
model using 22 aircraft. Thirty replications were again per- 801
formed for each case, and the results of these tests appear in 802
Fig. 6 with whiskers denoting ±1 standard error. 803
At these settings (μ = 54.82 s, σ = 28.9 s), an ANOVA 804
reveals that significant differences do exist within the data 805
(F (3, 116) = 18.63, p < 0.0001). A Tukey test reveals signifi- 806
cant differences between two pairs of control architectures: GC 807
(μ = 15.55) and VBSC (μ = 15.34) are both significantly dif- 808
ferent from MC (μ = 14.17) and SBSC (μ = 13.82). However, 809
no significant differences exist within each pair (e.g., GC and 810
VBSC). In terms of practical effects, the difference between the 811
averages of the fastest (SBSC) and slowest (GC) control archi- 812
tectures is 1.73 min, equivalent to 12.2% of the MC baseline. 813
That variations in control architecture performance do arise 814
with this automated launch preparation time model suggests that 815
the characteristics of the launch preparation time do have signifi- 816
cant effects on operations. The original launch preparation time, 817
with its high mean and variance, serves to bottleneck flight deck 818
operations; regardless of what is occurring, aircraft must always 819
queue behind other aircraft at the catapults. While this makes 820
the system robust to variations in unmanned vehicle behavior 821
(the delays that occur in GC and VBSC systems), it also means 822
that beneficial effects of unmanned vehicle introduction are also 823

IEEE
Proo
f
10 IEEE TRANSACTIONS ON HUMAN-MACHINE SYSTEMS
obscured. Improving operations on the flight deck would first824
require improving the performance of this vehicle-independent825
processing task, rather than improving the performance of indi-826
vidual vehicles.827
These results are also important for other similar domains,828
such as future airport operations. Given the first set of results829
under the original launch preparation model, the introduction of830
unmanned vehicle systems provided no benefit whatsoever to831
system operations due to the settings of the vehicle-independent832
launch preparation task. Given this data, a stakeholder would833
likely decide that UAV integration provides no tangible benefits834
to operations. They might also decide that because there are no835
differences, all types of unmanned vehicles provide the same836
level of performance in the system; the choice might then be837
made based on other factors. If this occurs, and the system moves838
to a faster tempo of operation, this decision might have severe839
consequences. In aircraft carrier operations, tempo increases840
during wartime combat operations; in airports, increasing the841
tempo could help relieve the congestion common at many U.S.842
airports. At this increased tempo setting, if stakeholders have843
already locked in to using a GC or VBSC system based on the844
previous data, operations will not perform to the level that was845
originally expected.846
The use of simulations like MASCS, as presented here, can847
help to clarify what differences can be expected from these848
systems in the real world and how their performance might849
be influenced by other process-level tasks independent of the850
UAV system control architecture itself. They can also help to851
explore under what conditions performance of these systems852
could be improved. While the results shown above demonstrated853
that the GC architecture performed poorly under the “reduced”854
launch preparation time model, the GC system also had the855
most changes from the MC baseline, varying on five of the six856
design parameters listed in Section III-C. Improvements along857
some combination of these parameters should be sufficient to858
provide GC performance equivalent to that of the baseline MC859
architecture. The next section demonstrates how simulations like860
MASCS can be used to examine the effects of changing vehicle861
performance parameters for the control architecture models in862
an example design space exploration.863
B. Design Space Exploration864
In future systems, stakeholders may seek to understand what865
changes to unmanned system control architectures are required866
to improve the performance under certain system conditions.867
This section examines how this might occur for the case of the868
GC architecture, which previous results showed as having the869
worst performance of the modeled architectures. The most im-870
portant changes in the Gesture Control architecture involve the871
increased failure rates of these vehicles in recognizing Aircraft872
Directors and their commands and the processing lag in recog-873
nizing those commands. The failures also carry with them time874
penalties that delay vehicle activity on the flight deck and that,875
as demonstrated, can sometimes be detrimental to flight deck876
performance. Improving the accuracy of these systems and re-877
ducing their processing times should improve the performance878
Fig. 7. Results for launch event duration (LD) for variations of 22 aircraft Ges-tural Control (GC) model using the “reduced” (mean-50%, standard deviation-50%) launch preparation time distribution. Whiskers indicate ±1 standard error.
of the GC system, but it is not known which of these carries 879
more weight in terms of improving mission performance. 880
Three new GC models are tested in this section over a va- 881
riety of mission conditions. First, a “Low Failure” case is cre- 882
ated in which the failure rate is reduced from 11.16% to 1%, 883
modeling a “best-case scenario” of system accuracy. Second, a 884
“Low Latency” is created in which commands are processed at 885
a maximum of 0.5 s. A third model combines the two cases, 886
generating a Low Latency + Low Failure condition that should 887
show improvement in performance. A first series of tests ad- 888
dressed the effects of these models in missions involving 22 889
aircraft under the original launch preparation model (N (109.65, 890
57.802)), but no significant differences were observed (ANOVA, 891
F (4, 145) = 0.51, p = 0.73). This is to be expected, given the 892
effectiveness of the original launch preparation time distribution 893
in obscuring variations between control architectures. 894
A second round of testing then proceeded to the “reduced” 895
launch preparation model (N (54.82, 28.92)), reducing both the 896
mean and standard deviation by 50%. Thirty replications of the 897
same 22 aircraft mission used previously were conducted for 898
each of the three new GC models (Low Failure, Low Latency, 899
Low Latency + Low Failure). Given the results of the previous 900
section, the variations in performance were expected to appear 901
at this faster launch preparation time model. The results of these 902
tests appear in Fig. 7 and include results for the baseline GC and 903
MC models for comparison. 904
The figure shows that the data exhibits a noticeable trend 905
from the baseline GC model to Low Latency, then Low Failure, 906
then Low Latency + Failure, then the baseline MC model. An 907
ANOVA shows that significant differences do exist between the 908
five test cases (F (4, 145) = 8.12, p = 0.0001). A Tukey post 909
hoc test shows that, most importantly, the GC Low Latency + 910
Low Failure and MC cases are not significantly different from 911
one another (p = 0.60). The MC data is significantly different 912
from the GC Baseline (p < 0.0001), Low Failure (p = 0.017), 913
and Low Latency (p = 0.034) cases. The Low Latency + Low 914
Failure case is also significantly different from the GC baseline 915
model (p = 0.0012), but is not different from the Low Failure 916
(p = 0.17) and Low Latency (p = 0.10) cases. This is fairly 917

IEEE
Proo
f
RYAN AND CUMMINGS: A SYSTEMS ANALYSIS OF THE INTRODUCTION OF UNMANNED AIRCRAFT INTO AIRCRAFT CARRIER OPERATIONS 11
interesting and highlights the significance of the earlier issues918
with the baseline GC models: the GC architecture requires sub-919
stantial improvements to both the gesture recognition accuracy920
and processing speeds to achieve performance equivalent to MC921
operations. Improvements to either of these elements individ-922
ually were not strong enough to generate significant improve-923
ments in GC performance.924
V. CONCLUSION925
This paper has described the use of an agent-based simulation926
model of aircraft carrier flight deck operations that allowed for a927
systems-level analysis of the key features of unmanned vehicle928
behavior that influence aircraft carrier flight deck performance.929
Testing demonstrated that the launch preparation process, whose930
execution times are independent of any specific unmanned ve-931
hicle control architecture, heavily influenced system behavior932
and effectively obscured differences between control architec-933
tures. Differences in control architecture performance were only934
observed under a task model with significantly reduced mean935
and variance. However, this launch preparation process is not936
slated for improvement in the near future. Ultimately, these re-937
sults suggest that failure to reexamine the structure of flight938
deck operations and the system as whole will ultimately limit939
the effectiveness of introducing autonomy into aircraft on the940
flight deck.941
Additional testing examined how, under such a reduced942
launch preparation time, the simulation could be used to inves-943
tigate the effects of modifying control architecture parameters.944
These results showed that Gesture Control systems required945
improvements to both accuracy rates and processing times in946
order to achieve performance equivalent to manual control op-947
erations in a 22 aircraft mission. Overall, these results suggest948
that the structure and definition of parameters within the broader949
system (the flight deck and tasks defined independently of the950
control architectures) has a significant impact on the behavior of951
the control architectures modeled in this paper. For stakeholders952
making decisions regarding which types of control architectures953
to implement in future operations, for environments with similar954
structure to the carrier flight deck, the definition of tasks like the955
launch preparation time (the final task performed by vehicles956
before exiting the system) greatly affects control architecture957
performance.958
The focus of MASCS at this time has been a general exami-959
nation of how different unmanned vehicle control architectures960
affect operations on the aircraft carrier flight deck, using mod-961
els of future UAV control architectures that have reached some962
level of maturity in operations. A significant limitation of this963
modeling and this research has been the exclusion of rare and964
safety-critical events from the system. These are an important965
aspect of operations in any complex system, and models of rare966
events, failures, and other issues could be included in the mod-967
eling of the physical environment (weather conditions, damage968
to the ship and flight deck), the vehicle models (mechanical969
or electrical failures, etc.) or in the modeling of the human970
actors (poor decision making, random accidents, etc.). These971
are all important areas of future work that can be addressed in972
future research, but until formally validated, MASCS cannot be 973
considered a true predictor of real-world system performance. 974
Ultimately, as unmanned systems move from operating in 975
isolated environments to more complex human-centered ones, 976
understanding the drivers of performance for both unmanned 977
vehicles and the systems in which they operate is key. This 978
research has demonstrated how this can be achieved through the 979
use of agent-based modeling of unmanned vehicle systems and 980
provided results that suggest that, for future aircraft carrier flight 981
deck and airport operations, improving aspects of the system 982
itself are as important, if not more so, than UAV improving 983
the performance of the UAV systems being introduced. Future 984
work will address how these control architectures interact with 985
changes to the operational structure, examining how changes 986
to the nature of planning and routing of aircraft tasks in the 987
flight deck environment interact with other elements to drive 988
variations not only in mission durations, but in terms of safety 989
and efficiency as well. 990
REFERENCES 991
[1] R. Tinto, “Mine of the future,” 2011. Q1992[2] A. Topf, “Rio Tinto boosts driverless truck fleet for use in Pilbara,” 2011. 993[3] J. Scanlon, “How KIVA robots help Zappos and Walgreens,” 2009. 994[4] S. Nikolaidis and J. Shah, “Human-Robot interactive planning using cross- 995
training-a human team training approach,” presented at the AIAA In- 996fotech@Aerospace, Garden Grove, CA, 2012. 997
[5] E. Bonabeau, “Agent-based modeling: Methods and techniques for sim- 998ulating human systems,” Proc. Nat. Academy Sci. United States Amer., 999vol. 99, no. Suppl. 3, pp. 7280–7287, 2002. 1000
[6] B. McKinney, “Unmanned combat air system carrier demonstration 1001(UCAS-D),” 2011. 1002
[7] W. J. Hennigan, “Navy drone X-47B lands on carrier deck in historic first,” 1003Jul. 2013. 1004
[8] “Integration of Civil Unmanned Aircraft Systems (UAS) in the National 1005Airspace System (NAS) Roadmap,” Tech. Rep., Federal Aviation Admin., 1006Washington, DC, USA, 2013. Q21007
[9] K. Sycara and M. Lewis, “Agent-based approaches to dynamic team sim- 1008ulation,” Tech. Rep. NPRST-TN-08-9, Navy Personnel Research, Studies, 1009and Technology Division, Bureau of Naval Personnel, Millington, TN, 1010USA, 2008. 1011
[10] K. Carley, D. Fridsma, E. Casman, N. Altman, J. Chang, B. Kaminsky, 1012D. Nave, and A. Yahja, “BioWar: Scalable multi-agent social and epi- 1013demiological simulation of bioterrorism events,” IEEE Trans. Syst., Man 1014Cybern. Part A, Syst. Humans, vol. 36, no. 2, pp. 252–265, 2006. 1015
[11] S. M. Lee, A. R. Pritchett, and K. M. Corker, “Evaluating transformations 1016of the air transportation system through agent-based modeling and sim- 1017ulation,” in Proc. 7th FAA/Eurcontrol Seminar Air Traffic Manage. Res. 1018Develop., 2007. Q31019
[12] J. M. Epstein and R. M. Axtell, Growing Artificial Societies: Social Science 1020From the Bottom Up. Washington, DC, USA: Brookings Institution, 1996. 1021
[13] S. J. Rasmussen and P. R. Chandler, “MultiUAV: A Multiple UAV Simu- 1022lation for Investigation of Cooperative Control,” presented at the Winter 1023Simulation Conf., San Diego, CA, USA, 2002. 1024
[14] J. J. Corner and G. B. Lamont, “Parallel simulation of UAV swarm sce- 1025narios,” presented at the Winter Simulation Conf., Washington, DC, USA, 10262004. 1027
[15] R. E. Weibel and R. J. Hansman Jr., “Safety considerations for operation 1028of different classes of UAVs in the NAS,” in presented at the AIAA’s 10294th Aviation Technol., Integration, Operations Forum, Chicago, IL, USA, 10302004. 1031
[16] B. Schumann, J. Scanlan, and K. Takeda, “Evaluating design decisions 1032in real-time using operations modelling,” presented at the Air Transport 1033Operations Symp., Delft, The Netherlands, 2011. 1034
[17] C. Nehme, “Modeling human supervisory control in heterogeneous un- 1035manned vehicle systems,” Ph.D. thesis, Massachusetts Inst. Technol., 1036Cambridge, MA, USA, 2009. 1037

IEEE
Proo
f
12 IEEE TRANSACTIONS ON HUMAN-MACHINE SYSTEMS
[18] A. A. Mkrtchyan, “Modeling operator performance in low task load super-1038visory domains,” M.S. thesis, Massachusetts Inst of Technol., Cambridge,1039MA, USA, 2011.1040
[19] Y. Song, D. Demirdjian, and R. Davis, “Multi-Signal gesture recognition1041using temporal smoothing hidden conditional random fields,” presented1042at the 9th IEEE Conf. Automat. Face Gesture Recog., Santa Barbara, CA,1043USA, 2011.1044
[20] Y. Song, D. Demirdjian, and R. Davis, “Continuous body and hand ges-1045ture recognition for natural human-computer interaction,” ACM Trans.1046Interactive Intell. Syst., vol. 2, no. 1, article 5, 2012.1047
[21] T. B. Sheridan, Telerobotics, Automation and Human Supervisory Control.1048Cambridge, MA, USA: The MIT Press, 1992.1049
[22] M. L. Cummings and S. Guerlain, “Developing operator capacity estimates1050for supervisory control of autonomous vehicles,” Human Factors, vol. 49,1051no. 1, pp. 1–15, 2007.1052
[23] M. L. Cummings and P. J. Mitchell, “Predicting controller capacity in1053remote supervision of multiple unmanned vehicles,” IEEE Trans. Syst.,1054Man, Cybern. Part A, Syst. Humans, vol. 38, no. 2, pp. 451–460, 2008.Q4 1055
[24] M. L. Cummings, J. How, A. Whitten, and O. Toupet, “The impact of1056human-automation collaboration in decentralized multiple unmanned ve-1057hicle control,” Proc. IEEE, vol. 100, no. 3, pp. 660–671, Mar. 2012.1058
[25] J. C. Ryan and M. L. Cummings, “Development of an agent-based model1059for aircraft carrier flight deck operations,” Model. Simulation J., 2014.Q5 1060
[26] J. C. Ryan, A. G. Banerjee, M. L. Cummings, and N. Roy, “Comparing1061the performance of expert user heuristics and an integer linear program1062in aircraft carrier deck operations,” IEEE Trans. Cybern., vol. 44, no. 6,1063pp. 761–773, Jun. 2014.1064
[27] M. Blank, L. Gorelick, E. Shechtman, M. Irani, and R. Basri, “Action1065as Space-Time Shapes,” presented at the 10th IEEE Int. Conf. Comput.1066Vision, Beijing, China, 2005.1067
[28] Z. Lin, Z. Jiang, and L. S. Davis, “Recognizing actions by shape- motion1068prototypes,” presented at the 12th Int. Conf. Comput. Vision, Kyoto, Japan,10692009.1070
[29] H. Jhuang, T. Serre, L. Wolf, and T. Poggio, “A biologically inspired1071system for action recognition,” presented at the IEEE 11th Int. Conf.1072Comput. Vision, Rio de Janeiro, Brazil, 2007.1073
[30] P. Scovanner, S. Ali, and M. Shah, “A 3-Dimensional SIFT Descriptor and1074its application to action recognition,” presented at the ACM Multimedia,1075Augsburg, Bavaria, Germany, 2007.1076
[31] I. Laptev, M. Marszalek, C. Schimd, and B. Rozenfeld, “Learning realistic1077human action from movies,” presented at the IEEE Conf. Comput. Vision1078Pattern Recog., Anchorage, AK, USA, 2008.1079
[32] K. Schindler and L. van Gool, “Action Snippets: How many frames does 1080human action recognition require?,” presented at the IEEE Conf. Comput. 1081Vision Pattern Recog., Anchorage, AK, USA, 2008. 1082
[33] J. Yuan, Z. Liu, and Y. Wu, “Discriminative subvolume search for efficient 1083action detection,” presented at the IEEE Conf. Comput. Vision Pattern 1084Recog., Miami, FL, USA, 2009. 1085
Jason C. Ryan (M’12) received the Bachelor’s of 1086Science degree in aerospace engineering from the 1087University of Alabama, Tuscaloosa, AL, USA, in 10882007, the Master’s of Science degree in aeronautics 1089and astronautics and the Ph.D. degree in human sys- 1090tems engineering both from the Massachusetts Insti- 1091tute of Technology, Cambridge, MA, USA, in 2011, 1092and 2014, respectively. 1093
He is currently with Aurora Flight Sciences. 10941095
Mary L. Cummings (SM’03) received the B.S. de- 1096gree in mathematics from the United States Naval 1097Academy, Annapolis, MD, USA, in 1988, the M.S. 1098degree in space systems engineering from the Naval 1099Postgraduate School, Monterey, CA, USA, in 1994, 1100and the Ph.D. degree in systems engineering from the 1101University of Virginia, Charlottesville, VA, USA, in 11022004. 1103
She is currently a Visiting Professor with the 1104Department of Aeronautics and Astronautics, Mas- 1105sachusetts Institute of Technology and an Associate 1106
Professor in the Department of Mechanical Engineering and Materials Science 1107at Duke University, Durham, NC, USA. 1108
1109

IEEE
Proo
f
QUERIES 1110
Q1. Author: Please provide full bibliographic details in Refs. [1], [2], [3], [6] and [7]. 1111
Q2. Author: Please provide report number in Ref. [8]. 1112
Q3. Author: Please provide page range in Ref. [11]. 1113
Q4. Author: Please provide month in Ref. [23]. 1114
Q5. Author: Please provide volume and page range in Ref. [25]. 1115