ieee transactions on education, vol. , no. , 1...
TRANSCRIPT
IEEE TRANSACTIONS ON EDUCATION, VOL. , NO. , 1
Educational Software for Interference and
Optical Diffraction Analysis in Fresnel and
Fraunhofer Regions Based on MATLAB GUIs
and the FDTD Method
Jorge Francés, Manuel Pérez-Molina, Sergio Bleda, Elena Fernández,
Cristian Neipp, and Augusto Beléndez
Abstract
Interference and diffraction of light are elementary topics in optics. The aim of the work presented
here is to develop an accurate and cheap optical system simulation software that provides a virtual
laboratory for studying the effects of propagation in both time and space for the near and far field
regions. In laboratory sessions this software can let optical engineering undergraduates simulate
many optical systems based on thin slits. The numerical method used is the Finite-Difference Time-
Domain method that has been succesfully applied in many engineering fields. Using this numerical
method, the irradiance distribution can be succesfully evaluated in different planes far from the
simulation grid without degrading performance. In addition, an easy-to-use MATLAB GUI handles
all the parameters of the FDTD simulation and computes theoretical values of irradiance for both the
Fresnel and Fraunhofer regions. Therefore, by using this software the student is able to analyze the
J. Francés, M. Pérez-Molina, S. Bleda, C. Neipp and A. Beléndez are with the University of Alicante. Department ofPhysics, Systems Engineering and Signal Theory. San Vicente del Raspeig Ap. 99, E-03080, Alicante (Spain), e-mail:{jfmonllor, manuelpm, sergio.bleda}@ua.es, [email protected], [email protected]
E. Fernández is with the University of Alicante. Optics, Pharmacology and Anatomy. San Vicente del Raspeig Ap. 99,E-03080, Alicante (Spain), e-mail: [email protected]
M. Pérez-Molina, S. Bleda, E. Fernández, C. Neipp and A. Beléndez are with University of Alicante. University Instituteof Physics to Sciences and Technologies. San Vicente del Raspeig Ap. 99, E-03080. Alicante (Spain)
Manuscript received April 02, 2010; revised , 2010.
April 19, 2011 DRAFT
FRANCÉS MONLLOR, Jorge, et al. "Educational software for interference and optical diffraction analysis in Fresnel and Fraunhoferregions based on MATLAB GUIs and the FDTD method". IEEE Transactions on Education. Vol. 55, No. 1, pp. 118-125 (2012). ISSN 0018-9359. doi: 10.1109/TE.2011.2150750
IEEE TRANSACTIONS ON EDUCATION, VOL. , NO. , 2
behaviour of the Fresnel and Fraunhofer expressions as a function of the distance. This distance is
defined as the space between the planes that contains the virtual screen on which the irradiance
pattern is represented, and the slits plane.
Index Terms
Diffraction, Education, Finite Difference method, Optics, Virtual laboratory
I. INTRODUCTION
Hands-on experiments in laboratory sessions play an important role in improving student
knowledge. In optics education, students in this type of session have to use different
instruments such as lasers, analyzers, detectors, and the like. All these instruments are
usually very expensive and in many cases are not correctly handled. In these experiments,
focused on demonstrating the wave nature of light [1], [2], the light diffracts through slits
and illuminates a screen at a large distance compared to the separation between slits. This
paper describes the development of software that simulates many optical experiments, such
as Young’s double slit experiment or diffraction gratings. The software is based on the Finite-
Difference Time-Domain Method (FDTD), which is a direct solution method of Maxwell’s time-
dependent curl equations. With this method, the electromagnetic fields can be calculated
as a function of time and space, letting students analyze how light diffracts through the
slits, or perform other experiments related to electromagnetic wave propagation. Although
several commercial packages (MEEP [3] and FDTD Solutions [4], for instance) compute this
numerical method and are used in academia, in most cases these software packages are
designed to solve high-level engineering problems such as photonic crystals or microwave
antennas. In addition, using these packages would often require several input parameters
that are not directly related to the physical experiment. The flexibility and potential offered
by these packages requires an initial set up to be performed by an expert, or in this case,
by students; as consequence, extra time must be allowed. However, this flexibility would be
more appropriate for higher courses, whose students have acquired many skills that enable
April 19, 2011 DRAFT
FRANCÉS MONLLOR, Jorge, et al. "Educational software for interference and optical diffraction analysis in Fresnel and Fraunhoferregions based on MATLAB GUIs and the FDTD method". IEEE Transactions on Education. Vol. 55, No. 1, pp. 118-125 (2012). ISSN 0018-9359. doi: 10.1109/TE.2011.2150750

IEEE TRANSACTIONS ON EDUCATION, VOL. , NO. , 3
them to easily understand the entire application. For that reason, a user-friendly educational
software has been developed to easily simulate several basic optical experiments. Using this
software in the first years of Optics or Physics degrees can give students the opportunity of
evaluating many optical systems experiments with an easy and accurate software, without
using expensive instrumentation.
On the other hand, it is also useful for students to understand that the closed theoretical
expressions for diffraction analysis have a limited range of applicability. These expressions
are usually obtained by approximating the integral vectorial expression of the electromagnetic
field to an equation which is easier to handle. This approximation is based on omitting higher
orders in the Taylor series or similar.
This software is structured in an API based on MATLAB [5] that invokes an executable
file. This source file is compiled in an UNIX-based operating system. The MATLAB interface
provided shows plots of the result, taking the values computed by the C++ simulation
software. The user-friendly interface and the accurate results make this software an attractive
and useful complement for student education.
II. OBJECTIVES AND SCOPE
In the authors’ institution, optics, wave diffraction and interference are an integral part of
Telecommunication and Computer Science degrees. The theoretical background of this topic
is supplemented with theoretical lessons in the classroom and with laboratory work. However,
there is neither enough time nor sufficient equipment to teach all the practical aspects of
interference and diffraction of light.
The application of the European Space for Higher Education of The Bologna declaration
implies the use of new technologies involved in education transfer. Moreover, the use of
new technologies in education is a transversal competence of this new way of teaching.
The virtual optical laboratory application described here is focused on helping students to
develop their knowledge [6]–[9] and intuition for wave interaction. In addition, this software
April 19, 2011 DRAFT
FRANCÉS MONLLOR, Jorge, et al. "Educational software for interference and optical diffraction analysis in Fresnel and Fraunhoferregions based on MATLAB GUIs and the FDTD method". IEEE Transactions on Education. Vol. 55, No. 1, pp. 118-125 (2012). ISSN 0018-9359. doi: 10.1109/TE.2011.2150750
IEEE TRANSACTIONS ON EDUCATION, VOL. , NO. , 4
allows the evaluation of the application range of the closed expressions, usually taught in
theoretical sessions. The tool is aimed at speeding up learning, since it allows students
to modify multiple parameters on the simulation and analyze the results. It is intended to
complement rather than replace laboratory work, but in many cases it can be useful to start
with this tool instead of the classical laboratory set-up.
The developed tool simulates, by means of the Finite Difference Time Domain (FDTD)
method, the electromagnetic fields [10], [11] that define the wave propagation of light.
Specifically, the software is focused on the simulation of the interference and diffraction
of light when it impinges on a screen with thin slits or apertures. A well-known experiment
related to this topic is the Young’s double slit experiment, usually included in the curricula of
physics and engineering degrees since it demonstrates the wave behavior of light. Moreover,
this experiment provides a set of interference patterns in the far field region (Fraunhofer)
that can be compared analytically with well-known closed expressions. The use of the tool
described here thus makes an important contribution to improving student knowledge.
III. FRESNEL AND FRAUNHOFER DIFFRACTION
Considering an aperture of small area illuminated by a plane wave, the light emitted from
the aperture plane onto a parallel screen placed near the aperture presents a pattern similar
to the size of the aperture, with several fringes surrounding the edges [2]. As the plane is
moved farther from the aperture plane (Γ), the image of the aperture can be identified, but
the intensity of the fringes becomes more relevant. This phenomenon is known as Fresnel or
near field diffraction. So if the distance between the screen (Υ) and the aperture (Γ) planes
becomes greater, it is more difficult to identify the radiation pattern with the shape of the
aperture. Once the distance is greater than a particular value, the diffraction pattern has no
apparent changes. This distance determines the Fraunhofer region, and the pattern produced
is also called Fraunhofer diffraction. As can be seen in Fig. 1, the electrical field at point P
April 19, 2011 DRAFT
FRANCÉS MONLLOR, Jorge, et al. "Educational software for interference and optical diffraction analysis in Fresnel and Fraunhoferregions based on MATLAB GUIs and the FDTD method". IEEE Transactions on Education. Vol. 55, No. 1, pp. 118-125 (2012). ISSN 0018-9359. doi: 10.1109/TE.2011.2150750

IEEE TRANSACTIONS ON EDUCATION, VOL. , NO. , 5
Fig. 1: One Slit diagram
due to the whole aperture is defined by the next defined integral:
E = εL
∫ b/2
−b/2
sin (ωt− kr)
rdz, (1)
where εL is the source efficiency by unit length, k is the wavenumber, r = r(z) is the
distance between the field point P and the aperture and b is the width of the aperture. Two
approximations are generally used to solve Eq. (1), Fresnel and Fraunhofer approximations.
A. Fraunhofer Diffraction
The Fraunhofer approximation is based on the condition of R À b . Under this configuration
r(z) has a value closed to R. The term r(z) is redefined with the use of the Maclaurin series,
neglecting all terms greater than the third one.
r = R− z sin θ + (z2/2R) cos2 θ + · · · ' R− z sin θ, (2)
where θ is measured from the xz plane and z = ±b/2 with R greater enough. Placing Eq. (2)
into (1), the following expression can be obtained:
E = εL
∫ b/2
−b/2
sin (ωt− kr)
r=
εL
R
∫ b/2
−b/2sin [ωt− k(R− z sin θ)] dz, (3)
April 19, 2011 DRAFT
FRANCÉS MONLLOR, Jorge, et al. "Educational software for interference and optical diffraction analysis in Fresnel and Fraunhoferregions based on MATLAB GUIs and the FDTD method". IEEE Transactions on Education. Vol. 55, No. 1, pp. 118-125 (2012). ISSN 0018-9359. doi: 10.1109/TE.2011.2150750

IEEE TRANSACTIONS ON EDUCATION, VOL. , NO. , 6
TABLE I: Limit region between Fraunhofer and Fresnel approximations
Fraunhofer Fresnel
F ≤0.6 F > 0.6
TABLE II: Limit region between Fraunhofer and Fresnel approximations
1 aperture 2 apertures N apertures
I(θ)I(0)
(sin β
β
)24(
sin ββ
)2cos2 α
(sin βNβ
)2 (sin Nα
α
)2
and finally
E =bεL
R
sin β
βsin (ωt− kR) , (4)
with β = (kb/2) sin θ. Moreover, taking into account that the irradiance can be defined as
I(θ) = 〈E2〉T and that the independent term in the Eq. (4) is equal to 1/2 [2], it is easy to
obtain the following well-known equation
I(θ) = I(0)
(sin β
β
)2
, (5)
with I(0) = 12
(εLbR
)2. The range of validity of this expression is defined by the Fraunhofer’s
condition F = b2/Lλ ¿ 1, with b being the width of the aperture and L the distance
between the Γ and Υ planes. However, several authors define a more accurate limit between
the Fraunhofer and Fresnel region [12] shown in Table I. Furthermore, in Table II, several
expressions according to the number of apertures are shown, where α = (ka/2) sin θ, and
the relation with the gap between apertures is defined as a.
B. Fresnel Diffraction
The Fresnel approximation begins with a similar expression to Eq. (1), also in differential
form:
dEp =ε0
ρrλsin [k(ρ + r)− ωt] dS (6)
April 19, 2011 DRAFT
FRANCÉS MONLLOR, Jorge, et al. "Educational software for interference and optical diffraction analysis in Fresnel and Fraunhoferregions based on MATLAB GUIs and the FDTD method". IEEE Transactions on Education. Vol. 55, No. 1, pp. 118-125 (2012). ISSN 0018-9359. doi: 10.1109/TE.2011.2150750
IEEE TRANSACTIONS ON EDUCATION, VOL. , NO. , 7
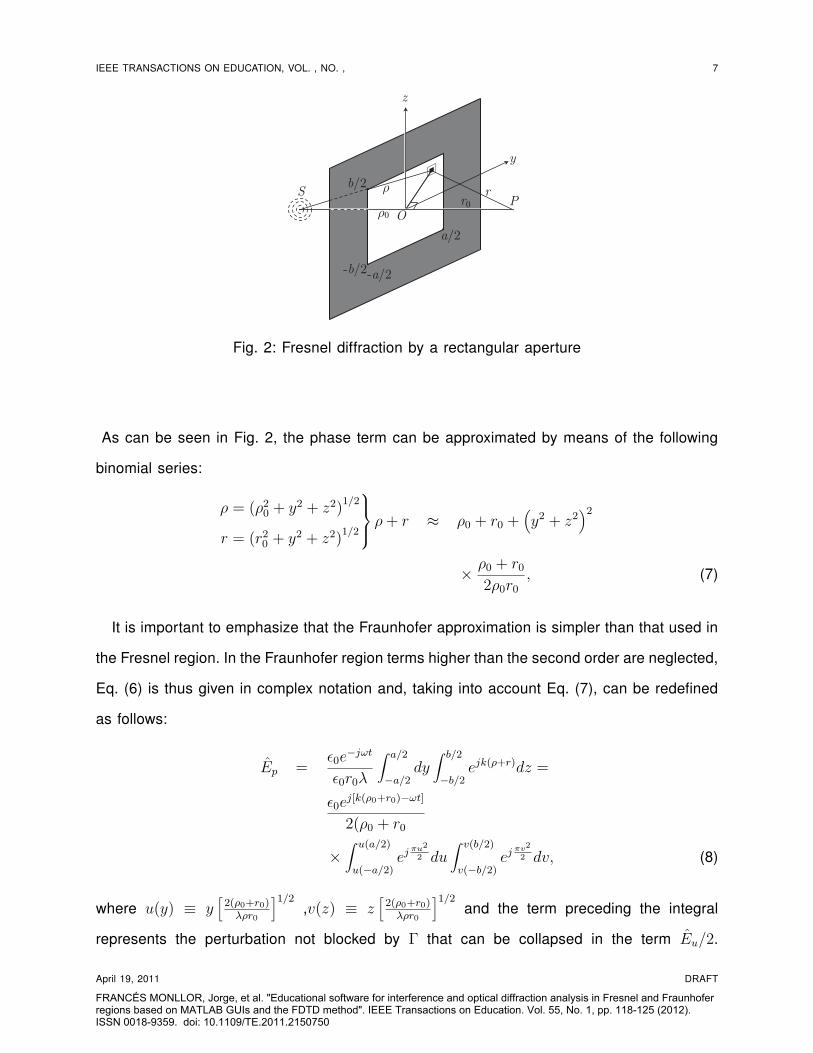
Fig. 2: Fresnel diffraction by a rectangular aperture
As can be seen in Fig. 2, the phase term can be approximated by means of the following
binomial series:
ρ = (ρ20 + y2 + z2)
1/2
r = (r20 + y2 + z2)
1/2
ρ + r ≈ ρ0 + r0 +(y2 + z2
)2
× ρ0 + r0
2ρ0r0
, (7)
It is important to emphasize that the Fraunhofer approximation is simpler than that used in
the Fresnel region. In the Fraunhofer region terms higher than the second order are neglected,
Eq. (6) is thus given in complex notation and, taking into account Eq. (7), can be redefined
as follows:
Ep =ε0e
−jωt
ε0r0λ
∫ a/2
−a/2dy
∫ b/2
−b/2ejk(ρ+r)dz =
ε0ej[k(ρ0+r0)−ωt]
2(ρ0 + r0
×∫ u(a/2)
u(−a/2)ej πu2
2 du∫ v(b/2)
v(−b/2)ej πv2
2 dv, (8)
where u(y) ≡ y[
2(ρ0+r0)λρr0
]1/2,v(z) ≡ z
[2(ρ0+r0)
λρr0
]1/2and the term preceding the integral
represents the perturbation not blocked by Γ that can be collapsed in the term Eu/2.
April 19, 2011 DRAFT
FRANCÉS MONLLOR, Jorge, et al. "Educational software for interference and optical diffraction analysis in Fresnel and Fraunhoferregions based on MATLAB GUIs and the FDTD method". IEEE Transactions on Education. Vol. 55, No. 1, pp. 118-125 (2012). ISSN 0018-9359. doi: 10.1109/TE.2011.2150750

IEEE TRANSACTIONS ON EDUCATION, VOL. , NO. , 8
Both integrals are known as the Fresnel’s integrals C(ω) =∫ ω cos(πω′2/2)dω′ and S(ω) =
∫ ω sin(πω′2/2)dω′. For plane waves (ρ → ∞), the variables u and v can be redefined as
u = y[
2λr0
]2and v = z
[2
λr0
]2.
As a result, Eq. (8) can be easily rewritten as:
Ep =Eu
2[C(u)− jS(u)]u2
u1[C(v)− jS(v)]v2
v1=
B12(u)B12(v), (9)
where, for the particular case of apertures infinitely greater along the y axis, the irradiance
produced by an aperture at point P can be deduced as:
Ip =I0
2|B12(v)|2. (10)
From Eq. (10) and the superposition theorem, it is straightforward to calcule the irradiance
pattern produced by several apertures.
Therefore, from the expressions collected in the Table I (Fraunhofer approximation) and
Eq. (10), we can calculate the theoretical curves of irradiance in any point in Υ far away
from Γ.
C. Basis of the FDTD Method
Taking into account the relationship between v in the Eq. (10) and the space coordinates,
it can easily be seen the two-dimensional simulation of the FDTD is adequate to ensure good
accuracy. Therefore, the principles of the FDTD method in two dimensions is based on the
discretization of space and time in the following way:
u(i∆x, j∆y, n∆t) = u|ni,j, (11)
where u is a function that depends on space and time, that in particular corresponds with
each component of the electromagnetic field. The following terms ∆x, ∆y and ∆t are the
spatial (in x and y) and time resolution respectively. The integer indexes i, j and n are used
April 19, 2011 DRAFT
FRANCÉS MONLLOR, Jorge, et al. "Educational software for interference and optical diffraction analysis in Fresnel and Fraunhoferregions based on MATLAB GUIs and the FDTD method". IEEE Transactions on Education. Vol. 55, No. 1, pp. 118-125 (2012). ISSN 0018-9359. doi: 10.1109/TE.2011.2150750
IEEE TRANSACTIONS ON EDUCATION, VOL. , NO. , 9
to define u at a particular point in the space and time.
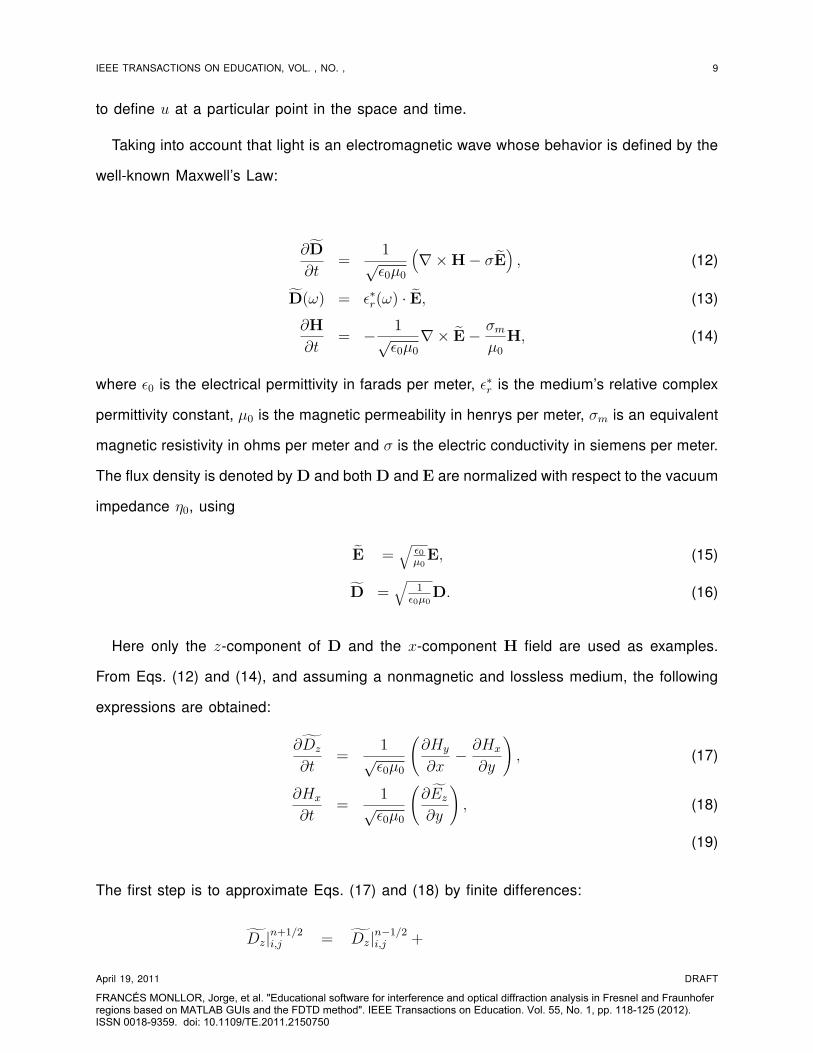
Taking into account that light is an electromagnetic wave whose behavior is defined by the
well-known Maxwell’s Law:
∂D
∂t=
1√ε0µ0
(∇×H− σE
), (12)
D(ω) = ε∗r(ω) · E, (13)
∂H
∂t= − 1√
ε0µ0
∇× E− σm
µ0
H, (14)
where ε0 is the electrical permittivity in farads per meter, ε∗r is the medium’s relative complex
permittivity constant, µ0 is the magnetic permeability in henrys per meter, σm is an equivalent
magnetic resistivity in ohms per meter and σ is the electric conductivity in siemens per meter.
The flux density is denoted by D and both D and E are normalized with respect to the vacuum
impedance η0, using
E =√
ε0µ0
E, (15)
D =√
1ε0µ0
D. (16)
Here only the z-component of D and the x-component H field are used as examples.
From Eqs. (12) and (14), and assuming a nonmagnetic and lossless medium, the following
expressions are obtained:
∂Dz
∂t=
1√ε0µ0
(∂Hy
∂x− ∂Hx
∂y
), (17)
∂Hx
∂t=
1√ε0µ0
(∂Ez
∂y
), (18)
(19)
The first step is to approximate Eqs. (17) and (18) by finite differences:
Dz|n+1/2i,j = Dz|n−1/2
i,j +
April 19, 2011 DRAFT
FRANCÉS MONLLOR, Jorge, et al. "Educational software for interference and optical diffraction analysis in Fresnel and Fraunhoferregions based on MATLAB GUIs and the FDTD method". IEEE Transactions on Education. Vol. 55, No. 1, pp. 118-125 (2012). ISSN 0018-9359. doi: 10.1109/TE.2011.2150750
IEEE TRANSACTIONS ON EDUCATION, VOL. , NO. , 10
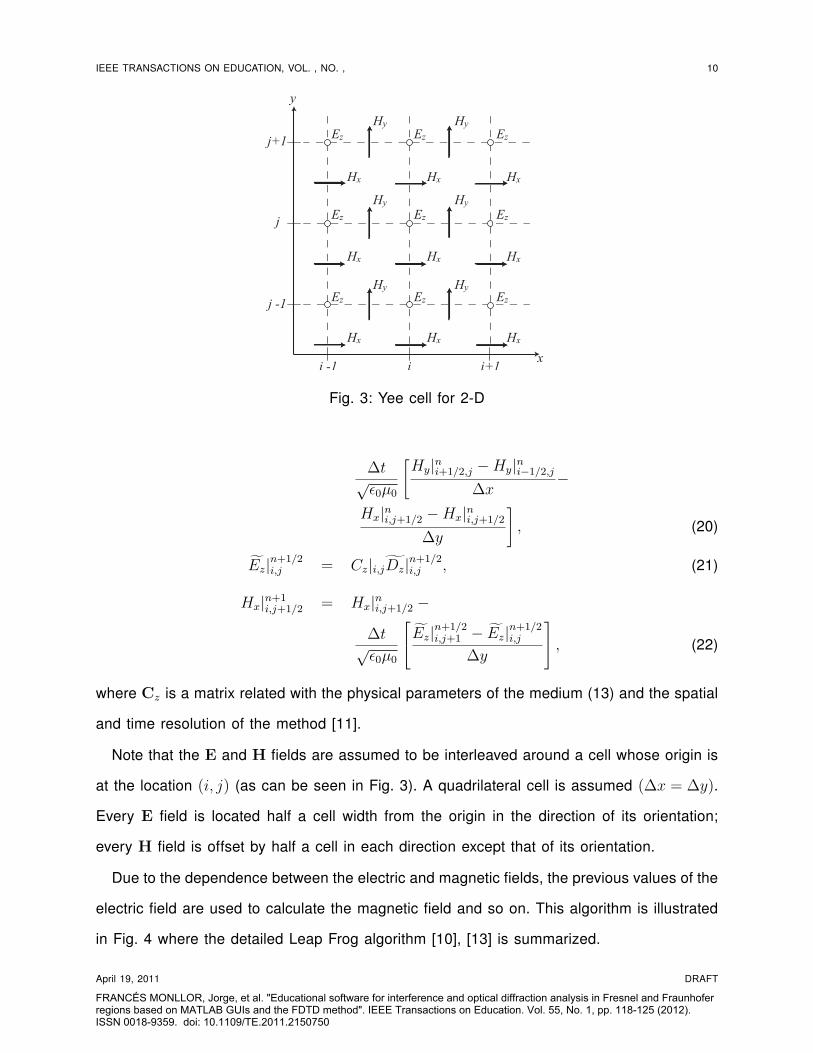
Fig. 3: Yee cell for 2-D
∆t√ε0µ0
[Hy|ni+1/2,j −Hy|ni−1/2,j
∆x−
Hx|ni,j+1/2 −Hx|ni,j+1/2
∆y
], (20)
Ez|n+1/2i,j = Cz|i,jDz|n+1/2
i,j , (21)
Hx|n+1i,j+1/2 = Hx|ni,j+1/2 −
∆t√ε0µ0
Ez|n+1/2
i,j+1 − Ez|n+1/2i,j
∆y
, (22)
where Cz is a matrix related with the physical parameters of the medium (13) and the spatial
and time resolution of the method [11].
Note that the E and H fields are assumed to be interleaved around a cell whose origin is
at the location (i, j) (as can be seen in Fig. 3). A quadrilateral cell is assumed (∆x = ∆y).
Every E field is located half a cell width from the origin in the direction of its orientation;
every H field is offset by half a cell in each direction except that of its orientation.
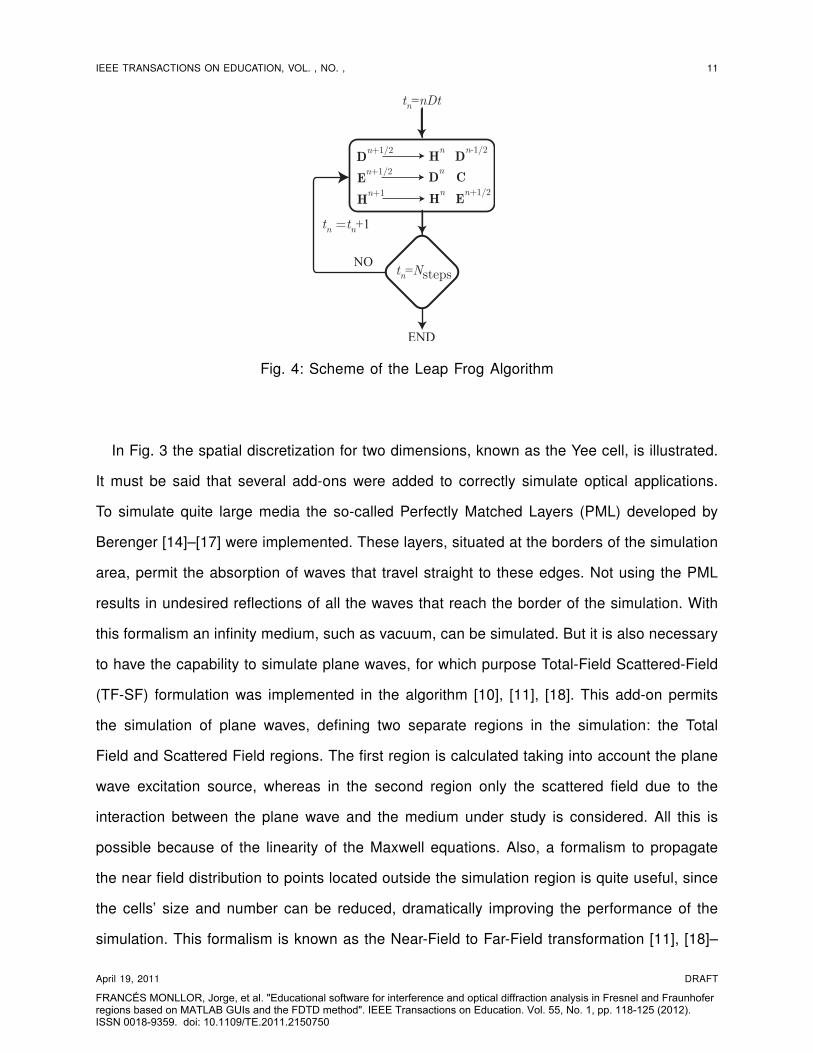
Due to the dependence between the electric and magnetic fields, the previous values of the
electric field are used to calculate the magnetic field and so on. This algorithm is illustrated
in Fig. 4 where the detailed Leap Frog algorithm [10], [13] is summarized.
April 19, 2011 DRAFT
FRANCÉS MONLLOR, Jorge, et al. "Educational software for interference and optical diffraction analysis in Fresnel and Fraunhoferregions based on MATLAB GUIs and the FDTD method". IEEE Transactions on Education. Vol. 55, No. 1, pp. 118-125 (2012). ISSN 0018-9359. doi: 10.1109/TE.2011.2150750
IEEE TRANSACTIONS ON EDUCATION, VOL. , NO. , 11
Fig. 4: Scheme of the Leap Frog Algorithm
In Fig. 3 the spatial discretization for two dimensions, known as the Yee cell, is illustrated.
It must be said that several add-ons were added to correctly simulate optical applications.
To simulate quite large media the so-called Perfectly Matched Layers (PML) developed by
Berenger [14]–[17] were implemented. These layers, situated at the borders of the simulation
area, permit the absorption of waves that travel straight to these edges. Not using the PML
results in undesired reflections of all the waves that reach the border of the simulation. With
this formalism an infinity medium, such as vacuum, can be simulated. But it is also necessary
to have the capability to simulate plane waves, for which purpose Total-Field Scattered-Field
(TF-SF) formulation was implemented in the algorithm [10], [11], [18]. This add-on permits
the simulation of plane waves, defining two separate regions in the simulation: the Total
Field and Scattered Field regions. The first region is calculated taking into account the plane
wave excitation source, whereas in the second region only the scattered field due to the
interaction between the plane wave and the medium under study is considered. All this is
possible because of the linearity of the Maxwell equations. Also, a formalism to propagate
the near field distribution to points located outside the simulation region is quite useful, since
the cells’ size and number can be reduced, dramatically improving the performance of the
simulation. This formalism is known as the Near-Field to Far-Field transformation [11], [18]–
April 19, 2011 DRAFT
FRANCÉS MONLLOR, Jorge, et al. "Educational software for interference and optical diffraction analysis in Fresnel and Fraunhoferregions based on MATLAB GUIs and the FDTD method". IEEE Transactions on Education. Vol. 55, No. 1, pp. 118-125 (2012). ISSN 0018-9359. doi: 10.1109/TE.2011.2150750

IEEE TRANSACTIONS ON EDUCATION, VOL. , NO. , 12
[21].
IV. TOOL DESCRIPTION
The implemented tool is composed of three parts: a Matlab-GUI application, an executable
file that implements the FDTD method, and a set of M-files that evaluate the analytical
expressions detailed above in Table II and Eq. (10) respectively. The FDTD method
implemented is completely transparent for end-users, and is executed when the simulation
is started by the user. This application was implemented in C++; a reader interested in the
implementation and associated issues can find more information in [10], [11], [18]. The layout
of the application is shown in Fig. 5. Its interface displays all the parameters that users can
modify, such as the number of slits, the width and their gap. The position of the screen on
which the diffraction pattern is analyzed can also be defined by the user.
The design of the Matlab-GUI is easy to perform using the MATLAB GUIDE. This toolkit
permits dragging of the bottoms the axes bottoms, and so on. Each button and text field
have a region code that is executed. This function is called callback. With the use of the
command “>> system”, binary files can be executed, and this function permits the use of
input parameters that in here was useful to set the simulation parameters: the number of
slits, width, etc. This and more is explained in the MATLAB-GUI manuals and related papers
[5], [22].
A. Classroom Experience
The tool was created during the 2008-2009 and 2009-2010 academic years at the
University of Alicante in Spain, and has been used in physics and optics courses in various
degrees such as Technical Telecommunication Engineering, Computer Science or Optics and
Optometrics. The first advantage of the tool presented here is that it allows the instructor
to set up simulations with minimal effort, which obviously helps in showing many different
cases, and is also useful for showing the near field pattern, which is usually difficult to analyze
in a laboratory experiment. Until now, the application was used in theoretical lectures as a
April 19, 2011 DRAFT
FRANCÉS MONLLOR, Jorge, et al. "Educational software for interference and optical diffraction analysis in Fresnel and Fraunhoferregions based on MATLAB GUIs and the FDTD method". IEEE Transactions on Education. Vol. 55, No. 1, pp. 118-125 (2012). ISSN 0018-9359. doi: 10.1109/TE.2011.2150750

IEEE TRANSACTIONS ON EDUCATION, VOL. , NO. , 13
Fig. 5: Front-end of the application DifSim.
support to the lecturer teaching wave diffraction and interference subjects. With the advent
of the new degrees, it is planned that this tool should also play an important role in the
laboratory sessions, since handling lasers and detectors in the first years of their degrees is
quite difficult for new students. For that reason, a new structure has been planned for the
laboratory sessions. Since this tool can be used in students’ own time, as a virtual laboratory
in which they can measure diffraction patterns as they would in a real laboratory, they can
save time and the university could save money, since no duplication of expensive equipment
is necessary.
April 19, 2011 DRAFT
FRANCÉS MONLLOR, Jorge, et al. "Educational software for interference and optical diffraction analysis in Fresnel and Fraunhoferregions based on MATLAB GUIs and the FDTD method". IEEE Transactions on Education. Vol. 55, No. 1, pp. 118-125 (2012). ISSN 0018-9359. doi: 10.1109/TE.2011.2150750
IEEE TRANSACTIONS ON EDUCATION, VOL. , NO. , 14
The tool is planned to be used to analyze the diffraction pattern of an array of slits in
different planes parallel to slits placed at arbitrary distance. The student, by means of this
tool, can compare and contrast the diffraction pattern produced by the FDTD simulation with
the analytical values provided by the Fraunhofer and Fresnel approximations. In addition,
students can draw several conclusions from the analysis of the accuracy of the analytical
expressions as a function of the screen distance. The nearer the diffraction pattern plane, the
greater error in the Fraunhofer approximation. On the other hand, the Fresnel approximation
behaves more accurately over a wider range, due to the approximation applied being less
restrictive than that used in the Fraunhofer region. It is important that students can discuss
the classical closed expressions learned in theoretical lectures, since these expressions are
not correctly handled in many cases. This is because the students do not notice that Eq. (9)
and Eq. (4) are obtained from approximations of the integral field expressions (1).
The student can also analyze the numerical method that is used to calculate the Fresnel’s
integrals Eq. (9). This method produces oscillations on the result when |u| or |v| are greater
than 20 or 25 due to the Fresnel’s integrals being quite near their limit values of 1/2 [2].
B. Result and Discussion
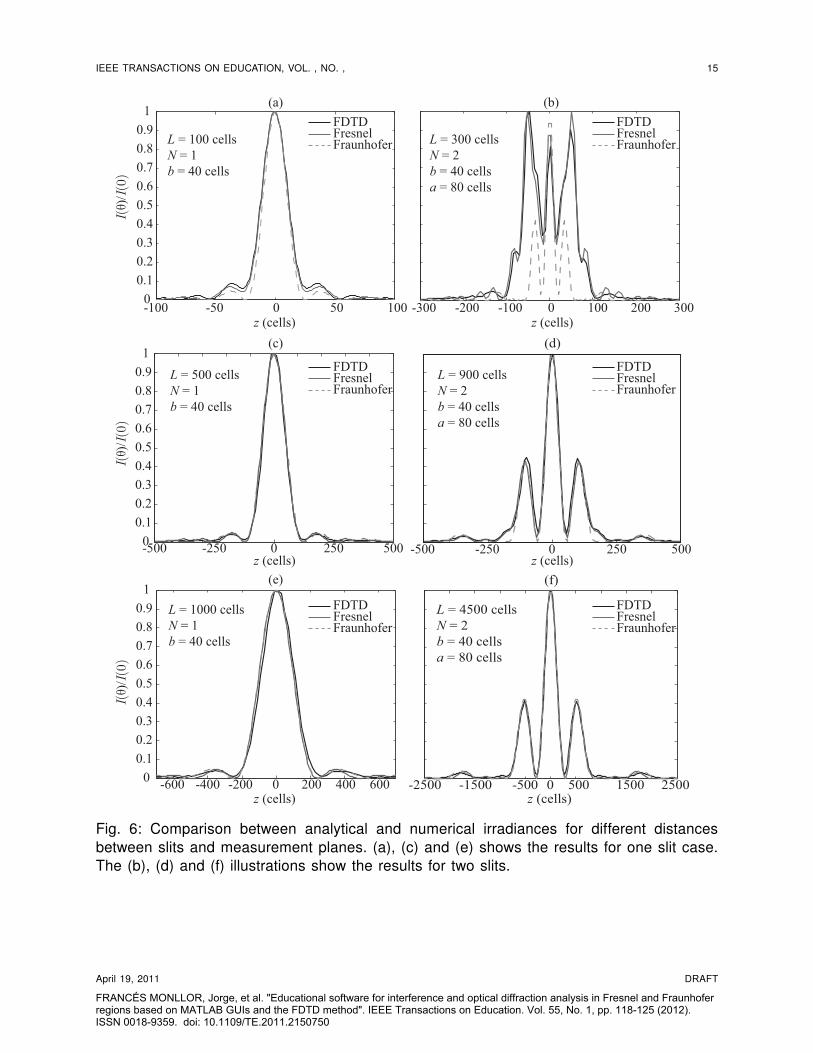
In this section, two examples based on one- and two-slit simulations are shown. The
simulation parameters are defined as follows: λ = 633 nm, spatial resolution λ/10 and ∆t
as 1.06·10−16 s. Firstly, the diffraction pattern for both cases as a function of the distance
between the Γ and Υ planes are shown in Fig. 6. The (a), (c) and (e) curves of this illustration
represent the results for the simulation of one unique slit. The (b), (d) and (f) curves are
the results for the Young’s experiment based on two slits. As can be seen, the Fraunhofer
approximation for the nearest position of the plane Υ (L smaller), is more inaccurate than the
Fresnel. As the distance between planes becomes greater, both approximations are closer
to the numerical FDTD simulation.
In addition, the simulation represents an animation of the irradiance (∝ |E|2) as a
function of time. This visualization is quite useful to students because it permits visualizing
April 19, 2011 DRAFT
FRANCÉS MONLLOR, Jorge, et al. "Educational software for interference and optical diffraction analysis in Fresnel and Fraunhoferregions based on MATLAB GUIs and the FDTD method". IEEE Transactions on Education. Vol. 55, No. 1, pp. 118-125 (2012). ISSN 0018-9359. doi: 10.1109/TE.2011.2150750
IEEE TRANSACTIONS ON EDUCATION, VOL. , NO. , 15
(a)
-500 -250 0 250 5000
0.1
0.2
0.3
0.4
0.5
0.6
0.7
0.8
0.9
1
z (cells)
(c)
-600 -400 -200 0 200 400 6000
0.1
0.2
0.3
0.4
0.5
0.6
0.7
0.8
0.9
1
z (cells)
(e)
L = 500 cells
N = 1
b = 40 cells
L = 1000 cells
N = 1
b = 40 cells
L = 900 cells
N = 2
b = 40 cells
a = 80 cells
-2500 -1500 -500 0 500 1500 2500z (cells)
(f)
L = 4500 cells
N = 2
b = 40 cells
a = 80 cells
-100 -50 0 50 1000
0.1
0.2
0.3
0.4
0.5
0.6
0.7
0.8
0.9
1
z (cells)
I(θ
)/I(0)
L = 100 cells
N = 1
b = 40 cells
-300 -200 -100 0 100 200 300z (cells)
L = 300 cells
N = 2
b = 40 cells
a = 80 cells
FDTDFresnelFraunhofer
FresnelFDTD
Fraunhofer
-500 -250 0 250 500z (cells)
FDTDFresnelFraunhofer
FDTDFresnelFraunhofer
FDTDFresnelFraunhofer
(b)
I(θ
)/I(0)
I(θ
)/I(0)
FDTDFresnelFraunhofer
(d)
Fig. 6: Comparison between analytical and numerical irradiances for different distancesbetween slits and measurement planes. (a), (c) and (e) shows the results for one slit case.The (b), (d) and (f) illustrations show the results for two slits.
April 19, 2011 DRAFT
FRANCÉS MONLLOR, Jorge, et al. "Educational software for interference and optical diffraction analysis in Fresnel and Fraunhoferregions based on MATLAB GUIs and the FDTD method". IEEE Transactions on Education. Vol. 55, No. 1, pp. 118-125 (2012). ISSN 0018-9359. doi: 10.1109/TE.2011.2150750

IEEE TRANSACTIONS ON EDUCATION, VOL. , NO. , 16
(a) (b)
z (
cell
s)z (
cell
s)z (
cell
s)z (
cell
s)
z (
cell
s)z (
cell
s)z (
cell
s)z (
cell
s)
x (cells)
x (cells)
x (cells)
x (cells)
x (cells)
x (cells)
x (cells)
x (cells)
(c) (d)
(e) (f)
(g) (h)
Fig. 7: Simulation sequence. (a) t = 50∆t, (c) t = 150∆t, (e) t = 250∆t, (g) t = 350∆t forone aperture (b=40 cells) and (b) t = 50∆t, (d) t = 150∆t, (f) t = 250∆t, (h) t = 350∆t fortwo apertures (b = 40 cells and a = 80 cells).
the transition between the Fresnel and Fraunhofer patterns. In Fig. 7 a sequence of the
simulations mentioned above (one- and two-slit simulations) is shown. Concretely, the left
April 19, 2011 DRAFT
FRANCÉS MONLLOR, Jorge, et al. "Educational software for interference and optical diffraction analysis in Fresnel and Fraunhoferregions based on MATLAB GUIs and the FDTD method". IEEE Transactions on Education. Vol. 55, No. 1, pp. 118-125 (2012). ISSN 0018-9359. doi: 10.1109/TE.2011.2150750

IEEE TRANSACTIONS ON EDUCATION, VOL. , NO. , 17
column of illustrations (a), (c), (e) and (g) in Fig. 7 are for the simulation of one unique slit
as a function of the time step, and the right column (b), (d), (f) and (h) are the sequence for
the two slit simulation. As can be seen in both simulations, the diffraction pattern up to the
position of the x = 50 cell is dramatically different from the distribution of |E|2 at x = 100
cells approximately, whose diffraction pattern is more similar to the far field pattern.
V. CONCLUSION
In this paper, the development of a MATLAB/C++ application for diffraction and interference
simulation and its use in the classroom have has been described. The tool gives students
the possibility of analyzing many different configurations, which would be expensive and
take too much time in a real laboratory. The virtual laboratory presented here is based
on three different parts that take advantage of various commercial software. Firstly the
GUI is implemented in MATLAB, commonly used by students since their first years of
studies. Secondly, the FDTD simulation was programmed in C++ due to the improvement
in the performance compared with MATLAB processing. And thirdly, the analytical solutions
for Fraunhofer and Fresnel approximations are supplied to students as M-Files, easy to
understand, that they can analyze and modify. The interaction with the tool is straightforward
and is done essentially with text labels and buttons. Finally, extensive use of this tool can give
students an enhanced intuition and help them to gain better understanding of the analytical
expressions learned in the classroom and their range of validity across the Fraunhofer
and Fresnel diffraction regions. Additionally, this tool has been used in theory classes with
successful results. The tool helped students to understand, by means of video animations,
the basic principles of wave interaction in near field region.
It can be concluded that the objectives outlined when this virtual laboratory was created
have been achieved. More applications based on laboratory experiments in optics can be
included in the near future, due to the power and the accuracy of the numerical FDTD method
implemented.
April 19, 2011 DRAFT
FRANCÉS MONLLOR, Jorge, et al. "Educational software for interference and optical diffraction analysis in Fresnel and Fraunhoferregions based on MATLAB GUIs and the FDTD method". IEEE Transactions on Education. Vol. 55, No. 1, pp. 118-125 (2012). ISSN 0018-9359. doi: 10.1109/TE.2011.2150750
IEEE TRANSACTIONS ON EDUCATION, VOL. , NO. , 18
ACKNOWLEDGMENT
This work was supported by the “Ministerio Ciencia e Innovación” of Spain under projects
FIS2008-05856-C02-01 and FIS2008-05856-C02-02, by the “Generalitat Valenciana” of Spain
under project PROMETEO/2011/021 and by the “University of Alicante” under the projects
GRE09-10 and GITE-09006-UA.
REFERENCES
[1] J. W. Goodman, Introduction to Fourier Optics. McGraw-Hill, New York, 1996, pp. 36-38.
[2] E. Hecht, Óptica. Pearson: Addison Wesley, 2003.
[3] MIT, “Meep,” 2006-2009. [Online]. Available: http://ab-initio.mit.edu/wiki/index.php/Meep
[4] Lumerical Incorporates, “FDTD Solutions 7.0,” 2004-2010. [Online]. Available: http://www.lumerical.com/fdtd.php
[5] N. Aliane, “A MATLAB/Simulink-Based Interactive Module for Servo Systems Learning,” IEEE Transactions On
Education, vol. 53, no. 2, pp. 165–271, May 2010.
[6] L. Max, T. Thiringer, T. Undeland, and R. Karlsson, “Power Electronics Design Laboratory Exercise for Final-Year
M.Sc. Students,” IEEE Transactions On Education, vol. 52, no. 4, pp. 524–531, Nov 2009.
[7] A. Nonclercq, V. B. Biest, K. De Cuyper, and L. E., “Problem-Based Learning in Instrumentation: Synergism of Real
and Virtual Modular Acquisition Chains,” IEEE Transactions On Education, vol. 53, no. 2, pp. 234–242, May 2010.
[8] T. Wolf, “Assessing Student Learning in a Virtual Laboratory Enviroment,” IEEE Transactions On Education, vol. 53,
no. 2, pp. 216–222, May 2010.
[9] W.-F. Chen, W.-H. Wu, and T.-J. Su, “Assessing Virtual Laboratories in a Digital-Filter Design Course: An Experimental
Study,” IEEE Transactions On Education, vol. 51, no. 1, pp. 10–16, Feb 2008.
[10] A.Taflove, COMPUTATIONAL ELECTRODYNAMICS: The Finite-Difference Time-Domain Method. MA: Artech House
Publishers, 1995.
[11] D. M. Sullivan, Electromagnetic Simulation using the FDTD Method. IEEE Press Editorial Board, 2000.
[12] S. A. Rueda, F. F. Medina, and J. F. Barrera, “Criterio generalizado para la distinción entre la difracción de fraunhofer
y fresnel,” Revista Colombiana de Física, vol. 41, no. 1, pp. 128–130, Enero 2009.
[13] K. S. Yee, “Numerical solution of initial boundary value problemas involving Maxwell’s equations in isotropic media,”
IEEE Trans. on Antennas and Propagation, vol. AP, no. 17, pp. 585–589, 1966.
[14] J. P. Berenger, “A perfectly matched layer for the absoprption of electromagnetic waves,” J. Comput. Phys, vol. 114,
pp. 185–200, 1994.
[15] ——, “Three-dimensional perfectly matched layer for the absorption of electromagnetic waves,” J. Comput. Phys, vol.
127, pp. 363–379, 1995.
[16] D. M. Sullivan, “A simplified PML for use with the FDTD method,” Microwave and Guided Wave Letters, IEEE, vol. 6,
no. 2, pp. 97–99, Feb 1996.
April 19, 2011 DRAFT
FRANCÉS MONLLOR, Jorge, et al. "Educational software for interference and optical diffraction analysis in Fresnel and Fraunhoferregions based on MATLAB GUIs and the FDTD method". IEEE Transactions on Education. Vol. 55, No. 1, pp. 118-125 (2012). ISSN 0018-9359. doi: 10.1109/TE.2011.2150750

IEEE TRANSACTIONS ON EDUCATION, VOL. , NO. , 19
[17] F. Pérez-Ocón, J. R. J. Cuesta, and A. M. P. Molina, “Exponential discretization of the perfectly matched layer (pml)
absorbing boundary condition simulation in fd-td 3d,” Optik - International Journal for Light and Electron Optics, vol.
113, no. 8, pp. 354 – 360, 2002.
[18] K. S. Kunz and R. J. Luebbers, The Finite Difference Time Domain Method for Electromagnetics. CRC Press, 1993.
[19] R. Luebbers, D. Ryan, and J. Beggs, “A two-dimensional time-domain near-zone to far-zone transformation,” Antennas
and Propagation, IEEE Transactions on, vol. 40, no. 7, pp. 848–851, Jul 1992.
[20] K. Yee, D. Ingham, and K. Shlager, “Time-domain extrapolation to the far field based on fdtd calculations,” Antennas
and Propagation, IEEE Transactions on, vol. 39, no. 3, pp. 410–413, Mar 1991.
[21] S. González García, B. García Olmedo, and R. Gómez Martín, “A time-domain near- to far-field transformation for fdtd
in two dimensions,” Microwave and Optical Technology Letters, vol. 27, no. 6, pp. 427–432, December 2000.
[22] S. Uran and K. Jezernik, “Virtual Laboratory for Creative Control Design Experiments,” IEEE Transactions On
Education, vol. 51, no. 1, pp. 69–75, Feb 2008.
Jorge Francés was born in Alcoy, Spain, in 1982. He received the Bachelor in Telecommunications from the University
of Alicante in 2003 and the Master’s Degree in Telecommunications in 2006 from the Technnical University of Valencia.
At present he is pursuing a Ph. D. degree in Numerical Methods at the University of Alicante. He has been working as a
assistant lecturer at the University of Alicante since 2008. His main research interests include physical optics, sound and
vibration and numerical simulation.
Manuel Pérez-Molina was born in Alicante, Spain, in 1982. He received his Electrical Engineering degree from Universidad
Miguel Hernández, Alicante, in 2005. He obtained the Ph. D. degree in the field of Mathematical Methods in Electromagnetic
Propagation in 2009. His recent research interests include the development of mathematical methods in electromagnetic
and physical optics, specially those dealing with near-field optics and propagation in inhomogeneous media.
April 19, 2011 DRAFT
FRANCÉS MONLLOR, Jorge, et al. "Educational software for interference and optical diffraction analysis in Fresnel and Fraunhoferregions based on MATLAB GUIs and the FDTD method". IEEE Transactions on Education. Vol. 55, No. 1, pp. 118-125 (2012). ISSN 0018-9359. doi: 10.1109/TE.2011.2150750
IEEE TRANSACTIONS ON EDUCATION, VOL. , NO. , 20
Sergio Bleda was born in Elche, Spain, in 1974. He received his Computer Science Engineering degree in 1999 and his
Telecommunications Technical Engineering degree in 2002, both from the University of Alicante. In 2009 he received his
Ph. D. degree from the Technical University of Valencia. Since 2000 he has been involved in education and research at
the University of Alicante. His main research interests include digital audio processing and numerical simulation.
Elena Fernández was born in Alicante, Spain, in 1981. She received her B. Sc. degree in Physics from the University of
Valencia (Spain) in 2004 and her Ph. D. degree in 2008 in the Department of Applied Physics, Systems Engineering and
Signal Theory at the University of Alicante, Spain. Her research interests include photopolymers as holographic recording
materials and LCD as SLM for holographic storage and holographic optical elements. She has published 15 technical papers
in various journals and has presented about 20 papers at conferences and scientific meetings.
Cristian Neipp was born in Salamanca, Spain, in 1971. He received the M.S. degree in Physics from the University of
Salamanca (Spain) in 1996 and the Ph.D. degree in Physics from the University of Alicante (Spain) in 2001. He has taught
Applied Physics for engineering students since 1998. Since 2002, he has been a Permanent Wholetime Lecturer of applied
physics at the University of Alicante. He is mainly interested in holography, holographic recording materials, holographic
optical elements, optical processing, electromagnetic theory of diffraction and volume gratings and physics and engineering
education. In these areas, he has published more than 130 technical papers in various journals and presented more than
100 papers in scientific conferences and congresses.
April 19, 2011 DRAFT
FRANCÉS MONLLOR, Jorge, et al. "Educational software for interference and optical diffraction analysis in Fresnel and Fraunhoferregions based on MATLAB GUIs and the FDTD method". IEEE Transactions on Education. Vol. 55, No. 1, pp. 118-125 (2012). ISSN 0018-9359. doi: 10.1109/TE.2011.2150750

IEEE TRANSACTIONS ON EDUCATION, VOL. , NO. , 21
Augusto Beléndez was born in Albacete, Spain, in 1963. He received the M.S. degree in Physics and the Ph.D. degree
in Physics from the University of Valencia, Spain, in 1986 and 1990, respectively. He has taught Applied Physics for
engineering students since 1986. Since 1996, he has been a Full Professor of Applied Physics at the University of Alicante.
He is mainly interested in holography, holographic recording materials, holographic optical elements, optical processing,
nonlinear oscillations, and physics and engineering education. In these areas, he has published more than 270 technical
papers in various journals and presented more than 200 papers in scientific conferences and congresses. Between 1993
and 2007, he was the Head of the Department of Physics, Systems Engineering and Signal Theory at the University of
Alicante, Spain, and since 2009, he has been the Head of the Research Institute of Physics Applied to Sciences and
Technologies at the same university. He is one of the Members of the Board of Editors of the “International Journal of
Engineering Education” and a Member of the Editorial Board of the “International Journal of Optics” and “Advances in
optical Technologies". He is Member of the European Optical Society, Spanish Optical Society, Spanish Royal Society of
Physics, OSA, and SPIE.
April 19, 2011 DRAFT
FRANCÉS MONLLOR, Jorge, et al. "Educational software for interference and optical diffraction analysis in Fresnel and Fraunhoferregions based on MATLAB GUIs and the FDTD method". IEEE Transactions on Education. Vol. 55, No. 1, pp. 118-125 (2012). ISSN 0018-9359. doi: 10.1109/TE.2011.2150750