ieee transactions on cybernetics 1 automatic feature
TRANSCRIPT
IEEE TRANSACTIONS ON CYBERNETICS 1
Automatic Feature Extraction and ConstructionUsing Genetic Programming for Rotating
Machinery Fault DiagnosisBo Peng, Shuting Wan, Ying Bi, Member, IEEE, Bing Xue, Member, IEEE, and Mengjie Zhang, Fellow, IEEE
Abstract—Feature extraction is an essential process in theintelligent fault diagnosis of rotating machinery. Although ex-isting feature extraction methods can obtain representative fea-tures from the original signal, domain knowledge and expertexperience are often required. In this paper, a novel diagnosisapproach based on evolutionary learning, namely automaticfeature extraction and construction using genetic programming(AFECGP), is proposed to automatically generate informativeand discriminative features from original vibration signals foridentifying different fault types of rotating machinery. To achievethis, a new program structure, a new function set and a newterminal set are developed in AFECGP to allow it to detectimportant subband signals, extract and construct informativefeatures, automatically and simultaneously. More importantly,AFECGP can produce a flexible number of features for classi-fication. Having the generated features, k-Nearest Neighbors isemployed to perform fault diagnosis. The performance of theAFECGP based fault diagnosis approach is evaluated on fourfault diagnosis datasets of varying difficulty and compared withfourteen baseline methods. The results show that the proposedapproach achieves better fault diagnosis accuracy on all thedatasets than the competitive methods and can effectively identifydifferent fault conditions of rolling bearing, gear, and rotor.
Index Terms—Genetic Programming, Feature Extraction, Fea-ture Construction, Fault Diagnosis, Rotating Machinery
I. INTRODUCTION
ROTATING machinery, such as electric motors, turbinegenerators, and aero engines, are the important com-
ponents of modern industry and have been widely used inthe aspects of production and daily life [1]. Because thesemachines often work under unstable loads and extreme op-erating temperatures, the critical parts of which inevitablyhave various faults, such as bearing damage, gear breakage,
This work was supported in part by the National Natural Science Foundationof China under grant 51777075, the Natural Science Foundation of HebeiProvince under grant E2019502064, the Fundamental Research Funds forCentral Universities under grant 2019QN131, the Marsden Fund of NewZealand Government under Contracts VUW1509 and VUW1615, the Sciencefor Technological Innovation Challenge (SfTI) fund under grant E3603/2903,the University Research Fund at Victoria University of Wellington grantnumber 223805/3986, MBIE Data Science SSIF Fund under the contractRTVU1914, and National Natural Science Foundation of China (NSFC)under Grant 61876169. The work of Bo Peng was supported by the JointPostgraduate Training Program of North China Electric Power University.
B. Peng and S. Wan are with Hebei Key Laboratory of Electric Ma-chinery Health Maintenance & Failure Prevention, North China ElectricPower University, Baoding 071000, China (e-mail: [email protected],[email protected]).
Y. Bi, B. Xue and M. Zhang are with the School of Engineer-ing and Computer Science, Victoria University of Wellington, Wellington6140, New Zealand (e-mail: [email protected], [email protected],[email protected]).
and rotor imbalance. Damaged parts can prone to cause themachines to be scrapped, leading to huge economic lossesand even serious accidents [2]. Therefore, fault diagnosis andcondition monitoring of rotating machinery are important forreducing operation and maintenance costs, ensuring productionsafety, and prolonging the life of machines.
A fault diagnosis and condition monitor system generallycontains three steps: data acquisition, feature extraction, andpattern recognition [3]. Because the acquisition of vibrationsignals can be easily achieved by installing speed or accel-eration sensors on the outer surface of a machine, vibrationsignal based diagnostic and monitor methods have gainedmuch attention. Due to the influence of transmission pathand noise, the collected vibration signals are often non-linearand of multi-component, and need to be preprocessed toextract effective features for performing pattern recognition.Decomposing the vibration signals into multiple subband sig-nals can reduce the difficulty of analysis. Wavelet Transformand Wavelet Packet Transform can decompose signals intoa set of wavelet details, but the performance is affected bythe predefined wavelet basis and levels [4]. The recursivedecomposition methods on the basis of the signal waveforms,such as Empirical Mode Decomposition (EMD), IntrinsicTime-scale Decomposition, Local Mean Decomposition, andtheir improved versions [5], [6], [7], [8], [9], [10], havebeen developed and used to decompose signals. But the mostobvious flaw of these methods is prone to modal aliasing.To address this problem, Variational Modal Decomposition[11], [12], Swarm Decomposition [13], [14], and Time VaryingFiltering-Based EMD [15], [16] have been developed andapplied to rotating machinery fault diagnosis. Although thesemethods are effective in decomposing the complex vibrationsignals into simple subband signals, not all the information ofsubband signals is important and useful for fault diagnosis.Therefore, expert experience is often need to verify andmanually tune these signals to find the important ones.
To accurately describe the dynamic characteristics of themachines under different operation states, it is necessary togenerate effective features from the decomposed vibration sig-nals. Time-domain statistic features (i.e., mean value, standarddeviation, skewness, and kurtosis), frequency-domain statisticfeatures (i.e., mean frequency, standard deviation frequency,frequency centre, and root mean square frequency), have beenused to represent vibration signals and achieved promisingresults in fault diagnosis of bearing and rotor [17], [18]. Be-cause the characteristics of the mechanical equipment changes

IEEE TRANSACTIONS ON CYBERNETICS 2
with the occurrence of faults, the entropy index can be usedto detect the dynamic changes. Fuzzy Entropy (FE), SampleEntropy (SE), Permutation Entropy (PE), Symbolic DynamicEntropy (SDE), and Dispersion Entropy (DE), have beenadopted to characterize vibration signal for fault diagnosis[19], [20], [21], [22], [23]. These entropy indexes estimatethe complexity or irregularity of the vibration signals usinga single scale. Multi-scale analysis has been introduced andmulti-scale entropy based methods (i.e., multi-scale SE, multi-scale FE, multi-scale PE, multi-scale SDE, and multi-scaleDE [24], [25], [26], [23], [27]) have been proposed to extractmulti-scale features from the vibration signals. Because thereis typically information redundancy between multiple features,feature selection techniques, such as Laplacian score, ReliefFand Max-relevance and Min-redundancy, have been introducedto reduce the number of features to ensure that diagnosticperformance is not significantly affected by redundant infor-mation [17], [18], [27], [28]. The extracted or selected featuresare fed into a classification algorithm to train a classifier forclassification. Machine learning classification algorithms, suchas k-Nearest Neighbours (KNN), Support Vector Machine(SVM), Multilayer Perception (MLP), Decision Tree (DT),and Logistic Regression (LR), have been applied to faultdiagnosis of rotating machinery [17], [18], [29], [30], [31].Besides, Deep Neural Networks (DNNs) based methods havealso been developed to fault diagnosis tasks [32], [33], [34].
Although many methods have been developed for faultdiagnosis of rotating machinery, they still have drawbacks.These drawbacks are summarized as follows.
1) Most existing fault diagnosis methods need multiple in-dependent steps, such as signal preprocessing, feature ex-traction and feature selection, to generate effective featuresfor fault diagnosis. The results of the previous step oftensignificantly affect the results of the later step. For example,if the extracted features are not effective for a task, featureselection may not be helpful as well.
2) Most existing fault diagnosis methods have poor adaptabil-ity and robustness [1], which may only be effective for acertain fault diagnose task.
3) The DNN based fault diagnosis methods have poor inter-pretability and often require a large number of traininginstances. However, in many application of rotational ma-chinery, it is very difficult to obtain a large number oftraining instances.
4) Rich domain knowledge are often required in the processof fault diagnose, such as the determination of usefulsubband signals, the selection of informative features andthe determination of the number of features.
Genetic Programming (GP) is an evolutionary algorithm,which can automatically evolve computer programs for dealingwith tasks without human intervention and domain knowledge[35]. GP can evolve tree-based solutions with variable lengthsand the solutions often provide high interpretability. The solu-tions evolved by GP are often creative and even not consideredby human experts. GP has been successfully applied to manytasks, including symbolic regression, job shop scheduling andimage analysis, and achieved promising results [36], [37], [38],
[28], [39], [40]. Many successful applications show that GPhas a great potential to simultaneously perform informationdetection, feature extraction, feature selection and featureconstruction for classification [41], [42], [43]. Although GPhas been applied to various fields, very few work apply GPfor fault diagnosis [44], [45]. To the best of our knowledge,GP has not been applied to automatically and simultaneouslydetect useful subband signals from the original signals, extractfeatures from the detected subband signals and construct high-level features for effective fault diagnosis.
The overall goal of this paper is to develop a new intel-ligent fault diagnosis approach based on GP for automaticfeature extraction and construction in identifying differentfault types of rotating machinery. To achieve this, a newprogram structure/architecture, a new function set and anew terminal set are developed for AFECGP to generateinformative and discriminative features from raw signals byautomatically evolving solutions with multiple transformationfunctions, i.e., decomposition, rescaling, feature extraction,feature construction, and feature combination functions. TheAFECGP approach can generate variable numbers of fea-tures for classification for different fault diagnosis tasks. Theperformance of AFECGP will be examined on four faultdiagnosis tasks/problems of varying difficulty and comparedwith fourteen benchmark methods.
The main contributions of this paper are summarized in thefollowing four aspects.1) A new rotating machinery intelligent fault diagnosis ap-
proach based on GP, i.e., AFECGP, is proposed. Thisapproach can automatically and simultaneously extractand construct informative discriminative features from thevibration signals under different running states. AFECGPcan evolve (nearly) optimal solutions not considered bydomain experts. The learning process of AFECGP doesnot need extra domain expertise or human intervention.
2) A new program architecture is designed based on a tree-based representation that contains seven function layers,i.e., an input layer, a decomposition layer, a rescaling layer,a feature extraction layer, a feature construction layer, afeature combination layer, and an output layer. Based onthis, AFECGP can adaptively achieve the detection of use-ful subband signals, features extraction and construction,and determination of the number of features.
3) Extensive experiments are conducted to show the effective-ness of the proposed AFECGP approach in comparisonswith fourteen baseline methods for fault diagnosis. Com-pared with the methods using manually extracted featuresand the other GP based methods, the AFECGP approachcan achieve better performance on all the four differentdiagnosis datasets of varying difficulty. The results alsoshow that the AFECGP approach has high flexibility andadaptability to different fault tasks/problems in diagnosisof rotating machinery.
4) Further analysis is conducted to deeply understand theproposed AFECGP approach. The solutions evolved byAFECGP can be easily visualized to provide insights onwhich part of the input signal is representative, whichfeatures are extracted and used to construct high-level

IEEE TRANSACTIONS ON CYBERNETICS 3
features, and how many features are needed to representthe input signals. In addition, the constructed high-levelfeatures are also visualized to show why AFECGP canachieve better performance.
II. RELATED WORK
A. Genetic Programming (GP)
GP is an evolutionary learning algorithm, which inheritsthe basic idea of Darwin’s theory of natural evolution, that is,breeding offspring by selecting good individuals from theirparents [35]. An individual of GP is typically a computerprogram expressed using a tree structure, which is a variable-length encoding scheme. A GP tree is composed of internalnodes and leaf nodes. The internal nodes are functions oroperators selected from the function set and the leaf nodes arearguments/features and constants selected from the terminalset. Fig. 1 shows an example program of GP, which representsa mathematic expression (y−2×x)+(x+6). In this program, theinternal nodes, such as +, − and ×, belong to the function set,and the leaf nodes, such as arguments x and y and constants2 and 6, belong to the terminal set.
+
-
y
+
6x×
x2
Fig. 1. An example tree of GP.
GP can automatically evolve trees/solutions to deal with atask. The overall process of GP starts with randomly initial-izing a population of computer programs in the search space.Each individual (program) in the population is evaluated bya fitness function and assigned with a fitness value. Duringthe evolutionary process, a new population of individualsis generated through the Elitism, Crossover, and Mutationoperations, at each generation. The Elitism operation copiesthe best individuals from the current generation to the nextgeneration. Based on the Selection operation, the individualswith better fitness values have a higher chance to be chosenfor the Crossover and Mutation operations. The Crossoverand Mutation operations are illustrated in Fig. 2 and Fig. 3,respectively. As it can be seen from Fig. 2, in the Crossoveroperation, the subtrees (marked by red color) of parent 1 andparent 2 are exchanged to generate offspring 1 and offspring2. As it can be seen from Fig. 3, the Mutation operation isthat randomly selecting a mutation node, the original subtree(marked by red color) at this node is deleted and a new subtree(marked by yellow color) is grown from this node. The processof fitness evaluation is executed on all the individuals ofeach generation. The overall evolutionary process is terminatedwhen a termination criterion is satisfied. After the evolutionaryprocess, the optimal/best individual is obtained and returned.
GP contains two types of program structure, includingLoosely Typed GP (LTGP) and Strongly Typed GP (STGP)[46]. The input and output types of LTGP tree nodes are thesame, which do not need to be specified. In contrast, the inputand output types of STGP tree nodes are typically differentand need to be specified. In STGP, if the output type of a
÷
+
1
-
y2-
6x
×
+
y 3
y
×
+
y
÷
yx3
÷
+
1
-
2-
6x
÷
yx
Parent 2 Offspring 2
Parent 1 Offspring 1
Fig. 2. Crossover operation.
Parent Offspring
+
×
x
÷
6 2
yx
3
+
×
x
-
6 4 y
Fig. 3. Mutation operation.
subtree and the input type of its parent node are incompatible,the trees with such a connection are not allowed.
B. GP for Feature Extraction and Construction
In recent years, feature extraction methods based on GPhave been successfully proposed and applied to different tasks,such as image classification [36]. Benefiting from the flexiblerepresentation of GP, many image-related operators, such asthe convolution operator, histogram of orientated gradient, themean filter, the Gaussian filter, the Gabor filter, and the Sobelfilter, have been integrated into the GP programs as functionsto extract/learn informative features from raw images [43],[47]. Atkins et al. [48] proposed a three-tier GP method, wherethe mean, max, min, median, and standard deviation of imagepixel values are extracted as features for image classification.Al-Sahaf et al. [49] proposed a two-tier GP method to extractfeatures from the image region of line, square, rectangle, orcircle shape. Bi et al. [50] proposed a multi-layer GP methodfor binary image classification. This method can performregion detection, feature extraction, feature construction andimage classification, simultaneously. Bi et al. [43] proposed aGP method by selecting and combining five image descriptorsto extract global/local features for image classification. To thebest of our knowledge, very few work has been reported on GPbased feature extraction methods for fault diagnosis of rotatingmachinery. Guo et al. [44] and Xuan et al. [45] applied GPbased feature extraction methods to fault diagnosis of rollingbearing and gear, where the high order of moments and thefrequency features of raw vibration signals are manfully ex-tracted. However, neither of them have considered the featuresof certain frequency bands of signals, which are typicallymore effective for fault diagnosis than the features of full-band signals.
The feature space transformation is useful for improvingthe performance of a classification algorithm [51]. Featureconstruction is one type of feature transformation, which canmap the original features into another space for representation[52]. In [44], [45], [53], one high-level feature was constructed

IEEE TRANSACTIONS ON CYBERNETICS 4
by GP using the original features and the experimental resultsshowed that the constructed feature can improve the classi-fication accuracy. In [54], [55], [56], GP was employed toconstruct multiple features and the results showed that theconstructed features achieve better classification performancethan the methods using the original features and the singleconstructed feature. However, when constructing multiple fea-tures, it is necessary to set the number of constructed features,which requires domain knowledge.
Motivated by the above limitations, this study developsa new GP based approach to automatically extracting andconstructing a flexible number of features for fault diagnosisof rotating machinery. The new approach will be described inthe next section.
III. PROPOSED APPROACH
In this section, a new GP based approach, i.e., AFECGP,is proposed to automatically and simultaneously extract andconstruct features from raw signals for identifying differentfault types of rotating machinery. The proposed AFECGPapproach, i.e., the new program structure, the new functionset, the new terminal set, and fitness evaluation, are introducedin detail. The detailed process of the AFECGP based faultdiagnosis approach is presented.
A. Algorithm Overview
The overall algorithm of AFECGP is described inAlgorithm 1. The input of AFECGP is the training set, havingthe raw signals X signal and the class labels X label.The output of AFECGP is the best program/individual, i.e.,Best tree. Pg represents the population of the gth generation.g starts from 0 and increases by 1 with the generation.The AFECGP algorithm begins with randomly generating theinitial population P0 according to the program structure, thefunction set and the terminal set. Each individual i of the pop-ulation is evaluated using a fitness function and assigned witha fitness value. At each generation, the best individuals Qg
are selected from Pg through the Elitism operation and copiedto the next generation. Based on the Selection operation, theindividuals Sg with better fitness values in Pg are chosen asparents for breeding offspring. The offspring Og are obtainedby performing the Crossover and Mutation operations. Qg andOg are combined to form the new population of the nextgenerations. The new population Pg will be evaluated andevolved again. The best solution is updated at each generation.When g is equal to the maximal number of generations Ngen,the evolutionary process stops and the best solution Best treeis returned as the output of AFECGP.
B. Program Structure
To achieve simultaneous feature extraction and constructionin a single GP program, a new program structure is developedbased on STGP for handling multiple data types. The left partof Fig. 4 shows the new program structure and an exampleprogram that can be evolved by the AFECGP approach. Thenee program structure has the input, decomposition, rescaling,
Algorithm 1: Algorithm framework of AFECGPInput: The training set: X signal and X labelOutput: The best individual: Best tree
1 begin2 g ← 0;3 P0 ← Randomly generate the initial population;4 for Each i in P0 do5 fi ← Calculate the fitnees value of i;6 end7 Update Best tree according to P0;8 while g < Ngen do9 Qg ← Copy the best individuals from Pg by Elitism;
10 Sg ← Select individuals from Pg as parents for breedingoffspring by Selection;
11 Og ← Generate offspring from Sg by Crossover andMutation;
12 P′g ← Qg + Og ;
13 g ← g + 1;14 Pg ← P
′g ;
15 for Each i in Pg do16 fi ← Calculate fitnees value of i;17 end18 Update Best tree according to Pg ;19 end20 end21 Return Best tree.
X_train
HEF
Relu
Std
+
X_train
HBF
Abs
Min
X_train
LPF
Cube
Std
Fcom2
X_train
HPF
Max
FcomM
Output
Feature combination
Feature construction
Feature extraction
Rescaling
Filtering
Input feu f
plfpu
fh
fel
fl
Output
Fig. 4. The program structure of AFECGP and an example program that canbe evolved by AFECGP.
feature extraction, feature construction, feature combination,and output layers. These layers are connected in the bottom-up manner. Except for the input and output layers, the otherlayers have many specific functions for different purposes. Theinput layer takes raw signals as inputs. The decompositionlayer contains filter functions, which operate on the rawsignal to reduce noise interference and obtain useful subbandsignals. The rescaling layer is to change the ranges of thesubband signal amplitude and enhance the data characteristicsby using transformation functions. The feature extraction layeris to extract statistical features from the subband signals.The feature construction layer is to construct the extractedfeatures into high-level features. The feature combinationlayer is to generate a feature vector, which contains multiplefeatures and can describe the input signal comprehensively.The output layer returns the generated features as outputs forfault diagnosis.
C. Function Set
The new function set of AFECGP has decomposition func-tions, rescaling functions, feature extraction functions, andfeature combination functions for the corresponding layer.Table I summarizes the functions of each layer and theirinputs, outputs and descriptions.

IEEE TRANSACTIONS ON CYBERNETICS 5
TABLE IFUNCTION SET
Function Input Output DescriptionHPF 1 signal, fh 1 signal Perform high pass filtering to signalLPF 1 signal, fl 1 signal Perform low pass filtering to signal
BPF 1 signalfpu, fpl
1 signal Perform band pass filtering to signal
BEF 1 signalfeu, fel
1 signal Perform band stop filtering to signal
Abs 1 signal 1 signal Return abs(x) for each x in the signal
ReLu 1 signal 1 signal Return max(0, x) for each x in the sig-nal
Sqrt 1 signal 1 signal Return√x for each x in the signal.
Return 0 if x < 0.Square 1 signal 1 signal Return x2 for each x in the signalCube 1 signal 1 signal Return x3 for each x in the signalMin 1 signal 1 feature Calculate minimum of the signalMax 1 signal 1 feature Calculate maximum of the signalStd 1 signal 1 feature Calculate standard deviation of the signalMean 1 signal 1 feature Calculate average value of the signalKthM 1 signal 1 feature Calculate kth-oder moment to signal+ 2 features 1 feature Add two features− 2 features 1 feature Subtract two features× 2 features 1 feature Multiply two features
÷ 2 features 1 feature Divide two features. Return 0 if the divi-sor is 0.
Fcom2 2 features 1 vector Concatenate two features into a vector
FcomM 2 vectors or1 vector/feature
1 vector Concatenate two vectors or a vector anda feature into a vector
1) Decomposition Functions: Four functions, i.e., High-Pass Filter (HPF ), Low-Pass Filter (HLF ), Band-Pass Filter(BPF ), and Band-Elimination Filter (BEF ) [57], are used inthe decomposition layer. The inputs of these functions are theraw signals and the function parameters. These filter functionscan be used to split the original signal into the subband signalsand reduce the noise in the original signal. These filteringfunctions are implemented based on the Butterworth filter[58]. The HPF function has the parameters of the high-passcutoff frequency fh. The HLF function has the parametersof the low-pass cutoff frequency fl. The BPF function hasthe parameter of the lower and the upper cutoff frequencies(fpl and fpu) of the passband. The BEF function has theparameter of the lower and the upper cutoff frequencies (feland feu) of the stopband. These parameters (i.e., fh, fl, fpu,fpl, feu and fel) are designed as the terminals of AFECGP, andtheir optimal values can be automatically learned/determinedduring the evolutionary process.
2) Rescaling Functions: The rescaling layer contains theAbs, ReLu, Sqrt, Square, and Cube functions that canchange the value range of the input signal. The Sqrt functionis protected by returning 1 if the signal value is negative. Theinput of each rescaling function is the decomposed signal.
3) Feature Extraction Functions: The Max, Min, Std,Mean, and NthM functions are used to calculate the sta-tistical features of the signal at the feature extraction layerof AFECGP. The inputs of these functions may be the signalprocessed by the decomposition functions, or the signal pro-cessed by both decomposition and rescaling functions. Thisdesign allows AFECGP to produce effective features that candescribe the signal comprehensively. The output of the Max,
TABLE IITERMINAL SET
Terminal Type DescriptionSignal Array Raw signal with a length of M
n Integer Order parameter of the NthM function. It is in therange of n ∈ [2, 4]
fl, fh IntegerCutoff frequency of HPF and LPF . Its value is in therange of [0, f
′s] with a step of floor(f
′s/100)
fpl, fpu IntegerUpper and lower frequency of BPF . Its value is in therange of [0, f
′s] with a step of floor(f
′s/100). If fpl
>fpu, swap fpl and fpu
fel, feu IntegerUpper and lower frequency of BEF . Its value is in therange of [0, f
′s] with a step of floor(f
′s/100). If fel
>feu, swap fel and feu
Min, Std, Mean, and KthM functions, is the maximum,minimum, standard deviation, average and kth-order moment(i.e., m(k)
x = 1N
∑Ni=1 x
ki ) [44] of the signal, respectively. These
features may be used directly to describe the signal or furtherconstructed to generate high-level features for fault diagnosis.
4) Feature Construction Functions: The +, −, ×, and÷ functions are used to construct high-level features at thefeature construction layer. The functions are the commonlyused functions in GP for feature construction [55]. The inputsof these functions may be the features obtained from thefeature extraction layer or the constructed features obtainedfrom the feature construction layer. That is, the constructedfeatures can be used to construct various levels of features.This design allows AFECGP to construct complex high-levelfeatures that are effective for addressing the task.
5) Feature Combination Functions: The Fcom2 andFcomM functions are used to combine the extracted orconstructed features into a feature vector at the feature com-bination layer. The Fcom2 function has two child nodes,which can be the feature extraction functions or the featureconstruction functions. The FcomM function also has twochild nodes, which can be the feature extraction functions, thefeature construction functions or the Fcom2 function. If onesingle feature can accurately describe the signal, these twofeature combination functions will not be used in a GP tree.With this design, the outputs of a feature construction layermay be one single feature or a vector of multiple features.This design allows AFECGP to produce a dynamic number offeatures for fault diagnosis.
D. Terminal Set
In AFECGP, eight terminals are employed in the terminalset as listed in Table II. The Signal terminal represents theinput raw signal, which is a 1-D array with a length of m. Then terminal represents the order of the KthM function, whichis an integer in the range of [2, 4]. The 1st-order moment isequal to Mean. The fh, fl, fpu, fpl, feu, and fel terminalsrepresent the parameters of the HPF , LPF , BPF , and BEFfilter functions, respectively. They are integers in the range of[0, f
′
s] with a step of floor(f′
s/100). fs is the sample frequencydetermined by different fault datasets. f
′
s represents the halfof fs, i.e., f
′
s = fs/2. The values of these terminals exceptfor Signal are automatically selected/determined from theirranges during the evolutionary process.

IEEE TRANSACTIONS ON CYBERNETICS 6
E. Fitness Evaluation
The fitness value of a program/individual is obtained fromthe fitness evaluation process, indicating the performance ofeach evolved individual. In the fitness evaluation process,KNN is employed to evaluate the classification/diagnosisperformance of the features generated by AFECGP. KNNis a simple classification algorithm and easy to implement,which has been widely used [59], [60]. Compared with otherclassification algorithms, such as SVM, MLP, DT, and LR,KNN treats each feature equally without any feature weightingor selection. With the use of KNN, the proposed GP approachcan automatically extract and construct important features, andavoid redundant or irrelevant features.
The evaluation process starts with using the individuals ofAFECGP to transform each signal in the training set intofeatures. To ensure the classification performance of KNN isnot affected by singular values or feature bias, the min-maxnormalization method is used to transform the values of thesefeatures into the range of [0, 1]. In addition, the stratified 5-fold cross-validation method is employed for improving thegeneralization ability of the features constructed by AFECGP.That is, these normalized features and their labels are split intofive folds with a (nearly) equal size. Then one fold is usedas the test set and the remaining four folds are used as thetraining set. KNN is fed using the training set and evaluatedusing the test set. This process repeats five times until all thefive folds are used as the test set exactly once. The averagetest classification results of the five folds is used as the fitnessvalue of the individual of AFECGP.
F. Overall AFECGP Based Fault Diagnosis Approach
In order to accurately identify different fault types ofrotating machinery, a novel fault diagnosis approach basedon AFECGP is proposed to automatically and simultaneouslyextract and construct high-level features from the originalvibration signals for fault classification. Fig. 5 shows theflowchart of the AFECGP based fault diagnosis approach,which has three steps as follows.1) Signal collection and dataset formulation. The vibration
signals of different running states are collected from therotating machines. Randomly selecting a part of vibrationsignals to form the training set, and the remaining signalsare used as the test set.
2) AFECGP based feature extraction and construction. Thesignal features are extracted and constructed from the orig-inal signals using AFECGP. In AFECGP, each individualcan produce a flexible number of constructed features forfault diagnosis. The AFECGP approach searches for thebest individual that can achieve the best performance onthe training set using a population of individuals via anevolutionary process. The evolutionary process includesthe processes of fitness evaluation and population genera-tions using genetic operators, which have been introducedin previous subsections. The overall evolutionary processstops when the termination criterion (i.e., reaching themaximal number of generations) is satisfied. When theevolutionary process is terminated, the best individual is
Signal collection
0 1500 3000-0.2
0
0.2
0 1500 3000-0.4
0
0.40 1500 3000-0.4
0
0.4
Rotating machine Form instance
0 1500 3000-0.2
0
0.2
0 1500 3000-0.4
0
0.40 1500 3000
-0.4
0
0.4
Instance1 Instance2 · · · Instance n
Crossover ElitismMutation
Generate new population using GP operators
Training set Test set
Fitness function
KNN
Terminate
KNN classifer
Best individual
Training set and test set with the transformed features by AFECGP
Fault diagnosis
State 1
State 2
State 3
: Predict : Desire
No
Yes
Step1: Signal collection and dataset formulation
Step3: Rotating machinery fault diagnosis
Initial population
Step2: AFECGP based feature extraction and contruction
Fig. 5. Flowchart of the AFECGP based rotating machine fault diagnosis.
returned. The vibration signals of the training and testssets are transformed into features using the best individualfound by AFECGP.
3) Rotating machinery fault diagnosis. These features ex-tracted and constructed by AFECGP are normalized intothe range of [0, 1]. The training set with the transformedfeatures and the corresponding class labels (running states)are fed into KNN as the training set and the class label ofeach instance in the test set can be predicted by finding thenearest neighbors via KNN.
IV. EXPERIMENT DESIGN
In this section, the proposed AFECGP approach is examinedon four rotating machinery datasets, i.e., two bearing faultdatasets, one gearing fault dataset and one rotor fault dataset.To show the effectiveness of AFECGP, fourteen baselinemethods are used for comparisons. The detailed experimentdesign, i.e., fault datasets, baseline methods and parametersettings, are presented in this section.
A. Fault Datasets
CWRU is a rolling bearing fault dataset collected by CaseWestern Reserve University (CWRU) [61]. The CWRU datasethas been widely used to validate the effectiveness of thediagnosis methods. Vibration signals are collected by theaccelerometers placed at the motor drive end of test rig underfour different load conditions: i.e., 0, 1, 2, and 3 HP. Fourkinds of healthy bearings, i.e., Normal (NOR), Inner RingFault (IRF), Outer Ring Fault (ORF), and Rolling Element

IEEE TRANSACTIONS ON CYBERNETICS 7
Fault (REF), are used in the experiments. Each fault typecontains three different fault levels, i.e., 0.007, 0.014 and 0.021inches, respectively. Ten health states (i.e., NOR, IRF withthree different levels of severity, ORF with three different levelsof severity, and REF with three different levels of severity) ofvibration signals under each load are collected with a samplingfrequency of 12,000 Hz. In this paper, the same fault typeunder different load conditions is treated as one class. Thatis, the fault diagnosis of CWRU is a classification task of tenclasses.
DIRG is another rolling bearing fault dataset collected byPolitecnico di Torino [62]. It contains vibration signals inseven running conditions, i.e., normal, inner ring fault withthree different levels of severity, and rolling element fault withthree different levels of severity. These signals are collectedwith a sampling frequency of 51,200 Hz. Therefore, the faultdiagnosis of DIRG is a classification task of seven classes.
CWRU and DIRG only contain the vibration signals underdifferent running conditions, which need to be divided intoa number of instances to form the training and test sets forconducting the experiments. For CWRU, the first 102,400 datapoints of vibration signals under each class are divided into50 instances on average and there is no overlap between eachinstance [18]. The vibration signals of four different loadsunder each class are divided into instances (i.e., each classcontains 200 (4×50) instances). That is, the CWRU datasetcontains 2,000 (10×200) instances, where each instance isa vibration signal containing 2,048 data points. For DIRG,the first 51,200 data points of vibration signals under eachclass are divided into 50 instances on average and there isno overlap between each instance either. That is, the WHUdataset contains 350 (7×50) instances, where each instance isa vibration signal containing 1,024 data points.
UCOON [63] is a gear fault dataset collected by Universityof Connecticut (UCONN). It has nine types of gear vibrationsignals in different health states, i.e., normal, missing tooth,root crack, spalling, and chipping tip with five different levelsof severity. These signals are collected by an accelerometerwith a sampling frequency of 20,000 Hz. UCOON is a faultdiagnosis task of nine classes. Unlike the CWRU dataset,UCOON has 104 instances (i.e., a vibration signal contains3,600 data points) under each running condition. That is, theUCOON dataset contains 936 (9×10⁴) instances.
WHU [64] is a rotor fault dataset collected by Wuhan Uni-versity (WHU). This dataset has four types of rotor vibrationsignals in different health states, i.e., normal, contact-rubbing,unbalance, and misalignment. These signals are collected byan accelerometer with a sampling frequency of 2,048 Hz.The fault diagnosis of WHU is a classification task of fourclasses. Each class contains 45 instances (i.e., a vibrationsignal contains 2,048 data points). That is, the WHU datasetcontains 180 (4×45) instances.
For the CWRU, DIRG and UCOON datasets, 50% instancesof each class are randomly selected to form the training setand the remaining instances are used as the test set. For theWHU dataset, 23 instances of each class are randomly selectedto form the training set and the remaining instances are usedto form the test set. Table III lists the detailed information of
TABLE IIIDATASET DESCRIPTION
NameInstancelength
Number ofclasses
Number oftraining instances
Number oftest instances
CWRU 2,048 10 1,000 (10×100) 1,000 (10×100)DIRG 1,024 7 175 (7×25) 175 (7×25)UCOON 3,600 9 468 (9×52) 468 (9×52)WHU 2,048 4 92 (4×23) 88 (4×22)
these four fault datasets, i.e., the number of fault types/classes,the length of the instance, the numbers of instances in thetraining and test sets.
B. Baseline Methods
To show the effectiveness of the AFECGP based faultdiagnosis approach, 14 different methods are used for compar-isons. These methods can be divided into three categories. Thefirst category are five classical classification algorithms usingRaw Signal Amplitude (RSA), i.e., RSA+KNN, RSA+SVM,RSA+LR, RSA+CART, and RSA+MLP. These classificationalgorithms take the amplitude values of the raw signals asinputs to train classifiers for classification. The purpose ofcomparisons is to investigate whether the features extractedand constructed by AFECGP from raw signals are moreeffective than RSA for fault diagnosis.
The second category includes five methods using differ-ent manually extracted/designed features for fault classifica-tion. These features are Time-Domain Features (TDF) [17],Frequency-Domain Features (FDF) [17], Multi-Domain Fea-tures (MDF) [18], Modified Multi-scale Symbolic DynamicEntropy (MMSDE) [23], and Improved Multi-scale DispersionEntropy (IMDE) [27]. The feature numbers of TDF, FDF,MDF, MMSDE, and IMDE are 12, 4, 37, 20, and 20, re-spectively. These methods use KNN to perform classification,which is the same as AFECGP. The purpose is to investigatewhether the features extracted and constructed by AFECGPcan beat these manually extracted/designed features on faultdiagnosis.
The third category are four GP based feature constructionmethods (i.e., GP-SF, GP-MF, GP-OSF, and GP-OMF) forfault classification. In these methods, KNN is used for classifi-cation, which keeps the same as AFECGP. The GP-SF methodconstructs one high-level feature for classification. The GP-MFmethod constructs multiple high-level features for classifica-tion. The number of constructed features is set as the numberof classes, according to [56]. The GP-OSF method constructsone high-level feature but uses the constructed feature andthe original features together for classification. The GP-OMFmethod constructs multiple features (the feature number is thesame as the class number [56]) but uses the constructed fea-tures and the original features together for classification. Thesefour GP based methods use the commonly used functions forfeature construction, i.e., +, −, ×, and protected ÷ (return 0 ifthe divisor is 0). In these methods, the terminal set include theTDF features and random constant. The reason for using TDFfeatures as the terminal set is AFECGP only extracts featuresfrom the signal in time-domain. KNN is employed for fitnessevaluation. For fair comparisons, these methods use the same
IEEE TRANSACTIONS ON CYBERNETICS 8
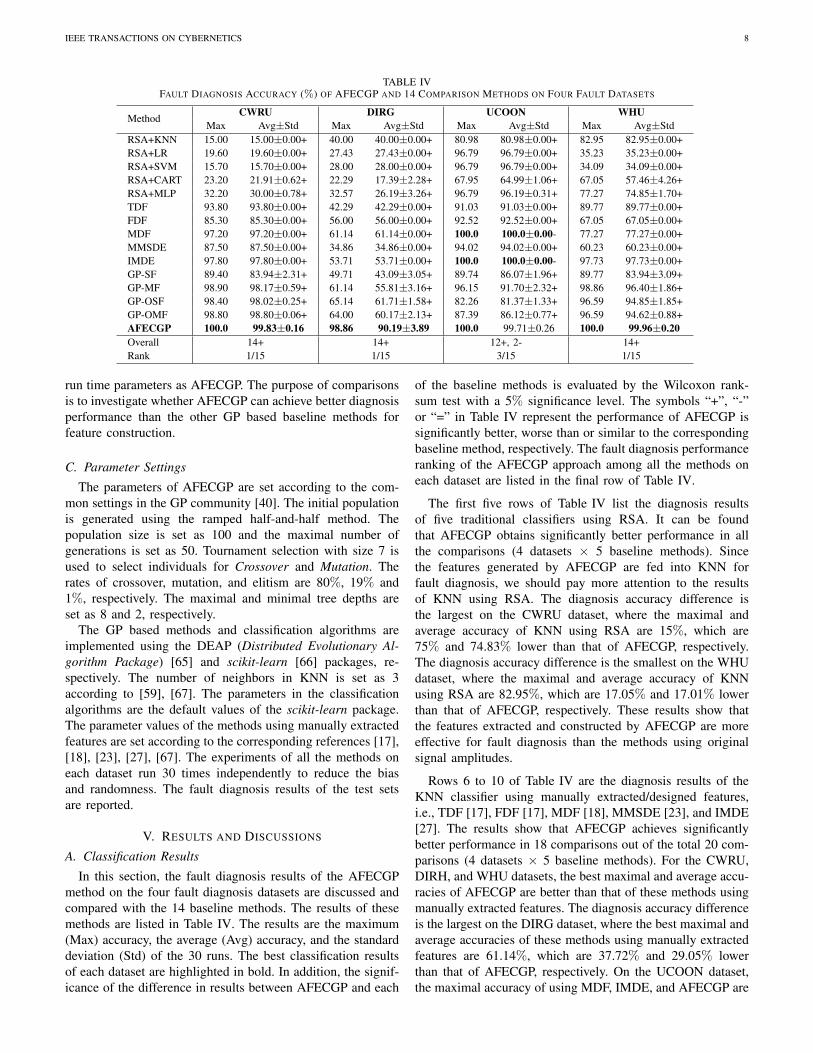
TABLE IVFAULT DIAGNOSIS ACCURACY (%) OF AFECGP AND 14 COMPARISON METHODS ON FOUR FAULT DATASETS
MethodCWRU DIRG UCOON WHU
Max Avg±Std Max Avg±Std Max Avg±Std Max Avg±StdRSA+KNN 15.00 15.00±0.00+ 40.00 40.00±0.00+ 80.98 80.98±0.00+ 82.95 82.95±0.00+RSA+LR 19.60 19.60±0.00+ 27.43 27.43±0.00+ 96.79 96.79±0.00+ 35.23 35.23±0.00+RSA+SVM 15.70 15.70±0.00+ 28.00 28.00±0.00+ 96.79 96.79±0.00+ 34.09 34.09±0.00+RSA+CART 23.20 21.91±0.62+ 22.29 17.39±2.28+ 67.95 64.99±1.06+ 67.05 57.46±4.26+RSA+MLP 32.20 30.00±0.78+ 32.57 26.19±3.26+ 96.79 96.19±0.31+ 77.27 74.85±1.70+TDF 93.80 93.80±0.00+ 42.29 42.29±0.00+ 91.03 91.03±0.00+ 89.77 89.77±0.00+FDF 85.30 85.30±0.00+ 56.00 56.00±0.00+ 92.52 92.52±0.00+ 67.05 67.05±0.00+MDF 97.20 97.20±0.00+ 61.14 61.14±0.00+ 100.0 100.0±0.00- 77.27 77.27±0.00+MMSDE 87.50 87.50±0.00+ 34.86 34.86±0.00+ 94.02 94.02±0.00+ 60.23 60.23±0.00+IMDE 97.80 97.80±0.00+ 53.71 53.71±0.00+ 100.0 100.0±0.00- 97.73 97.73±0.00+GP-SF 89.40 83.94±2.31+ 49.71 43.09±3.05+ 89.74 86.07±1.96+ 89.77 83.94±3.09+GP-MF 98.90 98.17±0.59+ 61.14 55.81±3.16+ 96.15 91.70±2.32+ 98.86 96.40±1.86+GP-OSF 98.40 98.02±0.25+ 65.14 61.71±1.58+ 82.26 81.37±1.33+ 96.59 94.85±1.85+GP-OMF 98.80 98.80±0.06+ 64.00 60.17±2.13+ 87.39 86.12±0.77+ 96.59 94.62±0.88+AFECGP 100.0 99.83±0.16 98.86 90.19±3.89 100.0 99.71±0.26 100.0 99.96±0.20Overall 14+ 14+ 12+, 2- 14+Rank 1/15 1/15 3/15 1/15
run time parameters as AFECGP. The purpose of comparisonsis to investigate whether AFECGP can achieve better diagnosisperformance than the other GP based baseline methods forfeature construction.
C. Parameter Settings
The parameters of AFECGP are set according to the com-mon settings in the GP community [40]. The initial populationis generated using the ramped half-and-half method. Thepopulation size is set as 100 and the maximal number ofgenerations is set as 50. Tournament selection with size 7 isused to select individuals for Crossover and Mutation. Therates of crossover, mutation, and elitism are 80%, 19% and1%, respectively. The maximal and minimal tree depths areset as 8 and 2, respectively.
The GP based methods and classification algorithms areimplemented using the DEAP (Distributed Evolutionary Al-gorithm Package) [65] and scikit-learn [66] packages, re-spectively. The number of neighbors in KNN is set as 3according to [59], [67]. The parameters in the classificationalgorithms are the default values of the scikit-learn package.The parameter values of the methods using manually extractedfeatures are set according to the corresponding references [17],[18], [23], [27], [67]. The experiments of all the methods oneach dataset run 30 times independently to reduce the biasand randomness. The fault diagnosis results of the test setsare reported.
V. RESULTS AND DISCUSSIONS
A. Classification Results
In this section, the fault diagnosis results of the AFECGPmethod on the four fault diagnosis datasets are discussed andcompared with the 14 baseline methods. The results of thesemethods are listed in Table IV. The results are the maximum(Max) accuracy, the average (Avg) accuracy, and the standarddeviation (Std) of the 30 runs. The best classification resultsof each dataset are highlighted in bold. In addition, the signif-icance of the difference in results between AFECGP and each
of the baseline methods is evaluated by the Wilcoxon rank-sum test with a 5% significance level. The symbols “+”, “-”or “=” in Table IV represent the performance of AFECGP issignificantly better, worse than or similar to the correspondingbaseline method, respectively. The fault diagnosis performanceranking of the AFECGP approach among all the methods oneach dataset are listed in the final row of Table IV.
The first five rows of Table IV list the diagnosis resultsof five traditional classifiers using RSA. It can be foundthat AFECGP obtains significantly better performance in allthe comparisons (4 datasets × 5 baseline methods). Sincethe features generated by AFECGP are fed into KNN forfault diagnosis, we should pay more attention to the resultsof KNN using RSA. The diagnosis accuracy difference isthe largest on the CWRU dataset, where the maximal andaverage accuracy of KNN using RSA are 15%, which are75% and 74.83% lower than that of AFECGP, respectively.The diagnosis accuracy difference is the smallest on the WHUdataset, where the maximal and average accuracy of KNNusing RSA are 82.95%, which are 17.05% and 17.01% lowerthan that of AFECGP, respectively. These results show thatthe features extracted and constructed by AFECGP are moreeffective for fault diagnosis than the methods using originalsignal amplitudes.
Rows 6 to 10 of Table IV are the diagnosis results of theKNN classifier using manually extracted/designed features,i.e., TDF [17], FDF [17], MDF [18], MMSDE [23], and IMDE[27]. The results show that AFECGP achieves significantlybetter performance in 18 comparisons out of the total 20 com-parisons (4 datasets × 5 baseline methods). For the CWRU,DIRH, and WHU datasets, the best maximal and average accu-racies of AFECGP are better than that of these methods usingmanually extracted features. The diagnosis accuracy differenceis the largest on the DIRG dataset, where the best maximal andaverage accuracies of these methods using manually extractedfeatures are 61.14%, which are 37.72% and 29.05% lowerthan that of AFECGP, respectively. On the UCOON dataset,the maximal accuracy of using MDF, IMDE, and AFECGP are

IEEE TRANSACTIONS ON CYBERNETICS 9
100%, and the average accuracy of MDF and IMDE is 0.29%higher than that of AFECGP. Although AFECGP achievesworse performance than the methods using the MDF or IMDEfeatures on UCOON, the best result achieved by AFECGP isthe same as them, and AFECGP achieves significantly betterperformance than them on the remaining three datasets. Theseresults show that the features generated by AFECGP performbetter on classifying various types of vibration signals, whilethe manually extracted features may only be effective forclassifying a certain type of signal. In summary, the featuresextracted and constructed by AFECGP are more discriminativeand effective than the manfully extracted/designed features forthese fault diagnosis problems.
Rows 11 to 14 of Table IV are the diagnosis results obtainedthe GP based feature construction baseline methods, i.e., GP-SF, GP-MF, GP-OSF, and GP-OMF. The results show thatthe AFECGP based diagnosis approach achieves significantlybetter performance in all the comparisons. The diagnosisaccuracy difference is the largest on the DIRG dataset, wherethe best maximal and average accuracy of these traditional GPbased methods are 65.14% and 60.17%, which are 33.72% and30.02% lower than that of AFECGP, respectively. The faultdiagnosis accuracy difference is the smallest on the CWRUdataset, where the best maximal and average accuracy of theGP based baseline methods are 98.9% and 98.8%, which are1.1% and 1.03% lower than that of AFECGP, respectively. Thediagnosis accuracy of GP-MF on all the datasets is better thanthat of GP-SF, which demonstrates that constructing multiplefeatures is more effective for fault diagnosis than constructinga single feature. However, the performance of GP-OMF isonly better than the other traditional GP based methods onthe CWRU dataset, which demonstrates that more features donot necessarily improve classification accuracy. According toabove results, the reasons of AFECGP achieves higher faultdiagnosis accuracy than these four GP based methods can besummarized as follows: 1) AFECGP can automatically detectthe useful subband signals, extract and construct effectivefeatures from the subband signals; 2) AFECGP can automat-ically determine the number of features for solving a faultdiagnosis task. In summary, AFECGP can adaptively identifyuseful subband signals to extract and construct discriminativefeatures, and automatically determine the optimal number offeatures to achieve effective fault diagnosis.
To sum up, AFECGP achieves significantly better results in54 comparisons out of the total 56 comparisons (4 datasets× 14 baseline methods). On the CWRU, WHU and UCOONdataset, AFECGP achieves the maximal diagnosis accuracy of100% and the average diagnosis accuracy of above 99%. Onthe DIRG dataset, AFECGP achieves the maximal diagnosisaccuracy of 98.86% and the average diagnosis accuracy of90.19%. The diagnosis performance of AFECGP ranks thefirst among all these 15 methods on the CWRU, DIRG, andWHU datasets and ranks the third on the UCOON dataset.The results show that the AFECGP based diagnosis approachhas excellent fault diagnosis ability and high adaptability. Asa result, the AFECGP approach is an effective and promisingapproach to fault diagnosis of rotating machinery.
B. Convergence Behaviour
The GP methods are evolutionary learning algorithms. Toshow the learning ability of these GP based methods forfeature extraction and construction, we analyse and comparethe convergence curves of these five GP based methods,including the proposed AFECGP approach. Fig. 6 shows theevolution plots on the four datasets, where the horizontal axisof each sub-figure represents the number of generations andthe vertical axis represents the average value of the best-of-generation diagnosis accuracy of the 30 runs. Each sub-figurehas five colored lines representing GP-SF, GP-MF, GP-OSF,GP-OMF, and AFECGP, respectively. As shown in Fig. 6,the convergence performance of AFECGP is superior to thatof GP-SF, GP-MF, GP-OSF, and GP-OMF on the four faultdiagnosis datasets. On the CWRU, DIRG, UCOON, and WHUdatasets, AFECGP takes 8, 25, 4, and 2 generations to obtainthe optimal diagnosis accuracy, respectively, which is fasterthan the other four GP based methods. In addition, the optimaldiagnosis accuracy of AFECGP is better than the other fourGP based methods on the four fault diagnosis datasets.
To conclude, the comparisons show that AFECGP has afaster convergence speed and can find better solutions thanthe other GP based feature construction methods on these fourfault diagnosis datasets. The main reasons are the designs ofthe new program structure, the function set and the terminalset in AFECGP. These new designs allow AFECGP to findbetter solutions to achieve higher diagnosis performance thanthe compared GP methods.
C. Computational Time
The computational time of AFECGP includes two parts,i.e., the evolutionary learning time and the fault diagnosistime. The evolutionary learning time is the time needed forconducting the evolutionary process (i.e., the time needed inthe second step shown in Fig. 5). Since the non-GP basedmethods do not have the evolutionary process, the evolutionarylearning time of AFECGP is only compared with the GP basedmethods. Table V lists the average learning time (in second)of the 30 runs of the GP based methods. From this table, itcan be found that AFECGP uses about 1,007s, 195s, 607s,and 205s on the CWRU, DIRG, UCOON, and WHU datasetsrespectively to search for the best solutions. Compared withthe other four GP methods, AFECGP uses a longer learningtime to find the best solutions. Compared with these four GPmethods, the solutions of AFECGP is more complex in orderto achieve useful subband signal detection, feature extractionand construction. The sophisticated solutions of AFECGP needmore computational time during the fitness evaluation processthan the other four GP methods, which use simple trees toconstruct features from a set of manually extracted features.Although AFECGP needs more time than the other GP basedmethods, it is noted that the learning time of AFECGP is notlong in general, i.e., 17 minutes at most, which is affordable.
The fault diagnosis time is the time for classifying theinstances in the test set (i.e., the time needed in the third step ofFig. 5). Table VI lists the average fault diagnosis time of the 30runs in seconds on the four datasets. It is clear that the methods

IEEE TRANSACTIONS ON CYBERNETICS 10
0 10 20 30 40 50
Number of generations
75
80
85
90
95
100
Dia
gn
osis
accu
racy (
%) CWRU
0 10 20 30 40 50
Number of generations
40
60
80
100
Dia
gn
osis
accu
racy (
%) DIRG
GP-SF GP-MF GP-OSF GP-OMF AFECGP
0 10 20 30 40 50
Number of generations
90
95
100
Dia
gn
osis
accu
racy (
%) UCOON
0 10 20 30 40 50
Number of generations
90
95
100
Dia
gn
osis
accu
racy (
%) WHU
Fig. 6. Convergence curves of the GP based methods.
TABLE VEVOLUTIONARY LEARNING TIME (SECONDS) OF GP-BASED METHODS
ON FOUR FAULT DIAGNOSIS DATASETS
MethodCWRU DIRG UCOON WHU
Avg±Std Avg±Std Avg±Std Avg±StdGP-SF 492.4±104.9 93.4±26.4 228.0±66.29 55.9±13.7GP-MF 568.6±146.5 111.9±23.2 241.7±73.2 60.4±13.4GP-OSF 566.3±107.7 105.3±22.5 283.9±55.7 52.6±12.2GP-OMF 667.8±164.5 122.2±28.7 294.8±48.4 64.9±12.3AFECGP 1007.7±358.9 195.4±58.4 607.3±301.4 205.4±69.8
TABLE VIFAULT DIAGNOSIS TIME (SECONDS) ON THE FOUR DATASETS
MethodCWRU DIRG UCOON WHU
Avg±Std Avg±Std Avg±Std Avg±StdTDF 0.30±0.016 0.04±0.002 0.22±0.003 0.03±0.002FDF 0.29±0.002 0.04±0.003 0.24±0.004 0.03±0.002MDF 275.53±1.266 127.81±2.238 20.15±0.522 15.76±0.585MMSDE 97.15±2.217 9.71±0.035 74.55±0.263 8.46±0.022IMDE 176.12±0.417 15.72±0.037 130.19±1.805 13.43±0.085GP-SF 0.61±0.187 0.08±0.024 0.31±0.076 0.19±0.012GP-MF 0.60±0.166 0.07±0.019 0.28±0.031 0.04±0.009GP-OSF 0.53±0.156 0.08±0.024 0.31±0.053 0.03±0.008GP-OMF 0.64±0.333 0.08±0.033 0.32±0.043 0.04±0.008AFECGP 0.84±0.329 0.09±0.027 0.34±0.061 0.05±0.022
using the MDF, MMSDE, and IMDE features use a longertime than the methods using the TDF and FDF features andthe GP based methods. The reason is that the extraction of theMDF, MMSDE and IMDE features has a complicated signalprocessing process, while the extraction of the TDF and FDFfeatures only performs statistical calculations on the signals.The AFECGP approach uses about 0.84, 0.09, 0.34, and 0.05seconds on the CWRU, DIRG, UCOON, and WHU datasets,respectively. Compared with the other four GP based methods,the time of AFECGP is longer on these four datasets becausethe solutions of AFECGP have more calculations. However,the time of AFECGP is much less than that of the methodsusing the MDF, MMSDE and IMDE features. Overall, the timecomplexity of the AFECGP is less than most of the traditionalfault diagnosis methods, and not remarkably larger than otherGP based methods for feature construction.
D. Feature Visualization
To better illustrate the superiority of the features generatedby AFECGP, the t-SNE dimensionality reduction technology[68] is used to reduce the original signal and the featuresgenerated by AFECGP into two dimensions (2-D) for vi-sualization, respectively. The instances in the test set are
1 2 3 4 5 6 7 8 9 10
(a) CWRU
1 2 3 4 5 6 7
(b) DRIG
1 2 3 4 5 6 7 8 9
(c) UCOON
1 2 3 4
(d) WHU
Fig. 7. Data visualization via t-SNE using the original signals and thefeatures generated by AFECGP. Left: raw signals; right: features generatedby AFECGP.
used for visualization and the results are shown in Fig. 7,where different running conditions are represented by differentcolors. For example, 10 colored points of Fig. 7(a) represent10 running conditions of rolling bearing in the CWRU dataset.The left column of Fig. 7 shows the visualization resultsusing the original signals, while the right column shows thevisualization results using the features generated by AFECGP.
As it can be seen from the left figures of Fig. 7, for the

IEEE TRANSACTIONS ON CYBERNETICS 11
CWRU, DIRG, and WHU datasets, the points in differentclasses are randomly distributed and irregular. For the UCOONdataset, some same colored points are gathered together, butdifferent colored clusters are overlapping. The visualizationresults of the original signals illustrate that the vibration sig-nals under different running conditions are wrongly clustered,which indicates that the classification based on the raw signalmay not be effective.
As it can be seen from the right figures of Fig. 7, for theCWRU, UCOON, and WHU datasets, the same colored pointsare gathered together, and there are obvious gaps between thedifferent colored clusters. For the DIRG dataset, except for onered point is incorrectly gathered together with the green points,the other different colored points are gathered together anddo not have overlap. The visualization results of the featuresgenerated by AFECGP illustrate that these features have goodsimilarity among the same class and have big differencesbetween different classes, which makes it easier to classifythe vibration signals under different running conditions.
By the visualization of the features generated by AFECGP,the difference of the vibration signals under different run-ning conditions can be seen intuitively. This illustrates thatAFECGP can effectively extract and construct representativefeatures in various vibration signals to improve the faultclassification performance.
E. Example Model Analysis
Two example models/trees/programs evolved by AFECGPare used to further understand how informative features areextracted from original vibration signals and why they achieveeffective fault diagnosis of rotating machinery.
1) Model on CWRU: An example model evolved/learnedby AFECGP on the CWRU dataset is shown in Fig. 8, whichachieves 100% accuracy on both the training and test sets.This model contains decomposition functions HPF , LPF ,BPF , and BEF ; rescaling functions: Abs and Sqrt; featureextraction functions Std, Mean and Max; feature construc-tion functions +, − and ÷; and feature combination functionsFcom2 and FcomM.
Signals
HPF
Std
3840
Signals
BEF
21601140
Abs
Mean
Fcom2
+
Fcom2
FcomM
Output
Signals
BPF
Max
40203660
BPF
Abs
Std
Mean
LPF
Mean
-
Std
BEF
Signals
BPF
55804080
Sqrt
Signals 1620
Signals 3780900
Signals 4320600
Fig. 8. Example solution evolved by AFECGP on the CWRU dataset.
From the example model on the CWRU dataset shownin Fig. 8, it can be found the information of seven subband
signals are extracted as features, which are further constructedto form an output feature vector of four high-level features.The example model in Fig. 8 has seven branches (from leftto right): branch 1 performs BEF with a feu of 3,780 Hzand a fel of 900 Hz on the original signal, and calculates thestandard deviation of the filtered signal amplitudes as feature1; branch 2 performs BPF with a fpu of 4,320 Hz and a fplof 600 Hz on the original signal, uses Abs to transform thefiltered signal amplitudes and calculates the standard deviationas feature 2; branch 3 performs BPF with a fpu of 5,580Hz and a fpl of 4,080 Hz on the original signal, uses Sqrtto transform the filtered signal amplitudes and calculates theaverage value as feature 3; branch 4 performs LPF with a flof 1,620 Hz on the original signal, and calculates the averageof the filtered signal amplitudes as feature 4; branch 5 performsBPF with a fpu of 4,020 Hz and a fpl of 3,660 Hz on theoriginal signal, and calculates the maximum of the filteredsignal amplitudes as feature 5; branch 6 performs HPF witha fh of 3,840 Hz on the original signal, and calculates thestandard deviation of the filtered signal amplitudes as feature6; and branch 7 performs BEF with a feu of 2,160 Hz and afel of 1,140 Hz on the original signal, uses Abs to transformthe filtered signal amplitudes and calculates the average valueas feature 7. The features of branches 2, 3, 4 and 5 are used toconstruct a high-level feature using a mathematical expression,i.e., feature 2÷(feature 3−feature 4)+feature 5. The outputs ofthis example solution are the high-level feature constructed bybranches 2, 3, 4 and 5, the feature constructed by branch 1, thefeature constructed by branch 6, and the feature constructedby branch 7.
2) Model on WHU: An example model evolved byAFECGP on the WHU dataset is shown in Fig. 9, whichachieves 100% accuracy on both the training and test sets.This model contains decomposition function BPF and BEF ;rescaling functions Abs and Sqrt; feature extraction functionsMean, Min, and Std, and feature combination functionsFcom2 and FcomM.
Min
Signals
BEF
4030
SqrtBEF
Abs
Mean
Std
Signals
BEF
1000660
Sqrt
Fcom2
FcomM
Output
53030Signals
Fig. 9. Example solution evolved by AFECGP on the WHU dataset.
From the example model on the WHU dataset shown inFig. 9, it can be found that the example model has a smallsize with three branches (from left to right): branch 1 performsBEF with a feu of 530 Hz and a fel of 30 Hz on the originalsignal, uses Abs to transform the filtered signal amplitudes andcalculates the average value as feature 1; branch 2 performsBEPF with a fpu of 40 Hz and a fpl of 30 Hz on the originalsignal, uses Sqrt to transform the filtered signal amplitudes
IEEE TRANSACTIONS ON CYBERNETICS 12
and calculates the minimum as feature 2; branch 3 performsBEF with a fpu of 1,000 Hz and a fpl of 600 Hz onthe original signal, uses Sqrt to transform the filtered signalamplitudes and calculates the standard deviation as feature 3.The outputs of this example solution are feature 1, feature 2and feature 3 that are constructed by the three branches.
By the analysis of the two example models, the processesof feature extraction and construction of AFECGP are clearlydisplayed and interpreted. Unlike the existing fault diagnosismethods, AFECGP can adaptively determine the features num-ber instead of presetting a fixed number. The example modelson CWRU and WHU have different sizes and complexity,which illustrates that AFECGP can adaptively evolve solutionswith variable lengths and complexity according to tasks.
F. Further Discussions
To achieve the fault diagnosis of rotating machinery ef-fectively, it is typically better to generate as many featuresas possible for comprehensively describing the signals of thevarious health states [3]. AFECGP does not use the existingtechnical methods, such as multi-domain feature extractionand multi-scale feature extraction, to expand the feature pool.As it can be seen from Fig. 8 and Fig. 9 that these twoexample models learned/evolved by AFECGP are differentfrom the existing feature extraction methods, which neitheruses the whole signal nor uses one certain subband signal.In contrast, AFECGP adaptively determines multiple subbandsignals, extracts and constructs the features with the highestdiscriminability between different subband signals. Althoughthese subband signals found by AFECGP may not be the res-onance band signals concerned/employed by domain experts,they are very effective for fault diagnosis.
Typically, the manually extracted features are defined bydomain experts using mathematical operators to combinevarious basic statistical indexes. For example, the pulse index[18] has the equation of max|x(n)|/( 1
N
∑Nn=1 |x(n)|) using
Mean, Max, Abs and ÷ operators for feature generation.AFECGP contains the basic statistical indexes (i.e., Max,Min, Std, Mean, and KthM ) and mathematical operators(i.e., +, −, ×, ÷ and Abs), and has the capability to gen-erate the same features as the features defined by domainexperts. For example, the pulse index can be constructed byMax(Abs(x))÷Mean(Abs(x)). However, from the examplemodels evolved by AFECGP shown in Fig. 8 and Fig. 9, itcan be found that the features generated by AFECGP are notsame as the manually extracted features, but are more effectivefor classifying fault types.
In summary, rotating machinery fault diagnosis is an en-gineering problem traditionally requiring domain expertise,but it can also be solved using computational intelligencealgorithms. The proposed AFECGP approach is based onevolutionary computation techniques, which can deal with theprocesses of information detection, feature extraction, featureconstruction and classification, automatically and simultane-ously, without domain expertise and human intervention.
VI. CONCLUSIONS
The goal of this paper was to develop a new GP basedapproach to automatically and simultaneously extract and con-struct features from raw vibration signals for fault diagnosis ofrotating machinery. This goal has been successfully achievedby developing the AFECGP approach having a new individualrepresentation of a multi-layer structure, a new function setwith various functions for different tasks, and a new terminalset with the raw signal and the corresponding parametersof functions. With these designs, the AFECGP approachcan detect useful subband signals, extract features from thedetected subband signals, construct high-level features fromthe extracted features, and combine these high-level featuresto form the output feature vector for fault diagnosis.
The performance of the AFECGP based diagnosis approachwas examined on four fault datasets, i.e., two rolling bearingfault datasets, one gear fault dataset and one rotor dataset.The proposed approach was compared with fourteen baselinemethods. The results showed that the features generated byAFECGP were more effective than raw signal, manually ex-tracted features and the features constructed by the traditionalGP based methods for fault diagnosis.
The investigations in this paper further reveal that whenthe rotating machinery running conditions become complex(e.g. more uncertain, dynamic and noisy), the traditionalfeatures or knowledge extracted/designed by human expertsmay not be effective for diagnosing the faults. In contrast, theautomatically learned features by automated learning methodscan adapt better and achieve more effective results. Thisfurther suggests that the use and development of automatedlearning algorithms for complex fault diagnosis is a gooddirection of research, and this paper opens the door for furtherinvestigation.
REFERENCES
[1] R. Liu, B. Yang, E. Zio, and X. Chen, “Artificial intelligence for faultdiagnosis of rotating machinery: A review,” Mech. Syst. Signal Process.,vol. 108, pp. 33–47, 2018.
[2] Z. Gao, C. Cecati, and S. X. Ding, “A survey of fault diagnosis andfault-tolerant techniques-part i: Fault diagnosis with model-based andsignal-based approaches,” IEEE Trans. Ind. Electron., vol. 62, no. 6, pp.3757–3767, 2015.
[3] T. W. Rauber, F. de Assis Boldt, and F. M. Varejao, “Heterogeneousfeature models and feature selection applied to bearing fault diagnosis,”IEEE Trans. Ind. Electron., vol. 62, no. 1, pp. 637–646, 2014.
[4] X. Gu, S. Yang, Y. Liu, and R. Hao, “A novel pareto-based bayesian ap-proach on extension of the infogram for extracting repetitive transients,”Mech. Syst. Signal Process., vol. 106, pp. 119–139, 2018.
[5] N. E. Huang, Z. Shen, S. R. Long, M. C. Wu, H. H. Shih, Q. Zheng, N.-C. Yen, C. C. Tung, and H. H. Liu, “The empirical mode decompositionand the hilbert spectrum for nonlinear and non-stationary time seriesanalysis,” Proc. Roy. Soc. Lond. A, Math., Phys. Eng. Sci., vol. 454, pp.903–995, 1998.
[6] M. G. Frei and I. Osorio, “Intrinsic time-scale decomposition: time–frequency–energy analysis and real-time filtering of non-stationary sig-nals,” Proc. Roy. Soc. A, Math., Phys. Eng. Sci., vol. 463, no. 2078, pp.321–342, 2007.
[7] J. Zheng, J. Cheng, and Y. Yang, “A rolling bearing fault diagnosisapproach based on lcd and fuzzy entropy,” Mech. Mach. Theory, vol. 70,pp. 441–453, 2013.
[8] Z. Wu and N. E. Huang, “Ensemble empirical mode decomposition: anoise-assisted data analysis method,” Adv. Adapt. Data Anal., vol. 1,no. 01, pp. 1–41, 2009.

IEEE TRANSACTIONS ON CYBERNETICS 13
[9] Z. Feng, X. Lin, and M. J. Zuo, “Joint amplitude and frequencydemodulation analysis based on intrinsic time-scale decomposition forplanetary gearbox fault diagnosis,” Mech. Syst. Signal Process., vol. 72,pp. 223–240, 2016.
[10] Z. Liu, Y. Jin, M. J. Zuo, and Z. Feng, “Time-frequency representationbased on robust local mean decomposition for multicomponent am-fmsignal analysis,” Mech. Syst. Signal Process., vol. 95, pp. 468–487, 2017.
[11] K. Dragomiretskiy and D. Zosso, “Variational mode decomposition,”IEEE Trans. Signal Process., vol. 62, no. 3, pp. 531–544, 2013.
[12] Y. Wang, R. Markert, J. Xiang, and W. Zheng, “Research on variationalmode decomposition and its application in detecting rub-impact fault ofthe rotor system,” Mech. Syst. Signal Process., vol. 60, pp. 243–251,2015.
[13] G. K. Apostolidis and L. J. Hadjileontiadis, “Swarm decomposition: Anovel signal analysis using swarm intelligence,” Signal Process., vol.132, pp. 40–50, 2017.
[14] Y. Miao, M. Zhao, V. Makis, and J. Lin, “Optimal swarm decompositionwith whale optimization algorithm for weak feature extraction frommulticomponent modulation signal,” Mech. Syst. Signal Process., vol.122, pp. 673–691, 2019.
[15] H. Li, Z. Li, and W. Mo, “A time varying filter approach for empiricalmode decomposition,” Signal Process., vol. 138, pp. 146–158, 2017.
[16] X. Zhang, Z. Liu, Q. Miao, and L. Wang, “An optimized time varyingfiltering based empirical mode decomposition method with grey wolfoptimizer for machinery fault diagnosis,” J. Sound Vib., vol. 418, pp.55–78, 2018.
[17] X. Zhang, Q. Zhang, M. Chen, Y. Sun, X. Qin, and H. Li, “A two-stage feature selection and intelligent fault diagnosis method for rotatingmachinery using hybrid filter and wrapper method,” Neurocomputing,vol. 275, pp. 2426–2439, 2018.
[18] X. Yan and M. Jia, “A novel optimized svm classification algorithm withmulti-domain feature and its application to fault diagnosis of rollingbearing,” Neurocomputing, vol. 313, pp. 47–64, 2018.
[19] J. S. Richman and J. R. Moorman, “Physiological time-series analysisusing approximate entropy and sample entropy,” Am. J. Physiol. HeartCirc. Physiol., vol. 278, no. 6, pp. H2039–H2049, 2000.
[20] W. Chen, Z. Wang, H. Xie, and W. Yu, “Characterization of surface emgsignal based on fuzzy entropy,” IEEE. Trans. Neural. Syst. Rehabil. Eng.,vol. 15, no. 2, pp. 266–272, 2007.
[21] C. Bandt and B. Pompe, “Permutation entropy: a natural complexitymeasure for time series,” Phys. Rev. Lett., vol. 88, no. 17, p. 174102,2002.
[22] M. Rostaghi and H. Azami, “Dispersion entropy: A measure for time-series analysis,” IEEE Signal Process. Lett., vol. 23, no. 5, pp. 610–614,2016.
[23] Y. Li, Y. Yang, G. Li, M. Xu, and W. Huang, “A fault diagnosis schemefor planetary gearboxes using modified multi-scale symbolic dynamicentropy and mrmr feature selection,” Mech. Syst. Signal Process.,vol. 91, pp. 295–312, 2017.
[24] M. Costa, A. L. Goldberger, and C.-K. Peng, “Multiscale entropyanalysis of biological signals,” Phys. Rev. E, vol. 71, no. 2, p. 021906,2005.
[25] H. Azami, S. E. Arnold, S. Sanei, Z. Chang, G. Sapiro, J. Escudero, andA. S. Gupta, “Multiscale fluctuation-based dispersion entropy and itsapplications to neurological diseases,” IEEE Access, vol. 7, pp. 68 718–68 733, 2019.
[26] J. Zheng, H. Pan, and J. Cheng, “Rolling bearing fault detection anddiagnosis based on composite multiscale fuzzy entropy and ensemblesupport vector machines,” Mech. Syst. Signal Process., vol. 85, pp. 746–759, 2017.
[27] X. Yan and M. Jia, “Intelligent fault diagnosis of rotating machinery us-ing improved multiscale dispersion entropy and mrmr feature selection,”Knowl. Based Syst., vol. 163, pp. 450–471, 2019.
[28] B. Xue, M. Zhang, W. N. Browne, and X. Yao, “A survey on evolu-tionary computation approaches to feature selection,” IEEE Trans. Evol.Comput., vol. 20, no. 4, pp. 606–626, 2015.
[29] Y. Li, Y. Wei, K. Feng, X. Wang, and Z. Liu, “Fault diagnosis of rollingbearing under speed fluctuation condition based on vold-kalman filterand rcmfe,” IEEE Access, vol. 6, pp. 37 349–37 360, 2018.
[30] D. Wang, “K-nearest neighbors based methods for identification ofdifferent gear crack levels under different motor speeds and loads:Revisited,” Mech. Syst. Signal Process., vol. 70, pp. 201–208, 2016.
[31] U. Jung and B.-H. Koh, “Wavelet energy-based visualization and classi-fication of high-dimensional signal for bearing fault detection,” Knowl.Inf. Syst., vol. 44, no. 1, pp. 197–215, 2015.
[32] C. Zhang, J. H. Sun, and K. C. Tan, “Deep belief networks ensemblewith multi-objective optimization for failure diagnosis,” in Proc. IEEEInt. Conf. Syst. Man. Cybern., 2015, pp. 32–37.
[33] T. Ince, S. Kiranyaz, L. Eren, M. Askar, and M. Gabbouj, “Real-timemotor fault detection by 1-d convolutional neural networks,” IEEE Trans.Ind. Electron., vol. 63, no. 11, pp. 7067–7075, 2016.
[34] G. Jiang, H. He, J. Yan, and P. Xie, “Multiscale convolutional neuralnetworks for fault diagnosis of wind turbine gearbox,” IEEE Trans. Ind.Electron., vol. 66, no. 4, pp. 3196–3207, 2018.
[35] J. R. Koza, Genetic Programming: on the Programming of Computersby Means of Natural Selection. MIT press, 1992.
[36] Y. Bi, B. Xue, and M. Zhang, “A survey on genetic programming toimage analysis,” J. Zhengzhou Univ. Eng. Sci., vol. 39, no. 06, pp. 3–13, 2018.
[37] Q. Chen, M. Zhang, and B. Xue, “Feature selection to improvegeneralization of genetic programming for high-dimensional symbolicregression,” IEEE Trans. Evol. Comput., vol. 21, no. 5, pp. 792–806,2017.
[38] Y. Mei, S. Nguyen, B. Xue, and M. Zhang, “An efficient featureselection algorithm for evolving job shop scheduling rules with geneticprogramming,” IEEE Trans. Emerg. Topics Comput. Intell., vol. 1, no. 5,pp. 339–353, 2017.
[39] H. Al-Sahaf, Y. Bi, Q. Chen, A. Lensen, Y. Mei, Y. Sun, B. Tran, B. Xue,and M. Zhang, “A survey on evolutionary machine learning,” J. Roy. Soc.N. Z., vol. 49, no. 2, pp. 205–228, 2019.
[40] Y. Bi, B. Xue, and M. Zhang, “Genetic programming with a newrepresentation to automatically learn features and evolve ensem-bles for image classification,” IEEE Trans. Cybern., 2020. DOI:10.1109/TCYB.2020.2964566.
[41] K. Nag and N. R. Pal, “A multiobjective genetic programming-basedensemble for simultaneous feature selection and classification,” IEEETrans. Cybern., vol. 46, no. 2, pp. 499–510, 2015.
[42] W. Fu, M. Johnston, and M. Zhang, “Low-level feature extractionfor edge detection using genetic programming,” IEEE Trans. Cybern.,vol. 44, no. 8, pp. 1459–1472, 2013.
[43] Y. Bi, B. Xue, and M. Zhang, “An effective feature learning approachusing genetic programming with image descriptors for image classifica-tion [research frontier],” IEEE Comput. Intell. Mag., vol. 15, no. 2, pp.65–77, 2020.
[44] H. Guo, L. B. Jack, and A. K. Nandi, “Feature generation using geneticprogramming with application to fault classification,” IEEE Trans. Syst.,Man, Cybern. C, Cybern., vol. 35, no. 1, pp. 89–99, 2005.
[45] J. Xuan, H. Jiang, T. Shi, and G. Liao, “Gear fault classification usinggenetic programming and support vector machines,” Int. J. Inf. Technol.,vol. 11, no. 9, p. 37, 2005.
[46] D. J. Montana, “Strongly typed genetic programming,” Evol. Comput.,vol. 3, no. 2, pp. 199–230, 1995.
[47] Y. Bi, B. Xue, and M. Zhang, “Genetic programming with image-related operators and a flexible program structure for feature learn-ing to image classification,” IEEE Trans. Evol. Comput., 2020.DOI:10.1109/TEVC.2020.3002229.
[48] D. Atkins, K. Neshatian, and M. Zhang, “A domain independentgenetic programming approach to automatic feature extraction for imageclassification,” in Proc. IEEE Congress of Evolutionary Computation(CEC), 2011, pp. 238–245.
[49] H. Al-Sahaf, A. Song, K. Neshatian, and M. Zhang, “Two-tier geneticprogramming: Towards raw pixel-based image classification,” ExpertSyst. Appl., vol. 39, no. 16, pp. 12 291–12 301, 2012.
[50] Y. Bi, B. Xue, and M. Zhang, “An automatic feature extraction approachto image classification using genetic programming,” in Proc. Int. Conf.Appl. Eov. Comput., 2018, pp. 421–438.
[51] S. Ma, M. Chen, J. Wu, Y. Wang, B. Jia, and Y. Jiang, “High-voltagecircuit breaker fault diagnosis using a hybrid feature transformationapproach based on random forest and stacked autoencoder,” IEEE Trans.Ind. Electron., vol. 66, no. 12, pp. 9777–9788, 2019.
[52] A. Lensen, B. Xue, and M. Zhang, “Genetic programming for evolvinga front of interpretable models for data visualization,” IEEE Trans.Cybern., 2020.
[53] M. Muharram and G. D. Smith, “Evolutionary constructive induction,”IEEE Trans. Knowl. Data Eng., vol. 17, no. 11, pp. 1518–1528, 2005.
[54] K. Neshatian, M. Zhang, and P. Andreae, “A filter approach to multiplefeature construction for symbolic learning classifiers using geneticprogramming,” IEEE Trans. Evol. Comput., vol. 16, no. 5, pp. 645–661,2012.
[55] J. Ma and G. Teng, “A hybrid multiple feature construction approach forclassification using genetic programming,” Appl. Soft Comput., vol. 80,pp. 687–699, 2019.

IEEE TRANSACTIONS ON CYBERNETICS 14
[56] B. Tran, B. Xue, and M. Zhang, “Genetic programming for multiple-feature construction on high-dimensional classification,” Pattern Recog-nit., vol. 93, pp. 404–417, 2019.
[57] H. S. Jeong and E. A. Elsayed, “On-line surveillance and monitoring,”in Maintenance, Modeling and Optimization. Springer, 2000, pp. 309–343.
[58] T. Narendiranath Babu, T. Manvel Raj, and T. Lakshmanan, “Applicationof butterworth filter for fault diagnosis on journal bearing,” J. Vibroeng.,vol. 16, no. 3, pp. 1602–1617, 2014.
[59] J. Tian, C. Morillo, M. H. Azarian, and M. Pecht, “Motor bearing faultdetection using spectral kurtosis-based feature extraction coupled with k-nearest neighbor distance analysis,” IEEE Trans. Ind. Electron., vol. 63,no. 3, pp. 1793–1803, 2016.
[60] Y. Lei, B. Yang, X. Jiang, F. Jia, N. Li, and A. K. Nandi, “Applicationsof machine learning to machine fault diagnosis: A review and roadmap,”Mech. Syst. Signal Process., vol. 138, p. 106587, 2020.
[61] “Case western reserve university bearing data center. [online],” http://csegroups.case.edu/bearingdatacenter/home/, accessed April, 2018.
[62] A. P. Daga, A. Fasana, S. Marchesiello, and L. Garibaldi, “The politec-nico di torino rolling bearing test rig: Description and analysis of openaccess data,” Mech. Syst. Signal Process., vol. 120, pp. 252–273, 2019.
[63] P. Cao, S. Zhang, and J. Tang, “Preprocessing-free gear fault diagnosisusing small datasets with deep convolutional neural network-basedtransfer learning,” IEEE Access, vol. 6, pp. 26 241–26 253, 2018.
[64] D. Liu, Z. Xiao, X. Hu, C. Zhang, and O. Malik, “Feature extraction ofrotor fault based on eemd and curve code,” Measurement, vol. 135, pp.712–724, 2019.
[65] F.-A. Fortin, F.-M. De Rainville, M.-A. Gardner, M. Parizeau, andC. Gagne, “DEAP: Evolutionary algorithms made easy,” J. Mach. Learn.Res., vol. 13, pp. 2171–2175, 2012.
[66] F. Pedregosa, G. Varoquaux, A. Gramfort, V. Michel, B. Thirion,O. Grisel, M. Blondel, P. Prettenhofer, R. Weiss, V. Dubourg, J. Vander-plas, A. Passos, D. Cournapeau, M. Brucher, M. Perrot, and E. Duches-nay, “Scikit-learn: Machine learning in Python,” J. Mach. Learn. Res.,vol. 12, pp. 2825–2830, 2011.
[67] Y. Bi, B. Xue, and M. Zhang, “Evolving deep forest with automaticfeature extraction for image classification using genetic programming,”in Proc. PPSN. Springer, 2020, pp. 3–18.
[68] L. v. d. Maaten and G. Hinton, “Visualizing data using t-sne,” J. Mach.Learn. Res., vol. 9, no. Nov, pp. 2579–2605, 2008.
Bo Peng received the B.E. degree from AgriculturalUniversity of Hebei, Hebei, China, in 2014, andthe M.E. degree from North China Electric PowerUniversity, Hebei, China, in 2017.
He is currently pursuing the Ph.D. degree inpower machinery and engineering with the School ofEnergy, Power and Mechanical Engineering, NorthChina Electric Power University, Beijing, China. Heis currently visiting the Evolutionary ComputationResearch Group, School of Engineering and Com-puter Science, Victoria University of Wellington,
Wellington, New Zealand.His current research interests include fault diagnosis, evolutionary compu-
tation, and machine learning.
Shuting Wan received the B.E., M.E., and Ph.D.degrees from North China Electric Power University,Hebei, China, in 1991, 1994, and 2006, respectively.
He is currently a Professor with the departmentof Mechanical Engineering, and the Dean with theHebei Key Laboratory of Electric Machinery HealthMaintenance & Failure Prevention, North ChinaElectric Power University. His research focusesmainly on fault diagnosis and condition monitoringon rotation machinery, signal analysis and process-ing, and structural dynamics of electric equipment.
He is the Vice-Chair of Hebei Provincial Society for Vibration Engineeringand the Committee Member of Chinese Society for Vibration Engineering.
Ying Bi (M’17) received the B.Sc.degree in 2013from Wuhan Polytechnic University, Hubei, China,the M.Sc. degree in 2016 from Shenzhen University,Shenzhen, China, and the PhD degree in 2020 fromVictoria University of Wellington, New Zealand.
She is currently a Post-Doctoral Research Fellowwith the School of Engineering and Computer Sci-ence, Victoria University of Wellington. Her currentresearch interests include evolutionary computation,computer vision, and machine learning. She haspublished over 30 papers in this field, including top
journal and conference papers.She is a member of the IEEE Computational Intelligence Society and has
been severing as reviewers for top international journals and conferences,such as IEEE Transactions on Evolutionary Computation, IEEE Transactionson Cybernetics, IEEE Congress on Evolutionary Computation (CEC), and theGenetic and Evolutionary Computation Conference (GECCO).
Bing Xue (M’10) received the B.Sc. degree fromthe Henan University of Economics and Law,Zhengzhou, China, in 2007, the M.Sc. degree inmanagement from Shenzhen University, Shenzhen,China, in 2010, and the PhD degree in computerscience in 2014 at Victoria University of Wellington(VUW), New Zealand.
She is currently an Associate Professor and Pro-gram Director of Science in School of Engineer-ing and Computer Science at VUW. She has over200 papers published in fully refereed international
journals and conferences and her research focuses mainly on evolutionarycomputation, machine learning, classification, symbolic regression, featureselection, evolving deep neural networks, image analysis, transfer learning,multi-objective machine learning.
Dr Xue is currently the Chair of IEEE Computational Intelligence So-ciety (CIS) Data Mining and Big Data Analytics Technical Committee,and Vice-Chair of IEEE Task Force on Evolutionary Feature Selection andConstruction, Vice-Chair of IEEE CIS Task Force on Transfer Learning &Transfer Optimization, and of IEEE CIS Task Force on Evolutionary DeepLearning and Applications. She is also served as associate editor of severalinternational journals, such as IEEE Computational Intelligence Magazine andIEEE Transactions of Evolutionary Computation.
Mengjie Zhang (M’04-SM’10-F’19) received theB.E. and M.E. degrees from Artificial IntelligenceRe- search Center, Agricultural University of Hebei,Hebei, China, and the Ph.D. degree in computerscience from RMIT University, Melbourne, VIC,Australia, in 1989, 1992, and 2000, respectively.
He is currently Professor of Computer Science,Head of the Evolutionary Computation ResearchGroup, and the Associate Dean (Research and In-novation) in the Faculty of Engineering. His currentresearch interests include evolutionary computation,
particularly genetic programming, particle swarm optimization, and learningclassifier systems with application areas of image analysis, multi-objectiveoptimization, feature selection and reduction, job shop scheduling, and transferlearning.
He has published over 500 research papers in refereed international journalsand conferences. Prof. Zhang is a Fellow of Royal Society of New Zealand andhave been a Panel member of the Marsden Fund (New Zealand GovernmentFunding), a Fellow of IEEE, and a member of ACM. He was the chair ofthe IEEE CIS Intelligent Systems and Applications Technical Committee,and chair for the IEEE CIS Emergent Technologies Technical Committeeand the Evolutionary Computation Technical Committee, and a member ofthe IEEE CIS Award Committee. He is a vice-chair of the IEEE CIS TaskForce on Evolutionary Feature Selection and Construction, a vice-chair ofthe Task Force on Evolutionary Computer Vision and Image Processing, andthe founding chair of the IEEE Computational Intelligence Chapter in NewZealand. He is also a committee member of the IEEE NZ Central Section.