ieee d&t, special issue on cyber security for embedded
TRANSCRIPT

IEEE D&T, SPECIAL ISSUE ON CYBER SECURITY FOR EMBEDDED CONTROLS IN CYBER-PHYSICAL SYSTEMS, 2018 1
A Data-Based Detection MethodAgainst False Data Injection Attacks
Charalambos Konstantinou, Member, IEEE, and Michail Maniatakos, Member, IEEE
Abstract—State estimation is one of the fundamental functionsin power grid. In this paper, we address the vulnerability of stateestimators to false data injection attacks (FDIAs) by proposinga data-driven anomaly detection algorithm. The proposed tech-nique applies dimensionality reduction on grid measurementsalong with a density-based Local Outlier Factor (LOF) analysisand a feature bagging framework of combining predictions frommultiple LOF outlier detection outputs. The work also addressesthe handling of critical measurements. Instead of removing theattacked measurements, which may cause the system to becomeunobservable, we replace them by forecasted measurements.Numerical tests on IEEE 14-bus system verify the effectivenessand performance of the proposed method.
Index Terms—Cybersecurity, false data injection attacks, stateestimation, outlier detection, dimensionality reduction.
I. INTRODUCTION
STATE Estimation (SE) is the method that estimates thepower system operation based on the real-time network
model. This is achieved by filtering measurement errors andleveraging redundant measurements. The SE measurementsare collected by Remote Terminal Units (RTUs) and PhasorMeasurement Units (PMUs) and transmitted through the Su-pervisory Control And Data Acquisition (SCADA) network tothe control center. Grid operators use the SE results to adjustcontrols, estimate unmeasured variables, and detect faulty data.SE is classified into static SE (SSE)1 and dynamic SE (DSE).While SSE operation is based on a single set of measurements,DSE takes into account the continuous variation of systemloads, i.e., it keeps track of the real-time system states andpredicts the state progressively in short time-steps.
A particular class against SE is False Data Injection Attacks(FDIAs). In a FDIA, an attacker compromises measurementsfrom grid sensors in order SE to produce erroneous results andalso bypass bad data detection modules [1]. The circumstancesof the Ukraine blackout in 2015 underline the plausibilityof common assumptions regarding the adversary’s knowledgeand capabilities in order to mount a successful FDIA [2]. Thisreal-world example demonstrates the effects that a sophisti-cated FDI-based attack can cause on the grid infrastructure.
Several research efforts have highlighted the vulnerabilityof SE to FDIAs. Existing mitigation actions either require
This work was supported by the FSU planning grant and the NYUADglobal fellowship programs.
Charalambos Konstantinou is with the Department of Electrical and Com-puter Engineering, FAMU-FSU College of Engineering and the Center ofAdvanced Power Systems, Florida State University, Tallahassee, FL 32310USA (e-mail: [email protected]). Michail Maniatakos is with the Divi-sion of Engineering and the Center for Cyber Security, New York UniversityAbu Dhabi, Abu Dhabi, UAE (e-mail: [email protected]).
1Tracking SE (TSE) is a type of SSE in which the estimation starts fromthe last calculated state variables instead of a flat point.
protection of a measurement set or the placement of PMUs[3]. The protection of measurements is primarily achieved byimproving the security of associated sensors or masking theeffect of attacks through redundant measurements. In additionto the impractical process of enhancing the security of existingdevices or the deployment of redundant sensors, this approachalso involves significant deployment costs and risks. Similarly,a major limitation to large-scale deployment of PMUs is theirhigh capital cost. Also, PMUs can be exposed to GPS spoofingattacks [4]. Other defence methods against FDIAs are basedon offline methodologies that often do not consider dynamicsystem models and require adversaries to possess systemparameters and network topology information. In addition,existing data-driven solutions involve high computational cost(e.g, nonlinear optimizations) that constitutes a major obstaclefor their use in practical real-time systems [3].
In this paper, a data-based approach is proposed to detectFDIAs within SCADA measurements. The method relies onan anomaly detection scheme that applies Local Outlier Fac-tor (LOF) analysis techniques. We leverage the correlationamong measurements over multiple time instants. Anomalousdata points in the current SCADA measurement snapshot areidentified by measuring their local deviation with respect totheir neighbours. The algorithm requires no prior knowledgeof system parameters or topology. In order to alleviate thehigh dimensionality of system data, the algorithm uses spec-tral methods in the unsupervised learning process to reducedimensionality and transform the data to a new space.
The proposed scheme detects the presence of FDIAs. Ifthere is no FDIA, the SE results can be reliably used formonitoring and control. If FDIA is detected, the processingof the faulty measurements must allow SE to run again andproduce accurate results. In this work, the data outliers aremarked as the attacked measurements. Typically, the attackeddata are removed from the measurement set so that willnot impact the final SE solution. However, the removal ofthe attacked measurements will cause the system to becomeunobservable and result in unavailable SE. In order to handlethis problem, instead of removing these measurements, wereplace them by forecasted data. For the DSE, a regressionanalysis method is utilized to calculate the power system statetransition matrix [5]. For the SSE, we implement a forecastingalgorithm that is based on the economic dispatch of the system,the load forecasts, and the generation schedules [6].
The rest of this paper is organized as follows. In Section II,the detection of FDIAs as outliers is presented. The proposedstrategy and forecasting algorithms are shown in Section III.The effectiveness of our scheme is evaluated in Section IV.

IEEE D&T, SPECIAL ISSUE ON CYBER SECURITY FOR EMBEDDED CONTROLS IN CYBER-PHYSICAL SYSTEMS, 2018 2
II. PROBLEM FOUNDATION
In the linear (DC) form of SE, state variables include thevoltage angles while bus voltage magnitudes are set constantand equal to one. Branch resistances and shunt elements areassumed to be negligible and angle differences between busesto be small. The relationship between measurements and statevariables is based on the following linear function:
z =Hx+ e (1)
where H ∈ Rm×n denotes the linear function determinedaccording to the physical structure of the system. x ∈ Rn×1
is the vector of the state variables of a system with cardinalityS, where n = 2S−1, and z ∈ Rm×1 is the vector of SCADAmeasurements. e ∈ Rm×1 is the vector of measurement errors.
The measurements obtained from the SCADA system aretypically updated once every 4-8 seconds, and form themeasurement matrix Z, that is a m × τ matrix representingthe data collected from p SCADA sensors (p ≤ m) within τtime instants. The measurement matrix Z can be decomposedinto:
Z =M +A (2)
where M is a matrix containing the true SCADA mea-surements without FDI data, and the non-zero elements ofmatrix A represent FDI measurements. A coordinated FDIAat at time instant t is considered to be undetectable ifzt = Hxt + rt and φ(rt) ≤ ε, where rt is the vector ofmeasurement residuals at time instant t and φ(·) denotes theresidual-based bad data detection criterion.
Most of the bad data detection schemes are based on the χ2-test or the largest normalized residual method. Consequently,they rely on the network topology of the system, i.e., on thepower flow equations and the SCADA measurements obtainedfrom single time instants. Thus, a coordinated attack at canbe successful if the relationship between xt and zt is satisfiedwithout gross error. In order to overcome the above limitations,we consider the correlation of measurements among multiplesensors and multiple time instants.
Our threat model considers FDIAs affecting a limited num-ber of measurements µ from q SCADA meters, where µ ≤ mand q ≤ p. Hence, A is a sparse matrix with only a few non-zero elements, and as a result the measurement matrix Z has ahigher rank compared to matrix M . In addition, the low rank ofmatrix M under operating state indicates a high degree of cor-relation among attack-free measurements [7]. Since the rankof a matrix corresponds to the maximal number of linearlyindependent columns, the presence of FDIAs contributes to ahigher number of linearly independent measurement vectors[8], i.e., attack-free SCADA measurements have a higherdegree of correlation compared with FDI measurements.
The evaluation of cross-correlation seeks to identify theexistence of similar behavior in the measurement patternsof different SCADA meters. This can be demonstrated inFig. 1a in which a fault (as an eventful condition) causesthe voltages at the same geographical region to have similarbehavior due to their strong correlation. When a FDIA ispresent, the correlation of voltage tends to be weaker compared
(a) (b)
Fig. 1: IEEE 14 system data under FDIA: (a) V1,2,13,14 after a fault(20s) is applied on the 13-14 line while a FDIA exists (5s − 15s)on V13, (b) auto-correlation of Q51 measurements for 33.6 mins(SCADA measurements every 5 secs). If FDI measurements exist(red), the SE solution of δ2 deviates from the true value by ≥ 0.02.
with measurements from sensors without attacks. We alsoconsider the temporal patterns and periodicity in each sensor’smeasurements: we examine the auto-correlation function foreach meter at different lags. Fig. 1b shows the auto-correlationfunction for a sensor reporting the reactive power flow betweentwo buses. Data exhibit periodicity in their behavior. DuringFDIAs, the auto-correlation tends to have outlier behaviorwhich deviates from the attack-free auto-correlation function.
The SCADA measurements in different time instants fromindividual meters demonstrate correlation and periodicity. Dueto the degree of correlation in the scenario of FDIAs, we utilizedensity-based outlier detection methods to detect false datain SCADA measurements by measuring the distance metricsof outlier correlation behavior. The key idea is to track thedynamics of the current measurements (compared to historicalmeasurements) and filter out inconsistent points due to theirrelative outlier correlation in both spatial and temporal space.
III. METHODOLOGY
This section explains the data-driven methodology for de-tecting FDIAs. The proposed scheme is independent of at-tacker resources and system configurations. It also coversbroad attack scenarios without relying on infrastructure secu-rity mechanisms or the addition of new measurements into SE.The implementation outline is shown in Fig. 2. It makes use ofthe existing SCADA measurements in an anomaly detectionmodule and utilizes existing work on predicting measurementsas a way to process FDI-attacked measurements.
The measurements obtained from RTUs contain local analogand status quantities of each power system area. Typical statusdata are the status of breakers and disconnect switches whichdetermine the network topology. The operating system state isconstructed from analog data including a) voltage magnitudes,b) real and reactive power flows, and c) current magnitudes,by means of SE. The analog measurements are fed intoour data-based anomaly detection module that leverages thecross- and auto-correlation among multiple time-instants, anddetects local outliers using density-based techniques. Unsu-pervised density-based methods, however, are characterize byhigh computational complexity and low performance on high-dimensional spaces. Hence, our detection module first reducesthe input dimensionality of data alleviating the effect of thecurse of dimensionality and improving detection performance.

IEEE D&T, SPECIAL ISSUE ON CYBER SECURITY FOR EMBEDDED CONTROLS IN CYBER-PHYSICAL SYSTEMS, 2018 3
Fig. 2: Overview of the data-based approach for detecting false data injection attacks.
The estimation process includes static and dynamic algo-rithms. Dynamic-based SE is similar to the static one exceptthat the state can be predicted from previous network statevalues so that an a priori value for the network state is avail-able when the measurements are incorporated. In order to dealwith undetectable FDIAs able to bypass bad data detection,both DSE and SSE algorithms take as input measurementsthe filtered data of the anomaly detection scheme. Also, theSE module uses the output of the topology processor to updateits current network model. In the presence of PMUs, the SEcould potentially utilize real-time data from PMU deploymentsobtained from a separate communication network.
The anomaly detection algorithm filters and removes faultydata so that they will not affect the final SE. However, it isrequired that the system state can be computed from existingdata (system observability). Therefore, SE incorporates twoforecasting algorithms from literature. For SSE, real-timeshort-term load forecast information (at the individual buslevel) and generation schedule data which are available as partof the real-time energy markets are fed as inputs. The DSEforecasting algorithm relies on regression analysis to calculatethe power system state transition matrix. This matrix is usedto predict the system state which is subsequently correctedthrough extended Kalman filter. The result of the SE routine,as a key function of the Energy Management System (EMS), isthen used to perform various tasks, e.g., contingency analysiswhich determines the ability of the grid to tolerate failures.
A. Anomaly Detection
Let Z(t) be the matrix obtained at the time t, and eachcolumn denotes the measurements acquired from each sensor.Since the number of meter measurements m must be ≥ thanthe number n of state variables x in order for x at each bus tobe determined (the system becomes observable), the numberof dimensions would greatly affect the performance of theanomaly detection scheme. Thus, we map each column of Z(t)to a dimensionality reduced subspace and then examine itsoutlier behavior according to a distance function that quantifiesthe similarity between each sensor at multiple time instants t.
We consider the following problem: given a high dimen-sional dataset Z(t) = [Z1(t), ..., Zp(t)] where Zi(t) ∈ Rm,how can we compute p corresponding output patterns ψ ∈ Rd
that provide a low dimensional representation of the datasetwith d � m. In our work we examine different spectralmethods for dimensionality reduction: Principal ComponentsAnalysis (PCA), Metric Multidimensional Scaling (MDS), andLaplacian Eigen-Maps (LEM) [9]. Given a set of data on ndimensions, PCA aims to find a linear subspace of dimensiond lower than m. MDS is a form of non-linear dimensionalityreduction which addresses the problem of constructing a con-figuration of t points in Euclidean space by using informationabout the distances between the t patterns. LEM is a graph-based method that computes the k-nearest neighbors of theinput patterns, constructs a weighted graph based on theseneighborhood relations, derives a matrix and then produces anembedding from the top or bottom eigenvectors of this matrix.
The outlier behavior of the dimension-reduced dataset iscalculated using the Local Outlier Factor (LOF), a density-based method that computes the degree of being an out-lier for each instance based on the local density around it[10]. LOF takes as input the dimensionality reduced datasetΨ = {ψ(i)}Di=1, and iterates over all the dataset instancesD and the neighbor k values between kmin and kmax. Thealgorithm returns the scores for each data instance and thetop n outliers are reported by sorting the scores. Due to thelocal approach, LOF allows to identify outliers in a datasetthat would not be outliers in another area of the dataset. Theresulting LOF quotient-values, however, are hard to interpret:in one dataset, a value of 1.1 may already be an outlier,in another dataset and parameterization (with strong localfluctuations) a value of 2 could still be an inlier. Also, LOF isoften more applicable to low-dimensional vector spaces. Thus,we also employ LOF-based Feature Bagging (FB) to detectoutliers in high-dimensional and noisy datasets [11].
In our work, FB for outlier detection runs LOF on multipleprojections. Multiple classifiers are trained on random featuresubsets, thus high dimensional data are more easily processed.Also, the accuracy of the learner is less affected by the noisydataset features. The outlier scores are combined to obtain thefinal outlier scores for each instance using two approaches:breadth-first and cumulative-sum combinations. The breadth-first combine method a) sorts all outlier score vectors, b)takes the data samples with the highest score from all outlierdetection algorithms, and c) appends their indices at the end
IEEE D&T, SPECIAL ISSUE ON CYBER SECURITY FOR EMBEDDED CONTROLS IN CYBER-PHYSICAL SYSTEMS, 2018 4
of the final index vector (and so on). Cumulative-sum sums upall the score vectors and returns the result as the final outcome.
B. Forecasting
In order to deal with the removal of attacked measurementswhile retaining the system observability, we implement twoforecasting approaches from literature [5], [6]. The forecastedmeasurements are regarded as pseudo measurements to in-crease observability and enable both DSE and SSE to beperformed successfully.
The implemented DSE algorithm is based on extendedKalman filtering and is comprised of three main stages: systemstate model identification, state forecasting, and state filtering.The “dynamic model” of the system and the forecasting of thestate covariance matrix are shown below:
x̃k+1 = Fkx̂+ vk
Rx̃k+1= FkRx̂F
Tk +Rvk
(3)
where k is the time sample, x̂ ∈ Rn×1 is the filtered/estimatedstate vector, Fk ∈ Rn×n is the state transition matrix, vkrepresents the modeling uncertainties with a white gaussiannoise with zero mean, Rx̃k+1
is the forecasted state’s errorcovariance matrix, Rx̂ is the filtered state’s error covariancematrix, and Rvk
is the model error covariance matrix [5].Our DSE forecasting scheme is based on how Fk is calcu-
lated. Similar to [5], we adopt a block diagonal form of Fk andregression analysis is utilized to identify the matrix parameters.We take into consideration that the effect of adjacent buseswill result in a non-diagonal and non-constant Fk which isupdated in certain time intervals. Hence, based on a numberof historical terms of state variables, a sliding observationwindow Wsl is used to forecast the dynamic system state.
The SSE forecasting algorithm is based on the utilization ofload forecasts and generation schedules [6]. The topology ofthe network as well as the real-time generation schedules andforecast information obtained from the real-time markets, arefed as an input to an economic dispatch algorithm shown inEq. 4. The goal is to obtain the optimal generation setpointsfor the next SSE interval.
min
g∑i=1
CCi(Pgeni)
g∑i=1
Pgeni − Ploss(Pgen)− Ptotal load = 0
Pmingeni ≤ Pgeni ≤ Pmax
geni ,∀i = 1, ..., g
Pgeni ≥ 0,∀i = 1, ..., g
(4)
CCi is the cost curve of each of the g generators, Pgeni isthe output of the ith generator, Ploss are the transmission linelosses, Ptotal load is the total system load obtained from loadforecasts, and Pmin
gen and Pmaxgen represent generators limits. The
estimated generation setpoints are utilized in solving the SSEproblem via the Dishonest Gauss Newton power flow iterativetechnique [12]. The result of the power flow solution providesthe predicted state variables based on the load forecasts.
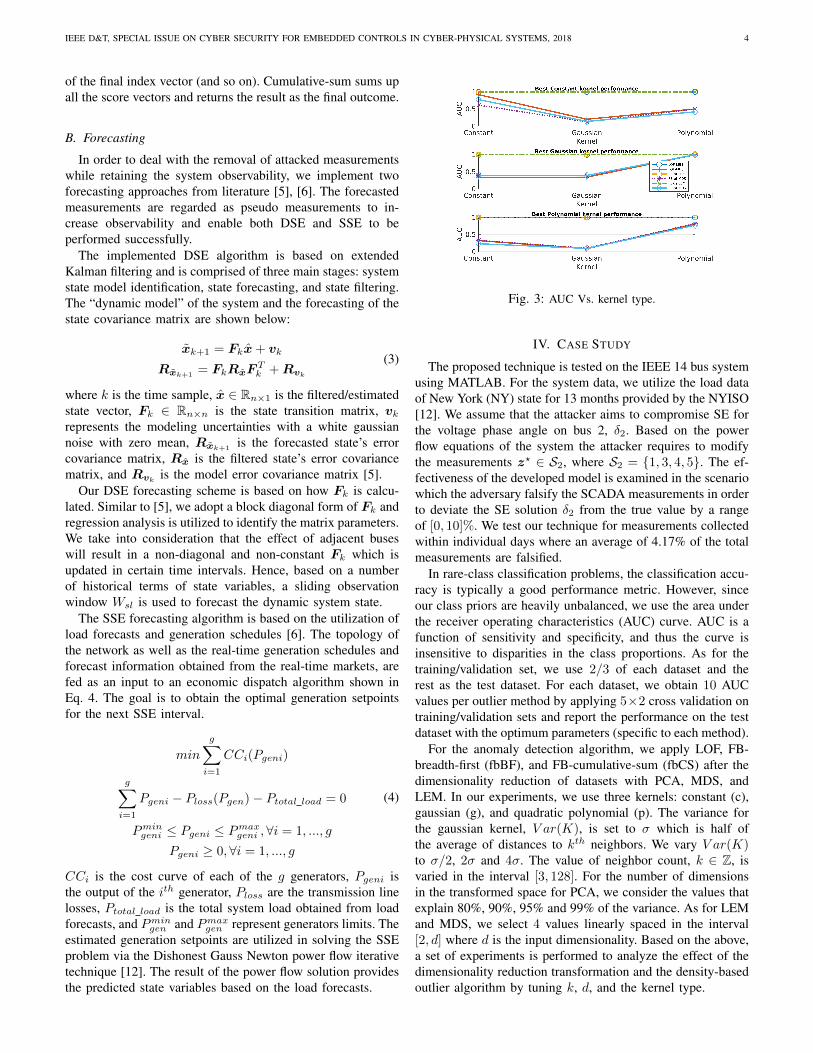
Fig. 3: AUC Vs. kernel type.
IV. CASE STUDY
The proposed technique is tested on the IEEE 14 bus systemusing MATLAB. For the system data, we utilize the load dataof New York (NY) state for 13 months provided by the NYISO[12]. We assume that the attacker aims to compromise SE forthe voltage phase angle on bus 2, δ2. Based on the powerflow equations of the system the attacker requires to modifythe measurements z? ∈ S2, where S2 = {1, 3, 4, 5}. The ef-fectiveness of the developed model is examined in the scenariowhich the adversary falsify the SCADA measurements in orderto deviate the SE solution δ2 from the true value by a rangeof [0, 10]%. We test our technique for measurements collectedwithin individual days where an average of 4.17% of the totalmeasurements are falsified.
In rare-class classification problems, the classification accu-racy is typically a good performance metric. However, sinceour class priors are heavily unbalanced, we use the area underthe receiver operating characteristics (AUC) curve. AUC is afunction of sensitivity and specificity, and thus the curve isinsensitive to disparities in the class proportions. As for thetraining/validation set, we use 2/3 of each dataset and therest as the test dataset. For each dataset, we obtain 10 AUCvalues per outlier method by applying 5×2 cross validation ontraining/validation sets and report the performance on the testdataset with the optimum parameters (specific to each method).
For the anomaly detection algorithm, we apply LOF, FB-breadth-first (fbBF), and FB-cumulative-sum (fbCS) after thedimensionality reduction of datasets with PCA, MDS, andLEM. In our experiments, we use three kernels: constant (c),gaussian (g), and quadratic polynomial (p). The variance forthe gaussian kernel, V ar(K), is set to σ which is half ofthe average of distances to kth neighbors. We vary V ar(K)to σ/2, 2σ and 4σ. The value of neighbor count, k ∈ Z, isvaried in the interval [3, 128]. For the number of dimensionsin the transformed space for PCA, we consider the values thatexplain 80%, 90%, 95% and 99% of the variance. As for LEMand MDS, we select 4 values linearly spaced in the interval[2, d] where d is the input dimensionality. Based on the above,a set of experiments is performed to analyze the effect of thedimensionality reduction transformation and the density-basedoutlier algorithm by tuning k, d, and the kernel type.

IEEE D&T, SPECIAL ISSUE ON CYBER SECURITY FOR EMBEDDED CONTROLS IN CYBER-PHYSICAL SYSTEMS, 2018 5
(a) (b) (c)
(d) (e) (f)
Fig. 4: (a), (b), (c): AUC vs. neighbor count, (d), (e), (f): AUC vs. input dimensionality.
(a) (b)
Fig. 5: δ2 for 500 time samples using (a) DSE (mean square error∆δ = 0.0000193) and (b) SSE (∆δ = 0.0108) forecasting.
Fig. 3 shows the AUC values for each kernel on the dataset.The parameters of evaluation of other kernels in each graphare based on the k and d values that give the best performanceof the evaluated kernel. The LEM-based transformation is lessaffected by the choice of kernel and exhibits an AUC closeto 1. On the other hand, the performance of MDS variesdepending on the kernel. For instance, with the quadratickernel has better performance compared to the gaussian kernel.
The effects of neighbor count and dimensionality are pre-sented in Fig. 4. First for each outlier detection method andkernel type, we find the best input dimensionality and calculatethe AUC values for different neighbor counts (Fig. 4 (a)-(c)).It can be observed that the dimensionality reduction schemesexhibit unstable behavior as the performance relies heavily onthe selection of a good neighbor count. Still, the overall per-formance of LEM is better compared to MDS. Similarly, weexamine how the performance of the outlier detection methodsis changed as the number of dimensions d varies (Fig. 4 (d)-
(f)). For each method we present the AUC values obtained bythe best performing kernels and neighbor count with differentnumber of dimensions. The datasets are represented well inlow dimensionality; adding more dimensions d allow to reachhigher AUC values if d < 10, otherwise the performancedecreases dramatically with higher dimensions.
Fig. 4 also reveals that the dimensionality reduction withPCA leads to robust AUC values in regards to the choice of kand d. This stems from the DC model utilized in this study aswell as the linear interdependencies between various systemmeasurements. Also, LEM provides better results comparedto MDS: LEM maps similar instances to closer points inthe new space, thus increasing the differences in the localdensities and enable the detection of outliers. Of the threeoutlier detection techniques, no single one showed an overallperformance superiority. The AUC values rely mostly on thedimensionality tranformation. In several cases, however, FBdemonstrates performance improvement in higher dimensions(such datasets are more easily processed compared to LOF).
In order to demonstrate the effects of the implementedforecasting algorithms, we remove the falsified measurementsand replace them with the forecasted values such that DSEand SSE to be performed successfully. For the dynamicregression model the sliding window observation interval isselected Wsl = 1000. Similar to [5], an increase in the slidingwindow length does not necessarily increase the forecastingaccuracy drastically. For the forecasting algorithm based onthe economic dispatch, the performance relies heavily on theavailability of accurate real-time, short-term load forecasts.Fig. 5 presents the predicted and actual values of δ2 for both

IEEE D&T, SPECIAL ISSUE ON CYBER SECURITY FOR EMBEDDED CONTROLS IN CYBER-PHYSICAL SYSTEMS, 2018 6
algorithms in random 500 time slot windows. The resultsvalidate the modeling of the system state utilizing previoushistorical values, load forecasts and generation schedules.
V. CONCLUSION
In this paper, we propose a data-based anomaly detectionalgorithm to detect FDIAs towards SCADA measurements byapplying density-based analysis techniques after dimensional-ity reduction. The approach requires no prior knowledge onsystem parameters or topology. The proposed strategy also ad-dresses the handling of critical measurements by implementingboth dynamic and static forecasting algorithms.
REFERENCES
[1] Y. Liu, P. Ning, and M. K. Reiter, “False data injection attacks againststate estimation in electric power grids,” ACM Transactions on Informa-tion and System Security (TISSEC), vol. 14, no. 1, p. 13, 2011.
[2] G. Liang, S. R. Weller et al., “The 2015 ukraine blackout: Implicationsfor false data injection attacks,” IEEE Transactions on Power Systems,vol. 32, no. 4, pp. 3317–3318, 2017.
[3] G. Liang, J. Zhao, F. Luo, S. R. Weller, and Z. Y. Dong, “A reviewof false data injection attacks against modern power systems,” IEEETransactions on Smart Grid, vol. 8, no. 4, pp. 1630–1638, 2017.
[4] C. Konstantinou, M. Sazos et al., “GPS spoofing effect on phase anglemonitoring and control in a real-time digital simulator-based hardware-in-the-loop environment,” IET Cyber-Physical Systems: Theory Appli-cations, vol. 2, no. 4, pp. 180–187, 2017.
[5] M. Hassanzadeh and C. Y. Evrenosoglu, “A regression analysis basedstate transition model for power system dynamic state estimation,” inNorth American Power Symposium (NAPS). IEEE, 2011, pp. 1–5.
[6] A. Ashok, M. Govindarasu, and V. Ajjarapu, “Online detection ofstealthy false data injection attacks in power system state estimation,”IEEE Transactions on Smart Grid, vol. PP, no. 99, 2017.
[7] L. Liu, M. Esmalifalak et al., “Detecting false data injection attacks onpower grid by sparse optimization,” IEEE Transactions on Smart Grid,vol. 5, no. 2, pp. 612–621, 2014.
[8] M. Wu and L. Xie, “Online detection of low-quality synchrophasormeasurements: A data-driven approach,” IEEE Transactions on PowerSystems, vol. 32, no. 4, pp. 2817–2827, 2017.
[9] A. Ghodsi, “Dimensionality reduction a short tutorial,” Department ofStatistics and Actuarial Science, Univ. of Waterloo, Ontario, Canada,vol. 37, p. 38, 2006.
[10] M. M. Breunig, H.-P. Kriegel et al., “Lof: identifying density-basedlocal outliers,” in ACM sigmod record, vol. 29, no. 2. ACM, 2000, pp.93–104.
[11] A. Lazarevic and V. Kumar, “Feature bagging for outlier detection,” inProceedings of the eleventh ACM SIGKDD international conference onKnowledge discovery in data mining. ACM, 2005, pp. 157–166.
[12] C. Konstantinou and M. Maniatakos, “A case study on implementingfalse data injection attacks against nonlinear state estimation,” in Pro-ceedings of the 2nd ACM Workshop on Cyber-Physical Systems Securityand Privacy. ACM, 2016, pp. 81–92.
Charalambos Konstantinou (S’11-M’18) receivedhis Ph.D. in Electrical Engineering from NewYork University (NYU), NY and the Dipl.-Ing.(M.Eng.) degree in Electrical and Computer En-gineering from National Technical University ofAthens (NTUA), Greece. He is currently an Assis-tant Professor of Electrical and Computer Engineer-ing with Florida A&M University and Florida StateUniversity (FAMU-FSU) College of Engineeringand an affiliated faculty with the Center for Ad-vanced Power Systems (CAPS) at FSU. His research
interests focus on cyber-physical, industrial control, and embedded systemssecurity.
Michail Maniatakos (S’08-M’12-SM’17) is an As-sociate Professor of Electrical and Computer Engi-neering at New York University (NYU) Abu Dhabi,Abu Dhabi, U.A.E. He received his Ph.D. in Electri-cal Engineering from Yale University, New Haven,CT, USA, in 2012. He is the Director of theModern Microprocessor Architectures Laboratory(nyuad.nyu.edu/momalab) and his research interestsinclude privacy-preserving computation and indus-trial control systems security.