ieee access journal, vol. xx, no. xx, january 20xx 1 call … · 2018-08-01 · ieee access...
TRANSCRIPT

IEEE ACCESS JOURNAL, VOL. XX, NO. XX, JANUARY 20XX 1
Call Detail Records Driven Anomaly Detection andTraffic Prediction in Mobile Cellular Networks
Kashif Sultan, Hazrat Ali, Zhongshan Zhang*
Abstract—Mobile networks possess information about the usersas well as the network. Such information is useful for makingthe network end-to-end visible and intelligent. Big data analyticscan efficiently analyze user and network information, unearthmeaningful insights with the help of machine learning tools.Utilizing big data analytics and machine learning, this workcontributes in three ways. First, we utilize the call detail records(CDR) data to detect anomalies in the network. For authenticationand verification of anomalies, we use k-means clustering, anunsupervised machine learning algorithm. Through effectivedetection of anomalies, we can proceed to suitable design forresource distribution as well as fault detection and avoidance.Second, we prepare anomaly-free data by removing anomalousactivities and train a neural network model. By passing anomalyand anomaly-free data through this model, we observe the effectof anomalous activities in training of the model and also observemean square error of anomaly and anomaly free data. Lastly, weuse an autoregressive integrated moving average (ARIMA) modelto predict future traffic for a user. Through simple visualization,we show that anomaly free data better generalizes the learningmodels and performs better on prediction task.
Keywords—Anomaly, Call Data Records, Data Analytics.
I. INTRODUCTION
MOBILE technologies and cellular networks are gettingsmarter day by day, so mobile phone devices such
as smartphones, tablets, wearable devices as well as mobilephone subscribers are increasing rapidly. According to reportpresented by Ericsson, the mobile devices have surpassedthe world population [1]. Due to such a huge growth inmobile devices and mobile phone subscribers, the congestionof mobile network is not unusual. Hence the provision of bestquality of services for such a huge number of mobile phonesubscribers is challenging. With the massive growth of mobiledevices and mobile phone subscribers, the data generatedfrom these devices is increasing explosively. According to
Kashif Sultan and Zhongshan Zhang are with School of Com-puter and Communication Engineering, University of Science and Tech-nology Beijing, 30 Xueyuan Road, Haidian District, Beijing, 100083,PR China. e-mail: kashif [email protected]; kashif [email protected];[email protected]
Hazrat Ali is with Department of Electrical Engineering, COMSATSUniversity Islamabad, Abbottabad Campus, 22060, Abbottabad, Pakistan. e-mail: [email protected]. ORCID: https://orcid.org/0000-0003-3058-5794
Manuscript received February 2018; revised xx xx, 2018.This work was supported by the key project of the National Natural Science
Foundation of China (No. 61431001), Beijing Natural Science Foundation(L172026), Key Laboratory of Cognitive Radio and Information Processing,Ministry of Education (Guilin University of Electronic Technology), andthe Foundation of Beijing Engineering and Technology Center for Conver-gence Networks and Ubiquitous Services (*Corresponding author: ZhongshanZhang)
CISCO survey, the data increased 4000-fold during the lastten years [2]. From CISCO report, global mobile data trafficis generating 24 Exabyte (EB) data per month and this trendis continuously rising [2]. This huge data has following 4Vscharacteristics making it different from the traditional data.Volume: The data has very large volume; of order of picobytes(PB). As reported in [3], 12 Terabytes (TB) data is generatedby Twitter every day. On average, 1.2 Zeta bytes of datais being produced every year since 2012 and this value iscontinuously rising [4], [5].Velocity: The flow rate of data at which the data goes in or outfrom mobile devices and mobile network is termed velocity ofdata. This determines the dynamic nature of the data and bigdata is highly dynamic.Variety: This huge and dynamic data comes from varioussources and occurs in different formats such as structured,unstructured and semi-structured.Value: According to IDC report, a very famous group for bigdata research activities, big data technologies describes a newgeneration of technology, designed to extract value from a hugevolume of a wide variety of data [6].
Fig. 1: Attributes of big data
From the above discussions, data with 4Vs characteristics(volume, velocity, variety and value) is known as big data.The 4Vs characteristics of big data is shown in Figure 1.Hence, the management and analysis of such big data is termedas big data analytics. Big data analytics is a broader termand encompasses hardware and software solutions for efficientanalysis and management of the data. In big data analytics,statistical machine learning and algorithms are applied on vastamount of complex data, which unveil hidden information fromthe data [7]. Big data analytics is different from the traditionaldata analytics. As in traditional data analytics, we chooseonly random samples from the entire data set and apply dataanalytics on selected partial dataset. Decisions are made on thebasis of data analysis of partial dataset. Hence results obtained
arX
iv:1
807.
1154
5v1
[cs
.LG
] 3
0 Ju
l 201
8

IEEE ACCESS JOURNAL, VOL. XX, NO. XX, JANUARY 20XX 2
from this partial data analytics are not essentially accurateand precise. Not long ago, big data anlaytics and machinelearning tools were not developed enough to analyze entiredataset, attributed to limitations on available computationalresources. Recently, with advancements in such technologies,the analytics of big datasets has become feasible. Hence, theresults generated by big data analytics are more precise andaccurate as compared to traditional analytics. For networkdata analytics applications such as network optimization, re-source allocation, identification of sleeping cells and proactivecaching, we need accurate and precise information, which canbe obtained through big data analytics.
With emergence of 5G networks, there will be hundredsof billions of connected devices [8] and comparable numberof network nodes. Hence, by analyzing information suchas call details record (CDR) information, reference signalreceive power (RSRP), and location information from corenetwork and radio access nodes, one can improve the networkperformance as well as give the best quality of service (QoS)and quality of experience (QoE) to mobile phone subscribers.
In this work, we exploit the CDR information of mobilenetworks. This CDR information helps in determining theuser activities at a particular date and time. In this work,we name the unexpected or abnormal behavior of the useras an anomaly. Such type of unusual activity degrades thenetwork performance. Anomalies in the network may occurdue to different issues such as network failure, sleeping cells,overloading of traffic and low coverage area. Hence, successfulanomaly detection and anomaly removal are useful in opti-mizing network performance. We will discuss this in detail insubsequent section. This paper contributes as below:
• We present a concept of identifying anomalies inCDR data and verify the anomalies through clus-tering algorithm. We then provide an insight intohow the anomalous data can be removed to obtainanomaly free data.
• We present an artificial neural network modeltrained with anomalous as well as anomaly freedata. Through mean square error calculation, weshow that the neural network model learns betterinformation from the data if the anomalies areremoved.
• We also explore the use of ARIMA model for futureactivity prediction of mobile subscribers.
The rest of the paper is organized as follows: In Section IIwe discuss related work. In Section III we describe importanceand use case of CDR data analytics in optimizing networkperformance and improving the QoS for mobile subscribers.In Section IV, we present the system model and also describethe dataset used. We present anomaly detection by groundtruth data and machine learning algorithms and discuss theverification in Section V. In Section VI, we present neuralnetwork based training model for comparing mean squareerror of anomaly and anomaly-free data. In Section VII wepresent ARIMA model for predicting future activities of theuser. Finally, we conclude our work in Section VIII.
II. RELATED WORK
Anomaly detection has been reported before in work assummarized below:
Naboulsi et al., [9] presented a framework, in which alarge scale CDR dataset was sub-categorized according to thehistory of activities. The framework reported in [9] determinesthe irregular and unexpected activities termed as anomalies.The authors in [10], [11] used k-means clustering techniquesfor determining regions of interest such as commercial areas,residential areas, office areas, and recreational areas etc. Theauthors in [12], [13] also used k-means clustering for anomalydetection purpose. The authors divided data into clusters ofanomalous data and normal data. The authors in [14] analyzedCDR information of wireless network and detected anomaliesby rule based approach. Authors in [15], [16] presented thesignificance of CDR data analysis in case of natural disasters.
The CDRs being generated daily are huge in number. TheCDR data contains valuable insights that can be used for thebenefit of the network operators as well as subscribers. Amilestone for such a huge CDRs data analysis is presented in[17]. The authors in [17] have presented a stream processingmodel which is able to analyze 6 billion CDRs generated perday. The model has the ability to support higher throughput,lower latency and fault tolerance. Parallel processing, de-duplication and easy to use platform for network operatorsare the main aspects of the model.
The authors in [18] presented a big data analytics basedmodel for optimizing 5G networks and showed that thenetwork will be faster and proactive with the aid of bigdata analytics. The authors in [19] showed that bandwidth(resource) can be efficiently distributed with the aid of big dataanalytics. The authors in [20] presented that self-organizingnetwork (SON) which will be used for enabling 5G, canbe efficiently implemented with big data analytics. Such aframework based on SON was named a BSON [20]. Theauthors in [21] showed that big data analytics will be helpfulfor proactive caching which is very important for empowering5G.
Motivated from the literature, we use k-means clusteringalgorithm and detect the anomalous behavior of the users. Ourwork is different from the previously reported work which waslimited to anomaly detection only. We perform verificationof the anomaly detection through comparison with groundtruth data. After successful anomaly detection and verifica-tion, we prepare anomaly-free data. We also train a neuralnetwork model for observing mean square error of anomalyand anomaly-free data. Finally, we train ARIMA predictionmodel for predicting users’ future activities. Furthermore, wediscuss that such type of insights are also helpful towards 5Gnetworks’ requirements such as proactive caching, maximumthroughput and close-to-zero latency.
III. THE IMPORTANCE OF CDR DATA AND USE CASE
CDR data contains information about a subscriber’sphone usage. The CDR data includes identification code ofcaller/receiver, the location of base tower station (BTS), di-rection of the voice call and activity type (i.e., SMS or call).
IEEE ACCESS JOURNAL, VOL. XX, NO. XX, JANUARY 20XX 3
The CDR data of a cellular network can be used for analyzinguser or network behavior. With the aid of CDR data analysis,one may extract information and detect unusual events ofcritical significance e.g., a terrorism activity, earthquakes,floods, Christmas eve, soccer world cup, black Friday etc. Ifthere is any such type of natural or unnatural event, the mobilesubscriber activities (CDR activities) will be increased (or maybe decreased). The CDR activity can also be used to detectthe movements of mobile phone subscriber i.e., the flow ofhumans during a natural disaster occurrence. If CDR activitiesat particular time and location are dramatically increasing, therise in activity level can be linked with events such as a roadaccident on a highway, an usual blast or terror activity in amall, market, earth quake or other natural disaster. Under suchcircumstances, people start calling, texting to their relativesor friends or rescue services resulting in exponential rise inthe CDR activity. People also tend to move away from sucha location directly showing a rise in users’ movement awayfrom a particular location [15], [16]. Thus, CDR data analysisprovides spatio-temporal information of mobile users, whichmeans the exact location and time of a particular event canbe determined. If there is flood, earthquake or any terrorismactivity in a particular region, the CDR activities (calls, SMSs)will be increased in that region as mobile phone subscriberswill give calls, send SMS to other people to inform about suchactivity in that region and will ask for rescue and help. Besides,there will be tendency of movements from the effected locationto safer venues.
If there is information available about the CDR activitiesof a cellular network and a massive increase occurs in CDRactivities at particular day or specific time frame then unusualevents can be anticipated. In the event of unusual circum-stances, provision of rescue services can be accelerated andhelp activity can be enhanced. Thus, precious lives could besaved.
Because of such type of abnormal behavior or anomalousactivities, the performance of network will be down andmobile phones subscribers will have poor QoS. However, afterdetecting and predicting such type of anomalous activitiesfor the next time frame, the network operator can providesome extra resources for specific time frame on a particulararea. In this way the mobile phone subscribers can haveimproved QoS. These extra resource allocation is in the formof allocating more bandwidth to a particular area, increasingnetwork coverage area by sending small cell nodes as drones.Hence, network congestion can be avoided and a better QoScan be ensured. Beside event detection, the analysis of CDRactivity can also be used to enhance the QoS and QoE andof mobile phone subscribers. As CDR dataset has informationabout the number of voice calls, duration of voice calls, callerID, number of SMS, anlaysis of bigger CDR dataset forrecords spanning over several months/years is possible throughmachine learning and big data analytics. We can thus predictmobile subscribers’ behavior i.e., the number of voice calls orthe duration of voice calls for next time slot.
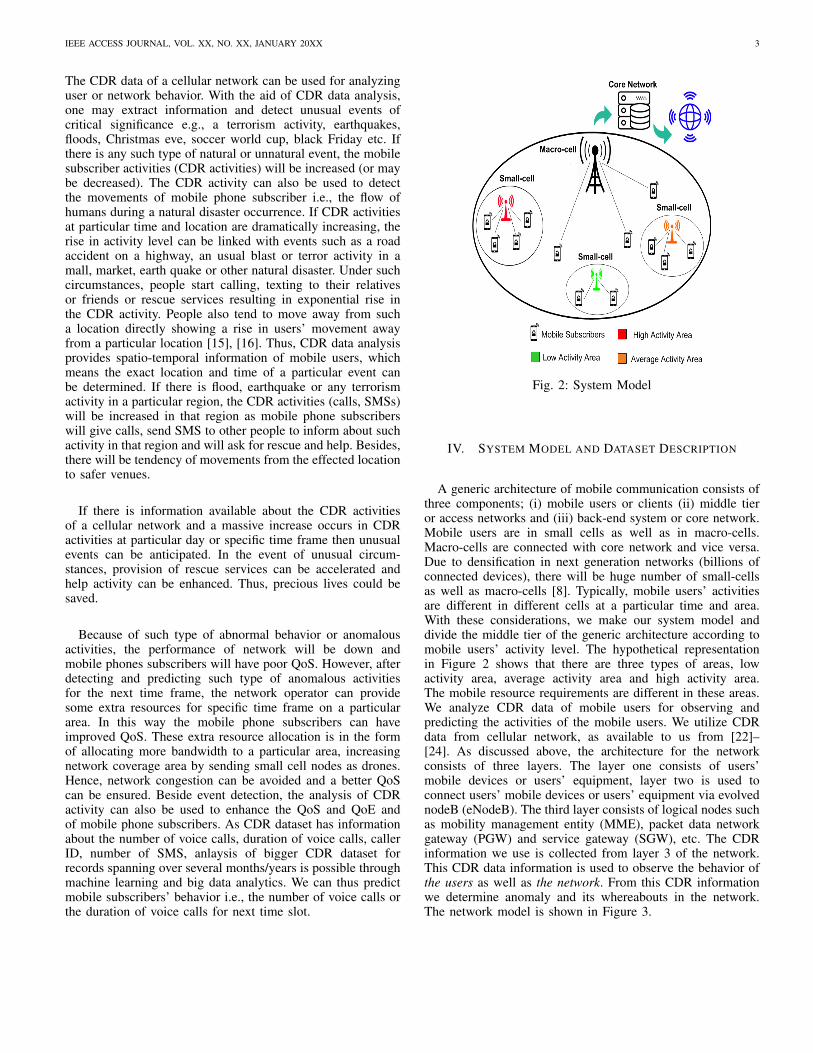
Fig. 2: System Model
IV. SYSTEM MODEL AND DATASET DESCRIPTION
A generic architecture of mobile communication consists ofthree components; (i) mobile users or clients (ii) middle tieror access networks and (iii) back-end system or core network.Mobile users are in small cells as well as in macro-cells.Macro-cells are connected with core network and vice versa.Due to densification in next generation networks (billions ofconnected devices), there will be huge number of small-cellsas well as macro-cells [8]. Typically, mobile users’ activitiesare different in different cells at a particular time and area.With these considerations, we make our system model anddivide the middle tier of the generic architecture according tomobile users’ activity level. The hypothetical representationin Figure 2 shows that there are three types of areas, lowactivity area, average activity area and high activity area.The mobile resource requirements are different in these areas.We analyze CDR data of mobile users for observing andpredicting the activities of the mobile users. We utilize CDRdata from cellular network, as available to us from [22]–[24]. As discussed above, the architecture for the networkconsists of three layers. The layer one consists of users’mobile devices or users’ equipment, layer two is used toconnect users’ mobile devices or users’ equipment via evolvednodeB (eNodeB). The third layer consists of logical nodes suchas mobility management entity (MME), packet data networkgateway (PGW) and service gateway (SGW), etc. The CDRinformation we use is collected from layer 3 of the network.This CDR data information is used to observe the behavior ofthe users as well as the network. From this CDR informationwe determine anomaly and its whereabouts in the network.The network model is shown in Figure 3.

IEEE ACCESS JOURNAL, VOL. XX, NO. XX, JANUARY 20XX 4
Fig. 3: Network Architecture
A. Description of Dataset
We use three different datasets of cellular networks. Thefirst CDR dataset is obtained from CRAWDAD community.CRAWDAD (Community Resource for Archiving WirelessData Dartmouth) is a wireless network data resource forthe research community [22]. Table I shows the CRAWDADdataset and its associated fields. This dataset contains themobile phone records of 142 days from September 2010 toFebruary 2011. The dataset has following fields:Date: The date of the users’ activity are represented asYYYYMMDD. Users’ activity is in the form of incoming call,outgoing call, incoming SMS and outgoing SMS.Time: Time of the users’ activity which is hhmmss.Type: Type of the users’ activity (voice call, SMS).Direction: direction of the users’ activity (incoming or outgo-ing).Duration: Duration of the voice call.
TABLE I: CRAWDED dataset fields
Date Time Type Direction Duration[s]
20100916 130748 Voice Incoming 18
20100916 133131 Voice Outgoing 99
20100916 131324 Voice Incoming 214
20100916 131735 Voice Incoming 72
20100916 135342 Voice Incoming 37
The second CDR dataset is obtained from Nodobo, which isa suite of software developed at the University of Strathclyde,and allows precise capture and replay of smartphone userinteractions sessions [23], [25]. This dataset was collectedduring a study of mobile phone usage of 27 high schoolstudents. The datset contains the mobile records for a periodof six months from September 2010 to February 2011[23]. Table II shows the second dataset and its associatedfields. This dataset includes 13035 voice call records, 83542messages records and other related data. The dataset has thefollowing fields:User: This field contains the ID of the subscriber or caller.Other: This contains ID of the receiver.Direction: Direction of the user’s activity (incoming or
outgoing).Duration: Duration of the voice calls.Timestamp: This field contains date and time of the user’sactivity.
TABLE II: Nodobo dataset fields
User Other Direction Duration Timestamp
7641036117 7588304495 Incoming 1224 Thu Sep 9 19:35:37100 2010
7981267897 7784425582 Outgoing 474 Thu Sep 9 18:43:44100 2010
7981267897 7743039441 Missed 0 Thu Sep 9 19:51:30100 2010
7981267897 7784425582 Outgoing 0 Thu Sep 9 20:57:55100 2010
7981267897 7784425582 Outgoing 605 Fri Sep 10 20:17:00100 2010
The third dataset is obtained from open big data databaseof Dandelion API web forum. The dataset which we use fromthis open big data database is for Telecom Italia. This CDRavailable from the Telecom Italia is for the city of Milano.The dataset includes CDRs for a period of two months fromIst November 2013 to Ist January 2014. Table III representssample of this dataset. This dataset provides the followinginformation:Grid ID: This field contains the identification number of thegrid.Time stamp: The time of the activity (in milisecond).Received SMS: It represents number of SMS received ateach time step.Sent SMS: It represents number of SMS sent at each timestep.Incoming Calls: Duration of the incoming calls.Outgoing Calls: Duration of outgoing calls.
TABLE III: Telecom Italia dataset fields
Grid ID Timestamp ReceviedSMSactivity
SentSMSactivity
IncomingCallsactivity
OutgoingCallsactivity
1 10 0.2724 0.1127 0.0035 0.0807
10 20 0.0101 0.0693 0.0573 0.0446
B. Data Pre-processingThe data from these sources contain missing entries or noise
causing misleading pattern. Data pre-processing step removessuch type of irregularities. Through pre-processing, we obtaindata now ready for further analysis.
V. ANOMALY DETECTION AND VERIFICATION
In this section, we discuss anomaly detection with machinelearning tools. We then verify anomalies through visualization

IEEE ACCESS JOURNAL, VOL. XX, NO. XX, JANUARY 20XX 5
of the ground truth data and comparison with the anomaliesdetected through clustering.
A. k-means Clustering
Clustering is a process of partitioning a group of datainto small number of clusters and sub-groups. In k-meansclustering, ′n′ is number of objects or data points to beportioned and ′k′ is the number of clusters or sub-groups. Thek-means clustering algorithm is summarized in Algorithm 1.
Algorithm 1 Algorithminput← K(number of cluster)input← training set x1, x2, ........, xmxi ∈ <n (drop x0=1 convention )Randomly initialize K cluster centroidsu1, u2, ......, uK ∈ <n
repeatfor i =1 to m doci :=index(from 1 to K) of cluster centroid closed toxi
end forfor k =1 to K douk := average (mean) of points assigned to cluster k
end foruntil (converge)
After k-means clustering, we obtain number of clusters withdifferent data points. Thus, the data is divided into differentclusters. As one can anticipate, cluster of fewer objects or datapoints is the cluster of anomalous activities.
B. Anomaly Detection through Ground truth Data
Figure 4 shows the activity of users over a week fromSeptember 16 to September 24 in the year of 2010. It isobserved from Figure 4 that the activity level is very highin some parts of entire weeks activity. These higher levels areshowing an unexpected and irregular behavior of the users, sowe consider these activities as anomalies. It is also observedfrom entries of the dataset that these anomalies occurred onSeptember 17 (5.32 pm), September 19 (5.40 pm), September22 (12.48 pm) and September 24 (9.37 pm). It can also beobserved from the plot of ground truth data and entries of thedataset that on September 24 during 5pm to 6pm, there waszero activity. These activities are also considered as anomaliesbecause at this time period as zero activity might have beendue to a network failure. Similarly, the users’ activities forsecond and third datasets are shown in Figure 5 and Figure6, respectively. Anomalies in second dataset are also obviousfrom Figure 6. These anomalous activities are also helpfulto identify region of interest (ROI) e.g., locations with highdensity of users such as shopping malls, hospitals, or stadium;or identify events of interest e.g., natural disaster, fatal roadaccidents, or terror activity.
Fig. 4: Anomaly detection with ground truth data (firstdataset)
Fig. 5: Anomaly detection with ground truth data (seconddataset)
C. Anomaly Detection through k-means
As anomalous activities are unexpected and irregular makingthem unique and fewer in number than normal activities.Through k-means clustering algorithms, normal activities aregrouped into the same clusters different than the one in whichabnormal activities are placed. As shown in Figure 7, thereare three clusters. Objects or users which lie in the range of
Fig. 6: Anomaly detection with ground truth data (thirddataset)

IEEE ACCESS JOURNAL, VOL. XX, NO. XX, JANUARY 20XX 6
activity level 1-150 are grouped in cluster 1, users which lie inthe range of activity level 150-400 are grouped in cluster 2 andremaining users with much higher activity level are grouped incluster 3. From figure 7, we observe that most of the users arein cluster 1 and cluster 2. On the other hand, cluster 3 has fewerusers with higher activity level. Cluster 3 represents abnormalactivities of the users and hence characterized as cluster ofanomalous activities. It is verified from Figure 4 and Figure7 that k-means clustering algorithm detects a similar patternof anomalous activities as seen from the plot of ground truthdata. Similarly, Figure 6 and Figure 8 verify the anomalies forthe second dataset.
As in case of future generation network or 5G, which will beproactive, have close to zero latency, maximum throughput andconnected with billions of devices [8], the exact prediction ofanomalies will perform a key role in fulfilling requirements ofthese networks. For implementation of such ultra fast hyperdense networks (5G), there must be intelligent predictionmodel that could forecast the future activities. The fuel ofsuch model is precise and accurate information. For exampleif prediction model is not trained with clean and anomaly-freedata, the model would fail to predict. In the next section, wepresent an approach to prepare anomaly-free data and passit through neural network based training model and ARIMAtime series prediction model for observing error difference andpredicting future activities.
Fig. 7: Anomaly detection through k-means clustering (firstdataset)
VI. PREPARATION OF ANOMALY-FREE DATA AND MEANSQUARE ERROR EVALUATION
A. Preparation of anomaly-free dataAfter detection and verification of anomalies by ground truth
data and machine learning algorithm, we clean the data fromsuch anomalous and abnormal activities making data anomaly-free. For preparation of anomaly-free data, we replace theanomalous activities of the users by average activities of all theusers. Figure 10 and Figure 11 show the anomaly-free data forfirst and second dataset respectively. It is clear from the plotof anomaly-free data that the users’ activities are in a regularpattern. We train neural network model with anomaly as wellas anomaly free data and observe mean square errors.
Fig. 8: Anomaly detection through k-means clustering(second dataset)
Fig. 9: Anomaly detection through k-means clustering (thirddataset)
B. Mean Square Error Evaluation
For observing error difference in anomaly and anomaly-freedata, we train a neural network model. We pass anomalous andanomaly-free data through this model and observe mean squareerror. Figure 12 shows the mean square error for anomalousand anomaly-free data. It is observed that the mean squareerror of test, train and validation data is high when anomalous
Fig. 10: Anomaly-free data (first dataset)

IEEE ACCESS JOURNAL, VOL. XX, NO. XX, JANUARY 20XX 7
Fig. 11: Anomaly-free data (second dataset)
data is passed through the model. On the other hand, whenthe model is trained with anomaly free data, the overall meansquare error is decreased. The mean square error of anomalousand anomaly-free data of second dataset is shown in Figure 13.In order to highlight the significance of the pre-processing stepfor data pre-preparation, it is important to use a numeric metric.We calculate the mean square error for the model training withboth anomalous and anomaly-free data. Thus, the mean squareerror serves as a numeric parameter to ascertain the impact ofoutliers in the cellular data. The mean square error calculationfor both the datasets shows that anomaly free data help usdevelop a better model (as shown in Figure 12 and Figure 13.
The effect of the mean square error can be severe, dependingupon the target of the model. For example in the case ofsleeping cell detection, if anomalous data is used in the model,then the model would not be able to detect sleeping cellscorrectly. Under worst scenarios, this may lead to networkoutage as a consequence of denial of service for newer devices.
Fig. 12: Left: MSE of training model with anomalous data.Right: MSE of training model with anomaly-free data.
VII. ARIMA TIME-SERIES FORECASTING MODEL
The CDR Datasets which are used in this work are timeseries data. CDR time series data can be used for predictingand detecting future anomalous behavior of the network andsubscribers [26], [27]. Among the time series forecastingmodels, ARIMA is a popular and widely used time-series fore-casting model. ARIMA stands for Autoregressive IntegratedMoving Average. It is generalized auto-regressive model andadds the notion of integration [28]. The keys features of themodel are explained below,
Fig. 13: Left: MSE of training model with anomalous data(second dataset). Right: MSE of training model with
anomaly-free data (second dataset)
AR (Autoregression): This feature uses the dependency rela-tionship between current observations and a specified numberof previous observations. The mathematical representation ofAR(p) is shown in Equation 1. The mathematical represen-tation of auto-regression model in equation 1 shows thatthe variable of interest Yt is predicted by using the linearcombination of its past values (Yt−1):
Yt = c+
p∑i=1
ϕiYt−1 + εt (1)
where ϕi, ..., ϕp are parameters, c is constant and εt is whitenoise.
I (Integrated): This feature is used for making a seriesstationary if it is non-stationary, done by subtracting rawobservations. Mathematically, this feature is represented in theform of Equation 2.
Y‘t = Yt − Yt−1 (2)
Where the consecutive observations are differences i.e., thepast value of the variable (Yt−1) is subtracted from the currentvalue of (Yt).
MA (Moving average): This feature uses dependency be-tween an observation and a residual error from a movingaverage model applied to lagged observations. Equation 3represents MA feature.
Yt = µ+ εt +
q∑i=1
θiεt−1 (3)
where θi, ..., θq are parameters, µ is expectation of Yt and εt, εt−1 are white noise error terms.
ARIMA time series forecasting model works in followingsteps as shown in Figure 14.
A. Data StationarityWe visualize the data and observe increasing or decreasing
trends of the data. This time series data is non-stationary, ascan be observed from Figure 15. We take necessary action tomake the data stationary as required for time series forecastingmodel.
It is typically assumed (and required) for time series fore-casting models that the input data is stationary. If time seriesdata is not stationary, it should be made stationary before

IEEE ACCESS JOURNAL, VOL. XX, NO. XX, JANUARY 20XX 8
Fig. 14: Time series process
Fig. 15: Time series data plot
training a time series forecasting model1. In summary statistics,it is observed that for stationary time series data, mean andvariance should be constant for observations.
For stationarity confirmation of the data, The AugmentedDicky-Fuller (ADF) statistical test is used. ADF test is alsocalled unit root test. The ADF test has two hypothesis; Nullhypothesis and Alternate hypothesis. Null hypothesis suggeststhat time series data has a unit root, so data is non-stationary.Alternate hypothesis suggests that time series data does nothave any unit root implying that data is stationary. Thesehypothesis are interpreted by p value of the ADF test. If p-value is greater than 0.05, null hypotheses is accepted and datais non-stationary. Similarly, if p-value is less than or equal to0.05, null hypothesis is rejected and data is stationary. Wehave applied ADF test on one day’s CDR activities of theusers for confirmation of data stationarization. ADF statisticsof available dataset shows that p-value is 0.6177, implyingthat the data is non-stationary. Hence after confirmation ofnon-stationary behavior of data, we make the data stationaryby differencing. For comparison purpose, non-stationary andstationary time series are plotted together in Figure 16. Theupper part of Figure 16 represents the non-stationary time
1For determining the stationarity of time series models, there are differ-ent methods such as visualizing the time series’s plot, observing summarystatistics, augmented Dickey-Fuller test.
series and the lower part represents the stationary time series.
Fig. 16: Non-stationary and stationary time series. (As CDRactivities of users are aggregated on 10 minutes interval in
available dataset, so x-axis represents the 10 minutesintervals of one day’s CDR activity and y-axis represents
activity level)
B. Parameter EstimationAfter determining and confirming the stationarity of the
time series, the next step is to determine the optimal valueof model’s parameters AR(p) and MA(q). The optimal valuesof p and q is determined with the help of auto-correlationfunction (ACF) and partial auto-correlation function (PACF)plots.
1) Autocorrelation Function (ACF): The plot of ACF inFigure 17 shows the correlation between an observations withlag values. On the x-axis of the ACF plot is number of lagsand on y-axis is the correlation coefficient. The model is ARif the ACF trails off after a lag and has a hard cut-off in thePACF after a lag. This lag is taken as the value for p.
2) Partial Autocorrelation Function (PACF): The plot sum-marizes the correlations for an observation with lag values notaccounted for by prior lagged observations. The model is MAif the PACF trails off after a lag and has a hard cut-off inthe ACF after the lag. This lag value is taken as the valuefor q. The model is a mix of AR and MA if both the ACFand PACF trail off. The plots of ACF and PACF for one day’sCDR activity of the users are shown in Figure 17. The conein the plot represents the confidence interval which shows thatthe correlations outside this cone are very likely a correlation.In the plot of ACF and PACF, all lag values are printed which
IEEE ACCESS JOURNAL, VOL. XX, NO. XX, JANUARY 20XX 9
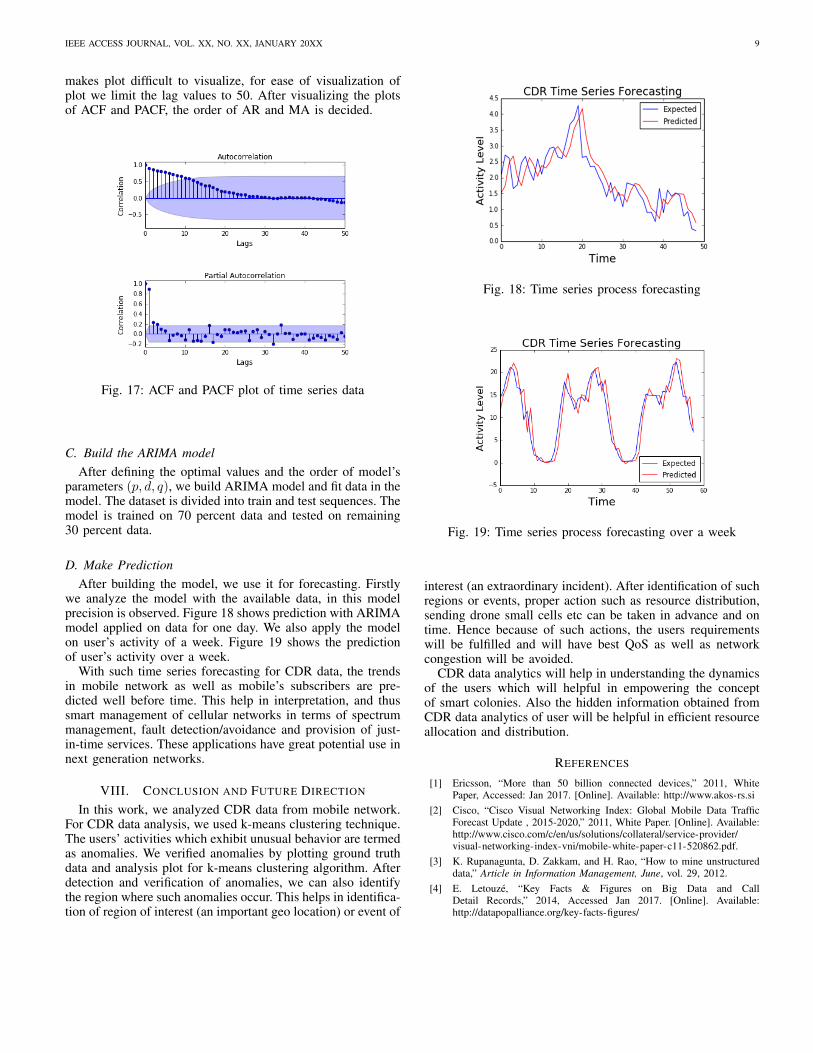
makes plot difficult to visualize, for ease of visualization ofplot we limit the lag values to 50. After visualizing the plotsof ACF and PACF, the order of AR and MA is decided.
Fig. 17: ACF and PACF plot of time series data
C. Build the ARIMA modelAfter defining the optimal values and the order of model’s
parameters (p, d, q), we build ARIMA model and fit data in themodel. The dataset is divided into train and test sequences. Themodel is trained on 70 percent data and tested on remaining30 percent data.
D. Make PredictionAfter building the model, we use it for forecasting. Firstly
we analyze the model with the available data, in this modelprecision is observed. Figure 18 shows prediction with ARIMAmodel applied on data for one day. We also apply the modelon user’s activity of a week. Figure 19 shows the predictionof user’s activity over a week.
With such time series forecasting for CDR data, the trendsin mobile network as well as mobile’s subscribers are pre-dicted well before time. This help in interpretation, and thussmart management of cellular networks in terms of spectrummanagement, fault detection/avoidance and provision of just-in-time services. These applications have great potential use innext generation networks.
VIII. CONCLUSION AND FUTURE DIRECTION
In this work, we analyzed CDR data from mobile network.For CDR data analysis, we used k-means clustering technique.The users’ activities which exhibit unusual behavior are termedas anomalies. We verified anomalies by plotting ground truthdata and analysis plot for k-means clustering algorithm. Afterdetection and verification of anomalies, we can also identifythe region where such anomalies occur. This helps in identifica-tion of region of interest (an important geo location) or event of
Fig. 18: Time series process forecasting
Fig. 19: Time series process forecasting over a week
interest (an extraordinary incident). After identification of suchregions or events, proper action such as resource distribution,sending drone small cells etc can be taken in advance and ontime. Hence because of such actions, the users requirementswill be fulfilled and will have best QoS as well as networkcongestion will be avoided.
CDR data analytics will help in understanding the dynamicsof the users which will helpful in empowering the conceptof smart colonies. Also the hidden information obtained fromCDR data analytics of user will be helpful in efficient resourceallocation and distribution.
REFERENCES
[1] Ericsson, “More than 50 billion connected devices,” 2011, WhitePaper, Accessed: Jan 2017. [Online]. Available: http://www.akos-rs.si
[2] Cisco, “Cisco Visual Networking Index: Global Mobile Data TrafficForecast Update , 2015-2020,” 2011, White Paper. [Online]. Available:http://www.cisco.com/c/en/us/solutions/collateral/service-provider/visual-networking-index-vni/mobile-white-paper-c11-520862.pdf.
[3] K. Rupanagunta, D. Zakkam, and H. Rao, “How to mine unstructureddata,” Article in Information Management, June, vol. 29, 2012.
[4] E. Letouze, “Key Facts & Figures on Big Data and CallDetail Records,” 2014, Accessed Jan 2017. [Online]. Available:http://datapopalliance.org/key-facts-figures/

IEEE ACCESS JOURNAL, VOL. XX, NO. XX, JANUARY 20XX 10
[5] S. Wellen, “The Physical size of Big Data,” https://www.domo.com/blog/the-physical-size-of-big-data/, Accessed: Jan 2017.
[6] J. Gantz and D. Reinsel, “Extracting value from chaos,” IDC iview, vol.1142, no. 2011, pp. 1–12, 2011.
[7] G. King, “Big data is not about the data!” Presentation (HarvardUniversity USA, 19 November 2013), 2013.
[8] J. G. Andrews, S. Buzzi, W. Choi, S. V. Hanly, A. Lozano, A. C. Soong,and J. C. Zhang, “What will 5G be?” IEEE Journal on Selected Areasin Communications, vol. 32, no. 6, pp. 1065–1082, 2014.
[9] D. Naboulsi, R. Stanica, and M. Fiore, “Classifying call profiles inlarge-scale mobile traffic datasets,” in INFOCOM, 2014 ProceedingsIEEE. IEEE, 2014, pp. 1806–1814.
[10] V. Soto and E. Frıas-Martınez, “Automated land use identificationusing cell-phone records,” in Proceedings of the 3rd ACM internationalworkshop on MobiArch. ACM, 2011, pp. 17–22.
[11] A. Zoha, A. Saeed, A. Imran, M. A. Imran, and A. Abu-Dayya,“A SON solution for sleeping cell detection using low-dimensionalembedding of MDT measurements,” in Personal, Indoor, and MobileRadio Communication (PIMRC), 2014 IEEE 25th Annual InternationalSymposium on. IEEE, 2014, pp. 1626–1630.
[12] G. Munz, S. Li, and G. Carle, “Traffic anomaly detection using k-meansclustering,” in GI/ITG Workshop MMBnet, 2007.
[13] M. F. Lima, B. B. Zarpelao, L. D. Sampaio, J. J. Rodrigues, T. Abrao,and M. L. Proenca, “Anomaly detection using baseline and k-meansclustering,” in Software, Telecommunications and Computer Networks(SoftCOM), 2010 International Conference on. IEEE, 2010, pp. 305–309.
[14] I. A. Karatepe and E. Zeydan, “Anomaly detection in cellular networkdata using big data analytics,” in European Wireless 2014; 20th Euro-pean Wireless Conference; Proceedings of. VDE, 2014, pp. 1–5.
[15] P. W. Gething and A. J. Tatem, “Can mobile phone data improveemergency response to natural disasters?” PLoS Med, vol. 8, no. 8,p. e1001085, 2011.
[16] L. Bengtsson, X. Lu, A. Thorson, R. Garfield, and J. Von Schreeb,“Improved response to disasters and outbreaks by tracking populationmovements with mobile phone network data: a post-earthquake geospa-tial study in haiti,” PLoS Med, vol. 8, no. 8, p. e1001083, 2011.
[17] E. Bouillet, R. Kothari, V. Kumar, L. Mignet, S. Nathan, A. Ran-ganathan, D. S. Turaga, O. Udrea, and O. Verscheure, “Experiencereport: Processing 6 billion cdrs/day: From research to production,”in Conference on Distributed Event-Based Systems (DEBS), 2012, pp.264–267.
[18] K. Zheng, Z. Yang, K. Zhang, P. Chatzimisios, K. Yang, and W. Xiang,“Big data-driven optimization for mobile networks toward 5G,” IEEENetwork, vol. 30, no. 1, pp. 44–51, 2016.
[19] B. Fan, S. Leng, and K. Yang, “A dynamic bandwidth allocationalgorithm in mobile networks with big data of users and networks,”IEEE Network, vol. 30, no. 1, pp. 6–10, 2016.
[20] A. Imran, A. Zoha, and A. Abu-Dayya, “Challenges in 5G: how toempower SON with big data for enabling 5G,” IEEE Network, vol. 28,no. 6, pp. 27–33, 2014.
[21] E. Bastug, M. Bennis, E. Zeydan, M. A. Kader, I. A. Karatepe, A. S.Er, and M. Debbah, “Big data meets telcos: A proactive cachingperspective,” Journal of Communications and Networks, vol. 17, no. 6,pp. 549–557, 2015.
[22] M. Ficek, “CRAWDAD dataset (v. 2012-03-15),” Downloaded fromhttp://crawdad.org/ctu/personal/20120315, Mar. 2012.
[23] A. McDiarmid, S. Bell, J. Irvine, and J. Banford, “Nodobo: De-tailed mobile phone usage dataset,” Unpublished paper, accessed athttp://nodobo. com/papers/iet-el. pdf on, pp. 9–21, 2013.
[24] [Online]. Available: https://dandelion.eu
[25] Accessed: Jan 2017. [Online]. Available: http://nodobo.com/release.html
[26] P. J. Brockwell and R. A. Davis, Introduction to time series andforecasting. Springer, 2002.
[27] J. Brownlee, Introduction to time series forecasting with python, 2017.[28] https://machinelearningmastery.com/arima-for-time-series-forecasting-with-python/.
Kashif Sultan received Masters degree in Informa-tion and Communication Engineering from Univer-sity of Science and Technology Beijing, China, in2015. Currently, he is a PhD researcher at the Schoolof Computer and Communication Engineering, Uni-versity of Science and Technology Beijing, China.He is the recipient of USTB Chancellors scholarship.His research interests include communication signalprocessing, next generation networks and big dataanalytics.
Hazrat Ali received in BSc and MSc degrees in elec-trical engineering in 2009 and 2012 respectively. Hedid his PhD in 2015 from University of Science andTechnology Beijing, China. He is currently AssistantProfessor at Department of Electrical Engineering,COMSATS Institute of Information Technology Ab-bottabad. At CIIT, he is the member of the signalprocessing and machine learning research group. Heis also the course head for Digital Signal Processingcourse. His research interests lie in unsupervisedlearning, generative and discriminative approaches,
and speech and image processing. He is Associate Editor at IEEE and servedas reviewer at IEEE Access, IEEE Transactions on Neural Networks andLearning Systems, Springer Neural Processing Letters, ACM Transactionson Asian and Low Resource Language Information Processing, ElsevierComputers and Electrical Engineering, International Journal of Artificial Intel-ligence Tools, Journal of Experimental and Theoretical Artificial Intelligence,Transactions on Internet and Information Systems, Springer Multimedia Toolsand Applications and as PC member at Frontiers of Information Technologyconference (FIT 2016), ICACT 2018, ICACT 2017, and IEEE WiSPNet 2018.He is selected as young researcher at the 5th Heidelberg Laureate Forum,Heidelberg, Germany. He is the recipient of the HEC Scholarship, IEEEStudent Travel Award, the IBRO grant, the TERENA/CISCO Travel grant,QCRI/Boeing Travel grant and the Erasmus Mundus STRoNGTiES researchgrant.

IEEE ACCESS JOURNAL, VOL. XX, NO. XX, JANUARY 20XX 11
Zhongshan Zhang received the B.E. and M.S. de-grees in computer science from the Beijing Uni-versity of Post and Telecommunications (BUPT) in1998 and 2001, respectively, and the Ph.D. degreein electrical engineering from BUPT in 2004. From2004, he joined the DoCoMo Beijing Laboratoriesas an Associate Researcher, and was promoted tobe a Researcher in 2005. In 2006, he joined theUniversity of Alberta, Edmonton, AB, Canada, as aPost-Doctoral Fellow. In 2009, he joined the Depart-ment of Research and Innovation, Alcatel-Lucent,
Shanghai, as a Research Scientist. From 2010 to 2011, he was with theNEC China Laboratories, as a Senior Researcher. He is currently a Professorwith the School of Computer and Communication Engineering, University ofScience and Technology Beijing. His main research interests include statisticalsignal processing, self-organized networking, cognitive radio, and cooperativecommunications. He served or is serving as a Guest Editor and/or an Editorfor several technical journals, such as the IEEE Communications Magazineand the KSII Transactions on Internet and Information Systems.