iea task 19: cold climate wind power market study 2015...
TRANSCRIPT

VTT TECHNICAL RESEARCH CENTRE OF FINLAND LTD
IEA Task 19: Cold climatewind power market study2015-2020Timo Karlsson,Research ScientistVTT Technical Research Center of Finland
Winterwind 2017Skellefteå, 7.2.-8.2. 2017

03/02/2017 2
Contents
§ Introduction§ Data sources§Method§ Results§ Conclusions
303/02/2017
Introduction
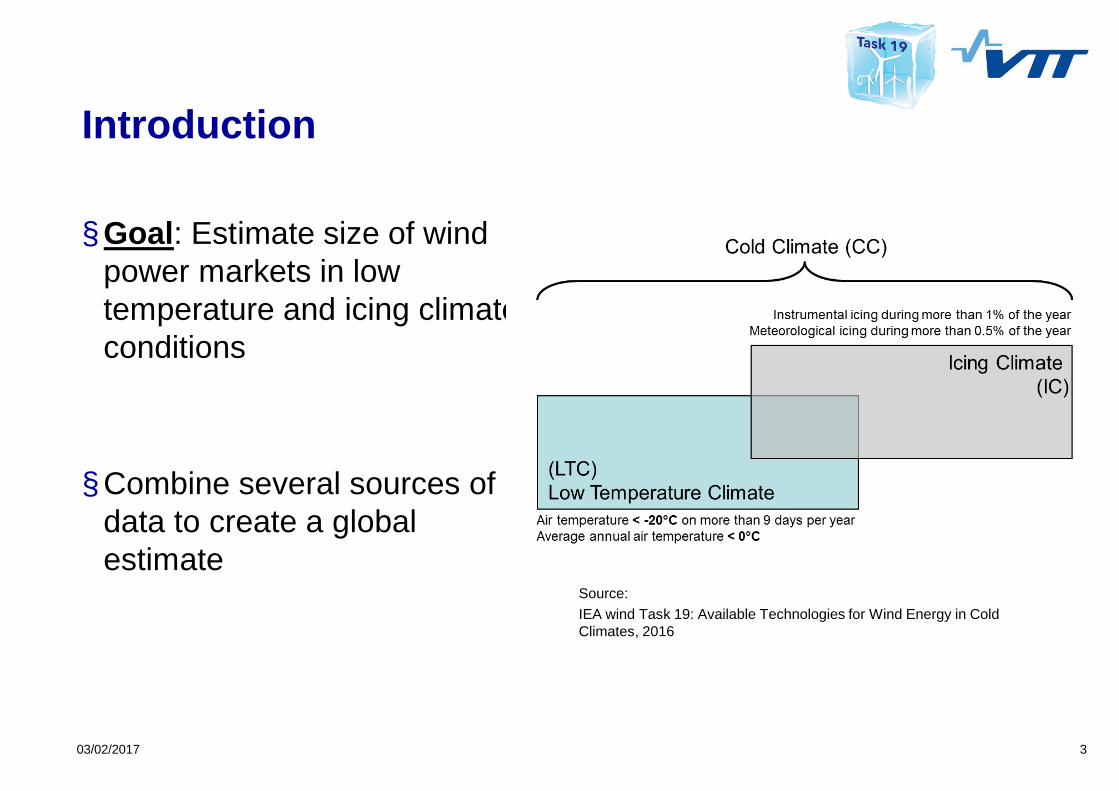
§Goal: Estimate size of windpower markets in lowtemperature and icing climateconditions
§ Combine several sources ofdata to create a globalestimate
Source:IEA wind Task 19: Available Technologies for Wind Energy in ColdClimates, 2016

Methods

03/02/2017 5
Market study methodGlobal wind power
market forecast
VTTWIceAtlas
Lowtemperature
map
Lowtemperaturewind market
Icing climatewind market
Cold Climatemarketforecast
Wind farmdatabase
InputOutput
03/02/2017 6
Wind Farm database
§ Commercial, global windfarm database§ Coordinates, power, etc.§ > 22000 sites, all continents
§ Coverage ~79 % of GWEC world capacity estimate

03/02/2017 7
Icing
§ Icing was calculated from VTT WIceAtlas for all sitesin the wind farm database§Meteorological icing at 150 m agl§ Based on cloud base heigth & temp. measurements

03/02/2017 8
Icing
§ Icing was divided into threecategories§ No icing§ Light icing
(IEA ice class 2)§ Moderate/heavy icing
(IEA ice class > 2)
IEAIce
Class
Duration ofMeteorological
Icing[% of Year]
Duration ofInstrumental
Icing[% of Year]
ProductionLoss
[% of AEP]
5 >10 >20 >204 5-10 10-30 10-253 3-5 6-15 3-122 0.5-3 1-9 0.5-51 0-0.5 <1.5 0-0.5

03/02/2017 9
Low temperature map
§ Low temperature site definition (DNV GL):§ Minimum temperature below -20ºC for at least an hour per day on
9 or more days a year on average in long term data (>10 years)§Map built based on MERRA data
03/02/2017 10
Forecast
§ Calculate the share of wind power in cold climate and icingconditions in each geographical area§ Assume the share remains constant§Market forecast from BTM world market update§ Checked against GWEC forecast
Results
03/02/2017 12
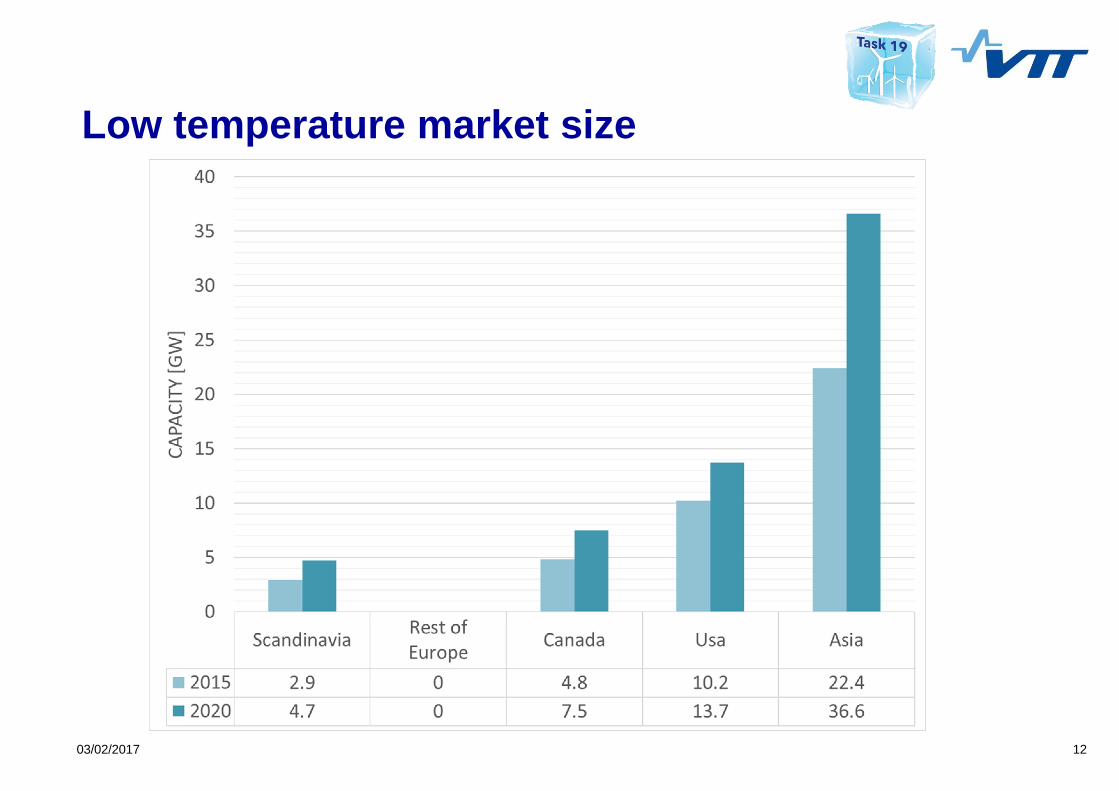
Low temperature market size
03/02/2017 13
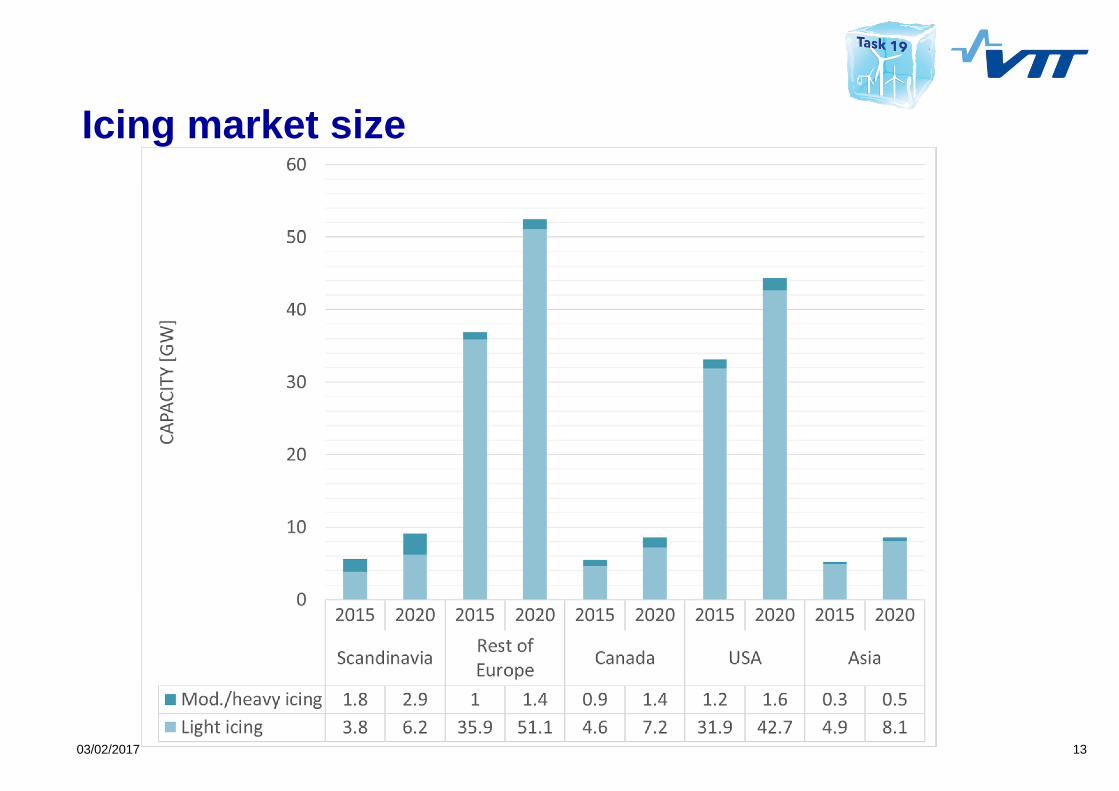
Icing market size

Conclusions
03/02/2017 15
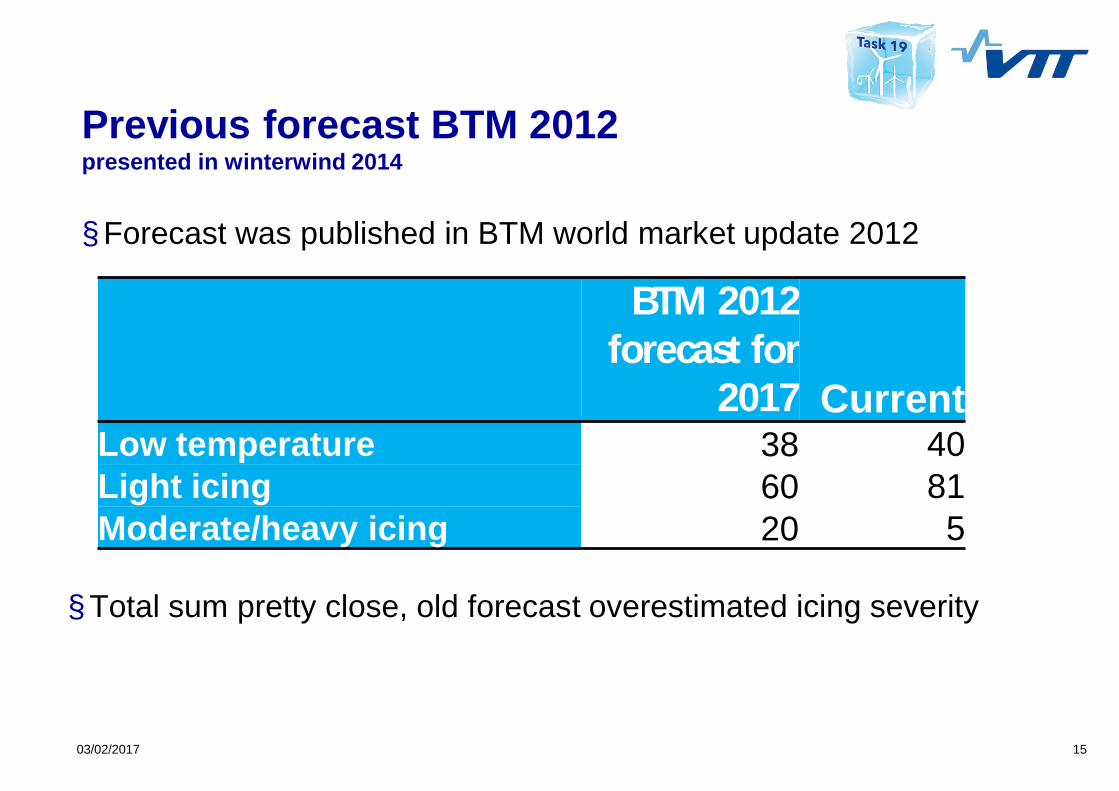
Previous forecast BTM 2012presented in winterwind 2014
§ Forecast was published in BTM world market update 2012
BTM 2012forecast for
2017 CurrentLow temperature 38 40Light icing 60 81Moderate/heavy icing 20 5
§ Total sum pretty close, old forecast overestimated icing severity
03/02/2017 16
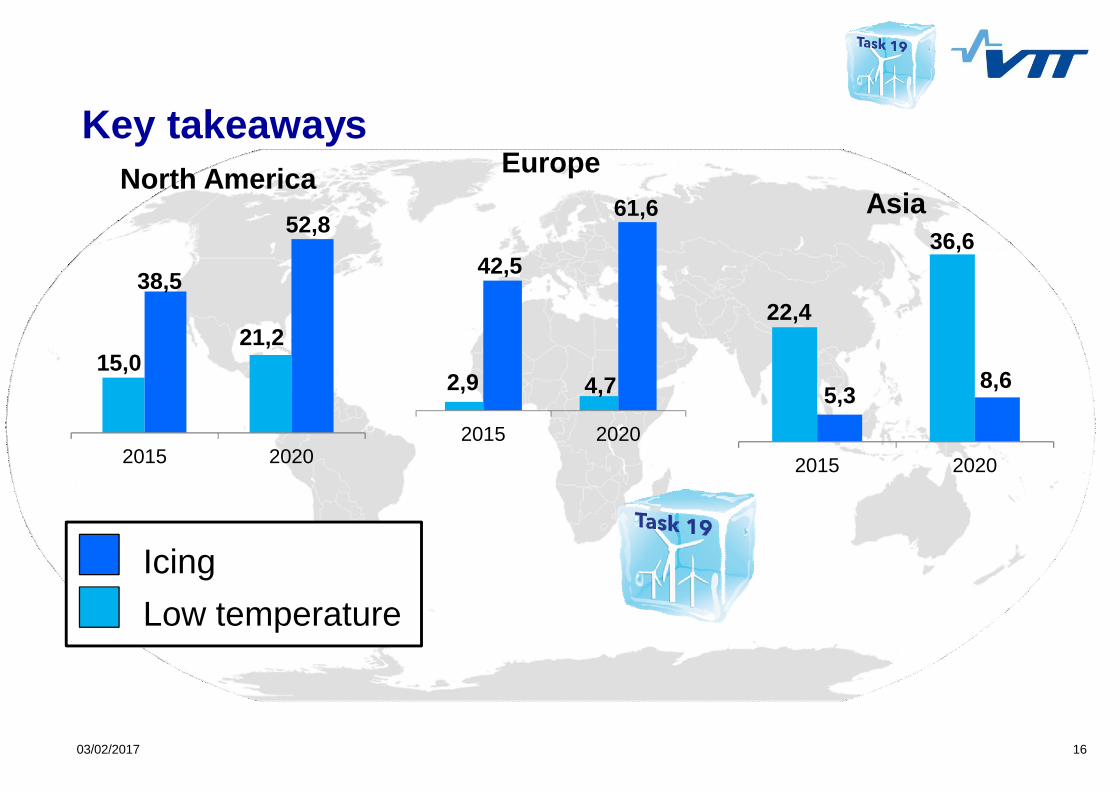
IcingLow temperature
22,4
36,6
5,3 8,6
2015 2020
Asia
2,9 4,7
42,5
61,6
2015 2020
Europe
15,021,2
38,5
52,8
2015 2020
North America
Key takeaways

03/02/2017 17
Cumulative installed capacity byend of 2015 [MW]
Forecasted capacity by end of2020 [MW]
Lowtemperature Icing* Low
temperature Icing*
40 500 86 500 62 500 123 000
Total 127 000 Total 185 500
Cold climate markets 2015-2020
+12GW/a -> 59GW of new installations to cold climates by 2020!Ø Compare: new offshore +4GW/a -> 20GW by 2020
http://www.windpowermonthly.com/article/1403504/emerging-cold
*: IEA Ice Classification ≥ 2 meaning > 44h/a ofmeteorological (in-cloud) icing

TECHNOLOGY FOR BUSINESS
03/02/2017 19
Data sources
§ VTT WIceAtlas§ http://www.vtt.fi/sites/wiceatlas/
§ Global windfarm database§ http://www.thewindpower.net
§ MERRA§ https://gmao.gsfc.nasa.gov/reanalysis/MERRA/
§ NAVIGANT world wind energy market update§ https://www.navigantresearch.com/research/world-wind-energy-market-
update-2016§ GWEC Global wind report
§ http://www.gwec.net/publications/global-wind-report-2/global-wind-report-2015-annual-market-update/

03/02/2017 20
capacity by country in MWicing low temperature
2015 2020 2015 2020Austria 1373 2426 0 0Belgium 564 959 0 0Bulgaria 477 585 0 0Czech rep. 295 617 0 0Denmark 482 666 0 0Estonia 161 338 0 0Finland 773 2120 472 1294France 3273 5360 0 0Germany 19138 25281 0 0Greece 251 307 0 0Hungary 137 313 0 0Ireland (Rep.) 6 10 0 0Italy 188 223 0 0Latvia 52 173 0 0Lithuania 95 171 0 0Netherlands 552 995 0 0Norway 549 1330 34 82Poland 1696 2835 0 0Portugal 0 0 0 0Romania 2018 3543 0 0Spain 3993 4029 0 0Sweden 4537 7088 1192 1862Switzerland 68 202 0 0Turkey 101 215 0 0UK 2036 3604 0 0
Rest of Europe (Luxembourg, Cyprus, Malta, Iceland & Balkan states etc. 170 451 0 0Argentina 0 0 0 0Brazil 0 0 0 0Canada 5483 8550 4800 7486Chile 0 0 0 0Mexico 0 0 0 0USA 33049 44272 10227 13699Other Americas 0 0 0 0P.R.China 4818 7791 26231 42422India 0 0 0 0Pakistan 0 0 0 0Taiwan 0 0 0 0Rest of Asia 17 55 0 0Japan 165 289 0 0South Korea 143 262 0 0Australia 0 0 0 0New Zealand 0 0 0 0