iea iea –– ghg meetingghg meeting sb1517 2008 kh … · panarea island and stromboli volcano g...
TRANSCRIPT

IEA IEA –– GHG MeetingGHG Meeting
S b 15S b 15 17 200817 2008 K hK h
Monitoring of CO Monitoring of CO 22 vents offshore Panarea:vents offshore Panarea:
September 15 September 15 -- 17, 2008 17, 2008 -- KeyworthKeyworth
2 2 first results and future perspectives first results and future perspectives
Prof. Salvatore Lombardi – Dr. Giorgio Caramannao . S v o e o b d . G o g o C
Earth Sciences Department - Fluid Chemistry Laboratory

i f h hi f h hAims of the researchAims of the researchU. R. S.U. R. S.
• Investigation of gas leakage in the marine “natural analogue” of Panarea Island (Italy)St d f th b di id i t th• Study of the carbon dioxide impact on the marine environment
• Monitoring of dissolved gases in marine scenariosMonitoring of dissolved gases in marine scenarios

MethodologyMethodologyMethodologyMethodology• Underwater sampling of fluids by means of SCUBA
di i d f th l i b h t hi
U. R. S.U. R. S.
diving and further analysis by chromatographic techniques
• Use of a multi-probe for in situ measurement of the main chemical and physical parameters (pHthe main chemical and physical parameters (pH, salinity, temperature, etc.) operated from a boat and by divers.
• Acquisition of the local current field by the• Acquisition of the local current field by the deployment of an Acoustic Doppler Current Profiler (ADCP).
• Laboratory simulation of a gas plume to study the• Laboratory simulation of a gas plume to study the induced water circulation by means of digital imaging techniques and chemical tracers.
• Deployment of underwater sensors for gas leakDeployment of underwater sensors for gas leak detection.

Studied area
Active volcanoes
Active volcanoes

Panarea island and Stromboli volcanoPanarea island and Stromboli volcano
G
U. R. S.U. R. S.
Gas vents area

U. R. S.U. R. S.
Gas vents area

The gas vents areaThe gas vents areaU. R. S.U. R. S.

Geological setting of Geological setting of Panarea area Panarea area U. R. S.U. R. S.
• Volcanic island with six periods of explosive and effusive activity (last emission activity 10.000 years).
• Outcrop of a large volcanic apparatus that rises• Outcrop of a large volcanic apparatus that rises from the surrounding seabed (1.000 meters deep).
• Presence of faults along local and regional g galignments (NW-SE, NE-SW).
• Strong hydrothermal/volcanic submarine gas vent s stemsystem.
• Gas vents aligned mainly along the tectonic features.

U. R. S.U. R. S.

U. R. S.U. R. S.

U. R. S.U. R. S.

U. R. S.U. R. S.

Morphology of the seabedMorphology of the seabedMorphology of the seabedMorphology of the seabedU. R. S.U. R. S.
• Average depth around 20 meters.• Flat topography with several shoals.• Circular depressions due to ancient gas bursts.• Sea-bottom sediments composed mainly of gravel
and sandand sand. • Volcanic bedrock (lava flows) buried under
quaternary deposits.• Diffuse and localized leaking areas.• Presence of several gas vents with a wide range of
fl i t it d i l d itflow intensity and some mineral deposits.

U. R. S.U. R. S.

U. R. S.U. R. S.

Average values of gas componentsAverage values of gas componentsAverage values of gas componentsAverage values of gas componentsU. R. S.U. R. S.
116.82 120
94.30
80 00
100.00
120.00100
60
80
0.88 3.69 2.1820.00
40.00
60.00
80.00
0
40
20
0.00 CH4 ppmO2 N2 CO2 H2S CH4

flflAverage year gas flowAverage year gas flowU. R. S.U. R. S.
t/m2m3/m2Gas
3020 000H S1.670850.000CO2
t/mm /mGas
7,5 * 10-2105CH4
3020.000H2S
These values are the minimum estimation of the average gas flow
Total 900.000 m3/m2 – 2.000 t/m2

Acoustic Doppler Currentometer Acoustic Doppler Currentometer Profiler (NIVA equipment)Profiler (NIVA equipment)Profiler (NIVA equipment)Profiler (NIVA equipment)U. R. S.U. R. S.

U. R. S.U. R. S.
Current direction
Current speed

MultiMulti--probe (NIVA equipment)probe (NIVA equipment)MultiMulti--probe (NIVA equipment)probe (NIVA equipment)U. R. S.U. R. S.

U. R. S.U. R. S.
Emission area

Lab experimentsLab experimentsLab experimentsLab experimentsU. R. S.U. R. S.
• Artificial gas plume inside a custom-made testing box filled with two layers of water (denser water on the bottom)the bottom).
• Chemical and visual tracers to identify the flow patterns.p
• Digital image elaboration to identify the vortexes.• Mathematical analysis of the field and lab data.• Collaboration with the Fluid-Mechanic Laboratory
of Hydraulics, Transportation and Roads and the Physics Department of URS .Physics Department of URS .

Digital imaging of the lab testsDigital imaging of the lab testsDigital imaging of the lab testsDigital imaging of the lab tests
Digital elaboration of the speed vectors
U. R. S.U. R. S.
Pictures of the water surface
Digital elaboration of the speed vectors
Water tank with gas injectionWater tank with gas injection

Formation of vortexes Formation of vortexes around the gas plumearound the gas plumearound the gas plumearound the gas plumeU. R. S.U. R. S.
Averaged on first 3000 frames (120 seconds)

Artificial gas plume Artificial gas plume
Bottom water diffusion
g pg pin a double layered systemin a double layered systemU. R. S.U. R. S.
Bottom water diffusionLight water
Mixing Layer Not affected areaDense waterDense water

First results of the First results of the lab simulationslab simulationsU. R. S.U. R. S.
• Vortex structures surround the gas plume.• Gas/water mixing only in some layers.• Probable “isolation” of the gas plume from the
surrounding seawater with reduced mixing.• More experiments will be necessary for a better• More experiments will be necessary for a better
understanding of the phenomena.

U. R. S.U. R. S.
The impact of the gas is limited. Schools of fish swim around the gas plumeg p

Monitoring station:Monitoring station:Monitoring station: Monitoring station: learning from the experiencelearning from the experience
U. R. S.U. R. S.
• Inshore gas monitoring stations have been used by URS since 2002. From this experience, the development of the underwater monitoring system begins.the underwater monitoring system begins.
• This system will be composed of specifically designed underwater sensors for dissolved CO2 and CH4 (URS) and of free gas sensors (BGR) cabled to a surfaceand of free gas sensors (BGR) cabled to a surface control station.
• Three points of monitoring (shallow water/high flux, d t /l fl d t l i t ith t )deep water/low flux and control point without gas).
• Data will be transmitted in real time and will be available online.

COCO22, CH, CH4,4,T and Depth sensorsT and Depth sensorsU. R. S.U. R. S.
Housing for lab test
Device control card
Voltage switchingV in 5 V out
Sensors control card
Device control card (system core)
Sensors

U. R. S.U. R. S.

The underwater monitoring systemThe underwater monitoring systemThe underwater monitoring systemThe underwater monitoring systemU. R. S.U. R. S.
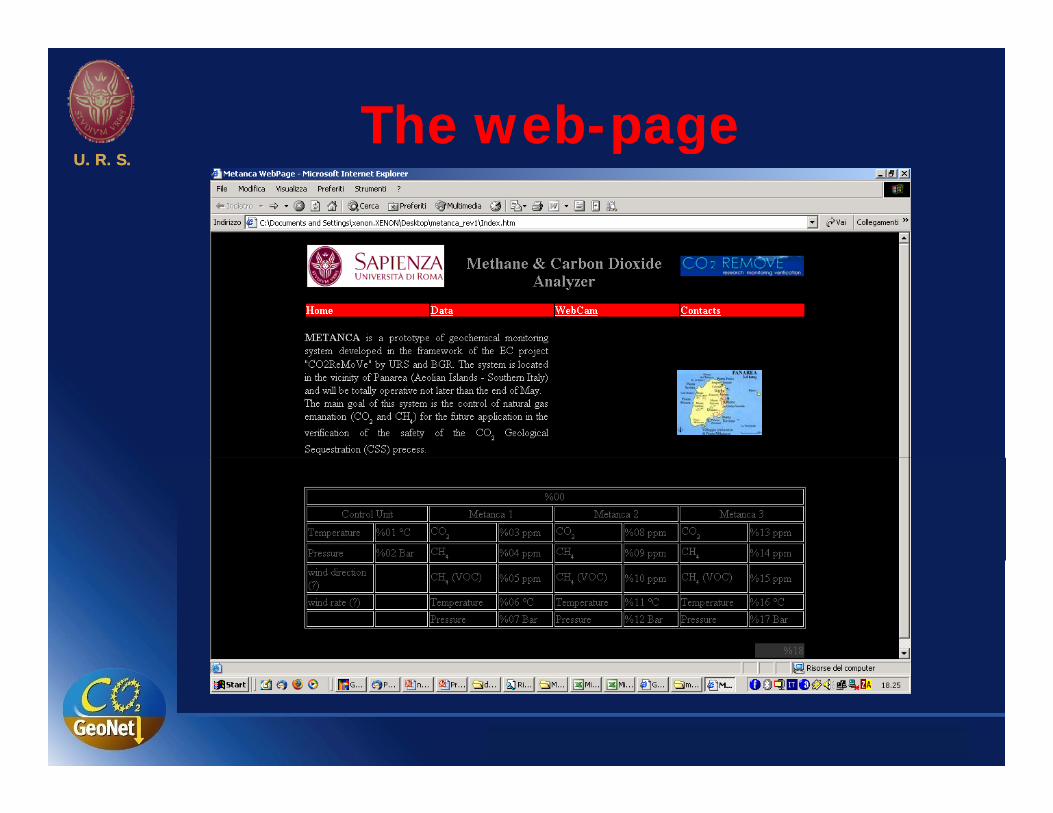
The webThe web--pagepagep gp gU. R. S.U. R. S.

SummarySummarySummarySummary• A very high CO2 gas flow, related to the structural
U. R. S.U. R. S.
A very high CO2 gas flow, related to the structural setting, is present in the Panarea area.
• The monitoring of chemical parameters is a good tool to localize and to monitor CO2 leaks.2
• The effect of the gas leaks on the marine realm seems to be restricted to the areas closer to the vents with limited effects on the regional ecosystem.g y
• Panarea is an excellent candidate to be used as a natural field lab to study the effect of carbon dioxide on the marine environment and to develop innovative monitoring techniques.