idps returnees - reliefwebreliefweb.int/sites/reliefweb.int/files/resources/round72_report... ·...
TRANSCRIPT

I
I
From 27 April to 30 May 2017:
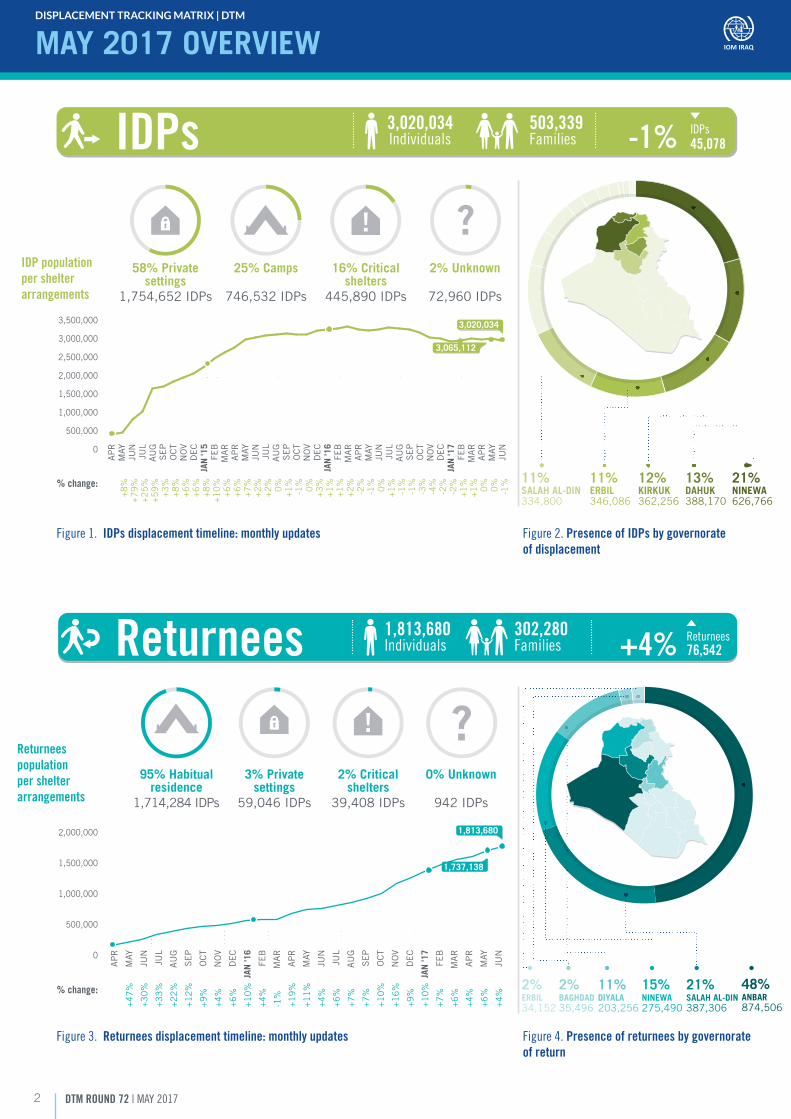
• Asof30May2017,theDTMhasidentified3,020,034internallydisplacedpersons(503,339families)displaced
after January2014,dispersedacross106districtsand3,577 locations in Iraq.For thesameperiod,DTMhas
identified1,813,680returnees(302,280families).
• Overall, the total number of identified IDPs remained stable during the reporting period, with a decrease of
approximately1% (7,513 individuals). The general decrease is to be attributed to returnmovements across all
governorates,particularlyinAnbar,Ninewa,BaghdadandKirkukgovernorates.Atthesametime,thegovernorate
ofNinewaalonerecordedanincreaseof3%(20,958individuals)becauseofthemilitaryoperationsinthecityof
Mosul.
• The returnee population increased by4% (76,542 individuals). The two governorates that reported the highest
increaseofthereturneepopulationwereAnbarby7%(59,538)andNinewaby6%(15,030).
Considering the available information and the DTM methodology, the Humanitarian Country Team (HCT) has revised the planning
figures for the humanitarian response at 3 million internally displaced persons.
DISPLACEMENTTRACKINGMATRIXDTM ROUND 72
www.iraqdtm.iom.int [email protected]
HIG
HLI
GHTS
May 2017
IDPs Returnees
-1% +4%
1,813,680
302,280Families
Individuals3,020,034
503,339Families
Individuals
18 Governorates 3,660 Locations 9,500 Key Informants123 RARTs106 Districts
Childrenplayaroundopensewage,waste,andstagnantwatersinAdhamiya,oneofthebiggestinformalsettlementsinBaghdad.
DTM ROUND 72 | MAY 20172
MAY 2017 OVERVIEW
IDPs
Returnees
NINEWA626,766
21%KIRKUK362,256
12%DAHUK388,170
13%SALAH AL-DIN334,800
11%ERBIL346,086
11%
2% Unknown
72,960 IDPs
25% Camps
746,532 IDPs
16% Criticalshelters
445,890 IDPs
58% Privatesettings
1,754,652 IDPs
+8
%+7
9%
+2
5%
+5
9%
+3
%+8
%+6
%+6
%+8
%+1
0%
+6
%+6
%+7
%+2
%+2
%0
%+1
%-1
%0
%+3
%+1
%+1
%+2
%-2
%-1
%0
%+1
%-1
%-1
%-3
%-4
%-2
%-2
%+1
%+1
%0
%0
%-1
%
0
500,000
% change:
1,000,000
1,500,000
2,000,000
2,500,000
3,000,000
3,500,000
AP
RM
AYJU
NJU
LA
UG
SE
PO
CT
NO
VD
EC
JAN
'15
FEB
MA
RA
PR
MAY
JUN
JUL
AU
GS
EP
OC
TN
OV
DE
CJA
N '1
6FE
BM
AR
AP
RM
AYJU
NJU
LA
UG
SE
PO
CT
NO
VD
EC
JAN
'17
FEB
MA
RA
PR
MAY
JUN
3,020,034
3,065,112
0% Unknown
942 IDPs
2% Criticalshelters
39,408 IDPs
3% Privatesettings
59,046 IDPs
95% Habitualresidence
1,714,284 IDPs
0
500,000
1,000,000
1,500,000
2,000,000
AP
R
MAY
JUN
JUL
AU
G
SE
P
OC
T
NO
V
DE
C
JAN
'16
FEB
MA
R
AP
R
MAY
JUN
JUL
AU
G
SE
P
OC
T
NO
V
DE
C
JAN
'17
FEB
MA
R
AP
R
MAY
JUN
+4
7%
+3
0%
+3
3%
+2
2%
+1
2%
+9
%
+4
%
+6
%
+1
0%
+4
%
-1%
+1
9%
+1
1%
+4
%
+6
%
+7
%
+7
%
+1
0%
+1
6%
+9
%
+1
0%
+7
%
+6
%
+4
%
+6
%
+4
%% change:ANBAR874,506
48%NINEWA275,490
15%SALAH AL-DIN387,306
21%DIYALA203,256
11%BAGHDAD35,496
2%ERBIL34,152
2%
1,813,680
1,737,138
503,339
302,280
Families
Families
Individuals
Individuals
3,020,034
1,813,680
-1%
+4%
IDPs
Returnees
45,078
76,542
Figure 2. Presence of IDPs by governorate of displacement
Figure 4. Presence of returnees by governorate of return
IDP population per shelter arrangements
Figure 1. IDPs displacement timeline: monthly updates
Figure 3. Returnees displacement timeline: monthly updates
Returnees population per shelter arrangements
DISPLACEMENT TRACKING MATRIX | DTM

SITUATION OVERVIEW
Duringthereportingperiod,between27Apriland30May,Ninewawastheonlygovernoratethat recordedan increase inIDPs,whileall other governorates recorded a reduction.However, this shouldnotbeinterpretedasanabsolutedecreaseofdisplacementtrends:itisratherduetoreturningmovementsreportedlyoutweighingnewdisplacements insomegovernorates.
ThiswasthecaseofSalahal-DinandKirkukgovernorates,wheretheongoingmilitaryoperationsinBaiji,ShirqatandHawijadistrictshavenotescalatedfurther,promptingreturnmovementsfromKirkukandSalahal-DintoretakenareasinSalahal-Din,andfromKirkuktoAnbaraswell.
Meanwhile, the steadily growth of IDPs in Ninewa is due to themilitary operations to retake the city ofMosul, currently focusingonthewesternsideofthecity.TheoperationstoretakewestMosulwere launched on 19 February and have caused large waves ofdisplacements to camp and out-of-camp locations.
According to the DTM Emergency Tracking, which reports onlyIDPand returnees recordswhose locationshavebeen verified, as
of1Junethetotalcumulativenumberof identifiedIDPsreached517,650 individuals, ofwhom378,120are still indisplacementand 139,530 have already returned, particularly to east Mosul,Baashiqa, Tilkaif and Hamdaniya.
Based on flow-monitoring data tracked at Hammam al-Alielscreening site, as of1 Junealmost590,000 individualshad leftwestMosulandmainlyheadedtowardscampsinSouthernNinewaor eastMosul. In particular, during the reportingperiod theDTMhas recorded an average displacement of over 6,000 individualsperdayfromwestMosulthroughthisscreeningsite,withpeaksof17,000or16,000aroundmid-May–dependingontheprogressofthe military operations.
Furthermore, during the reporting period this identified IDPpopulation fromMosul grew by 17% (75,930 individuals), whilethenumberofIDPscrossingHammamal-Alielscreeningsitegrewby53%,correspondingtoapproximately200,000individuals.TheDTMiscurrentlyworkingonvalidatingthedisplacementlocationsofIDPsinout-of-campsettingsandaimstoprovideupdatedfiguresbylocationassoonaspossible.
Post 17 Oct 16Post Mar 16Post Apr 15Post Sep 14Aug 14Jun-Jul 14Pre-Jun 14
Post 17 Oct 16Post Mar 16Post Apr 15Post Sep 14Aug 14Jun-Jul 14Pre-Jun 14
May
Jun
AugJu
l
Sep Oct
Nov
Dec
Feb
Mar
Jan
2016
Jan
2015 Feb
Mar
Apr
May
Jun
Jul
Aug
Sep Oct
Nov
Dec Feb
Mar
Feb
Mar
Apr
May
Jun
MayApr
Dec
Nov
Sep Oct
AugJu
l
Jun
Apr
Jan
2017
Jan
2014
Iraq Security Forces (ISF) take
over Tikrit city
Peshmerga take over Ayadyah, Zummar, and Sinjar
Peshmerga take over Rabea
Tikrit Bridge reopens, which allows mass returns
Beginning of returns managed by authorities in Diyala
Returns to Falluja begin (the city was retaken in June 2016)
May 2015
Dec 2014
Sep 2014 Mar 2015 Sep 2016
Jul 2015
Aug 2015
17 OctMar 2016May 2015
Aug 2014
Jun–Jul 2014
Jan 2014
ISIL seizes large areas of Anbar governorate, including the city of Falluja ISIL takes over parts of
Ninewa governorate, including the city of Mosul
ISIL captures Sinjar, in Ninewa governorate
ISIL invades the city of Ramadi, in Anbar governorate
The military operations to retake ISIL-controlled areas intensify in Anbar, Salah al-Din and Southern Ninewa
The military operations to retake the city of Mosul start
ISF take over the city of Ramadi
0
200,000
400,000
600,000
800,000
1,000,000
050,000
100,000150,000200,000250,000300,000350,000400,000
May
Jun
AugJu
l
Sep Oct
Nov
Dec
Feb
Mar
Jan
2016
Jan
2015 Feb
Mar
Apr
May
Jun
Jul
Aug
Sep Oct
Nov
Dec Feb
Mar
Feb
Mar
Apr
May
Jun
MayApr
Dec
Nov
Sep Oct
AugJu
l
Jun
Apr
Jan
2017
Jan
2014
Figure 5. Number of IDPs over time
Figure 6. Number of Returnees over timeThe IOM DTM Iraq started recording returnees in April 2015
DTM ROUND 72 | MAY 2017 3
DISPLACEMENT TRACKING MATRIX | DTM
DTM ROUND 72 | MAY 20174
Anbar
Najaf
Muthanna
NinewaErbil
Diyala
Wassit
Basrah
Missan
Salah al-Din
Thi-Qar
Kirkuk
Dahuk
Qadissiya
Sulaymaniyah
BabylonKerbala
Baghdad
IDP families by governorate of displacement High concentration
Low concentration
Locations
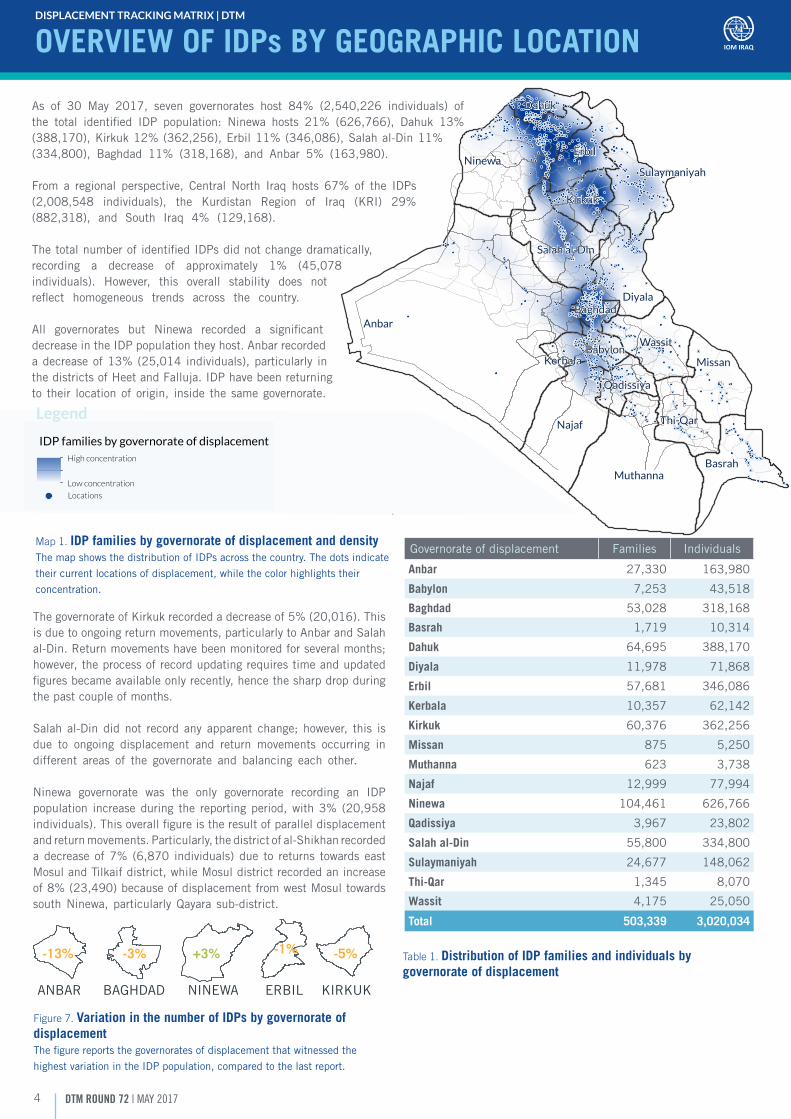
OVERVIEW OF IDPs BY GEOGRAPHIC LOCATION
Figure 7. Variation in the number of IDPs by governorate of displacementThefigurereportsthegovernoratesofdisplacementthatwitnessedthe
highestvariationintheIDPpopulation,comparedtothelastreport.
Governorateofdisplacement Families Individuals
Anbar 27,330 163,980
Babylon 7,253 43,518
Baghdad 53,028 318,168
Basrah 1,719 10,314
Dahuk 64,695 388,170
Diyala 11,978 71,868
Erbil 57,681 346,086
Kerbala 10,357 62,142
Kirkuk 60,376 362,256
Missan 875 5,250
Muthanna 623 3,738
Najaf 12,999 77,994
Ninewa 104,461 626,766
Qadissiya 3,967 23,802
Salah al-Din 55,800 334,800
Sulaymaniyah 24,677 148,062
Thi-Qar 1,345 8,070
Wassit 4,175 25,050
Total 503,339 3,020,034
ANBAR BAGHDAD
-13% -3%
ERBIL
-1%
NINEWA
+3%
KIRKUK
-5% Table 1. Distribution of IDP families and individuals by governorate of displacement
Map 1. IDP families by governorate of displacement and densityThemapshowsthedistributionofIDPsacrossthecountry.Thedotsindicate
theircurrentlocationsofdisplacement,whilethecolorhighlightstheir
concentration.
DISPLACEMENT TRACKING MATRIX | DTM
As of 30 May 2017, seven governorates host 84% (2,540,226 individuals) ofthe total identified IDP population: Ninewa hosts 21% (626,766), Dahuk 13%(388,170),Kirkuk12%(362,256),Erbil11%(346,086),Salahal-Din11%(334,800), Baghdad 11% (318,168), and Anbar 5% (163,980).
From a regional perspective, CentralNorth Iraq hosts 67% of the IDPs(2,008,548 individuals), the Kurdistan Region of Iraq (KRI) 29%(882,318), and South Iraq 4% (129,168).
ThetotalnumberofidentifiedIDPsdidnotchangedramatically,recording a decrease of approximately 1% (45,078individuals). However, this overall stability does notreflect homogeneous trends across the country.
All governorates but Ninewa recorded a significantdecreaseintheIDPpopulationtheyhost.Anbarrecordedadecreaseof13%(25,014individuals),particularly inthedistrictsofHeetandFalluja.IDPhavebeenreturningto their locationoforigin, inside thesamegovernorate.
Anbar
Najaf
Muthanna
NinewaErbil
Diyala
Wassit
Basrah
Missan
Salah al-Din
Thi-Qar
Kirkuk
Dahuk
Qadissiya
Sulaymaniyah
BabylonKerbala
Baghdad
IDP families by governorate of displacement High concentration
Low concentration
Locations
Legend
ThegovernorateofKirkukrecordedadecreaseof5%(20,016).Thisisduetoongoingreturnmovements,particularlytoAnbarandSalahal-Din.Returnmovementshavebeenmonitoredforseveralmonths;however,theprocessofrecordupdatingrequirestimeandupdatedfiguresbecameavailableonlyrecently,hencethesharpdropduringthepastcoupleofmonths.
Salahal-Dindidnot recordanyapparent change;however, this isdue to ongoing displacement and return movements occurring indifferent areas of the governorate and balancing each other.
Ninewa governorate was the only governorate recording an IDPpopulation increaseduring the reportingperiod,with3%(20,958individuals).Thisoverallfigureistheresultofparalleldisplacementandreturnmovements.Particularly,thedistrictofal-Shikhanrecordedadecreaseof7% (6,870 individuals)due to returns towardseastMosulandTilkaifdistrict,whileMosuldistrictrecordedanincreaseof8%(23,490)becauseofdisplacementfromwestMosultowardssouthNinewa,particularlyQayara sub-district.
DTM ROUND 72 | MAY 2017 5
Anbar
Najaf
Muthanna
NinewaErbil
Diyala
Wassit
Basrah
Missan
Salah al-Din
Thi-Qar
Dahuk
Qadissiya
Sulaymaniyah
BabylonKerbala
Baghdad
Kirkuk
Anbar
Diyala
Kirkuk
Ninewa
Salahal Din
IDPs’ movements from governorates of originto districts of displacement
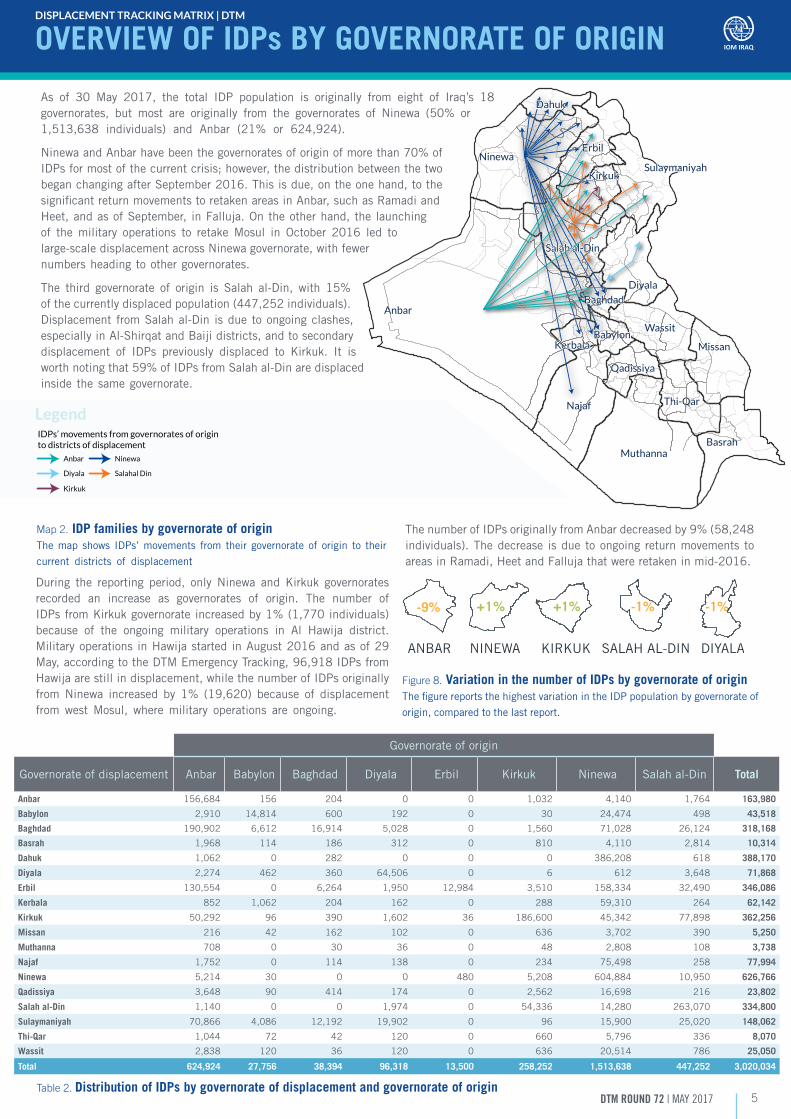
OVERVIEW OF IDPs BY GOVERNORATE OF ORIGIN
As of 30 May 2017, the total IDP population is originally from eight of Iraq’s 18governorates, but most are originally from the governorates of Ninewa (50% or1,513,638 individuals) and Anbar (21% or 624,924).
NinewaandAnbarhavebeenthegovernoratesoforiginofmorethan70%ofIDPsformostofthecurrentcrisis;however,thedistributionbetweenthetwobeganchangingafterSeptember2016.Thisisdue,ontheonehand,tothesignificantreturnmovementstoretakenareasinAnbar,suchasRamadiandHeet,andasofSeptember,inFalluja.Ontheotherhand,thelaunchingof themilitary operations to retakeMosul in October 2016 led tolarge-scaledisplacementacrossNinewagovernorate,withfewernumbersheadingtoothergovernorates.
The third governorate of origin is Salah al-Din, with 15%ofthecurrentlydisplacedpopulation(447,252individuals).DisplacementfromSalahal-Din isduetoongoingclashes,especiallyinAl-ShirqatandBaijidistricts,andtosecondarydisplacement of IDPs previously displaced to Kirkuk. It isworthnotingthat59%ofIDPsfromSalahal-Dinaredisplacedinsidethesamegovernorate.
Figure 8. Variation in the number of IDPs by governorate of origin ThefigurereportsthehighestvariationintheIDPpopulationbygovernorateof
origin,comparedtothelastreport.
Governorateoforigin
Governorateofdisplacement Anbar Babylon Baghdad Diyala Erbil Kirkuk Ninewa Salahal-Din Total
Anbar 156,684 156 204 0 0 1,032 4,140 1,764 163,980
Babylon 2,910 14,814 600 192 0 30 24,474 498 43,518
Baghdad 190,902 6,612 16,914 5,028 0 1,560 71,028 26,124 318,168
Basrah 1,968 114 186 312 0 810 4,110 2,814 10,314
Dahuk 1,062 0 282 0 0 0 386,208 618 388,170
Diyala 2,274 462 360 64,506 0 6 612 3,648 71,868
Erbil 130,554 0 6,264 1,950 12,984 3,510 158,334 32,490 346,086
Kerbala 852 1,062 204 162 0 288 59,310 264 62,142
Kirkuk 50,292 96 390 1,602 36 186,600 45,342 77,898 362,256
Missan 216 42 162 102 0 636 3,702 390 5,250
Muthanna 708 0 30 36 0 48 2,808 108 3,738
Najaf 1,752 0 114 138 0 234 75,498 258 77,994
Ninewa 5,214 30 0 0 480 5,208 604,884 10,950 626,766
Qadissiya 3,648 90 414 174 0 2,562 16,698 216 23,802
Salah al-Din 1,140 0 0 1,974 0 54,336 14,280 263,070 334,800
Sulaymaniyah 70,866 4,086 12,192 19,902 0 96 15,900 25,020 148,062
Thi-Qar 1,044 72 42 120 0 660 5,796 336 8,070
Wassit 2,838 120 36 120 0 636 20,514 786 25,050
Total 624,924 27,756 38,394 96,318 13,500 258,252 1,513,638 447,252 3,020,034
Table 2. Distribution of IDPs by governorate of displacement and governorate of origin
DISPLACEMENT TRACKING MATRIX | DTM
Legend
Anbar
Najaf
Muthanna
NinewaErbil
Diyala
Wassit
Basrah
Missan
Salah al-Din
Thi-Qar
Dahuk
Qadissiya
Sulaymaniyah
BabylonKerbala
Baghdad
Kirkuk
Anbar
Diyala
Kirkuk
Ninewa
Salahal Din
IDPs’ movements from governorates of originto districts of displacement
Map 2. IDP families by governorate of originThemapshows IDPs’movements from their governorateoforigin to their
current districts of displacement
ANBAR
-9%
NINEWA KIRKUK DIYALA
+1% +1% -1%-1%
SALAH AL-DIN
During the reporting period, onlyNinewa andKirkuk governoratesrecorded an increase as governorates of origin. The number ofIDPsfromKirkukgovernorateincreasedby1%(1,770individuals)because of the ongoing military operations in Al Hawija district.MilitaryoperationsinHawijastartedinAugust2016andasof29May,accordingtotheDTMEmergencyTracking,96,918IDPsfromHawijaarestillindisplacement,whilethenumberofIDPsoriginallyfromNinewa increased by 1% (19,620) because of displacementfromwestMosul, wheremilitary operations are ongoing.
ThenumberofIDPsoriginallyfromAnbardecreasedby9%(58,248individuals).Thedecrease isduetoongoingreturnmovementstoareasinRamadi,HeetandFallujathatwereretakeninmid-2016.
DTM ROUND 72 | MAY 20176
Anbar
Najaf
Muthanna
NinewaErbil
Diyala
Wassit
Basrah
Missan
Salah al-Din
Thi-Qar
Kirkuk
Dahuk
Qadissiya
Sulaymaniyah
BabylonKerbala
Baghdad
Returnee families by governorate of returnHigh concentration
Low concentration
Locations
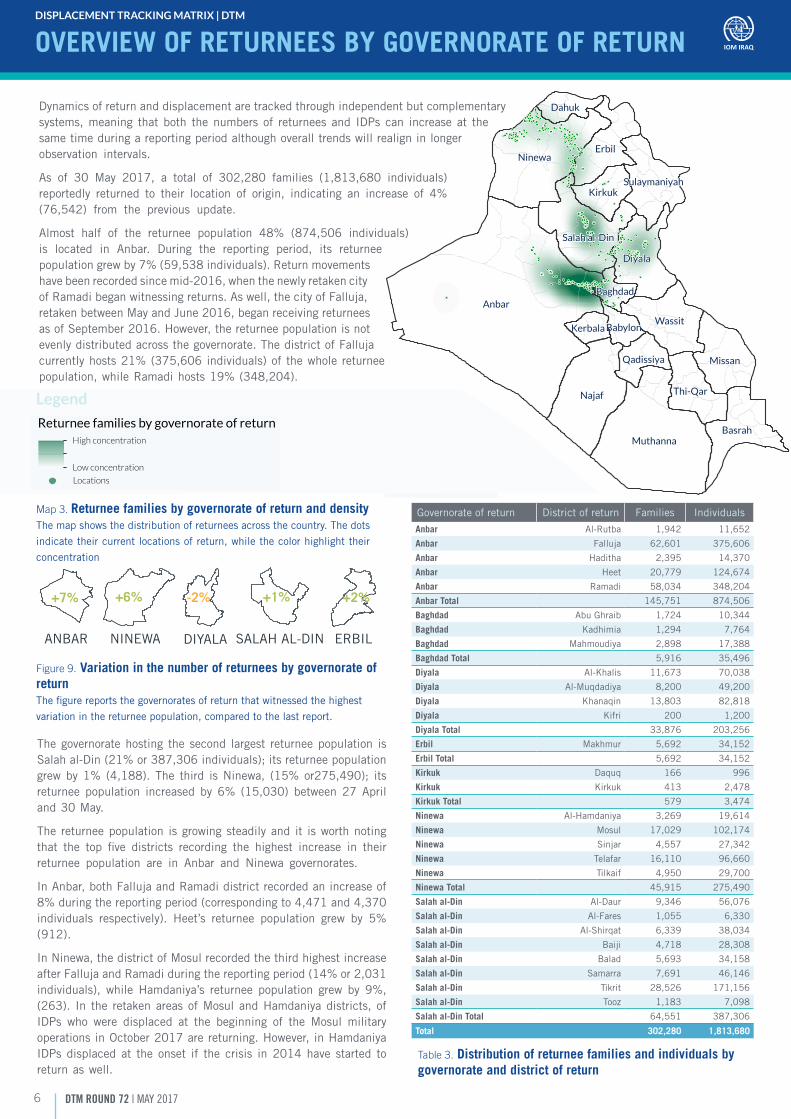
Dynamicsofreturnanddisplacementaretrackedthroughindependentbutcomplementarysystems,meaning thatboth thenumbers of returneesand IDPscan increaseat thesametimeduringareportingperiodalthoughoveralltrendswillrealigninlongerobservation intervals.
As of 30 May 2017, a total of 302,280 families (1,813,680 individuals)reportedly returned to their location of origin, indicating an increase of 4%(76,542) from the previous update.
Almost half of the returnee population 48% (874,506 individuals)is located in Anbar. During the reporting period, its returneepopulationgrewby7%(59,538individuals).Returnmovementshavebeenrecordedsincemid-2016,whenthenewlyretakencityofRamadibeganwitnessingreturns.Aswell,thecityofFalluja,retakenbetweenMayandJune2016,beganreceivingreturneesasofSeptember2016.However,thereturneepopulationisnotevenlydistributedacrossthegovernorate.ThedistrictofFallujacurrentlyhosts21%(375,606individuals)of thewholereturneepopulation,whileRamadihosts19%(348,204).
OVERVIEW OF RETURNEES BY GOVERNORATE OF RETURN
Thegovernoratehosting thesecond largest returneepopulation isSalahal-Din(21%or387,306individuals);itsreturneepopulationgrewby1% (4,188). The third isNinewa, (15%or275,490); itsreturnee population increased by 6% (15,030) between 27Apriland30May.
The returneepopulation isgrowingsteadilyand it isworthnotingthat the top five districts recording the highest increase in theirreturnee population are in Anbar and Ninewa governorates.
InAnbar,bothFallujaandRamadidistrictrecordedanincreaseof8%duringthereportingperiod(correspondingto4,471and4,370individuals respectively). Heet’s returnee population grew by 5%(912).
InNinewa,thedistrictofMosulrecordedthethirdhighestincreaseafterFallujaandRamadiduringthereportingperiod(14%or2,031individuals), whileHamdaniya’s returnee population grew by 9%,(263). In the retakenareasofMosulandHamdaniyadistricts, ofIDPs who were displaced at the beginning of the Mosul militaryoperationsinOctober2017arereturning.However,inHamdaniyaIDPsdisplaced at the onset if the crisis in2014have started toreturnaswell.
Figure 9. Variation in the number of returnees by governorate of return Thefigurereportsthegovernoratesofreturnthatwitnessedthehighest
variationinthereturneepopulation,comparedtothelastreport.
Map 3. Returnee families by governorate of return and densityThemapshowsthedistributionofreturneesacrossthecountry.Thedots
indicatetheircurrentlocationsofreturn,whilethecolorhighlighttheir
concentration
Governorateofreturn Districtofreturn Families Individuals
Anbar Al-Rutba 1,942 11,652
Anbar Falluja 62,601 375,606
Anbar Haditha 2,395 14,370
Anbar Heet 20,779 124,674
Anbar Ramadi 58,034 348,204
Anbar Total 145,751 874,506
Baghdad AbuGhraib 1,724 10,344
Baghdad Kadhimia 1,294 7,764
Baghdad Mahmoudiya 2,898 17,388
Baghdad Total 5,916 35,496
Diyala Al-Khalis 11,673 70,038
Diyala Al-Muqdadiya 8,200 49,200
Diyala Khanaqin 13,803 82,818
Diyala Kifri 200 1,200
Diyala Total 33,876 203,256
Erbil Makhmur 5,692 34,152
Erbil Total 5,692 34,152
Kirkuk Daquq 166 996
Kirkuk Kirkuk 413 2,478
Kirkuk Total 579 3,474
Ninewa Al-Hamdaniya 3,269 19,614
Ninewa Mosul 17,029 102,174
Ninewa Sinjar 4,557 27,342
Ninewa Telafar 16,110 96,660
Ninewa Tilkaif 4,950 29,700
Ninewa Total 45,915 275,490
Salah al-Din Al-Daur 9,346 56,076
Salah al-Din Al-Fares 1,055 6,330
Salah al-Din Al-Shirqat 6,339 38,034
Salah al-Din Baiji 4,718 28,308
Salah al-Din Balad 5,693 34,158
Salah al-Din Samarra 7,691 46,146
Salah al-Din Tikrit 28,526 171,156
Salah al-Din Tooz 1,183 7,098
Salah al-Din Total 64,551 387,306
Total 302,280 1,813,680
Table 3. Distribution of returnee families and individuals by governorate and district of return
DISPLACEMENT TRACKING MATRIX | DTM
Legend
ANBAR
+7%
ERBIL
+2%
NINEWA
+6% +1%
SALAH AL-DINDIYALA
-2%
Anbar
Najaf
Muthanna
NinewaErbil
Diyala
Wassit
Basrah
Missan
Salah al-Din
Thi-Qar
Kirkuk
Dahuk
Qadissiya
Sulaymaniyah
BabylonKerbala
Baghdad
Returnee families by governorate of returnHigh concentration
Low concentration
Locations
DTM ROUND 72 | MAY 2017 7
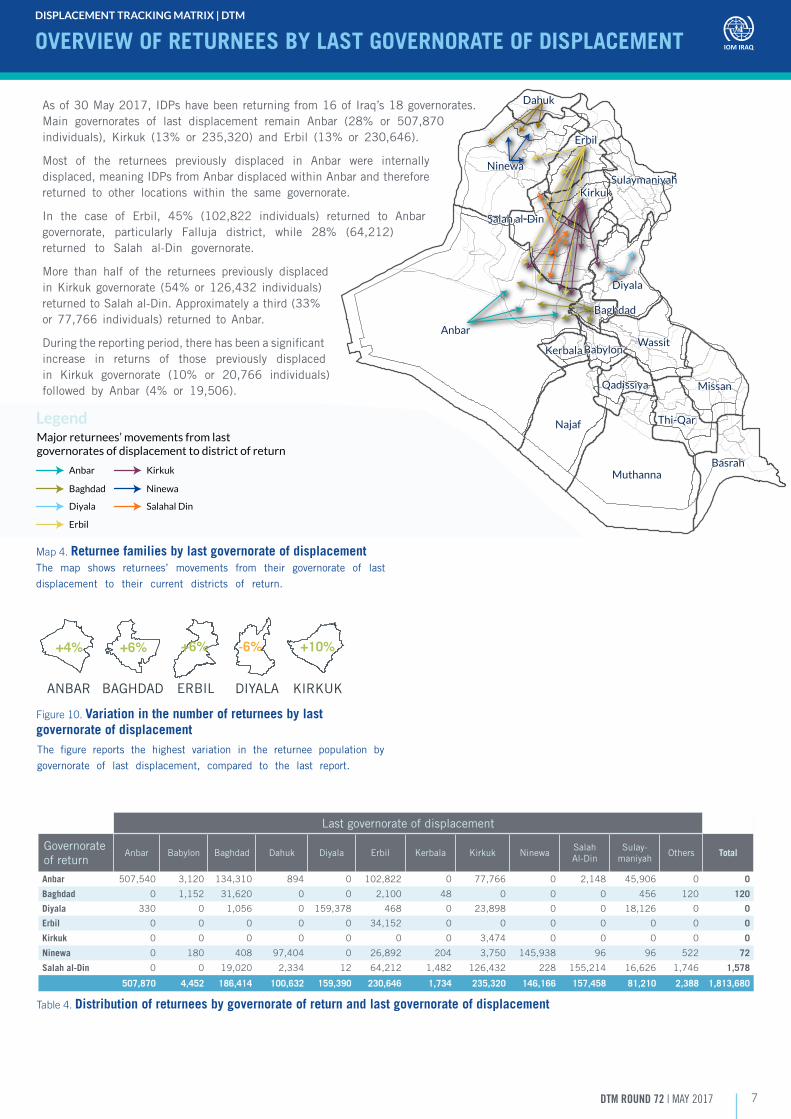
Asof30May2017,IDPshavebeenreturningfrom16ofIraq’s18governorates.Main governorates of last displacement remain Anbar (28% or 507,870individuals), Kirkuk (13% or 235,320) and Erbil (13% or 230,646).
Most of the returnees previously displaced in Anbar were internallydisplaced,meaningIDPsfromAnbardisplacedwithinAnbarandthereforereturned to other locations within the same governorate.
In the case of Erbil, 45% (102,822 individuals) returned to Anbargovernorate, particularly Falluja district, while 28% (64,212)returned to Salah al-Din governorate.
More than half of the returnees previously displacedinKirkukgovernorate (54%or126,432 individuals)returnedtoSalahal-Din.Approximatelyathird(33%or77,766 individuals) returned toAnbar.
Duringthereportingperiod,therehasbeenasignificantincrease in returns of those previously displacedin Kirkuk governorate (10% or 20,766 individuals)followed by Anbar (4% or 19,506).
The figure reports the highest variation in the returnee population by
governorate of last displacement, compared to the last report.
ANBAR BAGHDAD
+4% +6%
ERBIL
+6%
KIRKUK
+10%
DIYALA
-6%
Map 4. Returnee families by last governorate of displacement The map shows returnees’ movements from their governorate of last
displacement to their current districts of return.
Lastgovernorateofdisplacement
Governorateofreturn
Anbar Babylon Baghdad Dahuk Diyala Erbil Kerbala Kirkuk NinewaSalahAl-Din
Sulay-maniyah
Others Total
Anbar 507,540 3,120 134,310 894 0 102,822 0 77,766 0 2,148 45,906 0 0
Baghdad 0 1,152 31,620 0 0 2,100 48 0 0 0 456 120 120
Diyala 330 0 1,056 0 159,378 468 0 23,898 0 0 18,126 0 0
Erbil 0 0 0 0 0 34,152 0 0 0 0 0 0 0
Kirkuk 0 0 0 0 0 0 0 3,474 0 0 0 0 0
Ninewa 0 180 408 97,404 0 26,892 204 3,750 145,938 96 96 522 72
Salah al-Din 0 0 19,020 2,334 12 64,212 1,482 126,432 228 155,214 16,626 1,746 1,578
507,870 4,452 186,414 100,632 159,390 230,646 1,734 235,320 146,166 157,458 81,210 2,388 1,813,680
Table 4. Distribution of returnees by governorate of return and last governorate of displacement
OVERVIEW OF RETURNEES BY LAST GOVERNORATE OF DISPLACEMENT
Anbar
Najaf
Muthanna
Ninewa
Erbil
Diyala
Wassit
Basrah
Missan
Salah al-Din
Thi-Qar
Kirkuk
Dahuk
Qadissiya
Sulaymaniyah
BabylonKerbala
Baghdad
Major returnees’ movements from last governorates of displacement to district of return
Anbar
Baghdad
Diyala
Erbil
Kirkuk
Ninewa
Salahal Din
Figure 10. Variation in the number of returnees by last governorate of displacement
DISPLACEMENT TRACKING MATRIX | DTM
Legend
Anbar
Najaf
Muthanna
Ninewa
Erbil
Diyala
Wassit
Basrah
Missan
Salah al-Din
Thi-Qar
Kirkuk
Dahuk
Qadissiya
Sulaymaniyah
BabylonKerbala
Baghdad
Major returnees’ movements from last governorates of displacement to district of return
Anbar
Baghdad
Diyala
Erbil
Kirkuk
Ninewa
Salahal Din
DTM ROUND 72 | MAY 20178
UnknownCritical SheltersPrivate SettingsCamps
WassitThi-Qar
SulaymaniyahSalah al-Din
QadissiyaNinewa
NajafMuthanna
MissanKirkuk
KerbalaErbil
DiyalaDahukBasrah
BaghdadBabylon
Anbar
0 100,000 200,000 300,000 400,000 500,000 700,000600,000
Habitual Residence UnknownCritical SheltersPrivate Settings
0 100,000 200,000 300,000 400,000 500,000 600,000 700,000 900,000800,000
Salah al-DinNinewaKirkuk
ErbilDiyala
BaghdadAnbar
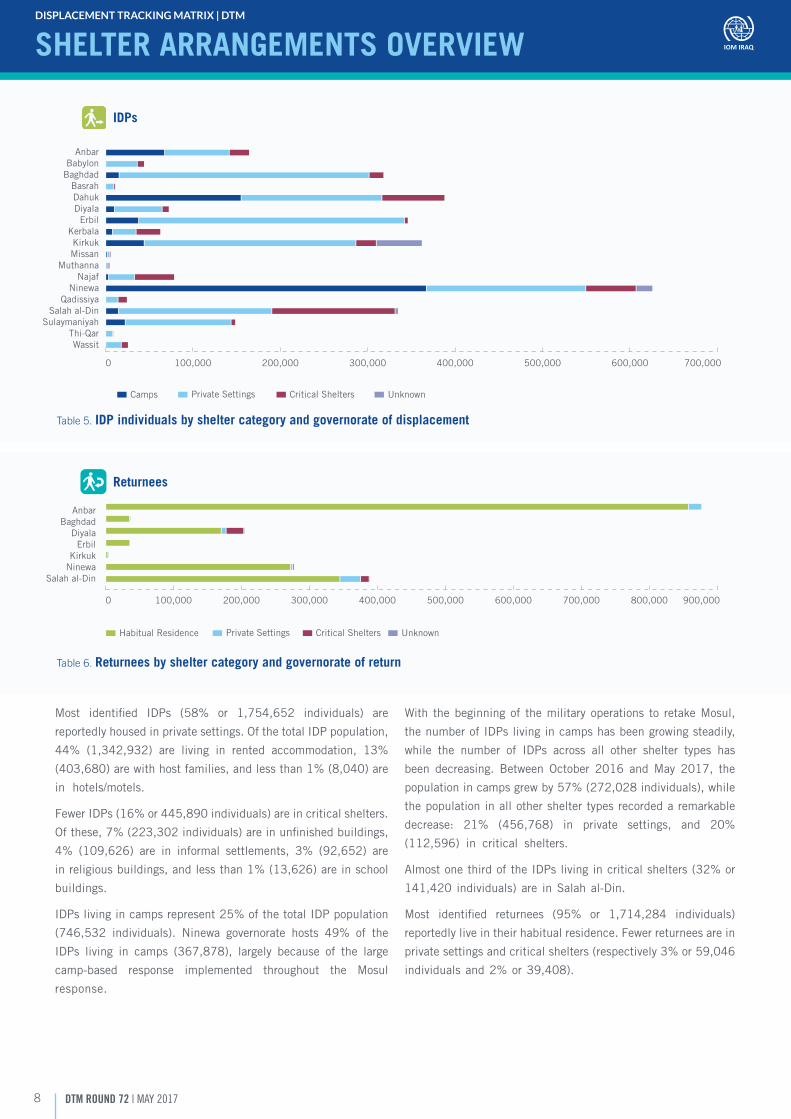
Table 5. IDP individuals by shelter category and governorate of displacement
Table 6. Returnees by shelter category and governorate of return
Most identified IDPs (58% or 1,754,652 individuals) are
reportedlyhousedinprivatesettings.OfthetotalIDPpopulation,
44% (1,342,932) are living in rented accommodation, 13%
(403,680)arewithhostfamilies,andlessthan1%(8,040)are
in hotels/motels.
FewerIDPs(16%or445,890individuals)areincriticalshelters.
Ofthese,7%(223,302individuals)areinunfinishedbuildings,
4% (109,626) are in informal settlements, 3% (92,652) are
inreligiousbuildings,andlessthan1%(13,626)areinschool
buildings.
IDPslivingincampsrepresent25%ofthetotalIDPpopulation
(746,532 individuals). Ninewa governorate hosts 49% of the
IDPs living in camps (367,878), largely because of the large
camp-based response implemented throughout the Mosul
response.
With thebeginningof themilitaryoperations to retakeMosul,
thenumberofIDPslivingincampshasbeengrowingsteadily,
while the number of IDPs across all other shelter types has
been decreasing. BetweenOctober 2016 andMay 2017, the
populationincampsgrewby57%(272,028individuals),while
thepopulationinallothersheltertypesrecordedaremarkable
decrease: 21% (456,768) in private settings, and 20%
(112,596) in critical shelters.
AlmostonethirdoftheIDPslivingincriticalshelters(32%or
141,420 individuals)are inSalahal-Din.
Most identified returnees (95% or 1,714,284 individuals)
reportedlyliveintheirhabitualresidence.Fewerreturneesarein
privatesettingsandcriticalshelters(respectively3%or59,046
individualsand2%or39,408).
SHELTER ARRANGEMENTS OVERVIEWDISPLACEMENT TRACKING MATRIX | DTM
Returnees
IDPs
DTM ROUND 72 | MAY 2017 9
IOM’s DTM aims to monitor displacement and provide accurate data about the IDP and returnee population in Iraq. Data are collected through IOM’s Rapid Assessment and Response Teams (RARTs), composed of 123 staff members deployed accross Iraq.
Data from the IDP Master List and Returnee Master List are gathered through a well-established large network of over 9,500 key informants that includes community leaders, mukhtars, local autorities and security forces. Additional information is gathered from government registration data and partner agencies.
IOM RARTs collect Master List data continuously and report it biweekly. However, limited access as a result of security issues and other operational constraints can affect information-gathering activities. The variation in displacement figures observed between different reporting periods may be due to influencing factors such as the increased accuracy of displacement tracking, continuous identification of previously displaced groups, and the inclusion of data on secondary displacements within Iraq.
The displaced populations are identified through a process of collection, verification, triangulation and validation of data. IOM continues to closely coordinate with federal, regional and local authorities to maintain a shared and accurate understanding of displacement accross Iraq.
METHODOLOGY
DEFINITIONThenumberofindividualsiscalculatedbymultiplyingthenumberoffamiliesbysix,theaveragesizeofanIraqifamily.
TheDTMconsidersasreturneesallthoseindividualspreviouslydisplacedwhoreturntotheirsub-districtoforigin,irrespectiveofwhether
theyhavereturnedtotheirformerresidenceortoanothersheltertype.TheDTM’sdefinitionofreturneesisunrelatedtothecriteriaof
returninginsafetyanddignity,norwithadefinedstrategyforadurablesolution.DTMonlyrecordstheestimatednumberofthosewhofled
theirlocationsoforiginsinceJanuary2014andhavenowreturned;assuch,itfocusesonpermanentreturnanddoesnotcapture“go-
and-see”visits.TheReturneeMasterListisnotdesignedtoassesstheconditionsofthereturnees’houses.Itprovidesaninitialindication
ofwhether the familiesmovedback to the residenceoforigin (referred toashabitual residence)orhad tosettle inalternativeshelter
arrangementsafterreturningtotheirsub-districtoforigin(correspondingtooneofthetencategoriesofsheltertypes).Targetedshelter
assessmentsshouldbecarriedouttoassessthedamagescausedbytheconflict.
Locationisdefinedasanareathatcorrespondseithertoasub-district(i.e.fourthofficialadministrativedivision),avillageforruralareas,
andaneighbourhoodforurbanareas(i.e.fifthofficialadministrativedivision).
Tofacilitateanalysis,thisreportdividesIraqinthreeregions:theKurdistanRegionofIraq(KRI)includesDahuk,SulaymaniyahandErbil
governorates;theSouthincludesBasrah,Missan,Najaf,Thi-Qar,QadissiyaandMuthanagovernorates;theCentralNorthincludesAnbar,
Babylon,Baghdad,Diyala,Kerbala,Kirkuk,Ninewa,Salahal-DinandWassitgovernorates.
ThefigureoftheKRIdoesnotincludepopulationscurrentlydisplacedinthedistrictsofAkre,Al-Shikhan,KifriandKhanaqin.
Private settings:includerentedhouses,hotels/motelsandhostfamilies.
Critical shelters:includeinformalsettlements,religiousbuildings,schools,unfinishedorabandonedbuildingsandotherinformalsettlements.
IOM DISCLAIMERTheinformationcontainedinthisreportisforgeneralinformationpurposesonly.NamesandboundariesonDTMinformationproductsdonotimplyofficial
endorsementoracceptancebyIOM.TheinformationintheDTMportalistheresultofdatacollectedbyIOMfieldteamsandcomplementsinformation
providedandgeneratedbygovernmentalandotherentitiesinIraq.IOMIraqendeavorstokeepthisinformationasuptodateandaccurateaspossible,
butmakesnoclaim—expressedorimplied—onthecompleteness,accuracyandsuitabilityoftheinformationprovidedthroughthisreport.Challenges
thatshouldbetakenintoaccountwhenusingDTMdatainIraqincludethefluidityofthedisplacedpopulationmovementsalongwithrepeatedemergency
situationsandlimitedaccesstolargepartsofthecountry.InnoeventwillIOMbeliableforanylossordamage,whetherdirect,indirectorconsequential,
relatedtotheuseofthisreportandtheinformationprovidedherein.
DISPLACEMENT TRACKING MATRIX | DTM