identifying the key characteristics for road marking and ... · for road marking and stud condition...
TRANSCRIPT

Call 2014: Asset Management and Maintenance
Identifying the key characteristics for road marking and stud condition measurements
Deliverable D1a and D2a
October 2016
Project Coordinator
Project Partners

Identifying the key characteristics for road marking and stud condition measurements, October 2016
Page 2 of 115

CEDR Call 2014: Asset Management and Maintenance
Page 3 of 115
Project Nr. 850730
Project acronym: PREMiUM
Project title: Practical Road Equipment Measurement, Understanding and Management
Deliverable D1a and D2a – Identifying the key characteristics for road marking and stud condition measurements
Due date of deliverable: 30.09.2016
Actual submission date: 30.11.2016
Start date of project: 01.10.2015 End date of project: 30.09.2017
Author(s) this deliverable:
R Spielhofer, Denitsa Osichenko (AIT)
D Leal, E Benbow, A Wright (TRL)
Version: draft 1.0

CEDR Call 2014: Asset Management and Maintenance
Page 4 of 115
Executive summary
The objective of PREMiUM is to deliver improvements in the ability to manage road equipment by developing guidance that can be implemented by road administrations to improve the management of equipment assets. The types of road equipment that PREMiUM has considered are road markings, road signs, vehicle restraint systems and noise barriers.
This report provides guidance describing the key characteristics of condition that should be monitored and the potential condition monitoring regimes that could be implemented to obtain the data required to understand the condition of road markings and studs to support maintenance and asset management decisions at the network level.
Key characteristics and measurement methods for the other three equipment asset types are discussed in separate documents.
PREMiUM wishes to ensure that the proposals for the key survey requirements are aligned with the experience and expectations of stakeholders. Therefore we are issuing this report to stakeholders to invite views on the recommendations that have been made. The project team welcomes comment and views from stakeholders, which will be taken into consideration when confirming the key condition requirements and the survey methodologies.
The PREMiUM project has been let under the CEDR “Call 2014: Asset Management and Maintenance” and funded by the following NRAs: Belgium-Flanders, Finland, Germany, Ireland, Norway, the Netherlands, Sweden, United Kingdom and Austria.

CEDR Call 2014: Asset Management and Maintenance
Page 5 of 115
List of Tables
Table 1: Key condition characteristics of Markings and Studs ............................................. 16
Table 2: Key condition characteristics for Markings and Studs ............................................ 19
Table 3: Marking Night-Time Visibility Assessment, UK from TD26/07 ................................ 20
Table 4: Marking Night-Time Visibility Assessment - Belgium.............................................. 20
Table 5: Marking Night-Time Visibility Assessment - USA, NCHRP Synthesis 2006 ........... 20
Table 6: Marking Night-Time Visibility Assessment - MUTCD, 2009 .................................... 20
Table 7: Marking Night-Time Visibility Assessment NEN-EN1436 (Netherlands). White or yellow .................................................................................................................... 20
Table 8: Night time visibility requirements, using test method defined in ÖNORM EN 1436,
Austria ................................................................................................................... 21
Table 9: Minimum luminance coefficient for retroreflection for permanent markings, Germany .............................................................................................................................. 21
Table 10: Minimum luminance coefficient for retroreflection for temporary markings, Germany .............................................................................................................................. 21
Table 11: Road Studs Night-Time Visibility Minimum Performance Values (EN 1463, Table 4) .............................................................................................................................. 21
Table 12: Marking Day-Time Visibility - EN 1463, Table NA.1, Table 1 and Table 2 ............ 22
Table 13: Marking Day-Time Visibility of markings - NEN-EN 1436 (Netherlands) ............... 22
Table 14: Day time visibility requirements, using test method defined in ÖNORM EN 1436,
Austria ................................................................................................................... 22
Table 15: Minimum coefficient of luminance values under diffuse light conditions, Germany 23
Table 16: Markings Skid Resistance Assessment (SRT) ..................................................... 23
Table 17: Skid Resistance Requirements for markings – NEN EN1436 (Netherlands) ........ 23
Table 18: Current and proposed measurement methods to monitoring of road markings and studs ...................................................................................................................... 31
Table 19: Property groups and their characteristics for road markings ................................ 35
Table 20: Property groups and their characteristics for road studs ...................................... 36
Table 21: Road Marking Night-Time Visibility Minimum Performance Values (EN 1436, Tables 3 to 5) ......................................................................................................... 38
Table 22: Recommended minimum classes for night-time visibility considered most suitable for permanent road marking in the UK (BS EN 1436, Table NA.1) ......................... 39
Table 23: Road Studs Night-Time Visibility Minimum Performance Values (EN 1463, Table 4) .............................................................................................................................. 40
Table 24: Marking Luminance Coefficient Class and Luminance Factor Class (EN 1436, Table 2) ................................................................................................................. 41
Table 25: Recommended minimum classes for day-time visibility considered most suitable for permanent road marking in the UK (BS EN 1436, Table NA.1) ......................... 42
Table 26: Marking Chromaticity Co-ordinates (EN 1436, Table 6) ....................................... 43

CEDR Call 2014: Asset Management and Maintenance
Page 6 of 115
Table 27: Stud Chromaticity Co-ordinates (EN 1463, Table 9) ............................................ 44
Table 28: Minimum and Threshold Skid Resistance Values (SRT) (EN 1436, Table 7 & TD/07 Annex A) ..................................................................................................... 45
Table 29: Characteristic importance ranking, according to the stakeholder review .............. 49
Table 30: Correctness of position for the asset types .......................................................... 60
Table 31: Results of completeness for the asset types ........................................................ 60
Table 32: Spot measurement testing details ........................................................................ 63
List of Figures
Figure 1: Typical measurement methods (current and emerging) to monitor key condition characteristics of road markings ............................................................................ 24
Figure 2: Typical measurement methods (current and emerging) to monitor key condition characteristics of road studs .................................................................................. 25
Figure 3: Night-time visibility measurement of road markings with mobile reflectometer - a) Dynamic Single-line Side-Mounted Retroreflectometer system b) measurement across the full width of traffic line with the system RetroTek-M c) measurement across the full width with Road Marking Collector .................................................. 27
Figure 4: International standards related to road markings and reflective studs ................... 37
Figure 5: Measured inventory characteristics ...................................................................... 49
Figure 6: Measured visibility characteristics ......................................................................... 50
Figure 7: Measured safety and durability characteristics ..................................................... 51
Figure 8: Measurement technologies for monitoring of road markings and studs................. 56
Figure 9: The YAV2 system ................................................................................................. 58
Figure 10: Example images from the YAV2 vehicle. Note the 6 views of from the vehicle, covering two forward views, two rearward and one on each of the near and off sides. ..................................................................................................................... 58
Figure 11: Location of areas for equipment evaluation in Vienna ......................................... 59
Figure 12: The Yotta survey vehicle .................................................................................... 59
Figure 13: The two survey vehicles (truck and passenger car) (left). Example of road markings inventory derived from video survey (right) ............................................. 61
Figure 14: Lidar point clouds ............................................................................................... 62
Figure 15: Data collection vehicle ........................................................................................ 62
Figure 16: The detected candidate lane marking points in 3-D ............................................ 62
Figure 17: Candidate lane marking detection by Hough Transform ..................................... 62
Figure 18: 2-D lane markings after RASANC curve fitting .................................................... 62
Figure 19: Measuring the night time visibility of road markings with hand-held reflectometer63

CEDR Call 2014: Asset Management and Maintenance
Page 7 of 115
Figure 20: Night-time visibility measurement of road markings with mobile reflectometer .... 64
Figure 21: Correlation between mobile devices ................................................................... 65
Figure 22: Mobile reflectometer Ecodyn 30 ......................................................................... 66
Figure 23: Mobile reflectometer LTL-M ................................................................................ 66
Figure 24: Relationship between the two mobile devices – Ecodyn 30 and LTL-M .............. 66
Figure 25: Relationship between the mobile device LTL-M and the hand-held device LTL-2000 ...................................................................................................................... 67
Figure 26: Relationship between the mobile device Ecodyn 30 and the hand-held device LTL-2000 ............................................................................................................... 67
Figure 27: Round Robin Test in Belgium (2010) .................................................................. 67
Figure 28: Repeatability assessment: Cumulative frequency distribution of between run errors ..................................................................................................................... 68
Figure 29: Reproducibility between vehicles (Ecodyn excluded) .......................................... 68
Figure 30: Cumulative frequency distribution of retro-reflectivity values (in 100m averages) over the network normalised and separated into bins of size 10 [mcd.m-2.lx-1] ..... 69
Figure 31: Night-time visibility measurement of road markings with mobile reflectometer - a) Dynamic Single-line Side-Mounted Retroreflectometer system b) measurement across the full width of traffic line with the system RetroTek-M c) measurement across the full width with Road Marking Collector .................................................. 70
Figure 32: LTL-M illustration from the Danish engineering magazine Ingeniøren................. 71
Figure 33: Mobile retro-reflectometer LTL-M ................................................................... 71
Figure 34: LTL-M Software................................................................................................ 71
Figure 35: Road Assets Collected by RetroTek-M in one Lane in One Pass – Lines, Symbols, Studs and Barrier Reflectors .................................................................................. 73
Figure 36: LED lighting system used for Marking Collector .................................................. 74
Figure 37: Road marking reflection under wet condition ...................................................... 75
Figure 38: Road markings at a road trial site in dry conditions ............................................. 75
Figure 39: Road markings at a road trial site during light rain .............................................. 75
Figure 40: Equipment for wet retroreflectivity dynamic measurement .................................. 76
Figure 41: Hand-held measurements of road markings ....................................................... 76
Figure 42: Spraying system with nozzles ............................................................................. 76
Figure 43: Mobile measurement system using LTL-M and an optocator for measurement of the road marking profile. ........................................................................................ 77
Figure 44: The relationship between predicted and measured values of RL(wet) including a 90% prediction interval for individual observations ................................................. 77
Figure 45: Graphical illustration of the measurement principle of road studs ....................... 78
Figure 46: Hand-held reflectometer for the measurement of night time visibility of road studs (Zehntner ZRP 6030) ............................................................................................. 78

CEDR Call 2014: Asset Management and Maintenance
Page 8 of 115
Figure 47: Hand-held reflectometer for the measurement of night time visibility of road studs (EasyLux) .............................................................................................................. 78
Figure 48: Hand-held reflectometer for the measurement of Qd .......................................... 79
Figure 49: Hand-held reflectometer for the measurement of RL and Qd .............................. 79
Figure 50: Day-light contrast measurement using LTL-M retroreflectometer ........................ 80
Figure 51: Scoring system for assessing road marking wear ............................................... 81
Figure 52: Example for scoring system for assessing road marking wear ........................... 82
Figure 53: Measurement of wear assessment of road marking by automatic image analysis .............................................................................................................................. 83
Figure 54: Road marking feature extraction ......................................................................... 83
Figure 55: Tear out (a) and Cracking (b) ............................................................................. 84
Figure 56: Texture of bitumen with road marking ................................................................. 84
Figure 57: Old road marking with time wear ........................................................................ 84
Figure 58: Examples of road marking generation ................................................................ 84
Figure 59: (a) Perlin noise (oct = 6, pers = 0.66, freq = 1) (b) Generated ground truth associate ( = -0.7) .................................................................................................. 84
Figure 60: Measuring the Skid Resistance of road markings with portable Skid Resistance Tester .................................................................................................................... 85
Figure 61: Portable Friction Tester, PFT. Photo: Mohammad-Reza Yahya, VTI. ................. 87
Figure 62: Sample Field where the measurements were made. Photo: Mohammad Reza Yahya, VTI. ............................................................................................................ 87
Figure 63: Traction Watcher One (TWO) ............................................................................. 88
Figure 64: Road Marking Tester (RMT) ............................................................................... 88
Figure 65: Skid resistance and retro-reflectivity measurements on broken white lines ......... 89
Figure 66: Skid resistance and luminance factor measurements on broken white lines ....... 89

CEDR Call 2014: Asset Management and Maintenance
Page 9 of 115
Table of content
Executive summary ............................................................................................................... 4
1 Introduction and purpose of this document ................................................................... 11
2 Summary recommendations for the key characteristics of road marking condition that should be monitored ............................................................................................................ 14
2.1 Road Markings & Reflective Studs ........................................................................ 14
2.2 Knowledge Gathering and Consultation ................................................................ 14
2.3 Key data - Inventory .............................................................................................. 15
2.4 Key data - Condition .............................................................................................. 16
2.5 Key Characteristic 1: Visibility - Night-time Visibility (Retroreflection, RL) .............. 17
2.6 Key Characteristic 2: Visibility - Day-time Visibility ................................................ 17
2.7 Key Characteristic 3: Visibility/Durability - Wear .................................................... 18
2.8 Key Characteristic 4: Safety - Skid Resistance ...................................................... 18
2.9 Further Characteristic: Visibility - Colour ................................................................ 18
2.10 Summary ............................................................................................................... 19
3 Summary recommendations for monitoring methods for road markings and road studs 23
3.1 Monitoring road markings and studs ...................................................................... 23
3.2 Knowledge gathering and consultation .................................................................. 25
3.3 Key Data - Inventory.............................................................................................. 25
3.4 Key Characteristic 1: Visibility - Night-time Visibility (Retroreflection, RL)............... 26
3.5 Key Characteristic 2: Visibility - Day-time Visibility ................................................ 29
3.6 Key Characteristic 3: Visibility/Durability – Wear ................................................... 30
3.7 Key Characteristic 4: Safety - Skid Resistance ...................................................... 30
3.8 Summary of Recommendations ............................................................................ 31
4 Technical Background – Standards and Approach for Understanding Marking and Stud Condition ............................................................................................................................. 34
4.1 Information sources ............................................................................................... 34
4.2 Review of Standards defining the performance of road markings and road studs .. 37
4.3 Review of practice in the assessment of the performance of road markings and road studs 46
4.4 Summary and Recommendations ......................................................................... 52
5 Technical Background – Measuring the Condition of Road Markings ........................... 53
5.1 Information gathering - Survey Provider Questionnaire ......................................... 53
5.2 Information gathering – further consultation and review ........................................ 55
5.3 Key data - Measuring the inventory of road markings and studs ........................... 56
5.4 Measuring the night time visibility of road markings ............................................... 63

CEDR Call 2014: Asset Management and Maintenance
Page 10 of 115
5.5 Key Condition data - Night time visibility of road studs .......................................... 78
5.6 Key Condition data - Daytime visibility of road markings ....................................... 79
5.7 Key Condition data - Wear of road markings and studs ......................................... 81
5.8 Key Condition Data - Skid Resistance of road markings ........................................ 85
6 Definitions .................................................................................................................... 90
7 Sources ........................................................................................................................ 91
Appendix A: NRA Questionnaire ......................................................................................... 93
Appendix B: Survey Provider Questionnaire ...................................................................... 109

CEDR Call 2014: Asset Management and Maintenance
Page 11 of 115
1 Introduction and purpose of this document
The trans-national research programme “Call 2014: Asset Management and Maintenance” was launched by the Conference of European Directors of Roads (CEDR). CEDR is an organisation which brings together the road directors of 25 European countries. The aim of CEDR is to contribute to the development of road engineering as part of an integrated transport system under the social, economical and environmental aspects of sustainability and to promote co-operation between the National Road Administrations (NRA).
The participating NRAs in this Call are Belgium-Flanders, Finland, Germany, Ireland, Norway, the Netherlands, Sweden, United Kingdom and Austria. As in previous collaborative research programmes, the participating members have established a Programme Executive Board (PEB) made up of experts in the topics to be covered. The research budget is jointly provided by the NRAs who provide participants to the PEB as listed above.
Road operators draw on their knowledge of their assets to efficiently manage their road networks. This includes information on asset inventory, asset condition and information on the most appropriate maintenance approach to take for those assets. Although there has been significant growth in the use of objective tools to measure and interpret pavement condition at the network level, this has not been matched for the assessment of road equipment. Previous ERANet research on the assessment of equipment assets has found that the management of equipment such as road signs, lighting, markings, restraint systems, noise barriers and Variable Message Signs is often excluded from the integrated management process. There is a clear need to deliver improvements in the ability to manage these assets.
The objective of PREMiUM is to deliver improvements in the ability to manage road equipment by developing guidance that can be implemented by road administrations to improve the management of equipment assets. In summary the underlying objectives of PREMiUM are:
To establish the condition characteristics a road administration should include in their asset management strategy for these road equipment assets in order to manage the risks of loss of performance of these assets;
To help road owners to understand and balance network level and project level management of these assets so that they can establish a practical monitoring regime that enables the condition to be understood and the risks to be managed;
To identify the existing and emerging measurement tools that could be applied by road owners to understand, monitor and manage these assets;
To propose objective measures that could be applied to understand and quantify the performance of these assets, which are feasible for use at the network level;
To hence enable road administrations to establish a maintenance regime that minimises risks and yet enables the road administration to focus maintenance expenditure on these assets in an efficient manner
The types of road equipment that PREMiUM will consider are road markings, road signs, vehicle restraint systems and noise barriers.
Premium aims to achieve its objectives through four technical work packages:
WP1 Understanding the Asset: The development of better understanding of the equipment asset and the key characteristics of the asset which need to be monitored to manage the asset;

CEDR Call 2014: Asset Management and Maintenance
Page 12 of 115
WP2 Monitoring the Asset: How these key characteristics can be monitored across all equipment assets (i.e. on the network level);
WP3 Evaluating Condition: How this data can be translated into the information required to determine the condition and hence evaluate the risk of failure;
WP4 Management of the Asset: How the information can be used within a management strategy.
The approach taken for WP1 has been to combine technical expertise drawn from the project consortium with a direct stakeholder consultation, to establish current practice and existing and emerging standards. A review of these current practices and standards and consideration of what the objective of the monitoring is and how it will contribute to asset management has been used to propose the key characteristics of condition that need to be understood for each of the equipment asset types.
For WP2, the current measurement practice has been reviewed, along with emerging technologies, by liaising with survey consultants and equipment developers/providers. This has been used to determine how the key characteristics of condition could be monitored and measured at a network level, along with the feasibility of applying the monitoring.
This report provides summary guidance describing the key characteristics of condition that should be monitored to understand the condition of road markings and studs and to support maintenance/asset management decisions at the network level. The summary guidance is presented in section 2, whilst the technical background supporting these recommendations is given in section 4.
This report also provides summary guidance on potential condition monitoring regimes that could be implemented to obtain the data required to understand the condition of road markings and studs to support maintenance and asset management decisions at the network level. These are presented in section 3, with more technical background given in section 5.
PREMiUM wishes to ensure that the proposals for the key survey requirements are aligned with the experience and expectations of stakeholders. Therefore we are issuing this report to stakeholders to invite views on the recommendations that have been made. The project team welcomes comment and views from stakeholders, which will be taken into consideration when confirming the key condition requirements summarised in section 2. Comments will also be welcomed on the survey methodologies that are summarised in section 3, which will be used to support recommendations for implementation trials of these methods.
As a guide to this document, it contains the following key sections:
1 Introduction and purpose of this document: This introduction section
2 Summary recommendations for the key characteristics of road marking condition that should be monitored: Here we present our summary recommendations on the key data required to understand road marking condition.
3 Summary recommendations for monitoring methods for road markings and road studs: Here we present our summary recommendations on the methods that are/could be used to obtain the key data.
As noted above, sections 2 and 3 present the summary recommendations of this work. Detail on the technical background leading to these recommendations is then presented in the following sections, 4 and 5:

CEDR Call 2014: Asset Management and Maintenance
Page 13 of 115
4 Technical Background – Standards: This section presents a review of current standards employed in Europe and elsewhere, which we have drawn upon in developing our recommendations.
5 Technical Background – Measuring the Condition of Road Markings: This section presents a review of current and emerging measurement techniques and proposes potential condition monitoring regimes that could be implemented for road markings and studs.
Finally, Section 6 Definitions presents a summary of the definitions of technical terms used in this document

CEDR Call 2014: Asset Management and Maintenance
Page 14 of 115
2 Summary recommendations for the key characteristics of road marking condition that should be monitored
In this section we present summary guidance on the key characteristics of condition that should be monitored to understand the condition of road markings and studs, and to support maintenance/asset management decisions at the network level.
2.1 Road Markings & Reflective Studs
Road markings and retroreflective studs play a key role in optimising the safety of road users. They have two primary functions.
Guidance. Road markings define the vehicle path (edge/centre/lane lines), ensuring flowing alignment, encouraging lane discipline and hence preventing vehicles from meeting.
Information. Markings and studs indicate carriageway boundaries and areas of the road that are not suitable for traffic (e.g. hatchings). Markings allow the communication of single and continuous messages (e.g. arrows, directions and chevrons). They also impose legal requirements on drivers (e.g. speed limits, stop and give way lines).
In some instances, such as hazard and double white lines, markings serve both functions.
2.2 Knowledge Gathering and Consultation
A review of standards and guidance documents for road markings and studs was undertaken to identify the current objective condition characteristics for road markings/studs that are used to understand the performance and condition of this asset (see Section 4.2).
A consultation was then undertaken with strategic road administrators/asset managers and asset inspection survey providers to seek information on their current practice in managing the condition of road markings and studs. Two sets of questionnaires were designed to engage with these two groups of stakeholders. These questionnaires are provided in Appendices A & B.
The questionnaire for asset managers aimed to understand their current approach to monitoring and managing their road markings and studs (see Section 4.3). It also provided the list of characteristics that are required to be measured (as highlighted in the standards review) and asked participants to rank each one’s importance for efficiently managing the asset.
The questionnaire for asset inspection survey providers was developed and distributed to survey providers in order to understand their current method of inspection, what data they record and the technologies they employ to do so (section 5.1).
This knowledge gathering consultation with asset managers, and further consultation with experts (in the project team or colleagues), was then used to identify the key data requirements for road marking and stud condition, which are listed in the following sections.

CEDR Call 2014: Asset Management and Maintenance
Page 15 of 115
2.3 Key data - Inventory
Throughout the consultation it was found that, to effectively manage the asset, it is important to have information on the asset inventory. A robust and accurate inventory is an essential tool for providing engineers and decision makers with key information about the assets on their road network. Up-to-date inventories are a prerequisite, for all types of assets, for ensuring that continual gains in network quality are made in an efficient way. A vigorous and effective asset management strategy cannot be designed nor implemented if a road authority does not have knowledge of the most basic features and records of their assets (i.e. you cannot manage an asset if you don’t know where it is).
If maintenance, renewal or modernisation of an asset is required, decision makers must be able to efficiently evaluate the specific needs of each part of the asset. To achieve this, a complete inventory is the starting point.
What should an Inventory for Markings and Studs contain? 2.3.1
For any particular asset, such as markings and studs, a well-structured inventory should contain a number of key characteristics, such as:
Location reference1
Type of marking/stud (manufacturer declared data)
Colour of marking/stud
Road marking/stud details
Date of installation
Dates and details of maintenance
Dates and details of last inspection.
The definitions for these terms are given in section 6.
The stakeholder consultation highlighted that even though this information is critical for understanding the performance of the asset, many inventories currently remain out-of-date and incomplete. If inventory records are incomplete or out-of-date there are a number of ways to gather the relevant data to populate them.
Whether an inventory needs to be created or updated and developed, there will be a need to obtain the information required for population.
A location reference refers to the physical location of the asset, using geographical co-ordinates (e.g. OSGR longitude and latitude)1. The inventory should also contain other useful descriptions of the asset’s location, such as: unique network identification code (i.e. area and section marker), road name and number, lane number, carriage way position (nearside or offside), chainage, marker posts, and general geographic references (county/province). The consultation identified a number of high/low speed, office based/on-site techniques available to determine the precise location reference and the type of system and components used, as discussed in section 3. If on-site methods are adopted, these can be combined with detailed inspection to make efficient use of time.
1 Note that it is not practical to record the location reference for each individual marking or stud and
thus the location reference for the start of a length (e.g. 10m) of road where markings or studs are present would be recorded.

CEDR Call 2014: Asset Management and Maintenance
Page 16 of 115
Manufacturer declared data held in an inventory should include all of the information contained on the product’s CE marking e.g. type of marking/stud. If this data is not held, it can be gathered from a review of historical records or by contacting a specialist to identify the system.
The colour of the marking or stud should be recorded as a description of the colour (e.g. “yellow”), a record of the measured chromaticity coordinates (x,y) and the luminance factor, see section 2.9.
The date a marking/stud was installed should be held in a standard format (yyyy/mm/dd). If unknown it can be obtained through a review of historical records such as contract document and scheme bids/awards. It is also possible for an expert to estimate the age of the asset based on a site visit.
The inventory should also hold a date log of previous maintenance intervention (and provide references to the appropriate documents). Further to this it should also briefly describe the nature of each intervention. Similarly the same data should be kept for previous inspections, accompanied by a brief summary of the reported findings. The inventory should also hold details of the contract/scheme ID. The above information can only be compiled, if not already done so, through a review of historical records and documentation.
Difficulties in compiling this information can arise from a number of reasons such as: a lack of organisation (data is not centralised and is scattered amongst different databases and sources), lack of or no data regarding a particular characteristic, lack of communication between owner/operator/contractor, and so on. In the latter case, where an asset is already installed but some data (i.e. type/class of marking/stud) is missing this may require in-situ measurements to be made. However, in some cases it may not be practical or financially viable to collect every piece of data that a perfect inventory may possibly hold.
2.4 Key data - Condition
The results from the questionnaires highlighted a number of key condition characteristics of road markings and studs considered important by NRAs. These are presented in Table 1, in order of importance, as assigned by NRAs. A further characteristic (colour) was also identified, but not attributed as a “key” characteristic.
The following sections discuss each of these characteristics; identifying their corresponding standards/guidance, and the typical measurement frequency. The sections also summarise some of the current measurement techniques identified in the standards review and consultation. However, these are provided as an indication of current approaches used by some NRAs and survey providers. Further detail on measurement methods is given in section 3.
Table 1: Key condition characteristics of Markings and Studs
Rank Property Characteristics
1st Visibility Night-time visibility
2nd
Visibility Day-time Visibility
3rd
Visibility/
Durability Wear
4th Safety Skid Resistance

CEDR Call 2014: Asset Management and Maintenance
Page 17 of 115
2.5 Key Characteristic 1: Visibility - Night-time Visibility (Retroreflection, RL)
Definition: For markings and studs night-time visibility is a measure of the ability of the marking or stud to reflect light projected onto it from the headlamp. The Retroreflectivity quantifies the proportion of the light that is reflected directly back to the original source. The phenomena of retroreflection allows for markings and studs to be adequately visible to the road user during the night-time.
The photometric requirements for road markings are expressed by their coefficient of retroreflected luminance, RL (mcd.m-2.lx-1). This is the ratio between the luminance of the surface to the normal illuminance on the surface.
The photometric requirements for studs are expressed by their coefficient of luminous intensity, R (mcd.lx-1). The only difference between studs and markings in this respect is that studs are a point reflector so their area can be discounted, whereas markings are linear and cumulatively represent a significant proportion of the total carriageway’s surface area.
Standard/Guidance Document: EN 1436, EN 1463 & TD 26/07
Measurement Technique: There are two typical techniques for measuring RL, both employing a retroreflectometer. The established “reference” method would use a hand-held instrument, which is a slow speed manual method. However, there are techniques available which use a retroreflectometer mounted to a vehicle operating at traffic speed. NRAs currently measure night-time visibility using both methods; however traffic speed surveys are the more desirable approach.
Measurement Frequency: Road markings should be routinely inspected on an annual basis. Road studs should be inspected more frequently, every six months.
2.6 Key Characteristic 2: Visibility - Day-time Visibility
Definition: Daytime visibility is a measure of the road markings and stud conspicuity under daylight and road lighting conditions. For road markings there are two appropriate performance measures:
The Coefficient of Luminance, Qd (mcd.m-2.lx-1), measured under diffuse illumination (daylight) is defined as the “quotient of the luminance of the field of the road marking in the given direction by the illuminance on the field”.
The Luminance Factor (β) is defined as the “ratio of the luminance of the field of the road marking in the given direction to that of a perfect reflecting diffuser identically illuminated”.
The assessment of the day-time visibility of road markings can also be achieved through a parameter defined as the day-time contrast of the marking. Day-time contrast is much more significant for the overall visibility than the luminance (or luminance factor) itself, because it expresses how clearly a white line stands out from the surrounding road surface.
The daytime visibility performance of road studs is determined by the luminance factor of the stud.
Standard/Guidance Document: EN 1436, EN 1463 & TD 26/07 for coefficient of luminance and luminance factor.
Measurement Technique: EN 1436 describes the methods for measuring Qd and β. The method for assessing Qd requires the use of a photometer, a photometric sphere and a light

CEDR Call 2014: Asset Management and Maintenance
Page 18 of 115
source. Hand-held systems are available and EN 1436 (Annex A) provides details of the methodology and testing requirements. Alternatively, daytime visibility can be measured using the Luminance factor method. The prescribed method (EN 1436, Annex C) employs a photometer; a number of commercially available systems are available.
Measurement Frequency: EN 1436 and EN 1463 do not specify the inspection frequency for assessing day-time visibility performance. For markings TD 26/07 does not require the measurement of day-time visibility. For studs, TD 26/07 does not require the measurement of daytime visibility in terms of Qd and β. However, it does provide a more general daytime assessment methodology. The general daytime assessment of studs should be carried out every 6 months.
2.7 Key Characteristic 3: Visibility/Durability - Wear
Definition: Wear is a visibility and durability measure of the degree of deterioration a marking or stud has experienced. For markings there are two methods for assessing wear. EN 1790 details the wear simulator turntable laboratory method; this method cannot be applied in-situ. Instead TD 26/07 details the visual method for assessing wear in-situ (described below). For studs, no methodology is set out in EN 1463 and TD 26/07. However it is one of many considerations in the general daytime visibility assessment.
Standard/Guidance Document: TD 26/07
Measurement Technique: For markings, wear assessment is carried out using a scoring system with reference to photographic examples. For studs, professional judgement must be applied, as part of the daytime visual inspection.
Measurement Frequency: For markings inspections should be carried out on a routine basis, annually. For studs, although only subjective assessment of wear is possible, inspections should be carried out every six months.
2.8 Key Characteristic 4: Safety - Skid Resistance
Definition: Skid resistance only applies to road markings. In EN 1436, the skid resistance value, SRT, of a marking is measured using pendulum apparatus, described in Annex D. The SRT value on new markings generally increases during its initial service life; due to trafficking and weathering.
Standard/Guidance Document: EN 1436 & TD 26/07
Measurement Technique: The swinging pendulum apparatus is set up in accordance with EN 1436 on the target marking. This is a slow speed manual survey.
Measurement Frequency: Skid resistance inspections should be carried out annually. Tests should cover 25% of critical areas of the network. Critical areas include regions of the network where skidding or potential accident are likely to occur (such as “Give Way” and “Stop” markings, large areas of markings and transverse yellow bars). For each inspection, representative measurements should be made for every 2000m2 of markings.
2.9 Further Characteristic: Visibility - Colour
Definition: The colour of a road marking and a reflective stud, under dry conditions, is defined by its chromaticity co-ordinates (x,y) and luminance factor (β), measured against CIE standard Illuminant D65. The CIE system characterises colours based on their luminance factor and colour coordinates. The colour co-ordinates identify the location on the standard

CEDR Call 2014: Asset Management and Maintenance
Page 19 of 115
chromaticity space diagram. The luminance factor is the ratio of the luminance when illuminated under standard conditions to that of a perfect diffuser under the same conditions. It represents a highly accurate approach to colour determination.
Standard/Guidance Document: EN 1436 & EN 1463
Measurement Technique: There are two methods (Tristimulus & Spectral) to determine colour, and both methods apply for markings and studs. Both require objective spot measurements, which are manual and slow-speed.
Measurement Frequency: EN 1436 and EN 1463 do not specify or recommend an inspection frequency for either road markings or road studs.
Whilst the NRAs felt that it was important to know the colour of their road studs and markings, this was not a factor that was measured throughout the life of the asset. Thus, it is felt that colour should not be considered to be a key characteristic of condition but more an inventory characteristic, and therefore it has been included in the requirements for inventory in section 2.3
2.10 Summary
The key characteristics, describing the condition of road markings and studs, are summarised in Table 2, along with the measurements that can be used to determine the characteristics, the measurement units and also any thresholds that are applied to the measurements.
Table 2: Key condition characteristics for Markings and Studs
Key Characteristic
Measurement Units Thresholds applied
Night-time visibility (markings)
Coefficient of retro-reflected luminance, RL
mcd.m-2
.lx-1
See Table 3 to Table 10
Night-time visibility (studs)
Coefficient of luminous intensity, R (mcd.lx
-1)
mcd.lx-1
Table 11
Day-time Visibility (markings)
Contrast (greyscale pixel difference)
Coefficient of Luminance, Qd
Luminance Factor (β)
Unit-less
mcd.m-2
.lx-1
Unit-less
None defined
Table 12, Table 13, Table 14 and Table 15
Wear (markings) Amount of marking missing
Percentage (%)
Replace when 70% of marking remains (immediately if in a safety critical location) (TD26/07)
Skid Resistance (markings)
Skid resistance value, SRT
Unit-less Table 16 and Table 17

CEDR Call 2014: Asset Management and Maintenance
Page 20 of 115
Table 3: Marking Night-Time Visibility Assessment, UK from TD26/07
RL Value (mcd.m-2
.lx-1
) Action
>100 No action
>80 and ≤100 Further inspection required. May lead to replacement scheduling.
≤80
If road marking is located on a single carriageway, near an interchange, or more than 1 mile of road is affected, replace immediately.
Otherwise schedule for replacement
Table 4: Marking Night-Time Visibility Assessment - Belgium
New lines In service lines
Type of line Minimum Class Milli-candela Action required
White - highways RL ≥ 150 1 0-79 Repaint as soon as possible
White – other roads RL ≥ 100 2 80-99 Repaint within the next year
Yellow – Y1 RL ≥ 80 3 100-149 Follow up the following year
Yellow – Y2 RL ≥ 150 4 150-199 Line ok
5 200+ Line very good
Table 5: Marking Night-Time Visibility Assessment - USA, NCHRP Synthesis 2006
Material colour Major collector and arterial (35-50mph)
Highways, Freeways and all roads (≥55mph)
White 80 mcd/m2/lux 100 mcd/m
2/lux
Yellow 65 mcd/m2/lux 80 mcd/m
2/lux
Table 6: Marking Night-Time Visibility Assessment - MUTCD, 2009
Road type Posted speed
35-50mph ≥55mph
Two-lane roads with centreline markings only 100 mcd/m2/lux 250 mcd/m
2/lux
All other roads 50 mcd/m2/lux 100 mcd/m
2/lux
Table 7: Marking Night-Time Visibility Assessment NEN-EN1436 (Netherlands). White or yellow
Conditions Class Minimum retroflection requirement
Dry conditions R2 100 mcd/m2/lux
R5 – preformed marking 300 mcd/m2/lux
R2 - Type II marking 100 mcd/m2/lux
Wet conditions Type II marking 35 mcd/m2/lux

CEDR Call 2014: Asset Management and Maintenance
Page 21 of 115
Table 8: Night time visibility requirements, using test method defined in ÖNORM EN 1436,
Austria
Type and colour of marking Class Retroflection requirement, RL (mcd/m2/lux)
Permanent White
R2a
R4b
RL ≥ 100
RL ≥ 200
Yellow R1 RL ≥ 80
Temporary Orange
R3 RL ≥ 150 White & yellow
a For markings in class D, the test method described in Appendix A may also be used
b Class R4 applies to markings of class A, B and C when new, within 7 and 28 days after application
Table 9: Minimum luminance coefficient for retroreflection for permanent markings, Germany
Type of marking
Type I and II Markings, dry
New In-service
mcd/m2/lux Class mcd/m
2/lux Class
Tapes 300 R5 150 R3
Other 200 R4 100 R2
Type II Markings, wet
Tapes 75 RW4 35 RW2
Other 50 RW3 25 RW1
Table 10: Minimum luminance coefficient for retroreflection for temporary markings, Germany
Time after application
Road marking Type I and II, dry Road marking Type II, wet
mcd/m2/lux Class mcd/m
2/lux Class
Up to 90 days 200 R4 50 RW3
From 91 to 120 days 150 R3 35 RW2
More than 120 days 100 R2 25 RW1
Table 11: Road Studs Night-Time Visibility Minimum Performance Values (EN 1463, Table 4)
Entrance Angle
(β)
Observation angle
(α)
Minimum R Value (mcd · lx-1
)
Type of Stud
1
(Glass)
2
(Plastic)
3
(Plastic*)
± 15° 2.0° 2 2.5 1.5
± 10° 1.0° 10 25 10
± 5° 0.3° 20 220 150
*Plastic stud with abrasion resistant layer

CEDR Call 2014: Asset Management and Maintenance
Page 22 of 115
Table 12: Marking Day-Time Visibility - EN 1463, Table NA.1, Table 1 and Table 2
Enhanced performance required
Street lighting status
Recommended minimum values required for Qd or β
Dark asphalt Light asphalt or concrete
Qd β Qd β
None
Unlit/partially lit/dimmed
≥130 ≥0.30 ≥160 ≥0.40
Lit ≥130 ≥0.30 ≥160 ≥0.40
Enhanced Forward visibility/Safety critical sites (machine applied)
Unlit/partially lit/dimmed
≥160 ≥0.40 ≥200 ≥0.50
Lit ≥160 ≥0.40 ≥200 ≥0.50
Enhanced Forward visibility/Safety critical sites (hand applied)
Any ≥160 ≥0.40 ≥200 ≥0.50
4 Lane & wider carriageways Any ≥160 ≥0.40 ≥200 ≥0.50
Table 13: Marking Day-Time Visibility of markings - NEN-EN 1436 (Netherlands)
Colour of marking Class Recommended minimum values required for Luminance factor or coefficient
White
B3 β≥0.4
B5 (preformed markings)
β≥0.6
Q3, Type II marking Qd≥130
Yellow
B1 β≥0.2
B3 (preformed markings)
β≥0.4
Q2, Type II marking Qd≥100
Table 14: Day time visibility requirements, using test method defined in ÖNORM EN 1436,
Austria
Colour Surface type Class for Qda
Coefficient of luminance Class for β
Luminance factor
Permanent
White Asphalt Q2 Qd ≥ 100 B2 β ≥ 0.30
Concrete Q3 Qd ≥ 130 B3 β ≥ 0.40
Yellow Asphalt/concrete Q2 Qd ≥ 100 B1 β ≥ 0.20
Temporary
Orange Asphalt/concrete Q2 Qd ≥ 100 - β ≥ 0.10
White Asphalt/concrete Q2 Qd ≥ 100 B6 β ≥ 0.70
Yellow Asphalt/concrete Q2 Qd ≥ 100 B3 β ≥ 0.40
a For the assessment of pavement markings, increased night-time visibility in wet conditions may only be applied to the
coefficient of luminance, Qd

CEDR Call 2014: Asset Management and Maintenance
Page 23 of 115
Table 15: Minimum coefficient of luminance values under diffuse light conditions, Germany
Type of marking
New In-service
mcd/m2/lux Class mcd/m
2/lux Class
Permanent 160 Q4 130 Q3
Temporary 100 Q2 100 Q2
Table 16: Markings Skid Resistance Assessment (SRT)
Minimum SRT Value for each class of road marking (EN1436, Table7)
Threshold Level (TD26/07 Annex A)
Class
S0
S1
S2
S3
S4
S5
Required performance
No Performance Determined
SRT ≥ 45
SRT ≥ 50
SRT ≥ 55
SRT ≥ 60
SRT ≥ 65
SRT <45 for Normal Markings
SRT <55 for Large Surface Areas
SRT <55 for Transverse Yellow Bars
Table 17: Skid Resistance Requirements for markings – NEN EN1436 (Netherlands)
Class and minimum threshold level
Skid resistance of marking with dry film thickness <0.5mm S2, SRT ≥ 50
Skid resistance of marking with dry film thickness ≥0.5mm S3, SRT ≥ 55
Skid resistance of a Type II marking S1, SRT ≥ 45
Skid resistance of preformed marking S3, SRT ≥ 55
Skid resistance of demarking or black lines to make white lines invisible
S3, SRT ≥ 55
3 Summary recommendations for monitoring methods for road markings and road studs
3.1 Monitoring road markings and studs
Measuring the condition of road markings and studs at the network level is challenging because, as noted in Section 2, there are a number of different key characteristics of the condition which need to be measured, and there are very specific technical requirements given for the way in which these measurements should be collected.
In this section we will discuss the measurement techniques that have been identified within PREMIUM which have potential to provide information to NRAs on the key condition characteristics identified in Section 2. These include existing technologies that have been applied on the network, and emerging equipment with which there may be less experience at the network level, but which have stong potential. Figure 1 and Figure 2 present a summary of these measurement methods.

CEDR Call 2014: Asset Management and Maintenance
Page 24 of 115
Figure 1: Typical measurement methods (current and emerging) to monitor key condition characteristics of road markings
Monitoring Road Markings
Inventory data
Location, details
Video
survey LiDAR
Visibility
Night-time visibility
Mobile reflectometer
Day-time visibility
(contrast)
Mobile reflectometer
Wear
LiDAR
Skid resistance
Mobile
device

CEDR Call 2014: Asset Management and Maintenance
Page 25 of 115
Figure 2: Typical measurement methods (current and emerging) to monitor key condition characteristics of road studs
3.2 Knowledge gathering and consultation
A knowledge gathering exercise was carried out to seek information on the methods available for the measurement of road markings and road studs. This included a review of available literature on equipment, consultation with providers of data and a questionnaire for asset inspection survey providers. The questionnaire was developed and distributed to survey providers in order to understand their current method of inspection, what data they record and the technologies they employ to do so.
Additional consultations with different survey providers were used to provide more details about the mobile measurement systems and the technical specifications against which the measurements were recorded. The projects ASCAM and TRIMM were identified as resources for different measurement techniques for monitoring of road markings and studs and comparative studies of reflectivity measurements. A literature review has shown that several tests have reported measurement of road markings and stud characteristics at traffic speed.
The following sections summarise the main observations and recommendations derived from the knowledge gathering and consultation exercise. The recommendations are broken down by key data requirement, as defined in section 2.
3.3 Key Data - Inventory
The following methods were identified as currently being used to measure the inventory of road markings and studs. These methods collect information about the inventory characteristics, including type, length, width etc.:
Historical Record Review: Reference to existing records such as construction drawings, documentation and contracts.
Slow Speed Visual Survey: Field Inventory can be collected using a slow speed manual survey utilising a hand-held GPS data logging device, notepad, measurement equipment, tablet PC/laptop with suitable software (macros). However, this method requires traffic management (TM) for road closures. Depending on the extent of the closure, TM time constraints, weather, number of lanes, and general health and safety conditions, a single inspection (carried out by an experienced inspector) could survey markings and studs on 3-5km of the road network on foot per night.
Traffic-speed Visual Survey: Vehicles enabled with GPS/GNSS recording devices forward facing imaging capabilities, and odometer. This method does not require traffic management, and is performed during the day-time, at traffic speed. Weather conditions should be dry and clear. The accuracy of GPS devices can vary depending on their quality and signal strength at time of measurement. Considering the narrow dimensions of road markings and studs, it is appropriate that any location co-ordinates have an accuracy of ±2m. Other descriptions of the location should be to a level of detail that would allow any survey provider to locate the assets without GPS co-ordinates.
A desktop survey utilising up-to-date satellite and street-view maps/imagery (e.g. Google Earth Pro/StreetView, Ordnance Survey) can also be undertaken to determine the exact geographical location of assets. However, the accuracy of

CEDR Call 2014: Asset Management and Maintenance
Page 26 of 115
satellite imagery, such as Google Maps, can vary; in some cases co-ordinates can be several meters out when compared with measurements taken onsite using a high accuracy GPS device.
In addition, several recent studies were identified that have investigated road marking detection and extraction using LiDAR technology, which have shown reliable results. Thus the following new/emerging technology can also be used to provide inventory data for road markings:
LiDAR survey (traffic-speed): Vehicles enabled with GPS/GNSS recording devices, LiDAR, and odometer. This method does not require traffic management, and can be performed at any time of day, at traffic speed. However, weather conditions should be dry and clear and there is benefit in also having video data available (suggesting that a daytime survey would be most suitable).
The results of the review show that it is practical to obtain inventory data on road markings and studs using traffic-speed techniques, including traffic speed video surveys, and LiDAR surveys.
For Inventory data PREMIUM therefore recommends that:
NRAs should continue to make use of their ongoing maintenance programmes to maximise the accuracy of their databases. As road markings tend to be replaced on a fairly regular basis (every few years) it should be possible to populate and update the inventory for such assets relatively frequently.
Video and LiDAR based methods should be more widely adopted by NRAs to update and maintain the population of their inventory databases on road marking and road studs.
To implement a reliable and accurate routine high-speed, network level survey for inventory of road markings and studs, it is suggested that:
Any system being used for the collection of inventory is tested against a suitable reference to provide information and understanding on the capability of the high speed systems (video/LiDAR). This would confirm that the inventory items are accurately located and reported.
Most methods for extraction of asset types, which are described in section 5 in this document, are manual. Thus just collecting video and LiDAR data will not provide a practical network level survey. Thus there would be benefit in the development of automated extraction processes for the identification of road markings and stud items within the LiDAR and image survey data.
3.4 Key Characteristic 1: Visibility - Night-time Visibility (Retroreflection, RL)
Measurement techniques 3.4.1
The main established technique for measuring RL employs a retroreflectometer at low speed. A slow speed manual survey is carried out using a hand-held GPS data logging device, a hand-held retroreflectometer. This method requires traffic management (TM) for road closures. These inspections normally occur during night-time hours (8/9pm – 5am). Depending on the extent of the closure, traffic management time constraints, weather, and general health and safety conditions, a single inspection (carried out by an experienced inspector) could survey markings and studs on 3-5km of the road network on foot per night.

CEDR Call 2014: Asset Management and Maintenance
Page 27 of 115
However, for the purposes of PREMIUM it is felt that the low speed survey is not a practical option to provide measurement data at the network level.
Fortunately, the review has identified a number of traffic speed methods to measure RL. In a traffic-speed retroreflectivity survey a vehicle enabled with GPS/GNSS (e.g. OXTS or Trimble Applanix) and a retroreflectometer is used to measure the night-time visibility. This method does not require traffic management, and is performed during the day-time or night-time, at traffic speed. Weather conditions should be dry and clear.
However, the accuracy of some of the mobile systems has been called into question, due to the difference in measurement technique to the hand-held devices. The measurements from mobile reflectometers have therefore been compared with hand-held devices in a number of research projects. Current results have shown reasonable correlation between hand-held references and traffic-speed instruments. However, there is still some concern over the measurements because of the range of different approaches (equipment) used to measure RL and the difficulties in measuring the wide range of markings present on the network. For example, common measurement practise is to measure the night-time visibility of road marking only one side as shown in Figure 3 a), but some systems can provide measurement across the full width of traffic line - Figure 3 b) and c). In addition PREMIUM has found that there are attempts being made to employ LiDAR technologies to measure night-time visibility. This method shows potential but is not yet well tested or understood.
Figure 3: Night-time visibility measurement of road markings with mobile reflectometer - a) Dynamic Single-line Side-Mounted Retroreflectometer system b) measurement across the full width of traffic line with the system RetroTek-M c) measurement across the full width with Road Marking Collector
The visibility of road markings in wet conditions is very important for traffic safety. A project, named RAINVISION investigated the influence of the performance of road markings on driver behaviour under all weather conditions, (i.e. dry, wet, wet and rainy) during night time driving. The project found that most road markings provide a good visibility in dry conditions, but their efficiency can substantially diminish in wet conditions. PREMIUM was not able to identify any existing routine equipment able to measure this property. However, one survey provider offers a system that claims to be able to estimate predicted retroreflectivity in wet conditions Rw, but more research is needed to confirm this.
Evidence has been seen that there are some systems that can detect the presence of studs (i.e. the night-time visibility) and report where they are missing (e.g. RetroTek-M). However,

CEDR Call 2014: Asset Management and Maintenance
Page 28 of 115
none of the systems claim to be able to report the levels of retro-reflectivity offered by an individual stud.
Recommendations for measurement of Night-time Visibility 3.4.2
PREMIUM is able to conclude that traffic speed techniques have reached a stage where they are appropriate to provide information on the night-time visibility of dry road markings (RL (mcd.m-2.lx-1) at the network level. However, it would be desirable to undertake further work to assist in the development and implementation of these techniques, including a round robin test, carried out under supervision of an independent auditor.
PREMIUM was not able to identify a method or survey, at a ready for market level, which could be practically applied at the network level for measurement of the retroreflectivity of wet road markings. One survey provider claimed to be able to estimate predicted retroreflectivity in wet conditions Rw, but there has been little research undertaken to confirm this. It would be desirable to undertake further work to assist in the development and implementation of this technique.
For night-time visibility PREMIUM therefore recommends that
NRAs consider the expansion of current surveys of the night time visibility of dry road markings from the current somewhat disparate, project or localised approach, to a more formalised network level survey. This will allow the condition of this asset to be better understood. This should be achievable in practice using the emerging traffic speed survey technologies.
To assist NRAs in selecting and understanding the appropriate systems to apply in network level surveys there would be benefit in undertaking further assessment of the equipment and to consider how the data can be accommodated within current or new standards.
o The accuracy, precision and consistency of the latest mobile systems should be further investigated, and compared with hand-held devices. This would aim to provide NRAs with robust guidance on the devices and their capability in real-world conditions.
o The investigation should include comparison between dynamic single-line side-mounted retroreflectometers and the measurement systems which collect information across the full width. This research would help understand the advantages and disadvantages of both types of system, to define which method has better potential for measurements at network level.
o The investigation should also aim to help NRAs understand the capability of systems which offer network level data, but at non-standard geometries. If the data provided by these systems is still acceptable for the separation of sound and poorly performing markings the greater level of practicality provided by the non-standard devices could offer significant improvements in the ability to achieve network level assessment. This would open up opportunities for use of new technologies such as LiDAR and imaging systems.
o The investigation should also seek to confirm the capability of systems claiming to assess the condition of road studs. This could also help to clarify the performance requirements for road stud assessment at the network level.
As it is not yet practical to undertake measurements of the wet night time visibility, it is suggested that further work be carried out to fill this gap:
o Practical trials of current systems could provide more details about the measurement of night-time visibility in wet conditions. However, the case studies described in section 5 in this document concluded that these

CEDR Call 2014: Asset Management and Maintenance
Page 29 of 115
measurements are very complicated because of the need to use plenty of water. Therefore there would be benefit in investigating the feasibility of developing a new traffic speed technique, or prediction model, for assessing the relative level of performance in wet conditions.
3.5 Key Characteristic 2: Visibility - Day-time Visibility
Measurement techniques 3.5.1
The main established technique to measure the day-time visibility (coefficient of luminance, Qd and the luminance factor, β) is a daytime visibility survey carried out at low speed. In this survey the coefficient of luminance and luminance factor is measured using a hand-held photometer, a photometric sphere and a light source. Traffic management is required for this method.
Currently there is no routine method for measuring the day-time visibility (Qd and β) at traffic speed, for network level assessment. However, during our research into measurement systems, PREMIUM found one survey provider offering a system that claims to be able to estimate the luminance coefficient under diffuse illumination Qd in dry conditions. They also claim to measure, friction (skid resistance) and wear using automatic image analysis. However this capability has not been proven with rigorous testing. Clearly if such a system was available then this offers the potential to provide this data to NRAs.
Whilst high speed devices can’t measure the day-time visibility at traffic speed, they can provide information about the daytime contrast. Daytime contrast is often reported as the ratio between the light reflected from the line and the light reflected from the road either side of the line. For example Daytime contrast = 2 means that the line is twice as bright as the road. More specifically, the grey level of the road line is twice the grey level of the road surface. Thus a measurement of contrast could provide an alternative (proxy) measurement to coefficient of luminance and luminance factor.
Recommendations for measurement of Daytime visibility 3.5.2
The measurement of daytime contrast offers the potential for network surveys that could offer proxy data to replace the direct measurement of daytime visibility. However, it needs to be confirmed that this is an adequate measure of this property. However, there is also an emerging system for the direct assessment of daytime visibility.
For day-time visibility PREMIUM therefore recommends:
Alternative use of contrast for daytime visibility: o Thoroughly test the measurement of daytime contrast through practical trials
to assist NRAs in understanding how such data could be accommodated within current or new standards and how to select appropriate systems to apply in network level surveys.
Investigate and testing the high speed system that claims to provide information about daytime visibility (in diffuse illumination Qd). This could include:
o Investigation into the correlation between day-time and night-time visibility. o Advice to help NRAs understand the capability of system and its application at
network level. o Development and validation of a prediction model for the diffuse illumination
Qd using data from mobile measurement.

CEDR Call 2014: Asset Management and Maintenance
Page 30 of 115
3.6 Key Characteristic 3: Visibility/Durability – Wear
Measurement techniques 3.6.1
The visibility and durability characteristic Wear is currently measured during visual inspection using a scoring system with reference to photographic examples. Images of the road markings can be collected at traffic speed but currently typically require manual analysis:
Wear survey (low speed): A walked visual inspection of the wear of each road marking. Wear assessment is carried out using a scoring system with reference to photographic examples. For studs, professional judgement must be applied, as part of the daytime visual inspection. Traffic management is required for this method.
Wear survey (traffic speed/manual analysis): Vehicles enabled with GPS/GNSS recording devices, forward and downward facing imaging capabilities, and odometer. This method does not require traffic management, and is performed during the day-time, at traffic speed. Weather conditions should be dry and clear. However, the images require manual analysis to assess the wear.
PREMiUM has found that progress is being made in the measurement of wear. One survey provider offers a system that claims to predict wear via automatic image analysis. A tool was also identified that can be used for road marking extraction from images. These examples show that automatic image analysis has potential, but more investigation is needed to develop and validate the algorithms. In addition several recent studies investigating road marking detection and extraction with LiDAR have shown reliable results.
Recommendations for measurement of Wear 3.6.2
It is clear that the use of image analysis has potential to provide network level assessment of wear. However, the research to date is inconclusive and incomplete. More investigation is clearly needed to develop and validate the method. This could include further work on the algorithms themselves, or work on the approach to quantify the wear once image analysis has been applied – e.g. the development of a catalogue with limit values and a scoring system (for example: “wear under 10%”). Additionally, there may be potential to use laser based methods, such as LiDAR to detect and extract road markings and to determine wear.
For wear PREMIUM therefore recommends that:
For both walked inspections and automatic analysis there is a lack of clarity associated with assigning a condition category/score to the wear present. A catalogue/guide should be developed to standardise this .
The emerging automated techniques should be tested and validated through comparison with reference data (e.g. obtained using the above scoring system). Further development of algorithms for automatic analysis of images or LiDAR data should be undertaken as required.
3.7 Key Characteristic 4: Safety - Skid Resistance
Measurement techniques 3.7.1
To measure the skid resistance of road marking NRA’s commonly use the standard swinging pendulum apparatus. This equipment has to manually be placed on each road marking to be tested and traffic management is required for this method.
The measurement of skid resistance at traffic speed difficult to make as it requires the traffic speed device to occupy two lanes so that the marking can be measured. Also the driving line

CEDR Call 2014: Asset Management and Maintenance
Page 31 of 115
must be precise so that the line is covered. PREMIUM did not identify any routine methods to measure skid resistance, and hence the network level. However, the measurement is not impossible to carry out using high speed systems, and the research has shown good correlation between these mobile and static measurements.
The review also found that other research has considered this problem from a different viewpoint – investigating whether a relationship can be established between other measurements of road marking performance (such as night-time visibility) and skid resistance, to hence provide a “proxy” method that does not required the direct measurement of skid resistance.
Recommendations for measurement of Skid Resistance 3.7.2
It would potentially be feasible to collect skid resistance data over long lengths of markings if it is considered essential to an asset management regime. However, there are issues with the practicality of carrying out surveys with current high-speed skid resistance measurements systems and concern over the accuracy of emerging mobile methods. Currently proposed models to predict friction at traffic speed are also not good enough to be useful in practice, and the proxy approach (using retroreflectivity), has only had limited investigation.
Larger-scale investigations, using different devices to measure the skid resistance and retroreflectivity at traffic speed, could help to identify a potential mobile system, prediction model or proxy methodology that could be applied by NRAs in routine assessments.
For Skid Resistance PREMIUM therefore recommends that:
The potential and accuracy of high speed devices are tested through practical trials.
Investigate whether a prediction model exists and, if not, develop one. Then assess its performance through practical trials.
Investigate whether proxy methods really could work, for all road marking types, hence removing the need for direct assessment. This could be achieved through practical trials.
3.8 Summary of Recommendations
A summary of the methods recommended for network measurement of the key characteristics is given in Table 18. Some of the methods proposed are not currently implemented, or not fully developed yet. Therefore the table also summarises the recommendations on the work that needs to be done to achieve the recommended network level outcomes.
For the characteristics and methods highlighted as bold, we believe that if suitable investment is made, then routine network level monitoring of these characteristics could be achieved within 3-5 years.
Table 18: Current and proposed measurement methods to monitoring of road markings and studs
Property Characteristics
Recommended method to achieve network level requirement
PREMIUM recommendations for work required to achieve recommended method
Inventory Location reference
Type of
Video survey
Encourage wider adoption of video and LiDAR surveys to collect inventory data.
Obtain better understanding of capability of

CEDR Call 2014: Asset Management and Maintenance
Page 32 of 115
Property Characteristics
Recommended method to achieve network level requirement
PREMIUM recommendations for work required to achieve recommended method
marking/stud
Road marking/stud details
LiDAR
current systems.
Develop automated extraction processes for LiDAR and image surveys.
Date of construction
Dates and details of maintenance
Dates and details of last inspection
Historical records
Make better use of NRA ongoing maintenance programmes to maximise the accuracy of databases
Visibility Night-time visibility (Dry)
Mobile reflectometers are available and there are new emerging systems
Traffic-speed systems are reaching a level such that they can provide good quality information. However, the current approach is disparate and localised. There is a need to encourage/define more formal network level surveys. To encourage this NRAs need better understanding of the latest devices, including lane width systems
There is a need to better understand how “non-standard” methods such as imaging systems and LiDAR fit in to the toolkit
Visibility Night-time visibility (Wet)
Not currently achievable: Measurement or prediction of the visibility in wet conditions. However, there are emerging systems
Better understanding of the performance (claims) of current systems could be achieved through practical trials.
Also, develop an approach to better understand/model the relationship between wet performance and other measurements, to assess the relative level of performance in wet conditions
Visibility Day-time Visibility
Standard measured (luminance) not currently achievable at network level.
Measurement of contrast could be achieved at network level.
Confirm that daytime visibility (via contrast) is an acceptable method to assess this characteristic. Then, test the claimed capability of traffic speed systems through practical trials and provide advice to NRAs on their application
Visibility Wear
Not currently achievable: Measurement of wear at network level
However, there
Develop a catalogue to assist/standardise manual assessment, with threshold values
Further development of algorithms for automatic analysis of images or LiDAR data. Thoroughly test and validate the algorithms using practical trials.

CEDR Call 2014: Asset Management and Maintenance
Page 33 of 115
Property Characteristics
Recommended method to achieve network level requirement
PREMIUM recommendations for work required to achieve recommended method
are emerging systems
Durability Skid Resistance
Not currently achievable: Measurement of skid resistance at network level
However, there are emerging systems, and proposed proxy approaches
Test the potential and accuracy of emerging dynamic devices through practical trials.
Investigate whether a prediction model exists and, if not, develop one. Then assess its performance through trials.
Investigate whether proxy methods really could work hence removing the need for direct assessment.

CEDR Call 2014: Asset Management and Maintenance
Page 34 of 115
4 Technical Background – Standards and Approach for Understanding Marking and Stud Condition
4.1 Information sources
As highlighted in Section 2, a knowledge gathering and stakeholder engagement exercise was undertaken to understand current industry practice and to explore authorities opinions’ on the most important characteristics for determining the condition of the asset and its current level of performance.
This commenced with a review of current standards and guidance documents to identify the characteristics of road markings or studs for which measurements are currently required. To support the review, additional information was also sourced from the HeRoad report into equipment condition assessment (Casse & Van Geem, 2012).
Table 19 and Table 20 identify the different property groups, and their characteristics, for road markings and studs respectively. Project consortium members were also asked to review their national standards and guidance documents to see which characteristics were referenced, highlighting commonalities in the requirement of certain forms of data. The characteristics listed in Table 19 (road markings) and Table 20 (road studs), were the findings from the standards review.

CEDR Call 2014: Asset Management and Maintenance
Page 35 of 115
Table 19: Property groups and their characteristics for road markings
Road Marking Characteristics UK Ireland Germany France Austria Bulgaria Belgium Australia
Night-Time Visibility - Coefficient of Retroreflection ✓ ✓ ✓ ✓ ✓ ✓ ✓ ✓
Day-Time Visibility -Luminance Coefficient ✓ ✓ ✓ ✓ ✓ ✓ ✓ ✓
Day-Time Visibility -Luminance Factor ✓ ✓ X ✓ ✓ ✓ X ✓
Colour ✓ ✓ ✓ ✓ ✓ ✓ ✓ X
Wear Index/Resistance to Wear ✓ ✓ ✓ ✓ ✓ ✓ X X
Skid Resistance (SRT Value) ✓ ✓ ✓ ✓ ✓ ✓ ✓ ✓
Removability ✓ ✓ X X X X X X
Resistance to UV Exposure ✓ ✓ X X X X ✓ X
Hiding Power of the Paint ✓ ✓ X X X X X X
UV Ageing of Paint ✓ ✓ X X X X X X
Inventory: Location (start/end chainage, section reference, GPS, length, direction etc.)
✓ ✓ ✓ ✓ ✓ N/A ✓ ✓
Inventory: Area Location Description, Marking Specification, Date of Construction/Last Inspection
✓ ✓ ✓ ✓ ✓ N/A ✓ ✓

CEDR Call 2014: Asset Management and Maintenance
Page 36 of 115
Table 20: Property groups and their characteristics for road studs
Reflective Road Stud Characteristic UK Ireland Germany France Austria Bulgaria Belgium Australia
Night-Time Visibility - Coefficient of Retroreflection ✓ ✓ N/A N/A N/A N/A X ✓
Day-Time Visibility - Luminance Factor ✓ ✓ N/A N/A ✓ N/A ✓ ✓
Day-Time Visibility - Degradation ✓ ✓ N/A N/A ✓ N/A X ✓
Colour ✓ ✓ N/A N/A ✓ N/A ✓ N/A
Sinkage & Settlement ✓ ✓ N/A N/A N/A N/A N/A X
Height above Road Surface X X N/A N/A N/A N/A N/A ✓
Wear/Corrosion ✓ ✓ N/A N/A N/A N/A ✓ ✓
Damage/Loss ✓ ✓ N/A N/A N/A N/A ✓ ✓
Detritus on Lenses ✓ ✓ N/A N/A N/A N/A X X
Integrity of Casing ✓ ✓ N/A N/A N/A N/A X X
Depressible Resilience ✓ ✓ N/A N/A N/A N/A ✓ X

CEDR Call 2014: Asset Management and Maintenance
Page 37 of 115
EN 1436
Road Marking Material:
Road Marking Performance for Road
Users
prEN 12802
Laboratory Methods for Identification
ISO 787: General Methods of Test for Pigments and Extenders
ISO 1514: Paints and Varnishes - Standard Panels for Testing
ISO 2814: Paints and Varnishes - Comparison Contrast Ratio of Paints of the same Type and Colour
ISO 4892: Plastics - Methods of Exposure to Laboratory Light Sources
ISO 7742: Paints and Varnishes - Colorimetry
ISO 11664 -2: ColorimetryCIE Standard Illuminants
EN 13197: Wear Simulator Turntable
EN 1423
Drop on Materials - Glass Beads, Antiskid
Aggregates and Mixtures of the Two
EN 1424
Premix Glass Beads
EN 1463-1: Retroreflecting Road Studs - Initial Performance Requirements
EN 1463-2: Retroreflecting Road Studs - Road Test performance Specifications
EN 1790
Preformed Road markings
EN 1824
Road Trials
EN 1871
Physical Properties
4.2 Review of Standards defining the performance of road markings and road studs
Figure 4 lists the current international standards related to the performance of road markings and reflective studs. Since many of these standards refer to several of the characteristics of road marking and stud condition, rather than discussing individual standards, in the following sections the results of the review have been split by road marking/stud characteristic, to avoid repetition.
Figure 4: International standards related to road markings and reflective studs
Night-time Visibility: Coefficient of Retroreflection 4.2.1
For markings and studs night-time visibility is a measure of the ability of the marking or stud to reflect light projected onto it from the headlamp. The Retroreflectivity quantifies the proportion of the light that is reflected directly back to the original source. The phenomena of retroreflection allows for markings and studs to be adequately visible to the road user during the night-time.

CEDR Call 2014: Asset Management and Maintenance
Page 38 of 115
EN 1436 “Road Marking Performance for Road Users” provides a description of the test methods and acceptance criteria for road markings. With the exception of independent national standards, this was the most commonly adopted standard for investigating the performance of yellow and white road markings. The Retroreflectivity, RL, can be measured for a number of different surface materials (asphalt/concrete) and environmental conditions, such as weather conditions (dry, wet, and raining), diffuse illumination (day-time visibility) and illumination under headlamp (night-time visibility). All prescribed methods employ a retroreflectometer (integrated photometer & illumination system) – these can either be hand-held (low-speed) or vehicle mounted systems (traffic speed). Stakeholders reported to use a mixture of both systems periodically to gather data, supplemented by video survey.
Table 21 shows the minimum performance levels for each class for road markings as defined in EN1436. Permitted classes for white road markings in the UK range from R2 to R5, whilst those for wet markings range from RW1 to RW5 – see Table 23.
The night-time visibility inspection reports should include the following information, as highlighted in TD 26/07: Operators Name; Equipment Type & Geometry; Test Procedure; General Location; Length of Site; Location of Measurement Points; Date and Time of Test; Temperature & Weather; Type/Dimensions; Condition of Marking; Pre-Treatment (washed/brushed); Road Surface Type; Measurement Results.
Table 21: Road Marking Night-Time Visibility Minimum Performance Values (EN 1436, Tables 3 to 5)
RL, Dry RL, Wet RL, Raining
Class Minimum RL Value (mcd.m
-2.lx
-1)
Class Minimum RL Value (mcd.m
-2.lx
-1)
Class Minimum RL Value (mcd.m
-2.lx
-1)
R0 No Performance Determined
RW0 No Performance Determined
RR0 No Performance Determined
R1 RL≥ 80 RW1 RL≥ 25 RR1 RL≥ 25
R2 RL≥ 100 RW2 RL≥ 35 RR2 RL≥ 35
R3 RL≥ 150 RW3 RL≥ 50 RR3 RL≥ 50
R4 RL≥ 200 RW4 RL≥ 75 RR4 RL≥ 75
R5 RL≥ 300 RW5 RL≥100 RR5 RL≥ 100
RW6 RL≥150 RR6 RL≥ 150

CEDR Call 2014: Asset Management and Maintenance
Page 39 of 115
Table 22: Recommended minimum classes for night-time visibility considered most suitable for permanent road marking in the UK (BS EN 1436, Table NA.1)
Road type Enhanced performance required Street lighting status
Recommended minimum performance class(es) from BS EN 1436
5
RL 7 RW
7
Any
None
Unlit/partially lit/dimmed
4
R3 See
Note 1
Lit R2
Higher performing markings may be required to maintain safety. For the three situations listed the following classes should be specified in place of any recommended above
Wet Night Visibility Any R3 RW3
Skid resistance Any
Enhanced Forward Visibility/Safety Critical Sites 2
(machine applied)
Unlit/partially
lit/dimmed 4
R4
Lit R3
Enhanced Forward Visibility/Safety Critical Sites 2
(hand applied) Any R3
4 Lane & wider carriageways including Smart, Managed or Controlled Motorways
6
Any R3 3 RW3
Notes
1 It is recommended that from 2018 a requirement of class RW1 is included in contracts and from 2020
class RW2. Higher performing products are currently available but are more suited for use where all round higher performance is required. This recommendation may be subject to amendment depending on the development of road marking products between the publication of this National annex and the dates mentioned above. 2 These terms encompass lining such as markings at junctions.
3 Class R4 recommended for unlit/partially lit/dimmed motorways of 4 lanes or wider.
4 For the purpose of this National annex street lighting shall be defined as follows:
Lit – Permanently lit during the hours of darkness
Partially lit – When lighting is switched off for set periods during the hours of darkness
Dimmed – When the light level is reduced for a period(s) during the hours of darkness roads where there are a number of changes between lit and unlit (or partially lit or dimmed) conditions in a single section a single specification for the road markings should be used; normally this would be based on the highest recommended class. 5 Designers and procurers need to be aware that it may not be possible to achieve simultaneously the
enhanced levels of performance for all characteristics. Consequently, enhanced performance requirements may need to be prioritised. 6 For the types of road identified herein these are the recommended minimum performance classes. The
nature of these roads may require a higher performance(s) on a scheme or contract specific basis. 7 Recommended values based on lane and marking widths specified in Traffic Signs Manual Chapter 5.
Narrower lanes or narrower markings would normally require enhanced forward visibility.

CEDR Call 2014: Asset Management and Maintenance
Page 40 of 115
EN 1463-1 “Retroreflecting Road Studs” details the initial performance requirements of road studs. The standard provides a method (for both laboratory and in-situ testing) for assessing performance against a range of minimum R values. This involves the application of a retroreflectometer with respect to a number of conditions. Similarly EN1463-2 provides the road test performance specifications for studs within the scope of road trials. It sets out the procedures for a two stage assessment. The first being a visual assessment, judging conformity, using a vehicle’s dipped headlights. The second stage of the assessment is the measurement of R set out in EN1463-1, discussed above. Table 23 provides the minimum performance levels for studs according to EN1463.
Table 23: Road Studs Night-Time Visibility Minimum Performance Values (EN 1463, Table 4)
Entrance Angle
(β)
Observation angle
(α)
Minimum R Value (mcd · lx-1
)
Type of Stud
1
(Glass)
2
(Plastic)
3
(Plastic*)
± 15° 2.0° 2 2.5 1.5
± 10° 1.0° 10 25 10
± 5° 0.3° 20 220 150
*Plastic stud with abrasion resistant layer
The UK’s Design Manual for Roads and Bridges (DMRB) (Volume 2 TD 26/07) provides guidance for the inspection and maintenance for both markings and studs in the UK. Similarly to the European standard, UK road markings require a retroreflectivity survey to assess their basic level of performance. However, differing from the European standard, the DMRB provides a more detailed method for a visual assessment, by means of photographic examples and a corresponding scoring system. A retroreflectivity survey, undertaken by high speed monitor, is required on an annual basis, with the exception of newly laid markings which do not require inspection for their first year in service. Those that cannot be surveyed using a high speed monitor must be inspected based on the photographic reference method.
As stated in the DMRB, in the UK studs do not require a retroreflectivity survey to be undertaken, but a visual inspection instead. This is similar to the one stated in EN 1463, based on the conformity of the studs, relative to their general reflective properties. This allows failure categorisation from which maintenance priorities can be set, or in cases where requirements are satisfied no action will be required. Routine visual inspections should be carried out at 6 month intervals.
Day-Time Visibility: Coefficient of Luminance & Luminance Factor 4.2.2
Daytime visibility is a measure of the road markings’ and studs’ conspicuity under daylight and road lighting conditions. For road markings there two performance measures that are covered by standards:
The Coefficient of Luminance, Qd (mcd.m-2.lx-1), measured under diffuse illumination (daylight) is defined as the “quotient of the luminance of the field of the road marking in the given direction by the illuminance on the field” (EN 1436).
The Luminance Factor (β) is defined as the “ratio of the luminance of the field of the road marking in the given direction to that of a perfect reflecting diffuser identically illuminated” (EN 1436).

CEDR Call 2014: Asset Management and Maintenance
Page 41 of 115
EN 1436 describes the methods for both of these measures. The method for assessing Qd requires the use of a photometer, a photometric sphere and a light source. Hand-held systems and traffic speed systems are available. Alternatively Day-time visibility can be measured using the Luminance factor method. The prescribed method employs a photometer; a number of commercially available systems are available. However the standard also notes that for some types of road markings the luminance factor is not a reliable measure. The standard does not provide a time frame for these assessments.
The thresholds used to determine the classes for the luminance coefficient and factor are given in Table 24, whilst the classes specified for the UK are given in Table 25.
The assessment of the day-time visibility of road markings can also be achieved through a parameter defined as the day-time contrast of the marking. Day-time contrast is much more significant for the overall visibility than the luminance (or luminance factor) itself, because it expresses how clearly a line stands out from the surrounding road surface: Even a very bright white line will be hard to see if placed on a very pale pavement surface. No standards describing this characteristic were identified.
Table 24: Marking Luminance Coefficient Class and Luminance Factor Class (EN 1436, Table 2)
Road Surface Type
Class Minimum luminance coefficient under diffuse illumination Qd (mcd.m
-2.lx
-1)
Class Minimum Luminance Factor (β)
Asphaltic Q0
Q2
Q3
Q4
No Performance Determined
Qd ≥ 100
Qd ≥ 130
Qd ≥ 160
B0
B2
B3
B4
B5
No Performance Determined
β ≥ 0.30
β ≥ 0.40
β ≥ 0.50
β ≥ 0.60
Cement Concrete
Q0
Q3
Q4
Q5
No Performance Determined
Qd ≥ 130
Qd ≥ 160
Qd ≥ 200
B0
B3
B4
B5
No Performance Determined
β ≥ 0.40
β ≥ 0.50
β ≥ 0.60

CEDR Call 2014: Asset Management and Maintenance
Page 42 of 115
Table 25: Recommended minimum classes for day-time visibility considered most suitable for permanent road marking in the UK (BS EN 1436, Table NA.1)
Road type
Enhanced performance required Street lighting status
Recommended minimum performance class(es) from BS EN 1436
3
Qd or ß 5
Any
None Unlit/partially lit/dimmed
2 Q3 or B2
Lit Q3 or B2
Higher performing markings may be required to maintain safety. For the two situations listed the following classes should be specified in place of any recommended above
Enhanced Forward Visibility/Safety Critical Sites
1 (machine applied)
Unlit/partially
lit/dimmed 2
Q4 or B3
Lit Q4 or B3
Enhanced Forward Visibility/Safety Critical Sites
1 (hand applied)
Any Q4 or B3
4 Lane & wider carriageways including Smart, Managed or Controlled Motorways
4
Any Q4 or B3
Notes
1 These terms encompass lining such as markings at junctions.
2 For the purpose of this National annex street lighting shall be defined as follows:
Lit – Permanently lit during the hours of darkness
Partially lit – When lighting is switched off for set periods during the hours of darkness
Dimmed – When the light level is reduced for a period(s) during the hours of darkness
On roads where there are a number of changes between lit and unlit (or partially lit or dimmed) conditions in a single section a single specification for the road markings should be used; normally this would be based on the highest recommended class.
3 Designers and procurers need to be aware that it may not be possible to achieve simultaneously the enhanced levels of performance for all characteristics. Consequently, enhanced performance requirements may need to be prioritised.
4 For the types of road identified herein these are the recommended minimum performance classes. The nature of these roads may require a higher performance(s) on a scheme or contract specific basis.
5 For concrete and light asphalt surfaces see section NA.3.
For reflective studs EN 1463 (both parts 1 & 2) describes the day-time visibility performance levels of the luminance factor. This test can be performed on in-service studs using an illuminance meter. These results are relative to those from the colour assessment described below. Similarly to road markings no time frame for assessments is stated.
In the UK the DMRB does not provide guidance or requirements for daytime visibility assessments of road markings. Instead a photographic reference based visual assessment is undertaken. Although this is related to the visibility characteristics of the marking it is done so in terms of the amount of wear in terms of durability. This is discussed further in section

CEDR Call 2014: Asset Management and Maintenance
Page 43 of 115
4.2.4. For studs, the DMRB provides a flow chart for categorising failure levels. This is a broad assessment based on a number of visibility factors (loss/damage of retroreflective element, detritus on lenses, sinkage/settlement etc.). Daytime visual assessments should be conducted at 6 month intervals.
Visibility: Colour 4.2.3
The colour of the road marking and reflective stud is defined by their chromaticity co-ordinates (x,y) and is measured using standard illuminant D65 (as defined in ISO 10526). D65 corresponds roughly to the average midday light in Western and Northern Europe (comprising both direct sunlight and the light diffused by a clear sky). The chromaticity co-ordinates can be measured in a laboratory or in-situ using portable equipment. EN 1436, which was the most commonly employed standard, sets out the methodology for these measurements. Generally a portable spectrophotometer is the favoured instrument, however German standard ZTV M13 (section 4.3) provides a method for visual inspection by means of comparison to a standard colour pattern chart.
EN 1463 sets out two methods for calculating the chromaticity coordinates; either the spectral or tristimulus method. The spectral technique (using a Spectroradiometer) is generally preferred over the tristimulus method (using a colorimeter in combination with a photoelectric receptor). During an inspection, enough readings need to be taken, and averaged to obtain a representative measurement of the sample. Surfaces with relatively uniform textures require a minimum of three measurements. Rougher surfaces, with greater texture variations, will require more measurements. Table 26 provides the minimum performance thresholds for markings.
Table 26: Marking Chromaticity Co-ordinates (EN 1436, Table 6)
Corner point no. 1 2 3 4
White road markings x
y
0.355
0.355
0.305
0.305
0.285
0.325
0.335
0.375
Yellow road markings (permanent)
x
y
0.443
0.399
0.545
0.455
0.465
0.535
0.389
0.431
Yellow road markings (temporary)
x
y
0.494
0.427
0.545
0.455
0.465
0.535
0.427
0.483
For road studs, EN 1463 does not recommend a minimum number of measurements that must be taken during the inspection. However three readings per stud should be taken, for a sample of studs across the site, in order to obtain representative average measurements of the site as a whole. While TD 26/07 does not require colorimetric inspections for in-service markings and stud, surveys could be undertaken during the recommended routine 6 month inspection. The threshold performance values for the chromaticity coordinates are highlighted in Table 27. Note: these are for when the stud is installed but are not used during the lifetime of the stud.

CEDR Call 2014: Asset Management and Maintenance
Page 44 of 115
Table 27: Stud Chromaticity Co-ordinates (EN 1463, Table 9)
Colour Point x Y Colour Point X y
White
1
2
3
4
5
0.390
0.440
0.500
0.500
0.420
0.410
0.440
0.440
0.390
0.370
Amber
1
2
3
4
0.549
0.543
0.590
0.605
0.450
0.450
0.395
0.395
Yellow
1
2
3
4
0.539
0.530
0.580
0.589
0.460
0.460
0.410
0.410
Red
1
2
3
4
0.665
0.645
0.721
0.735
0.335
0.335
0.259
0.265
Green
1
2
3
4
0.030
0.228
0.321
0.302
0.385
0.351
0.493
0.692
Durability: Wear Index/Resistance to Wear 4.2.4
Wear is a measure of the degree of deterioration a marking or stud has experienced. For markings EN1436 does not provide a methodology. Instead the method for assessing wear is covered by BS EN 1790 and EN 13197. The device used to assess wear, or to achieve a certain level of wear for other tests (e.g. retroreflectivity) is by means of a wear simulator turntable which is a laboratory measurement. For studs no direct method is given.
In Germany the standard Technical Terms of Delivery for marking Materials (TLM) and Technical Terms of Contract and Guidelines for Road Markings (ZTV M 13 section 5.2) provides a similar definition for the assessment of wear. In the UK the DMRB provides an in-situ method to assess the current level of wear on an annual basis. This method involves the use of photographic examples with a corresponding scoring chart, alongside brief descriptions of each level of condition. Reflective markings contain a number of layered glass beads, so wear cycles occur, i.e. once the top layer of glass beads has been worn away, a second layer of beads is exposed and so on until the bond between the thermoplastic and road surface has completely deteriorated. These measurements are only required to be undertaken on 50% of the road markings for each area. The requirement for wear in TD26/07 is that if <70% of the marking is remaining, replacement must be scheduled and this should be immediate if the marking is in a critical safety location.
Similarly to EN 1463, stud wear does not warrant specific measurement in the DMRB. Instead it is one of many general considerations incorporated into the daytime visual assessment.
Safety: Skid Resistance 4.2.5
EN 1790 describes skid resistance as the “energy loss caused by the friction of a rubber slider over a specified length of a road marking surface in wet conditions”. EN 1436 describes the test procedure, commonly referred to as the swinging pendulum test. This instrument is for static measurements and can be employed in-situ. The DMRB’s TD 26/07

CEDR Call 2014: Asset Management and Maintenance
Page 45 of 115
calls for annual assessments on 25% of the critical areas of the network (give way lines, stop lines & large areas of road markings), and shares the same acceptance criteria as EN 1436. Table 28 provides the minimum SRT values for each class of road marking (as defined in EN 1436) and the threshold levels (as defined in TD 26/07).
Table 28: Minimum and Threshold Skid Resistance Values (SRT) (EN 1436, Table 7 & TD/07 Annex A)
Class Minimum SRT Value Threshold Level
S0
S1
S2
S3
S4
S5
No Performance Determined
SRT ≥ 45
SRT ≥ 50
SRT ≥ 55
SRT ≥ 60
SRT ≥ 65
SRT <45 for Normal Markings
SRT <55 for Large Surface Areas
SRT <55 for Transverse Yellow Bars
Durability: General 4.2.6
Removability
The removability test evaluates the capability of the road marking to be removed, intact, without leaving lasting coloured marks that could potentially confuse the road user. Reference to this test is referenced in EN 1436 with the main procedure set out in EN 1824. The test can only be performed in-situ and its units are simply “Yes” and “No”.
Resistance to UV Exposure
This is the ability of the marking material to withstand ultraviolet light (sunlight). Prolonged exposure to UV radiation can result in markings fading and discolouring. Reference is made to resistance to UV exposure in EN 1790 with the actual test methodology contained within EN ISO 4892-3 (ISO, 2013). Tests can only be carried out in the laboratory and make reference to the before and after chromaticity co-ordinates discussed above.
Hiding Power of the Paint
The hiding power of the paint is simply the contrast ratio between the marking material and a standard background card. EN ISO 2814 sets out the laboratory procedure for this test (ISO, 2006).
UV Ageing of the Paint
Assessing the material ageing affects caused by UV (A and B) exposure is a laboratory based test which requires the use of a Xenon Arc lamp for 480 hours. The test procedure and acceptance criterion is highlighted in EN 1871 with the full procedure set out in EN ISO 4892-3.
Stud Depressible Resilience
The depressible resilience of reflective studs is described in EN 1463 as the long-term ability of the stud to withstand loading insofar as the retroreflective element is not permanently obscured. The method for testing employs the use of a depression testing machine, a laboratory method only. There is no direct reference of depressible resilience in the DMRB; instead it is described in terms of sinkage, settlement, damage/loss of reflective elements and lens cleanliness.

CEDR Call 2014: Asset Management and Maintenance
Page 46 of 115
Other National Standards 4.2.7
We have noted above some local standards used in the UK and Germany, and how these relate to the EN standards. The standards review of NRAs found that the majority of the NRAs have some form of national specification documents and/or guidance document relating to road markings. For example; RVS 05.03.11 (Road Markings: Design and Application), RVS 05.03.12 (Road Markings: Selection of Road Markings) & RVS 08.23.11 (Technical Contract Conditions: Road Marking Works) in Austria; ZTV M13 (Technical Specifications and Guidelines for Road Markings) in Germany; and Standaardbestek 250 (Standard Specifications) in Belgium.
4.3 Review of practice in the assessment of the performance of road markings and road studs
A stakeholder engagement exercise was carried out to investigate current industry practice in evaluating the performance and condition of road markings and reflective studs Two questionnaires, one for NRAs and one for survey/equipment providers, were developed on the basis of the standards review findings and consultations with the consortium partners (these questionnaires can be found in Appendices A and B). This section will discuss the results from the NRA questionnaire, whilst those for the survey provider questionnaire are discussed in section 5.
The questionnaire developed for NRAs comprised of two sections. The first section contained 11 questions regarding the NRAs current level of understanding of the asset, and their current approach to managing them. The second section contained a list of the characteristics, identified from the standards review. For each characteristic stakeholder were asked:
“If that characteristic was measured or recorded? (yes/no)” “How is the characteristic measured? (method and/or instrument used)” “What level of importance would you assign to this characteristic for the assessment
of its condition? (high, medium, low, neither)”
This allowed us to determine what NRAs themselves consider to be the most and least important characteristics, which they use to effectively manage the asset. Across the consortium, 88 National Road Authorities (NRAs) (including regional authorities) were identified and approached. An information pack and the questionnaire were distributed to all 88 potential stakeholders.
Summary of NRA Questionnaire responses to section 1 4.3.1(understanding the asset)
Q1. What is the approximate length of your road network?
Q2. What is the approximate length of your network for which road markings are present?
Q3. What is the approximate length of your network for which retroreflective studs are present?
Of the 88 stakeholders who received the questionnaire & information pack, timely responses were received from 13 NRAs. These include responses from Belgium, Ireland, Germany, UK, Sweden, Austria, Norway and the Netherlands. The 13 authorities manage a total of over 225,000km of motorways, dual and single carriage ways. Over 160,000km of linear road markings are present on these roads, with nearly 609,000m2 of area markings. Three of the thirteen NRAs (those located in Belgium & Germany), stated that they did not keep

CEDR Call 2014: Asset Management and Maintenance
Page 47 of 115
inventories (this represents 85,554km of road). With regards to reflective studs, a total of 70,379km had reflective studs present. Of the twelve, five authorities stated that they had no studs present on the roads they manage and three stated they did not keep an inventory of studs.
Q4. What is your general approach to managing and understanding the condition of road markings (lane separating lines) and studs?
a. Do you have a clear view of the status of all assets i.e. a regular monitoring regime?
b. Do you perform ad hoc repairs if something goes wrong (is there a reporting system - details?)?
c. Is the approach based on age of the asset?
Of the 13 NRAs, 10 said they had a clear view of the status of the asset. This was accomplished through an established monitoring regime – periodic surveying, typically on an annual basis. 10 of the 13 said they performed ad hoc repairs for a number of reasons (i.e. road user complaints, safety concerns, results from surveys, obvious damage etc.). Only 3 NRAs said their management approach was based on the age of the asset.
Q5. Where you have a monitoring regime, what does this measure and what methodology do you use? E.g.
a. Measurement of retroreflectivity using retroreflectometer (hand held or attached to a vehicle travelling at traffic speed)?
b. Measurement of wear or corrosion?
Of those that responded “Yes” to Q5a, 7 said they carried out traffic speed retroreflectometer surveys, with one respondent saying they also used hand held devices. A further 2 complemented their retroreflectivity surveys with visual condition surveys. 1 NRA commented they carried out only video surveys. Only 4 NRAs carried out measurements of wear. A small number also responded that they also made measurements of luminance, colour, and skid resistance.
Q6. Where you do not have a regime, do you feel there is a need for condition monitoring to map the state of these assets? If not, please tell us why not (e.g. the condition cannot be measured, regular replacement removes the need for monitoring).
1 NRA stated they did not carry out monitoring because they replace markings and studs based on the assets age, as such regular replacement removed the need for monitoring. Another NRA stated that while they thought it was important to map the condition of their assets it was not possible because of time, resource and budgetary constraints. 3 NRAs reported that although they have a monitoring regime in place they felt there was a need to improve their current regime.
Q7. Do you use an asset management system for managing road markings and studs (maintenance planning and forecasting budgets)?
50% of respondents said they used some form of asset management system (AMS). However in most cases they did not elaborate on what type of AMS they used. One respondent noted they used an in-house excel spreadsheet. Another NRA commented that data from the condition surveys populates year on year condition maps. Only 1 NRA confirmed they used a GIS system to keep an interactive inventory of their assets. One NRA said that they would be developing an AMS to use in the near future.
Q8. What methods of maintenance are applied to road markings and studs e.g. replacement, cleaning?

CEDR Call 2014: Asset Management and Maintenance
Page 48 of 115
12 of the 13 NRAs said that their maintenance practice was to simply replace the markings and studs. One of the 12 stated that while they predominantly replaced/renewed their markings and studs; cleaning of studs was also carried out.
Q9. How do you decide if a road marking or stud requires each type of maintenance method listed in Q8? I.e. on what criteria are maintenance / repair decisions made: Is the decision based on e.g. the asset’s age, its measured condition etc.? Please give details.
Two NRAs responded that the only criteria for maintenance were based on the asset age, whilst another uses age and wear. Five NRAs stated that the primary reason for carrying out maintenance was based on the asset not meeting the minimum retroreflectivity threshold. However for some of these there were also secondary considerations such as the age of the asset. Two stated that maintenance would take place depending on the outcome of their visual condition surveys. A further two NRAs responded that the decision to carry out maintenance was solely based on the professional judgement of either traffic officers or the design engineers. Unfortunately two NRAs did not provide clear responses to the question.
Q10. If the maintenance is based on measured condition, are thresholds applied to the measurements? If so are these thresholds defined in a standard or just within your organisation?
All Five NRAs who carried out retroreflectivity surveys said threshold values for maintenance interventions were based on those stated in the relevant standards. Three NRAs said they had no formal intervention levels, two of these commented that maintenance was based on budgetary constraints. Two stated that routine maintenance was based on contractual agreements and three NRAs said that maintenance was not based on measured condition.
Q11. Do you combine different types of measurements, to make a decision on maintenance e.g. combine measurements of marking retroreflectivity and wear?
Four NRAs said they combined wear and retroreflectivity surveys, eight said they did not combine surveys, with some commenting that they would like to combine surveys in the future.
Summary of NRA responses to section 2 (monitoring road 4.3.2markings and studs at the network level)
The second part of the questionnaire considered each condition property identified in the standards review and asked stakeholders if these characteristics were currently monitored, and how. Finally stakeholders they were asked to assign an importance rating to each characteristic, allowing the determination of which characteristics were most important relative to their condition. Low importance levels indicated that information on the characteristic in question would be good to have but was not essential. Medium importance indicated that this information on this characteristic could be quite useful. Assigning a high importance rating meant that this information was essential. Table 29 summarises the overall importance ranking of each characteristic according the NRA stakeholders. In addition to the characteristics listed in Table 29, the NRAs felt that asset inventory was also very important. Asset inventory and the key characteristics of condition are discussed in more detail in the following sections.

CEDR Call 2014: Asset Management and Maintenance
Page 49 of 115
Table 29: Characteristic importance ranking, according to the stakeholder review
Rank Property Characteristics
1st Inventory
2nd Visibility Night-time visibility
3rd Visibility Colour
4th Visibility Day-time Visibility
5th Visibility/ Durability
Wear
6th Safety Skid Resistance
4.3.2.1 Property: Inventory
Figure 5 illustrates the results of whether or not each characteristic, within the Inventory property, was measured or recorded. The first characteristic was Location. This refers to the data each NRA keeps regarding the actual location of their marking and reflective stud assets. Specifically it asks if some form of geographical and/or network referencing system is in place, such as: section ID & road name, geographic co-ordinates, chainage, and marker posts. It can be seen that 7 NRAs kept network level records on this data, and 3 NRAs stated that they did not keep inventory records for markings and studs. Despite this, eight NRAs said that this information was of the highest importance for effectively managing the assets performance. Overall no other characteristic, across all property types, received an importance score as high as Location.
Figure 5: Measured inventory characteristics

CEDR Call 2014: Asset Management and Maintenance
Page 50 of 115
Inventory records were built from a combination of data from: video/visual assessments; odometer measurements; mobile mapping; and construction records/drawings.
Six NRAs stated that they held records or actively measured the type of markings and studs on a network level. Four replied that they did not hold or measure this information at the network level. This characteristic however, received the second highest importance rating overall; scoring only two points lower than Location. Similarly the methods used to measure this characteristic were those used for Location; employing visual/video surveys and/or reference to construction records/drawings.
Eight NRAs responded that they recorded Road Marking/Stud Details (such as class, dimensions, colour and material). Only five NRAs said they held historical accounts of the construction dates of markings and studs.
Only three NRAs said they held records from previous inspections. Seven NRAs specified that they not keep details, such as the date, from previous asset inspections, which brings into question how future inspections strategies might be programmed efficiently. However, four NRAs did confirm that they kept detailed records, including dates, of past maintenance interventions.
The above results indicate that many NRAs currently hold incomplete inventories of the markings and reflective studs on their networks. From Table 3, it can be seen that of the twelve most highly ranked characteristics (across all property groups), those associated with Inventory accounted for half of these, and these were in the top half of the twelve characteristics. These results highlight that while NRAs may not maintain complete inventories of their assets, basic inventory information is regarded as vital for aiding the NRAs understanding of their assets performance level.
4.3.2.2 Property: Visibility
Figure 6 breaks down the stakeholder responses for whether or not the identified characteristics within the Visibility property group were measured. When stakeholders were asked if night-time visibility (retroreflection) was a characteristic that was currently measured on their networks seven NRAs said that this was indeed the case.
Figure 6: Measured visibility characteristics

CEDR Call 2014: Asset Management and Maintenance
Page 51 of 115
From Table 3, night time visibility was regarded as the most important condition characteristic for understanding the asset performance. When asked to comment on how this characteristic was measured the most common response was by means of traffic speed retroreflectometer and hand held retroreflectometer. The day-time visibility (i.e. luminance coefficient and luminous intensity) of markings and studs was confirmed to be measured by six of NRAs, measured statically using hand-held instruments. Despite this, it received a relatively low importance rating, ranked third overall.
The colour characteristic of markings and studs was currently only measured by five NRAs. All five said they made static measurements using hand-held instruments, shortly after asset installation. This characteristic is measured more than other characteristics and this is reflected in the rank given to its level of importance - second overall. The importance given to this characteristic is due to the need to confirm that the assets are the correct colour for the road environment
The last characteristic in the visibility property group was wear. This can also be considered to be a durability property. Only four of the twelve NRAs currently measure the amount of wear their asset’s experience. The low uptake of wear measurements is reflected in its importance rating, ranked joint fourth alongside skid resistance. NRAs commented that wear was estimated by conducting visual inspections and was seen to be important but difficult to obtain an objective measure for.
4.3.2.3 Property: Safety and Durability
The final property groups stakeholders were asked to comment on were Safety and Durability. The only characteristic within the Safety group was skid resistance. As illustrated by Figure 7, skid resistance was a much more measured characteristic than any in the Durability group, with half of respondents stating that it was currently measured. Skid resistance was measured using low-speed static instrumentation. As previously mentioned when ranked on importance, skid resistance was one of the lowest scoring characteristics, ranked joint ninth. The remaining characteristics in this property group were by and large left unmeasured by NRAs and received the lowest overall importance ratings for understanding the asset’s performance.
Figure 7: Measured safety and durability characteristics

CEDR Call 2014: Asset Management and Maintenance
Page 52 of 115
4.4 Summary and Recommendations
The results from the NRA questionnaire suggested that NRAs felt that Inventory was the most important information to collect for road markings and studs - without this, collecting condition data is redundant. The inventory should contain information such as location, marking/stud type, colour, and dates of installation, maintenance, inspection etc.
Retro-reflectivity, a measure of night-time visibility, was the condition characteristic considered to be most important by the NRAs and was the most measured condition characteristic. Thus this was considered to be the first and most important key characteristic for both markings and studs.
The second most important characteristic identified by the NRAs was the colour of the markings and studs - knowledge of the colour of road markings is needed to determine appropriate thresholds (section 2.10). Less than half of the NRAs stated that they measured colour but on further enquiry, it was determined that the measurement only occurred once during the marking or stud’s lifetime. Thus it appears that, whilst this is an important characteristic to the road owners, the lack of in-service monitoring would suggest that it is not used as an indication of condition, merely a check to ensure conformity to the standards. Thus it is felt that colour should not be considered a key characteristic but an inventory characteristic.
The characteristic, ranked third in importance by the NRAs, is day-time visibility, which is measured both in terms of the Coefficient of Luminance, Qd and Luminance Factor (β) and also contrast with the surrounding pavement (for markings). This characteristic is measured by quite a few NRAs as well and thus it has been proposed as the second key condition characteristic for both markings and studs.
The fourth most important characteristic identified by the NRAs was the wear of road markings, which affects their visibility and is also a measure of their durability. This characteristic was measured by only four of the respondents, a lower rate than both day-time visibility and skid resistance. However, since it has such an influence on both night-time and day-time visibility, it was felt appropriate to assign it a higher rating than skid resistance (in line with the views of the road owners). Thus wear is proposed as the third key condition characteristic but relates only to road markings.
The fifth most important characteristic identified by the NRAs was the skid resistance of markings and was measured by 7 of them. This has been considered to be the fourth key characteristic describing the condition of road markings.
All other characteristics received a low importance rating and were not often measured. Thus these have not been considered to be key condition characteristics.
In summary, the key characteristics of road markings and studs that indicate their condition and are considered important by road owners are therefore:
Visibility - Night-time visibility
Visibility - Day-time Visibility
Visibility/Durability - Wear (road markings only)
Safety - Skid Resistance (road markings only).

CEDR Call 2014: Asset Management and Maintenance
Page 53 of 115
5 Technical Background – Measuring the Condition of Road Markings
5.1 Information gathering - Survey Provider Questionnaire
As highlighted in Section 3, a knowledge gathering and stakeholder engagement exercise was undertaken to understand current industry practice and the views of stakeholders on the methods available for determining the condition of road marking and road studs.
A questionnaire, consisting of 9 questions relating to road markings and studs (Appendix B) aimed to understand the current inspection techniques used by survey providers; i.e. what equipment is used for monitoring, what characteristics they measure, what data is delivered, and how this data is then used to assess the asset's condition. In total 42 survey/equipment providers were identified and contacted. Despite repeated efforts to engage with this stakeholder group, only eight survey providers submitted completed questionnaires in the allocated time frame. The following summarises the responses received for current surveys.
Q1. For which road network(s) have you had or do you have a contract to provide asset surveys for?
Seven of the eight survey providers stated that they undertook inspection on national motorways and highways, with one respondent also carrying out inspections on smaller local roads. One survey provider only undertook surveys for their own trial roads in their own laboratory.
Q2. What survey methods/techniques do you currently use to monitor the condition of road markings or studs? What measurements are recorded?
In total six different survey methodologies were identified between the eight stakeholders, with some providers using a range of techniques depending on the nature of the survey and demands of the client. These are:
Video Surveys: These surveys are conducted at traffic speed and take a number of different measurements, most of which relate to inventory. Such measurements include GPS/GNSS location, chainage, dimensions, class of marking/stud, defect screen shots, and visual condition. This was the most popular method for assessing markings and studs. The technique has the advantage of being conducted at traffic speed, but any analysis of condition is subjective, and the data has to be processed manually. This is both time consuming and prone to human error.
Hand-held Retroreflectometer Surveys: These surveys employ the use of a hand-held retroreflectometer to determine the night time visibility of the asset. Spot measurements are taken, aggregated then averaged. This is a slow-speed manual survey.
Traffic-Speed Retroreflectometer Survey: These surveys primarily record night-time visibility (i.e. retroreflectivity), and are typically coupled with GPS and video. Only one provider undertook this type of survey.
Visual Inspection: This is a low-speed, manual survey using a scoring system to assess the condition of the asset. Location data is also recorded.
LiDAR Survey: One provider stated that they undertake traffic-speed LiDAR (Light Detection and Ranging) surveys which they claim to yield reflectivity measurements.
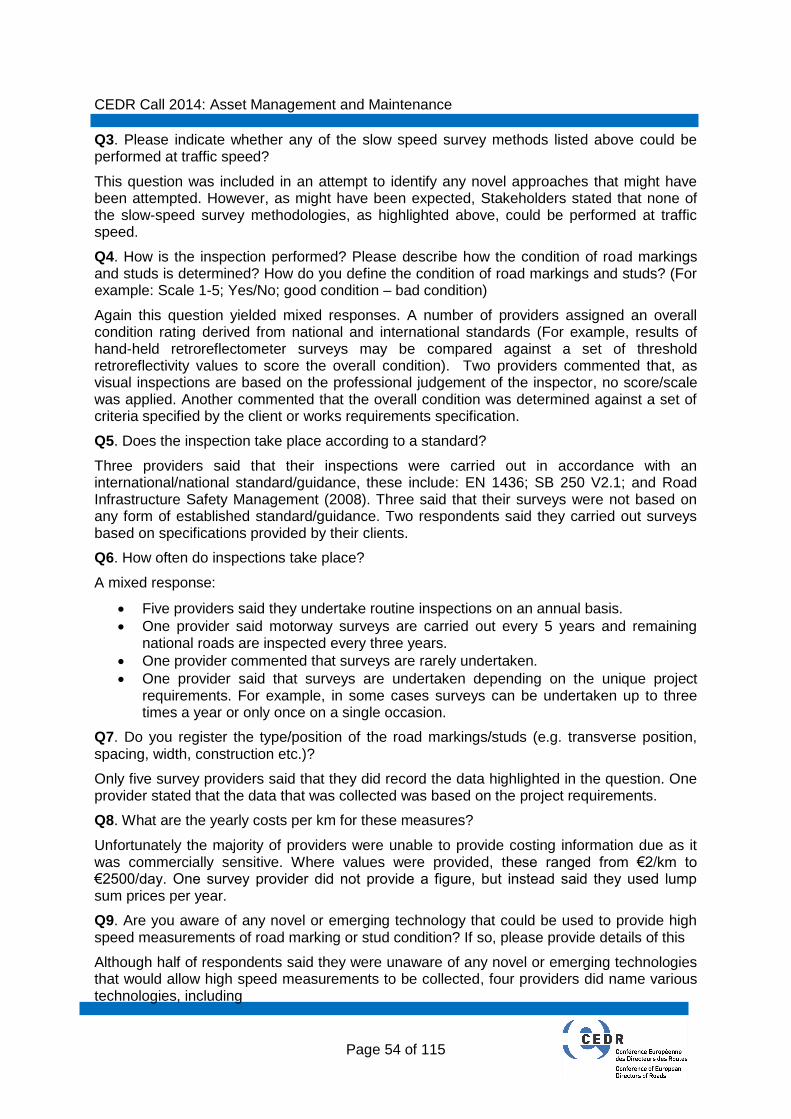
CEDR Call 2014: Asset Management and Maintenance
Page 54 of 115
Q3. Please indicate whether any of the slow speed survey methods listed above could be performed at traffic speed?
This question was included in an attempt to identify any novel approaches that might have been attempted. However, as might have been expected, Stakeholders stated that none of the slow-speed survey methodologies, as highlighted above, could be performed at traffic speed.
Q4. How is the inspection performed? Please describe how the condition of road markings and studs is determined? How do you define the condition of road markings and studs? (For example: Scale 1-5; Yes/No; good condition – bad condition)
Again this question yielded mixed responses. A number of providers assigned an overall condition rating derived from national and international standards (For example, results of hand-held retroreflectometer surveys may be compared against a set of threshold retroreflectivity values to score the overall condition). Two providers commented that, as visual inspections are based on the professional judgement of the inspector, no score/scale was applied. Another commented that the overall condition was determined against a set of criteria specified by the client or works requirements specification.
Q5. Does the inspection take place according to a standard?
Three providers said that their inspections were carried out in accordance with an international/national standard/guidance, these include: EN 1436; SB 250 V2.1; and Road Infrastructure Safety Management (2008). Three said that their surveys were not based on any form of established standard/guidance. Two respondents said they carried out surveys based on specifications provided by their clients.
Q6. How often do inspections take place?
A mixed response:
Five providers said they undertake routine inspections on an annual basis.
One provider said motorway surveys are carried out every 5 years and remaining national roads are inspected every three years.
One provider commented that surveys are rarely undertaken.
One provider said that surveys are undertaken depending on the unique project requirements. For example, in some cases surveys can be undertaken up to three times a year or only once on a single occasion.
Q7. Do you register the type/position of the road markings/studs (e.g. transverse position, spacing, width, construction etc.)?
Only five survey providers said that they did record the data highlighted in the question. One provider stated that the data that was collected was based on the project requirements.
Q8. What are the yearly costs per km for these measures?
Unfortunately the majority of providers were unable to provide costing information due as it was commercially sensitive. Where values were provided, these ranged from €2/km to €2500/day. One survey provider did not provide a figure, but instead said they used lump sum prices per year.
Q9. Are you aware of any novel or emerging technology that could be used to provide high speed measurements of road marking or stud condition? If so, please provide details of this
Although half of respondents said they were unaware of any novel or emerging technologies that would allow high speed measurements to be collected, four providers did name various technologies, including

CEDR Call 2014: Asset Management and Maintenance
Page 55 of 115
RetroTek and Ecodyn retroreflectometers
Driveby’s Mobile Mapping platform for image surveys.
A particular point of note is the comment of one provider, who was aware of emerging high speed technology but had a problem finding a balance between the measurement performance and the cost of the equipment; “systems are available which generate detailed reports on road marking qualities but deploying them still represents a significant cost”.
5.2 Information gathering – further consultation and review
In addition to the stakeholder (survey provider) questionnaire discussed above, a further knowledge gathering exercise was carried out to seek information on the methods available for the measurement of road markings and road studs. This built on the responses provided by the survey providers, combined with a review of available literature on equipment, to identify existing and emerging technologies. PREMIUM also identified previous research projects, including ASCAM and TRIMM, as information resources for different measurement techniques for monitoring of road markings and studs and comparative studies of reflectivity measurements. The literature review showed that several tests have reported measurement of road markings and stud characteristics at traffic speed. This was followed up with a number of consultations with different survey providers to obtain more details about particular mobile measurement technologies.
The results of the further information gathering are discussed in the following sections, in which we break down the technologies identified in terms of the key characteristics listed in Section 2:
Inventory
Visibility - Night-time
Visibility - Day-time
Visibility - Wear
Safety - Skid Resistance.
These measurement technologies are shown in Figure 8. The techniques include hand-held and mobile devices, image analysis, prediction parameters and novel systems.

CEDR Call 2014: Asset Management and Maintenance
Page 56 of 115
Figure 8: Measurement technologies for monitoring of road markings and studs
5.3 Key data - Measuring the inventory of road markings and studs
As noted in Sections 2 and 4, it has been generally recognised that information on the asset inventory is important for effective management of the road marking asset. The collection of inventory data forms the basis of road inventory management as it enables the road authority to understand the extent and value of the inventory stock present on their network and can be linked with ongoing condition monitoring. Ideally the inventory should be continuously updated.
As observed in the TRIMM project (Spielhofer, 2014) road authorities commonly record inventory using pen and paper and optionally a GPS transmitter. This requires that an inspector walks the network to record the location of assets. As a result TRIMM concluded that the approach to the collection of inventory data in some of the leading industrial countries of the European Union is resulting in limited knowledge about the type, location and condition of road inventory.
However, there are a number of new/emerging recording methods which can be used for inventory data collection:
Photogrammetric, one camera (2D location)
Photogrammetric, panorama (2D location, 360° view)
Photogrammetric, two cameras (stereovision, 3D location)
Photogrammetric, multiple cameras (3D location)
Laser scanning (LiDAR), static (3D Point cloud with intensity/colour information)
Laser scanning (LiDAR), moving (3D Point corridor point cloud with intensity/colour information).
Mo
nit
ori
ng
Ro
ad M
arki
ngs
an
d S
tud
s
Inventory Location, Type,
Details
Video
LiDAR
Visibility
Night-time
visibility
Hand-held reflectometer
Mobile reflectometer
Day-time
visibility
Hand-held
Prediction
Wear
Image analysis
LiDAR
Safety Skid resistance
SRT
Dynamic measurement

CEDR Call 2014: Asset Management and Maintenance
Page 57 of 115
The photogrammetric recording methods deliver video-sequences or photos using one or several cameras, with each image accurately geographically referenced using inertially aided GPS so that inventory items can be identified in the images and their position extracted using either manual or automated methods. The creation of point clouds, which include intensity and/or colour information, is the main outcome of laser scanning methods (LiDAR). High level systems claim to provide absolute position accuracy of up to ~10 cm, although this depends heavily on GPS reception. To improve accuracy, control points with known locations can be used. This leads to accuracies of better than 5 cm.
The implementation of video and LiDAR based systems for the collection in inventory data has grown significantly in recent years. The TRIMM project undertook a review of these systems and identified several including:
The German (Lehmann+Partner) I.R.I.S – using single cameras
The Dutch Cyclomedia Measurement System, using 3600 rotating camera
The Austrian AIT Stereo photogrammetric systems
The Belgian KLM Aerocarto, using up to 14 cameras
The UK Yotta Video Survey Van – using multiple cameras.
TRIMM undertook a practical trial of the use of video equipment to collect inventory, as discussed in Case Study 1 below. It can be seen that this approach is becoming proficient for application in the identification of road markings and hence population of inventory databases. However, it should be noted that the extraction of the inventory (road marking) data is manual, requiring that an assessor views each image and “clicks” on the markings and studs.
Several recent studies have also investigated the use of LiDAR for road marking detection and extraction, and are showing reliable results. These surveys can combine imaging and LiDAR techniques to identify markings, and offer the potential for automated extraction of the road marking items, as discussed in Case Study 2.

CEDR Call 2014: Asset Management and Maintenance
Page 58 of 115
Example 1: Practical trials of the use of video systems to record inventory.
Yotta have built and now operate the YAV2, which is a bespoke vehicle that captures street level images for highway asset inventory analysis. Video of a road network is collected using six Prosilica GC2450 cameras triggered every 3m at a minimum resolution of 5 megapixels. The cameras are set up in a configuration to ensure the forward view is captured across a wide angle covering carriageway and off-carriageway items.
The forward facing cameras are supplemented with rearward facing cameras. Geographical position is recorded with an Applanix POSLV 220 navigation system with inertial measurement and differential correction to ensure the highest accuracy. The 6 YAV2 cameras are positioned in a way that provides the best visibility of the highway network:
• 2 forward facing cameras provide a wide field of vision – particularly useful for extracting signs
• 2 cameras positioned to collect right and left-hand side, forward images • 2 cameras positioned to collect right and left-hand side, rearward images
The YAV2 cameras are calibrated to ensure that 3D pixel locations can be obtained during post-processing. Yotta supplies its Nano software to allow clients to view their asset data, all of which will be processed to an agreed specification. Video and inventory data can be viewed in Yotta’s Horizons asset management software. Other GIS and CSV outputs can be supplied, ensuring the data is compatible with other systems as required.
Figure 9: The YAV2 system
Figure 10: Example images from the YAV2 vehicle. Note the 6 views of from the vehicle, covering two forward views, two rearward and one on each of the near and off sides.

CEDR Call 2014: Asset Management and Maintenance
Page 59 of 115
Case Study 1: Inventory of roadside objects – TRIMM
In the FP7 research project TRIMM (“Tomorrow's Road Infrastructure Monitoring and Management”), an equipment evaluation of a survey vehicle for inventorying roadside objects has been carried out. The evaluation was done in three areas in Vienna with different characteristics, ranging from densely built-up urban areas to rural areas. A reference data set provided by the municipality of Vienna from terrestrial survey containing locations of masts and poles, hydrants manholes and gullies was prepared. A second reference dataset containing traffic signs was prepared using geodetic GNSS survey equipment. The equipment to be evaluated represented state-of-the-art mobile mapping technology with calibrated cameras and a GNNS-IMU coupled positioning device that uses RTK corrections (correction data from fixed reference stations or networks) in post-processing.
Two tasks were evaluated:
• What is the location accuracy of objects detected by the mobile mapping vehicle? and
• How complete is the survey meaning how many objects could be detected in comparison to the reference data sets.
The trials have shown that it is possible to undertake surveys at traffic-speed to identify and locate inventory assets such as signs, manholes etc. With the combined GNSS-IMU measurement devices and RTK corrections that are available in most countries, a position accuracy of locating these items of better than 1 m should be possible for most locations on the network. Due to IMU coupling, passages through forests and alleys do not reduce the accuracy significantly. Of course this is possible only to a certain extent. Densely built up areas (city centres) with high buildings still remain a challenge. However, manual GNSS surveys with RTK rely on the same base technology and therefore face the same problems in these areas. In area 1, getting a highly accurate RTK fix with the handheld GNSS receiver was a rare occasion and the calculated accuracies obtained were in the range of 4-5 m. For the more rural areas, the accuracy of ~1 m could be reached for most items. If the satellite outtake is short (e.g. only a few seconds when driving through a tunnel) the traffic speed survey has the edge over a manual survey as the static measurement would not get a position at all.
If the demands are higher, in the decimetre-range or even centimetre-range, additional control points are absolutely necessary.
The trial showed differences in terms of completeness for different asset types. Road inventory that can be seen from the survey vehicle and is unique in shape, colour etc. perspective will have a higher percentage of completeness than more challenging items. Categories that are similar in look and appearance (like gullies and manholes in the equipment evaluation) may be difficult to distinguish. Objects like manholes, that are often hidden under or behind parked cars are more difficult to locate and will lead to a lower completeness level. On the other hand, manual surveying from a moving vehicle faces similar problems for inventory objects hidden under parked cars.
Figure 11: Location of areas for equipment evaluation in Vienna
Figure 12: The Yotta survey vehicle

CEDR Call 2014: Asset Management and Maintenance
Page 60 of 115
AREA 1 (%) AREA 2 (%) AREA 3 (%)
< 1m < 5m < 1m < 2m < 1m < 2m
Gullies 19.5%
76.5%
97.1%
99.7%
93.0% 98.2%
Hydrants
29.9%
93.1%
94.9%
98.3%
96.9%
100.0%
Manholes
25.2%
88.2%
90.8%
99.6%
96.7% 99.8%
Masts and Poles
35.4%
96.9%
92.0%
99.7%
95.2% 99.3%
Signs No data
No data
92.6%
98.9%
No data
No data
Table 30: Correctness of position for the asset types
AREA 1 (%)
AREA 2 (%)
AREA 3 (%)
Comments
Gullies 60.5%
85.5%
69.8%
Hydrants
77.8%
95.2%
91.5%
Manholes
87.6%
64.% 97.3%
Masts and Poles
95.5%
99.5%
100%
Signs No data
90.5%
No data
Reference Data only available in area 2
Table 31: Results of completeness for the asset types
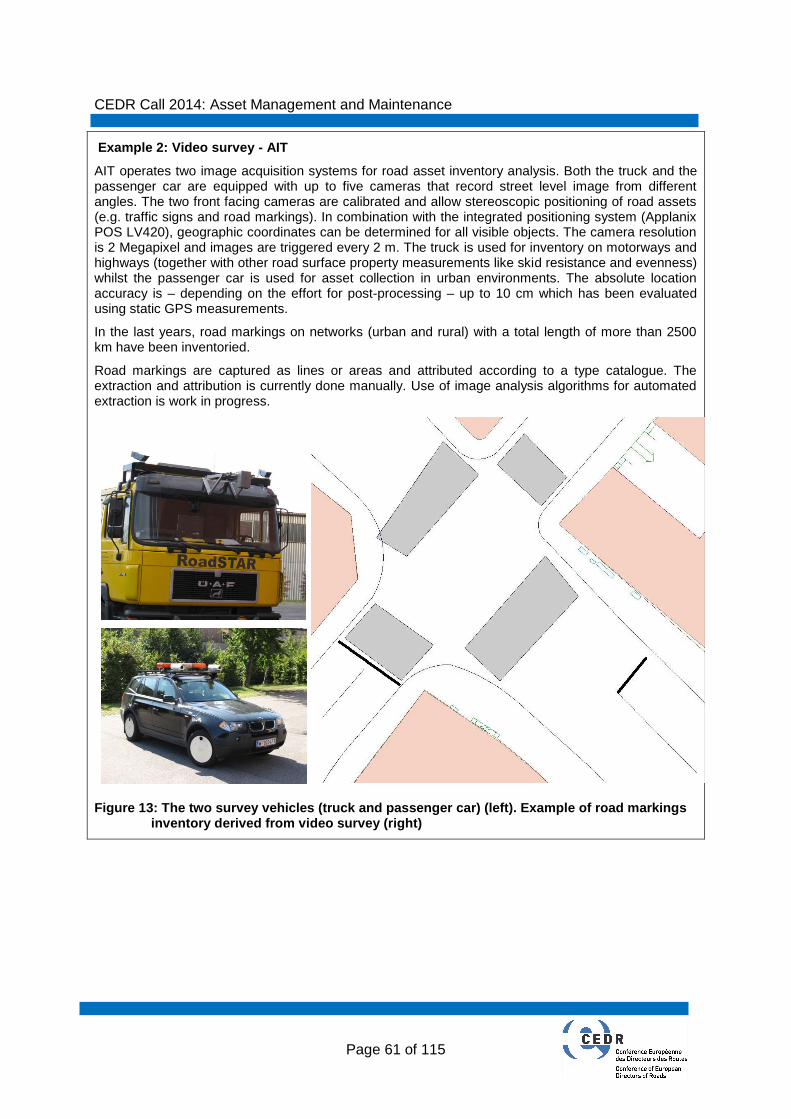
CEDR Call 2014: Asset Management and Maintenance
Page 61 of 115
Example 2: Video survey - AIT
AIT operates two image acquisition systems for road asset inventory analysis. Both the truck and the passenger car are equipped with up to five cameras that record street level image from different angles. The two front facing cameras are calibrated and allow stereoscopic positioning of road assets (e.g. traffic signs and road markings). In combination with the integrated positioning system (Applanix POS LV420), geographic coordinates can be determined for all visible objects. The camera resolution is 2 Megapixel and images are triggered every 2 m. The truck is used for inventory on motorways and highways (together with other road surface property measurements like skid resistance and evenness) whilst the passenger car is used for asset collection in urban environments. The absolute location accuracy is – depending on the effort for post-processing – up to 10 cm which has been evaluated using static GPS measurements.
In the last years, road markings on networks (urban and rural) with a total length of more than 2500 km have been inventoried.
Road markings are captured as lines or areas and attributed according to a type catalogue. The extraction and attribution is currently done manually. Use of image analysis algorithms for automated extraction is work in progress.
Figure 13: The two survey vehicles (truck and passenger car) (left). Example of road markings inventory derived from video survey (right)
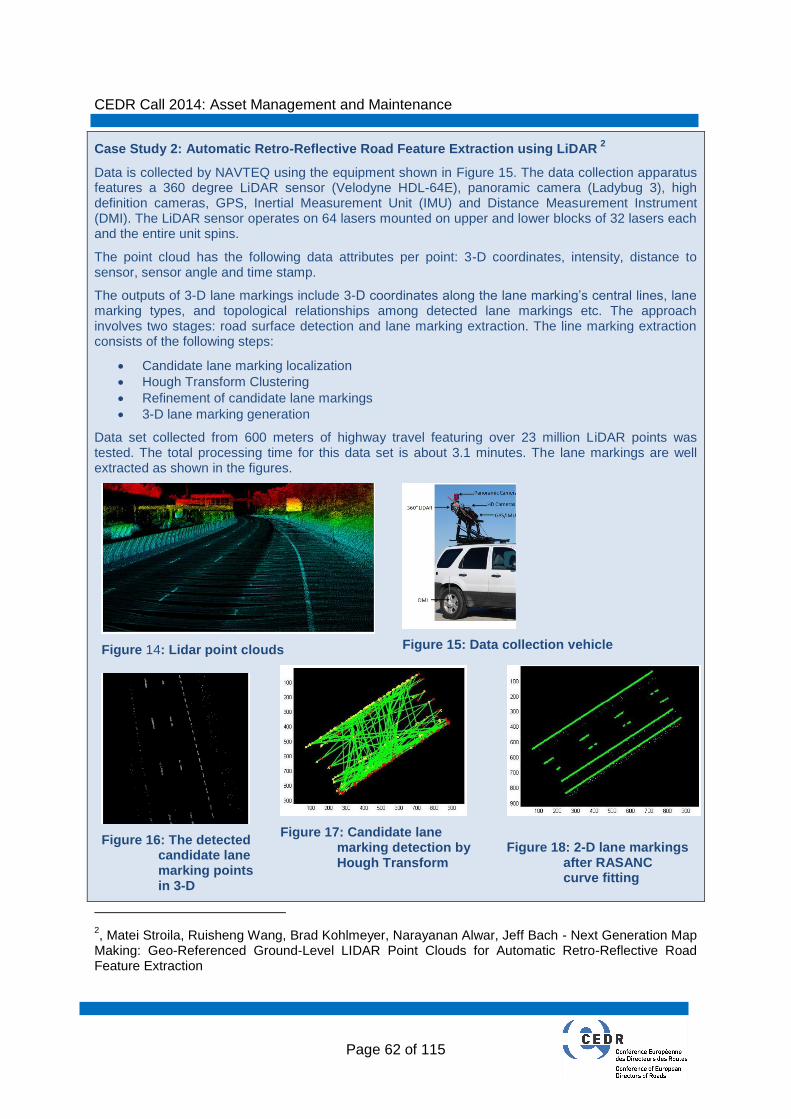
CEDR Call 2014: Asset Management and Maintenance
Page 62 of 115
Case Study 2: Automatic Retro-Reflective Road Feature Extraction using LiDAR 2
Data is collected by NAVTEQ using the equipment shown in Figure 15. The data collection apparatus features a 360 degree LiDAR sensor (Velodyne HDL-64E), panoramic camera (Ladybug 3), high definition cameras, GPS, Inertial Measurement Unit (IMU) and Distance Measurement Instrument (DMI). The LiDAR sensor operates on 64 lasers mounted on upper and lower blocks of 32 lasers each and the entire unit spins.
The point cloud has the following data attributes per point: 3-D coordinates, intensity, distance to sensor, sensor angle and time stamp.
The outputs of 3-D lane markings include 3-D coordinates along the lane marking’s central lines, lane marking types, and topological relationships among detected lane markings etc. The approach involves two stages: road surface detection and lane marking extraction. The line marking extraction consists of the following steps:
Candidate lane marking localization
Hough Transform Clustering
Refinement of candidate lane markings
3-D lane marking generation
Data set collected from 600 meters of highway travel featuring over 23 million LiDAR points was tested. The total processing time for this data set is about 3.1 minutes. The lane markings are well extracted as shown in the figures.
Figure 14: Lidar point clouds
Figure 15: Data collection vehicle
Figure 16: The detected candidate lane marking points in 3-D
Figure 17: Candidate lane marking detection by Hough Transform
Figure 18: 2-D lane markings after RASANC curve fitting
2, Matei Stroila, Ruisheng Wang, Brad Kohlmeyer, Narayanan Alwar, Jeff Bach - Next Generation Map
Making: Geo-Referenced Ground-Level LIDAR Point Clouds for Automatic Retro-Reflective Road Feature Extraction

CEDR Call 2014: Asset Management and Maintenance
Page 63 of 115
5.4 Measuring the night time visibility of road markings
The night-time visibility of road markings is described by the retroreflectivity (RL). RL can be measured under dry, wet and raining conditions but not all measurement devices are able to survey in conditions other than dry. Each method is described below.
Slow speed measurement methods 5.4.1
Measurements of RL can be made at slow speed using a hand-held retroreflectometer, as shown in Figure 19, with a typical testing regime using such a device shown in Table 32. A number of such devices exist, including
LTL 2000
Zehntner ZRM 1013
Stripemaster.
Whilst measurements can be made under dry, wet and raining conditions it is recommended that readings are made for dry markings only: None of the example measuring equipment highlighted above are suitable for measuring under wet conditions.
Table 32: Spot measurement testing details
Type No. of Readings Condition
Continuous Lines 15 15 Readings made on a 5m minimum test section
Intermittent Lines 5 5 Readings per mark, for 3 consecutive marks
Lines > 150mm wide 5-15 Refer to Continuous/Intermittent
Symbols 5 5 Readings per mark, taken at equidistant points
Figure 19: Measuring the night time visibility of road markings with hand-held reflectometer
As these devices operate at slow speed they are not practical for use over larger lengths of markings, and therefore a test area must be selected that is representative of the total to be assessed, which is not always practical. Due to the variability in the performance along markings, it should also be noted that sampled values acquired on a particular occasion are not necessarily the average or typical value of the whole road marking.
This method does bring the benefits that measurements can be easily carried out and they are usually reliable. However the method is limited in that it incurs additional health and

CEDR Call 2014: Asset Management and Maintenance
Page 64 of 115
safety issues, such as requiring a road closure to conduct the test. Further to this, the measurements may not match those obtained using the traffic speed method for the same area of markings.
Traffic Speed measurements – Dry conditions 5.4.2
Objective measurements of RL can be carried out using a traffic speed retroreflectometer. Measurements can be taken continuously along the test sections and averaged over, for example, 10m or 100m intervals.
A number of current monitors have been in use on the network for several years, including
ECODYN Prismo 1 & RMTS
Laserlux AEPO
PTS models
Typically in such a survey the vehicle moves along the road surface and measures the retroreflection of road marking. An observation angle of 2.29° is used which corresponds to the viewing distance of a motor car driver of 30 m under normal conditions. The illumination angle is 1.24°. The system may also collect also some inventory characteristics (location, type and details).
Figure 20: Night-time visibility measurement of road markings with mobile reflectometer
With a number of devices available that can operate at traffic speed, it might be assumed that the problem with assessing nigh-time visibility at the network level has been resolved. However, this is not the case, and this is reflected by the different types of survey reported in the stakeholder consultation above. This is because there are still some concerns over the robustness/consistency of the data provided by the traffic speed devices, and the practicality of undertaking network level surveys with the devices.
Several investigations have been carried out into this issue:
In one test (Case Study 3) several different hand-held and mobile reflectometers were compared. Two companies participated with their own mobile and hand-held equipment – DELTA and Ramböll. These trials reported quite good results between the two types of device
In 2009 (Case Study 4) VTI, The Swedish National Road and Transport Research Institute, tested two mobile systems – LTL-M, developed by DELTA Light & Optics, and Ecodyn 30 - on more than 30 stretches of road in Denmark and Sweden. The data was compared with the hand-held instrument LTL-2000. This study identified some inconsistencies between the devices.

CEDR Call 2014: Asset Management and Maintenance
Page 65 of 115
BRRC compared the accuracy and repeatability of hand-held and mobile instruments in a round robin test in 20103. The round robin test was run on 21 stretches of road in Belgium (Case Study 5) using four different devices: LTL-M, two systems Ecodyn 30 and Zehntner ZDR 6020. A hand-held instrument of type LTL-2000 was used as reference. A degree of variability was identified in the results.
TRL compared three traffic speed devices against a hand-held device (Case Study 6).
In the UK the routine measurement of retroreflectivity was introduced in network surveys of road condition. This included a requirement for accreditation testing of the equipment, supported by a research project to assess the robustness of the measurements. These identified a number of concerns in the robustness of the survey data (Case Study 7).
Case Study 3: Comparison of mobile and hand-held retroreflectometers 4
Road markings on 10 test sites around the Swedish city of Kristiansstad were measured. Hand-held measurements were performed with approximately two metres between measurements on continuous lines and two measurements per line segment on segmented lines. An average of all hand-held instruments was used as the “reference” baseline to determine measurement precision.
The results of the repeated test showed that all mobile and hand-held instruments have absolute and systematic errors well below 4% proving that the same precision
Figure 21: Correlation between mobile devices
can be obtained by both hand-held and mobile instruments. There is also very good correlation between hand-held reference and all the other instruments.
3 Luc Goubert, Sven-Olof Lundkvist - Report of the first round robin test for mobile reflectometers
Research carried out in the frame of the activities of CEN/TC 226/WG2, 2011
4 http://www.assets.madebydelta.com/docs/roadsensors/Article/Comparison-retrometers-Kristianstad-
October-2013.pdf

CEDR Call 2014: Asset Management and Maintenance
Page 66 of 115
Case Study 4: Swedish comparison between hand-held devices and mobile reflectometers5
The two mobile systems – LTL-M, developed by DELTA Light & Optics, and Ecodyn 30 were tested in 2009 on more than 30 stretches of road in Denmark and Sweden. The reference hand-held instrument LTL-2000 was used.
The laboratory test showed that the measurement principle of LTL-M is more reliable than that of the Ecodyn 30 as the LTL-M provided less sensitive to changes in the measurement geometry.
The deviation between readings of the LTL-2000 and the LTL-M was found to be only slightly larger than the deviation found between the two specimens of the LTL-2000. This indicates that the LTL-M measures almost as accurate as the hand-held instrument. The measurement errors of the Ecodyn 30 are clearly larger than those of the LTL-2000. It must be noted, that the area which is measured is not equal – hand-held measurement involves sampling, taking one reading in the centre of the road marking every 5th metre. The LTL-M reads only the RL-value each metre and this value is an average of the entire road marking width. This means that on a 200 m long section of a continuous edge line of 0,10 m width, the LTL-M includes almost the all of the road marking area, 20 m², while the LTL-2000 reads an average of approximately 0,34m², corresponding to 1,7% of the total area. This may affect the comparison of LTL-M and LTL-2000 measurements. It may be pointed out that the systematic deviation determined in the laboratory measurements, where the measured areas were identical, was only 0,6%.
Figure 22: Mobile reflectometer Ecodyn 30
Figure 23: Mobile reflectometer LTL-M
Figure 24: Relationship between the two mobile devices – Ecodyn 30 and LTL-M
5 Sven-Olof Lundkvist Evaluation of LTL-M – Mobile measurement of road marking, VTI rapport 675A,
2010

CEDR Call 2014: Asset Management and Maintenance
Page 67 of 115
Figure 25: Relationship between the mobile device LTL-M and the hand-held device LTL-2000
Figure 26: Relationship between the mobile device Ecodyn 30 and the hand-held device LTL-2000
Case Study 5: Round Robin Test - dry road marking retro-reflectivity measurement
Four mobile retro-reflectometers were tested in 2010 in the round robin test in Belgium: LTL-M, two systems Ecodyn 30 and Zehntner ZDR 6020. As reference, a hand-held reflectometer of type LTL-2000 was used.
The round robin test was run on 21 stretches of road in Belgium– 19 continuous plane and profiled edge lines and two broken (3 m line, 9 m gap) lane lines, each of the length 200 metres.
In order to estimate the repeatability of the mobile instruments, more than one measurement round was carried out at eight of the sites. The remaining twelve test sites were only measured once. The mobile measurements were carried out in approximately 50 km/h and at every site all mobile readings were taken within a couple of minutes.
Figure 27: Round Robin Test in Belgium (2010)
The results show that the uncertainty of one instrument was extremely large. From earlier experience it is obvious that the measurement errors of this instrument were not representative, and therefore should be neglected. The uncertainty of the other three mobile instruments was in the range 7–15%, which is larger than the uncertainty of the reference instrument. For different reasons, three of the test sites could be excluded. In that case, the results show somewhat better uncertainty: 6–13%. The repeatability was 2–3%.
When interpreting the results, it is important to note that the four types of instrument (three mobile and the hand-held) in fact do not measure the same area of the road marking. Consequently, one should not expect a one to one relationship between the readings, especially if the retro-reflectivity of the road marking surface is inhomogeneous.

CEDR Call 2014: Asset Management and Maintenance
Page 68 of 115
Case Study 6: Comparison of traffic speed retroreflectometers with hand-held device
An assessment of several traffic speed retroreflectometers was carried out on the trunk road and motorway network in England: The TRL MarkingCollector (Example 5), Vectra’s Ecodyn 1, Delta’s LTL-M (Example 3) and Zehntner’s ZDR6020.
A survey route of approximately 65km on the trunk road and motorway network was used for the test and this included a diverse range of types of road marking (dashed, solid) and condition and also pavement surface type.
During the tests, data was collected with each of the four retroreflectometers, as well as high definition forward facing imaging and inertially corrected location referencing. This allowed the data to be aligned from each retroreflectometer. In order to obtain a dataset that was not affected by outside factors, all four retroreflectometers carried out the survey at the same time and day in convoy. The order that vehicles travelled within the convoy was also varied from run to run. The route was completed by all survey vehicles three times so that their repeatability could be assessed. Along the route were areas that were not assessed, such as roundabouts, sliproads and roadworks; these sections were removed from the dataset.
Figure 28: Repeatability assessment: Cumulative frequency distribution of between run errors
For each of the four devices used, the repeatability of the data was tested (i.e. how consistency an individual device measures retroreflectivity over repeat runs). The cumulative frequency distribution of errors between runs for all devices is given in Figure 28 and it can be seen from this that the LTL-M and the MarkingCollector (RMM on the graph) appear to be much more repeatable than the ZDR6020 and Ecodyn, with the Ecodyn performing particularly poorly.
How reproducible the devices were (i.e. how well they matched each other) was also investigated.
To assess the reproducibility between the vehicles, the average value across the three runs was taken for each 100m section. Figure 29 shows this plot for the LTL-M, the ZDR6020 and the RMM, but the Ecodyn was excluded due to variability in its results. Good general agreement could be seen between the three retroreflectometers, and particularly the MarkingCollector (RMM) and LTL-M.
Since no reference data was available for the survey, a statistical process could not be used to determine which retroreflectometer best measured the actual retroreflectivity.
Figure 29: Reproducibility between vehicles (Ecodyn excluded)

CEDR Call 2014: Asset Management and Maintenance
Page 69 of 115
Case Study 7: Routine measurements of night-time visibility in the UK
Highways England funded investigations into both new and existing equipment for the routine assessment of the daytime and night-time visibility of road markings, with the objective of identifying suitable techniques to improve the ability to measure these properties
6.
Research had identified issues with the equipment being used to provide measurements of retroreflectivity on the trunk road and motorway network in England, which included:
On broken white lines, the first and last retro-reflectivity measurements (along the road) on each dash are acquired partially on the road surface. Including such data in the calculation of average retro-reflectivity values therefore artificially decreased the retro-reflectivity values reported
In conditions of high ambient illumination, typically occurring when driving towards a low sun, the retro-reflectivity measurements can be noisy. This occurs despite the use of a modulated internal light source and sophisticated demodulation electronics which handle the reflected light. The equipment was not able to totally reject the ambient light component in the reflected signal and even amplified it, especially on broken white lines. This led to spikes in the retro-reflectivity data.
As a result of these issues, a number of improvements to the Quality Assurance process, processing and location referencing were implemented. However, even with these improvements there were still problems with the equipment, which included:
Impractical equipment mounting, low and to the side of the survey vehicle, exposing the equipment to hazards, presenting a potential safety risk for other road users and exposing the equipment to dirt/detritus
Inconsistencies in the measurements resulting from difficult calibration procedures and hence changes in the measuring equipment angle relative to the road marking having a detrimental effect on the quality of data collected by the system.
Limited measurement width resulting in the need for an impractical driving line and inability to measure both the nearside and offside road markings in the same survey run.
Susceptibility of the measurement to changes in ambient light, which cause higher levels of noise in the data.
All of these problems led to inconsistency and/or inaccuracy in the data. Large inconsistency can even be seen when the values recorded by the same type of equipment installed on two separate vehicles was considered at a network level (Figure 30).
Figure 30: Cumulative frequency distribution of retro-reflectivity values (in 100m averages) over the network normalised and separated into bins of size 10 [mcd.m-2.lx-1]
6 Iaquinta J., J Pynn and A Wright (2007): “Evaluation of the performance of equipment for monitoring
road studs at traffic speed”. UPR IE/170/07. TRL Limited, Crowthorne (UK). TRL Limited and Jacobs (2006): “Developing equipment to measure the retro reflectivity of road studs”. UPR/IE/195/06. TRL Limited, Crowthorne (UK). Iaquinta J., J Pynn and A Wright (2009): “Enhanced processing of white line and road stud retro-reflectivity data”. CPR 529 TRL Limited, Crowthorne (UK).

CEDR Call 2014: Asset Management and Maintenance
Page 70 of 115
It can be seen from the results of these case studies that there have been variable levels of performance observed with existing systems. However, developments have been ongoing in the industry to improve the performance of equipment in the measurement of RL. These developments have focussed on a number of areas:
Improving the practicality of the survey
Improving the consistency of the data
These are discussed in the following sections.
Improvements to the practicality
The measurement equipment discussed above is typically designed to measure the condition of the marking by positioning a measurement device close to the lane edge, as shown on Figure 31 a). This requires the vehicle to adopt a careful and difficult measurement path. By widening the sensor measurement it should be possible to drive in a more “normal” line whilst reducing the detrimental effects of poor measurement line on the data - Figure 31 b) and c). Devices are becoming available to achieve this measurement line (Example 4 and Example 5).
Figure 31: Night-time visibility measurement of road markings with mobile reflectometer - a) Dynamic Single-line Side-Mounted Retroreflectometer system b) measurement across the full width of traffic line with the system RetroTek-M c) measurement across the full width with Road Marking Collector
Improvements to the consistency
Previous measurement systems were limited in their consistency as a result of driving line issues as discussed above, and also because of limited capability in the image systems. In addition, the geometry required to measure RL is currently requires the head to be mounted at a shallow angle so that changes in vehicle pitch can adversely affect the performance. Systems have been proposed to overcome these limitations (Example 4 and Example 5). However, these are emerging systems which adopt different approaches to the measurement of RL, and which require further assessment and acceptance as the new generation of network level tools.
It can be concluded that there have been significant advances in the mobile reflectometers capability to collect information about the night time visibility. Indeed, these measurement systems are used in some countries (Ireland, Sweden and Finland) for routine monitoring of road markings. The round robin test in 2010 in Belgium and the other small tests have shown good correlation between hand-held and mobile devices and the new mobile systems can provide measurements across the full width of traffic line. The further take up of these

CEDR Call 2014: Asset Management and Maintenance
Page 71 of 115
approaches for network level assessment should be pursued. However, to manage the risks of introducing new systems the accuracy, precision and consistency of the latest mobile systems should be further investigated and compared with hand-held devices. A comparison between dynamic single-line side-mounted retroreflectometers and the measurement systems which collect information across the full width should be also investigated. This research would help understand the advantages and disadvantages of both types of system, to define which method has better potential for measurements at network level. The research could also help understand systems which offer network level data but at non-standard geometries. If the data provided by these systems is still acceptable for the separation of sound and poorly performing makings the greater level of practicality provided by the non-standard device could offer significant improvements in the ability to achieve network level assessment.
Example 3: Retro-reflectivity survey with LTL-M7
LTL-M measures all types of road markings at a simulated distance of 30 m with the highest level of accuracy. LTL-M is used mounted on a vehicle measuring retroreflection at traffic speed, providing full overview of the condition of the road markings. The instrument operates with an accuracy of typically +/- 5 % and a repeatability of typically of +/- 3 %, which is in line with DELTA’s hand-held retroreflectometers LTL-2000, LTL-X, and LTL-XL.
LTL-M measures RL (nighttime visibility) under dry conditions, daylight contrast as well as records line geometry and missing or non-working road studs (RRPMs).
Figure 32: LTL-M illustration from the Danish engineering magazine Ingeniøren
Figure 33: Mobile retro-reflectometer LTL-M
Figure 34: LTL-M Software
7 http://roadsensors.madebydelta.com/products/ltl-m/

CEDR Call 2014: Asset Management and Maintenance
Page 72 of 115
Example 4: Ireland roads retroreflectivity survey 2016 with RetroTek M
Irish motorways and national primary roads were measured with the RetroTek M over a 12 week period (March-May 2016). The Survey was carried out by RMS for Northern Road Markings. 69 roads were inspected in total, with a total line length inspected of 16,508 km. The goal of these measurements was to check the current condition of road markings and studs at a national level allowing the NRA to identify and prioritise areas that needed attention.
The survey was carried out at normal traffic speeds, so required no road closures/traffic management. The system works only at night, so surveys were done at night in dry conditions (before the dew fell).
The system collects the following information: Retroreflectivity (RL) of road markings, Stud presence/absence, Line width, Driving Speed, Ambient temperature and humidity. Each reading was timestamped and GPS location recorded.
In addition the system collects images of the entire road view at a rate of 20 frames per second containing all the road assets, giving the user a video of every road for the entire survey. Videos of all junctions were also acquired during the daytime so engineers could see overall condition of junctions.
The data for each road was processed and averaged to 100 and 1000 m sections and output in .csv files. PDFs containing a network wide presentation of each road asset were compiled to give an overview of the entire road network to key decision makers in the NRA. The data for the entire network was also combined and presented in MultiView, a RMS application which allowed the NRA to view the entire road network on an interactive map and see results and video for any 100m section on any road. The NRA was also able to access this application online.
The high mounting position of the RetroTek sensor gives greater clearance from the road surface and the central vehicle position allows a wider field of view. This avoids the hazards presented to both the equipment and other road users compared with the existing low, side mounted equipment.
The RetroTek-M is commercially available and uses and independently certified to EN 1436 using CEN30 meter geometry. It has obtained StrAusZert Certification. The RetroTek-M system has the following benefits over side-mounted single-line vehicle mounted systems:
Mounted higher from the road surface and at the front and in the middle of the vehicle and thus reduces the effect of detritus, improves measurement consistency and accuracy.
With a Wider field of view can measure retro-reflectivity of lane markings up to 6.0 m across the lane width, removing the requirement to drive adjacent to the road marking. Night visibility measurements are taken in real driving conditions.
One device measures lane markings and road studs on both sides of the lane and vehicle simultaneously at all traffic speeds.
Can be retrofitted to existing pavement survey vehicles and only normal lane driving enquired.
High front centre mounted position allows safer operation for operator & other road users.
The survey data is automatically processed to produce retro-reflectivity measurements of markings, absence and presence of road studs with video images.

CEDR Call 2014: Asset Management and Maintenance
Page 73 of 115
Figure 35: Road Assets Collected by RetroTek-M in one Lane in One Pass – Lines, Symbols, Studs and Barrier Reflectors
Example 5: The MarkingCollector
The network level measurement of the retroreflectivity of longitudinal markings was introduced as a routine survey by Highways England in 2008. Unfortunately this survey experienced several problems with the network level measurement of the retro-reflectivity of road markings when attempting to utilise the standard equipment available at the time (see Case Study 7).
As a result of these issues a research programme was commissioned to improve the ability to measure road marking condition. The programme had the longer term aim of demonstrating a practical method to deliver improved measurements of road marking retro-reflectivity, so that Highways England could re-introduce this measurement into the routine network level survey (TRACS) with confidence that the survey would be capable of delivering accurate and consistent information on the condition of road markings.

CEDR Call 2014: Asset Management and Maintenance
Page 74 of 115
This led to the development of the Road Marking Monitor (RMM).
Theoretical and experimental research were initially undertaken to characterize the proposed technique so as to inform the design of the prototype. Thus the RMM used a novel approach for the measurement of retro-reflectivity, with the new system employing a high resolution sensor with LED lighting combined with sophisticated image processing to automatically measure the night-time visibility of road markings at traffic-speed. A high mounting position for the sensing head gives greater clearance from the pavement and a wider field of view reduces the amount by which it protrudes from the side of the vehicle. This avoids the hazards presented to both the equipment and other road users compared with the existing low, side mounted equipment (Figure 36).
Figure 36: LED lighting system used for Marking Collector
TRL’s proposed concept required that non-standard geometry between the illuminator and sensor would be employed, and therefore, the geometry behaves as a proxy for standard geometry. The equipment has the following potential benefits:
The system is mounted higher up on the vehicle to reduce the effect of detritus and to improve measurement consistency.
Wide field of view – able to measure retro-reflectivity of lane markings up to 2.4m from the vehicle’s driven line, removing the requirement to drive adjacent to the road marking.
Two devices on a single vehicle could measure lane markings on both sides of the vehicle simultaneously.
Can be retrofitted to existing pavement survey vehicles that make multiple measurements and need to drive the centre-line of the lane.
The sensor data is automatically processed to produce retro-reflectivity measurements and provide images of the measured road marking.
Laboratory based and on-road testing has both shown that the equipment has a high degree of correlation with equipment used currently but with the advantage that the practical limitations have been eliminated
8. The system has also been used to survey many kilometres of road network and has been
shown to be robust enough to be able to perform network level surveys.
Thus the system is now being made available as a commercial product: The MarkingCollector.
In addition to being able to coincidentally measure the left and right lane delineation markings, the addition of a third device has shown potential for the measurement of road markings across the lane width (e.g. directional arrows)(REF).
8 Gleeson A, N Dhillon, R Lodge and A Wright (2015): “Trials of road marking monitor to determine
performance levels for network surveys”. TRL Published Project Report PPR763.
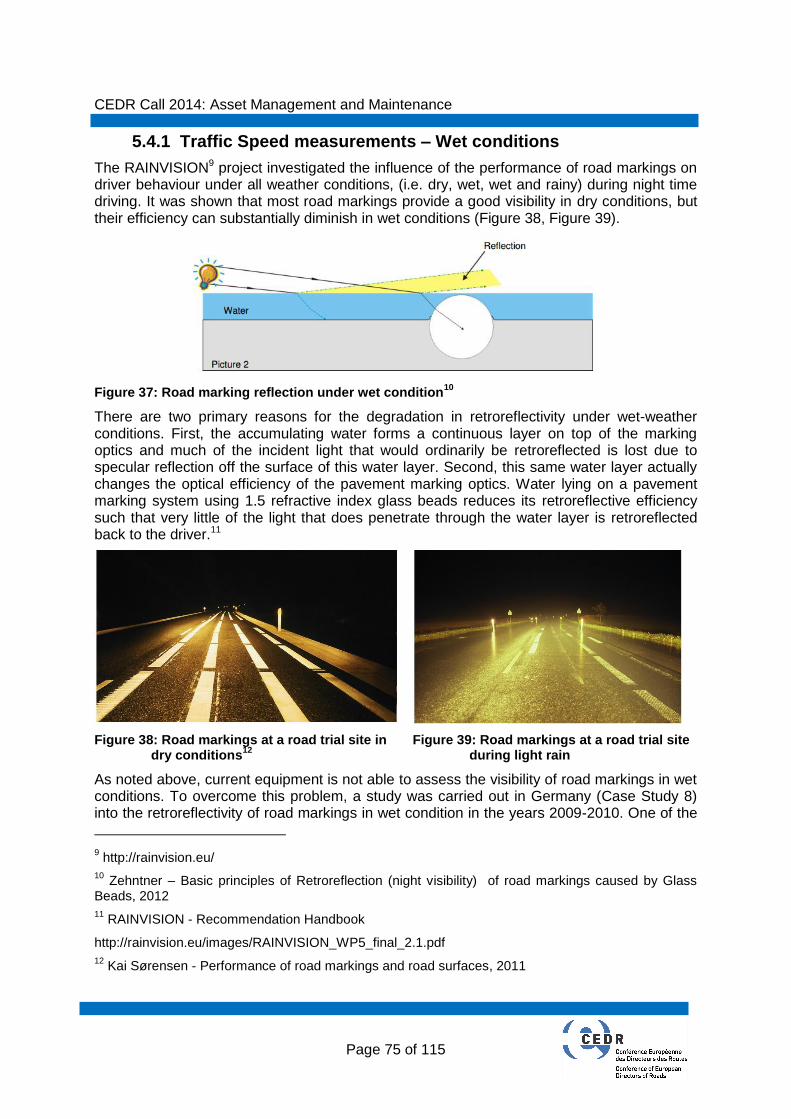
CEDR Call 2014: Asset Management and Maintenance
Page 75 of 115
Traffic Speed measurements – Wet conditions 5.4.1
The RAINVISION9 project investigated the influence of the performance of road markings on driver behaviour under all weather conditions, (i.e. dry, wet, wet and rainy) during night time driving. It was shown that most road markings provide a good visibility in dry conditions, but their efficiency can substantially diminish in wet conditions (Figure 38, Figure 39).
Figure 37: Road marking reflection under wet condition10
There are two primary reasons for the degradation in retroreflectivity under wet-weather conditions. First, the accumulating water forms a continuous layer on top of the marking optics and much of the incident light that would ordinarily be retroreflected is lost due to specular reflection off the surface of this water layer. Second, this same water layer actually changes the optical efficiency of the pavement marking optics. Water lying on a pavement marking system using 1.5 refractive index glass beads reduces its retroreflective efficiency such that very little of the light that does penetrate through the water layer is retroreflected back to the driver.11
Figure 38: Road markings at a road trial site in dry conditions
12
Figure 39: Road markings at a road trial site during light rain
As noted above, current equipment is not able to assess the visibility of road markings in wet conditions. To overcome this problem, a study was carried out in Germany (Case Study 8) into the retroreflectivity of road markings in wet condition in the years 2009-2010. One of the
9 http://rainvision.eu/
10 Zehntner – Basic principles of Retroreflection (night visibility) of road markings caused by Glass
Beads, 2012
11 RAINVISION - Recommendation Handbook
http://rainvision.eu/images/RAINVISION_WP5_final_2.1.pdf
12 Kai Sørensen - Performance of road markings and road surfaces, 2011

CEDR Call 2014: Asset Management and Maintenance
Page 76 of 115
main goals was to identify a correlation between the dynamic measuring system and the wetness, leading to a measurement technique. The work did not deliver a working method.
More recently a survey provider has claimed that they have a system that can estimate predicted the retroreflectivity in wet conditions Rw (Case Study 9). However, limited testing has been carried out to date.
It is clear that the measurement of night time visibility in wet conditions is requirement for the robust assessment of road marking condition, because their efficiency can substantially diminish in wet conditions. However, there is still a need to overcome the technical challenge of measuring this parameter.
Case Study 8: Wet road marking retroreflectivity measurement
In the Years 2009/2010 a study on retro reflection of road markings in wet condition was done in Germany. The contracting authority was the “Bundesamt für Strassenwesen” (BASt) of Germany (report to be published). The study was conducted by the “Deutsche Studiengesellschaft für Strassenwesen” (DSGS), Germany and Company Zehntner Testing Instruments, Switzerland. The goal of the research was to develop a mobile measuring method of measuring RL that correlates with the condition of wetness known from EN 1436:2007+A1 part B6 (bucket method). The system developed consisted of a van to wet the road marking and a separate measuring car. At a driving speed of 60 km/h, the distance between the watering van and the measuring car was about 80 to 100m.
Figure 40: Equipment for wet retroreflectivity dynamic measurement
Figure 41: Hand-held measurements of road markings
Figure 42: Spraying system with nozzles
This study only identified a potential method for measuring the night-time visibility at wet condition. A problem with watering was found - at a driving speed of 60 km/h and a flow of water of 3.85 l/s the use of water amounts to 1 000 l in 4 min or as well in 4 km. It was proposed this measuring method to be tested in a large-scale experiment.

CEDR Call 2014: Asset Management and Maintenance
Page 77 of 115
A survey provider offers a system that can estimate predicted the retroreflectivity in wet conditions Rw (Case Study 9), but more research is needed. Therefore, the recommendation in PREMiUM is investigation of road marking visibility in wet conditions and development of a prediction model for wet road marking retroreflectivity.
Case Study 9: Development of a prediction model for wet road marking retroreflectivity13
This study describes an attempt to improve the model which so far has been used for prediction of wet road marking retroreflectivity when using mobile equipment. So far, regarding mobile measurement, wet road marking retroreflectivity has been predicted using a model involving the dry road marking retroreflectivity and the mean profile depth, MPD, of the profile. However, the precision of the predictions is poor and there is a desire to improve the model.
In a first step of the study the so-called texture factor, T, was developed. In short, this texture factor calculates the sum of the luminous flux from all road marking facets which are visible to the driver. In the next step, using results from field measurements, a prediction model was developed and evaluated.
The measurements were carried out on five roads in Sweden and Denmark. The following measurements have been carried out:
Retroreflectivity of dry road markings, RL(dry). Hand-held and mobile measurement using LTL-X and LTL-M, respectively. The model was developed from the hand-held readings.
Retroreflectivity of wet road markings, RL(wet). Hand-held measurement using LTL-X.
Luminance factor of dry road markings, β, Hand-held measurement using Konica Minolta Spectrophotometer CM-2500c.
Profile of dry road markings, from which MPD and T were calculated. Mobile measurement using an optocator of type OPQ Systems RM-L1.
The results have shown that the texture factor is a better predictor of the retroreflectivity of a wet road marking than MPD is. The average difference between measured and predicted values was found to be 5.0 mcd/m
2/lx, which is an improvement from 5.6 mcd/m2/lx when using MPD. The results
indicated that β has no significant correlation with RL(wet). The three variables (RL (dry), T and MPD) have shown a positive, significant correlation.
Figure 43: Mobile measurement system using LTL-M and an optocator for measurement of the road marking profile.
Figure 44: The relationship between predicted and measured values of RL(wet) including a 90% prediction interval for individual observations
13
Sven-Olof Lundkvist, Kai Sørensen, Berne Nielsen - Development of a prediction model for wet
road marking retroreflectivity - Mobile measurement of road marking performance, VTI rapport 885A

CEDR Call 2014: Asset Management and Maintenance
Page 78 of 115
5.5 Key Condition data - Night time visibility of road studs
Slow speed measurement methods 5.5.1
A number of slow speed methods have been identified which can be used to assess the night-time performance of road studs, as described in EN 1463 and TD 26/07. The consultation suggested that measurements of road studs were not actually carried out to the same extent as those for road markings, and were collected on a much lower frequency. This may be as a result of the lack of a traffic-speed network level method. However, the standards recommend that road studs should be inspected, every six months.
Slow speed method 1: EN 1463 (Parts 1 & 2) provide details of this test methodology in which objective spot measurements of studs are made using a hand-held retroreflectometer.
Slow speed method 2: TD 26/07 describes a night-time inspection technique. This is a visual inspection which requires subjective spot measurements; it does not make use of a retroreflectometer. The methodology is very simple, under dipped headlight conditions from a vehicle moving at moderate speed, an inspector reports if more than one out of each ten consecutive studs has poor retroreflection properties. The number of studs assessed should be representative of the test section.
Figure 45: Graphical illustration of the measurement principle of road studs
Figure 46: Hand-held reflectometer for the measurement of night time visibility of road studs (Zehntner ZRP 6030)
Figure 47: Hand-held reflectometer for the measurement of night time visibility of road studs (EasyLux)
Traffic speed measurement methods 5.5.2
Objective measurements of the night-time visibility of road studs can potentially be provided at traffic speed using a retroreflectometer. However, the development of this technology can be considered as “emerging”, as no adopted routine approach was identified in the review. However, most of the mobile systems provide information about missing or non-working road studs (the number of the studs). It is difficult to measure the visibility of the studs, because they reflect much more light per unit area than road lines and this saturates out cameras, so the system cannot get a reading. Another reason is that, the road stud reflecting surface is very small and it is hard to get a measurement from a small number of pixels.

CEDR Call 2014: Asset Management and Maintenance
Page 79 of 115
5.6 Key Condition data - Daytime visibility of road markings
Slow speed measurement methods 5.6.1
EN 1436 describes the methods for measuring Qd and β. The method for assessing Qd requires the use of a photometer, a photometric sphere and a light source (Figure 48). However, multi-function instruments which are primarily retroreflectometers for the measurement of the RL, but with secondary illumination systems for measuring Qd are available (Figure 49). EN 1436 (Annex A) provides details of the methodology and testing requirements.
Alternatively, day-time visibility can be measured using the Luminance factor method. The prescribed method (EN 1436, Annex C) employs a photometer; and a number of commercially available systems are available. However the standard notes that for some types of road markings the luminance factor is not a reliable measure. The UK’s TD 26/07 does not specify an objective methodology for assessing the daytime visibility performance of road markings. In the same respect, it does not provide a method to assess the daytime visibility of studs in terms of Qd and β. However it does provide a general method for assessing the condition of studs: if more than one of ten consecutive studs show signs of damage (such as: wear, corrosion, damage, sinkage/settlement, detritus on lenses, loss of retroreflective lenses, and loss of adhesion or breaking up) then the studs should be replaced within three months of notification.
Figure 48: Hand-held reflectometer for the measurement of Qd
Figure 49: Hand-held reflectometer for the measurement of RL and Qd

CEDR Call 2014: Asset Management and Maintenance
Page 80 of 115
Traffic Speed measurements 5.6.1
Objective measurements of the day-time visibility can potentially be provided at traffic speed using a retroreflectometer. However, the development of this technology can be considered as “emerging”, as no adopted routine approach was identified in the review.
Whilst the mobile devices can’t measure the day-time visibility at traffic speed, they can provide information about the daylight contrast. Daylight contrast is often reported as the ratio between the light reflected from the line and the light reflected from the road either side of the line. For example Daylight contrast = 2 means that the line is twice as bright as the road. More specifically, the grey level of the road line is twice the grey level of the road surface.
Figure 50: Day-light contrast measurement using LTL-M retroreflectometer

CEDR Call 2014: Asset Management and Maintenance
Page 81 of 115
5.7 Key Condition data - Wear of road markings and studs
Slow speed measurement methods 5.7.1
For markings, wear assessment is typically carried out via the use of a walked or slowly driven visual inspection in which the visual appearance is compared to a reference to apply a condition score (Figure 51). The wear of road markings, measured using a manual scoring system with reference to photographic examples, is quite subjective. It is also difficult to apply specific (e.g. numerical) thresholds in the assessment. As a result the different condition classes don’t provide information on the percentage of wear (Figure 52). The collection of images, followed by automated analysis offers the potential to make this more objective, and to be undertaken at traffic speed, as discussed in the following section.
Figure 51: Scoring system for assessing road marking wear
Scoring System – Photographic Examples (TD 26/07, Annex C & D)
0
(Non-existent)
1
(Barely Visibly)
2
(Visible, but has bare spots and low nigh-time conspicuity characteristic)
3
(Marginal, some visible wear and/or fair night-time conspicuity characteristic)
4
(Good night-time conspicuity and very little wear)
5
(Good night-time conspicuity and no wear)

CEDR Call 2014: Asset Management and Maintenance
Page 82 of 115
Good condition Bad condition
Figure 52: Example for scoring system for assessing road marking wear 14
Traffic-speed measurement methods 5.7.1
The assessment of wear at traffic speed should be achievable using the collection of images of road markings, followed by automated image analysis (Figure 53). Previous research has been carried out in this area as discussed in Case Study 10 and Case Study 11. In the research algorithms are applied to assess the loss of marking material (i.e. the wear) and, shape-based and pixel-based ground truth can be used to validate the algorithms. The case studies show that automatic image analysis has potential to measure this parameter.
It is clear that the use of image analysis has potential to provide network level assessment of wear. However, the research to date is inconclusive and incomplete. More investigation is clearly needed to develop and validate the method. This could include further work on the algorithms themselves, or work on the approach to quantify the wear once image analysis has been applied – e.g. the development of a catalogue with limit values and a scoring
14
Condition of road markings rating, original Title: Tiemerkintöjen kuntoluokitu, 2015

CEDR Call 2014: Asset Management and Maintenance
Page 83 of 115
system (for example: “wear under 10%”). Additionally, there may be potential to use laser based methods, such as LiDAR to detect and extract road markings and to determine wear.
Figure 53: Measurement of wear assessment of road marking by automatic image analysis
Case Study 10: Generator of Road Marking Textures and associated Ground Truth - Applied to the evaluation of road marking detection
15
The objective of this case study is to present a solution to generate realistic road marking textures based on natural bitumen texture, in order to build simulated video sequences. This process takes into account the road marking shape and a set of different types of wear identified by prior research on road markings wear. The result of this process is both an estimate of road marking texture and their associated ground reference.
Most efficient algorithms are based on variations in local grey level. They process each line of the images independently and detect black-white-black transition. The width of the transition for a line is computed as the projection of the road marking width from a top view to the frame view.
Road marking is characterized by both structural information (continue or discontinue shape, width of the marking) and textural information (different wear and techniques for painting application).
The whole process is divided into two stages.
Figure 54: Road marking feature extraction
The first stage consists of the generation of a binary mask that corresponds to the desired shape. The mask is used in order to set the positioning of road marking textures. The second stage is more challenging, because the goal is to generate a realistic road marking with different states of wears.
15
Revilloud Marc, Gruyer Dominique, Pollard Evangeline, : Generator of Road Marking Textures and associated Ground Truth - Applied to the evaluation of road marking detection, 2012

CEDR Call 2014: Asset Management and Maintenance
Page 84 of 115
Two types of degradations cause disappearance of road surface marking: tear out and cracking (Figure 55)
Figure 55: Tear out (a) and Cracking (b)
Perlin noise is usually used in computer graphics in order to build a multidimensional noise. It is based on a sum of several signals (oct: number of signals) at different frequencies (freq) weighted according to a persistence criterion (pers). By using this 2D Perlin noise in the interval [-1, 1] with an additional threshold (th), the texture as shown in Figure 59 is obtained. This threshold keeps the pixel value if lower than a fixed value. As shown in Figure 59, when the Perlin noise is below the threshold, the road marking pixel is removed.
Figure 56: Texture of bitumen with road marking
Figure 57: Old road marking with time wear
Figure 58: Examples of road marking generation
Figure 59: (a) Perlin noise (oct = 6, pers = 0.66, freq = 1) (b) Generated ground truth associate ( = -0.7)
Texture degradations on road marking can be classified into three parts: the impact of bitumen, the dirt and the uniform wear. Two types of uniform wear can be enumerated: the more current one leads to road marking disappearance and the second one is due to paint penetration in the bitumen. The first type of wear occurs on top of gravel as shown in Figure 56. The second one occurs between inter-gravel spaces as shown in Figure 57.
The proposed uniform wear model is rather simple and efficient. It is based on the idea that the bitumen is monochrome. As a consequence, higher pixel values reflect more light than lowers ones. So, top of gravels is clear, and space between gravels is dark. Accordingly, a pixel below the low threshold (Lth) or above the high threshold (Hth) on texture gray level will be replaced by the corresponding pixel in the bitumen texture. The result of this process (implementation of filters) is a set of “shape-based” and “pixel-based” ground truth images with associated road marking textures
A generic tool was proposed for road marking generation dedicated to the traffic lanes. This tool is based on the use of natural bitumen textures. It takes into account both the type of traffic lanes and its wear. It also provides a shape-based and pixel-based ground truth that allows validating algorithms of road marking extraction.

CEDR Call 2014: Asset Management and Maintenance
Page 85 of 115
Case Study 11: Research on the use of traffic-speed images to assess marking erosion
Research into how road marking erosion can be measured was carried out by Birmingham University
16. This research showed that it was possible to collect images of the road surface at traffic
speed that were of good enough quality to enable assessment of marking erosion.
Sub-image thresholding was used to identify road markings within each image and then Post-Segmentation Filtering was applied to reduce the amount of noise seen within the images. Once the edges of a road marking had been identified in an image (using inertia analysis), it was then shown that it was possible to calculate the wear or the erosion present by thresholding the pixel values in the images to determine whether each pixel contained a good quality part of the road marking, or whether the marking was worn.
5.8 Key Condition Data - Skid Resistance of road markings
Slow speed measurement methods 5.8.1
The measurement of the skid resistance of road marking is usually undertaken using the standard swinging pendulum apparatus (Figure 60). The inspection requires that several measurements are taken over the selected length to realise a representative SRT value. Measurements should also be made on the most heavily trafficked areas.
Figure 60: Measuring the Skid Resistance of road markings with portable Skid Resistance Tester
Traffic speed measurement methods 5.8.2
The review did not identify any routine methods to measure the skid resistance at traffic speed, and hence the network level. The measurement is difficult to make as it requires the traffic speed device to occupy two lanes so that the marking can be measured. Also the
16
M.P.N. Burrows, H.T.Evdorides and M.S.Snaith (2002): “Road marking assessment using digital image analysis”. Proceedings of the Institution of Civil Engineers Transport 141, May 2002 pp107-112

CEDR Call 2014: Asset Management and Maintenance
Page 86 of 115
driving line must be precise so that the line is covered. However, the measurement can be carried out and research has shown a good correlation between these mobile and static measurements (Case Study 12 and Case Study 13). Therefore it would be feasible to collect the data over long lengths if essential to an asset management regime.
However, further research in the UK considered this problem from a different viewpoint. The UK research investigated whether a relationship could be established between other measurements of road marking performance (night-time visibility) and skid resistance (Case Study 14). The UK research found that the skid resistance tended to remain at an acceptable level on longitudinal markings while the night-time visibility was also acceptable. This suggested that, provided that the marking was maintained at a high level of night-time visibility, it could be assumed that the friction was acceptable. This offers the potential to manage skid resistance risks without the need to undertake network level assessments of skid resistance. However, this is the result of a single study only.
Case Study 12: Dynamic measurement of the Skid resistance of road markings17
The aim of this research project was to identify suitable continuous measuring methods for the continuous evaluation of the skid resistance of road markings and derive possible connections between these continuous methods and the results of the skid-resistance-tester (SRT). The continuous measuring systems were: GripTester, ViaFriction and SKM. Three different marking materials (paint, cold plastic and foil) with different levels of skid resistance were investigated.
The results shown that the continuous measurement systems included in the tests basically proved to be suitable for the continuous measurement of the skid resistance of road markings. However, the work recommended that, for robust measurements, data on the continuous evaluation of the skid resistance of road markings should be used in addition to the skid-resistance-tester. It was also recommended to enlarge the basic database by observing further marking materials and additional skid resistance levels.
ViaFriction
SKM measuring system
GripTester
17
Bernhard Steinauer, Markus Oeser, Dirk Kemper, Andreas Schacht - Dynamische Messung der Grifigkeit von Fahrbahnmarkierungen, 2014

CEDR Call 2014: Asset Management and Maintenance
Page 87 of 115
Case Study 13: Measurement of friction of road markings. Comparison of different methods and the development of a model for mobile measurement
18
This case study describes the results from two studies about methods for mobile assessment or estimation of road marking friction. In the first study, three different mobile methods, Road Friction Tester (RFT), Traction Watcher One (TWO) and Road Marking Tester (RMT), were compared to the handheld method Portable Friction Tester (PFT). In the second study, a prediction model for friction in higher speeds was developed, based on measurements of the coefficient of retroreflected luminance and the texture of the road marking. The first study showed that the different methods give different results, which is expected since the physical quantity coefficient of friction does not have a unique definition but is dependent on the properties of the instrument. In lower speeds, there were significant relationships between PFT and RFT, and between PFT and TWO (correlation coefficient 0,89 and 0,86, respectively). The relationships between PFT and RMT were somewhat weaker, although significant (correlation coefficients 0,65–0,71). In higher speeds, there was a significant relationship between RFT and TWO (correlation coefficient 0,80). The relationships between RMT and RFT, and between RMT and TWO, were weaker but significant (correlation coefficients 0,86–0,89). TWO gave lower friction values than the other methods. Measurement speed had an influence on the results obtained with RFT and TWO.
In the second study, TWO was used as a reference when developing a prediction model for friction in higher speeds. The results showed that friction to some extent can be predicted from the coefficient of retroreflected luminance and the texture of the marking, but that the relationship is not strong enough for the model to be applicable. A limitation of the study is that there is no standardized method for measurement of road marking friction in higher speeds available. The reference method used, TWO, is developed for friction assessment of road surfaces and not for road markings, which implies that the ability of the instrument to assess road marking friction is somewhat uncertain.
Figure 61: Portable Friction Tester, PFT. Photo: Mohammad-Reza Yahya, VTI.
Figure 62: Sample Field where the measurements were made. Photo: Mohammad Reza Yahya, VTI.
The markings are laid out in seven tracks where the mark on the hard shoulder is called Track 1 and the mark closest to the centre line termed groove 7.
18 Carina Fors, Sven-Olof Lundkvist - Measurement of friction of road marking - Comparison of different methods and the development of a model for mobile measurement (original title: Mätning av friktion på vägmarkering. Jämförelse av olika metoder samt utveckling av modell för mobil mätning), 2016

CEDR Call 2014: Asset Management and Maintenance
Page 88 of 115
Figure 63: Traction Watcher One (TWO)
Photo: Carina Fors, VTI.
Figure 64: Road Marking Tester (RMT)

CEDR Call 2014: Asset Management and Maintenance
Page 89 of 115
Case Study 14: Managing skid resistance via the measurement of retroreflectivity19
In the UK, road markings are typically made from thermoplastic materials as they are often considered as the most durable of the commonly used types of white line material. Thermoplastic markings usually contain five ingredients: binder, anti-skid aggregate, glass beads, titanium dioxide and calcium carbonate.
Measurements of retro-reflectivity, luminance factor and skid resistance on thermoplastic lines on the M3, M4 and M25 motorways were compared, to see if any correlation existed. The measurements focussed on the dashed white lines used to separate the traffic lanes, with the condition of the lines ranging from “new” to “almost non-existent”.
A relationship with skid resistance was identified for both retro-reflectivity and luminance factor, with skid resistance decreasing with increasing retro-reflectivity or luminance. It was found that there was a more obvious linear relationship between luminance factor and skid resistance (Figure 66) than that between skid resistance and retro-reflectivity (Figure 65). These relationships were also found during accelerated tests carried out in lab conditions, which simulated wear of road markings over a 2 year period.
Thus it was shown that it might be possible to estimate the skid resistance of thermoplastic markings from measures of retro-reflectivity or luminance factor.
Figure 65: Skid resistance and retro-reflectivity measurements on broken white lines
Figure 66: Skid resistance and luminance factor measurements on broken white lines
Green diamonds in the graphs above represent measurements made on the M3, whilst red diamonds are measurements on the M4 and blue diamonds, those from the M25. The thresholds for skid resistance and retro-reflectivity (TD 26/07, 2007) are also shown on the graphs.
Although case studies have been presented on potential methods to measure the skid resistance of road markings with mobile systems, the results have shown that there is no mobile system that can fully replace the SRT method. The mobile methods work well, but they don’t provide sufficient accuracy to meet the standards. The proposed models to predict friction at traffic speed are also not good enough to be useful in practice, and the proxy approach (using retroreflectivity), has had limited investigation. Hence, there is a need for more large-scale investigations using different devices to measure the skid resistance and retroreflectivity at traffic speed to help identify a potential mobile system, prediction model or proxy methodology.
19
Dhillon N. (2007): “The skid resistance of road markings”. TRL Unpublished Project Report UPR.IE.169/07.

CEDR Call 2014: Asset Management and Maintenance
Page 90 of 115
6 Definitions
The following subsections list the technical terms to be used, along with the definitions of the terms as they will be used within the PREMiUM project.
Coefficient of Luminance: The quotient of the luminance of the field of the road marking in the given direction by the illuminance on the field.
Coefficient of Retroreflection: the ratio between the luminance of the surface to the normal illuminance on the surface.
Chromaticity Coordinates: Colour coordinate values identify the location on the standard chromaticity space diagram.
Date of Construction: The time and date the works began and the completion date.
Dates/Details of Maintenance: The time and dates maintenance works were carried out, alongside the contractors report.
Dates/Details of Last Inspection: The time and dates previous inspections took place, with access or reference to a copy of the final inspection report.
Daytime Visibility: A measure of the road markings and stud conspicuity under daylight and road lighting conditions.
Luminance Factor: The ratio of the luminance of the field of the road marking in the given direction to that of a perfect reflecting diffuser identically illuminated
Marking/Stud Details: The information provided by the road marking/stud manufacturer. This includes: class, dimensions, colour, material, load capacity, reflective distance.
National Road Authority (NRA): The state body responsible for the management of national motorways, and strategic dual and single carriageways. In this study NRAs also include local authorities and private road operators who have responsibility for large amounts of a strategic network.
Night-Time Visibility: For markings and studs night-time visibility is a measure of brightness during the night-time. The photometric requirements for rod markings are expressed by their coefficient of retroreflected luminance, RL (mcd.m-2.lx-1). The photometric requirements for studs are expressed by their coefficient of luminous intensity, R (mcd.lx-1).
Retroreflection: Retroreflection is when the light emitted from a vehicle’s headlamp (or from other sources) strikes a surface (i.e. road marking or stud) and then a large proportion of that light is reflected directly back to the original source.
Skid Resistance Value: skid resistance quality of a wet surface measured by the friction at low speed of a rubber slider upon this surface.
Slow speed survey: A slow speed survey is any survey that cannot be performed at traffic speed e.g. manual or in-situ surveys.
Traffic speed survey: A traffic speed or high speed survey is performed at, or slightly below prevailing traffic speeds and, in general, does not require traffic management or road closures to perform. For example, a traffic speed survey on a motorway might be performed at speeds of 80km/h or at 45km/h on a residential road.
Type of Marking: There are two types of road markings found on strategic networks: Carriageway (placed at junctions to indicate priorities, directional arrows, centre or lane lines indicating the best line for the vehicle to travel along); Continuous (Typically centre lines indicating areas that must not be crossed – i.e. to prevent overtaking and lane delimiting

CEDR Call 2014: Asset Management and Maintenance
Page 91 of 115
lines). These markings may be solid or dashed and can also have different profiles, such as textured and uniform
Type of Stud: There are a number of different studs found on the strategic network such as: depressible and non-depressible studs; glass or plastic reflectors. They can also vary in colour (red, white, amber, and green).
7 Sources
Casse C. & C Van Geem (2012): HeRoad Deliverable 3.1 “Equipment performance assessment”.
EN 1423:2012 Road Marking Materials - Drop on Materials. Glass beads, Antiskid Aggregates and Mixtures of the Two. Brussels, Belgium: Comité Européen de Normalisation
EN 1424:1998. Road Marking Materials - Premix Glass Beads. Brussels, Belgium: Comité Européen de Normalisation
EN 1436:2007+A1:2008. Road Marking Materials – Road Marking Performance for Road Users. Brussels, Belgium: Comité Européen de Normalisation
EN 1463-1:2009. Road Marking Materials – Retroreflecting Road Studs – Part 1: Initial Performance Requirements. Brussels, Belgium: Comité Européen de Normalisation
EN 1463-2:2000. Road marking Materials – Retroreflecting Road Studs – Part 2: Road Test Performance Specifications. Brussels, Belgium: Comité Européen de Normalisation
EN 1790:2013. Road Marking Materials - Preformed Road Markings. Brussels, Belgium: Comité Européen de Normalisation
EN 1824:2011. Road Marking Materials - Road trials. Brussels, Belgium: Comité Européen de Normalisation
EN 1871:2000. Road Marking Materials - Physical Properties. Brussels, Belgium: Comité Européen de Normalisation
MUTCD (2009): Manual on Uniform Traffic Control Devices for Streets and Highways. 2009 Edition including Revision 1 dated May 2012 and Revision 2 dated May 2012.
NCHRP Synthesis 306: Long-term pavement marking practices. A Synthesis of Highway Practice. Transportation Research Board.
NMM Part 3: Highways England (2009) Network Management Manual – Part 3: Routine Service. Available at: http://www.standardsforhighways.co.uk/ha/standards/nmm_rwsc/docs/nmm_part_3.pdf
NMM Part 2: Highways England (2009) Network Management Manual – Part 2: Routine Service Asset Management Records. Available at: http://www.standardsforhighways.co.uk/ha/standards/nmm_rwsc/docs/nmm_part_2.pdf
ONR 22441 (2008) Guidelines for the Specification of Pavement Markings and Road Marking Materials
RVS 05.03.11 (2009) Traffic Control – Road Markings: Training and Application of Road Markings Standaardbestek 250
TD26/07: DMRB Volume 8, Section 2, Part 2: TD 26/07 – “Inspection and Maintenance of Road Markings and Road Studs on Motorways and All-Purpose Trunk Roads”. Available at: http://www.standardsforhighways.co.uk/dmrb/vol8/section2/td2607.pdf

CEDR Call 2014: Asset Management and Maintenance
Page 92 of 115
Roland Spielhofer (2014): “Monitoring of Road Inventory”. TRIMM Deliverable 4.2. Available http://trimm.fehrl.org/?m=3&id_directory=7539
ZTV M13 (2015) Manual and Review for Markings on Roads

CEDR Call 2014: Asset Management and Maintenance
Page 93 of 115
Appendix A: NRA Questionnaire

Page 94 of 115
Stakeholder consultation
Introduction to the PREMiUM project
PREMiUM (Practical Road Equipment Measurement Understanding and Management) has been let under the CEDR 2014 call for Asset Management and Maintenance and is being funded by the National Road Authorities in Austria, Belgium (Flanders), Finland, Germany, Ireland, Netherlands, Norway, Sweden and UK. It is a 2 year project that commenced in October 2015.
Compared to the management of pavement and bridge/structures assets, the approach to the management of road equipment assets is less well developed. Inspections are often carried out of these assets but the approaches to inspection regimes and the inspection methods vary e.g. regular condition assessment surveys versus replacement based on life expectancy with monitoring undertaken during safety inspections (which focus only on damage and failures that impact the safety of the road user). The inspections are often manual visual assessments, although there are examples of traffic-speed survey methods in some countries for the assessment of, for example, the visibility of road markings.
Even where a regime exists for the collection of information on equipment assets there is then a need to consider how this information is managed by a road authority. Many national authorities now operate powerful asset management systems, which allow data to be collated on road assets. Again, in comparison with road pavements, there is evidence of significant gaps in this area for road equipment.
Finally, where data do exist, and are accessible to the road owner, there is a need to be able to analyse and interpret this information to determine condition, identify maintenance needs and prioritise maintenance. For the equipment asset types under consideration in this work there is a range of experience in the application of analysis and interpretation methods that could allow the asset to be understood at the network level. Through the development of suitably focussed regimes and the development of appropriate indicators, there is potential to improve the ability to manage these assets
We envisage that the PREMiUM project will help road administrations to establish a maintenance regime that minimises the risk of failure of the asset and yet enables the road administration to focus maintenance expenditure on these assets in an efficient manner.
We have established a project team that includes representatives from the UK, Austria, Belgium, Ireland and Sweden. To help ensure our project outputs are relevant and focussed we are also trying to establish a “PREMiUM Reference Group” containing stakeholders from National Road Authorities; equipment manufacturers and users; researchers and users of the data.
The purpose of this questionnaire is to determine what asset properties you feel are important to know about, in order to assess asset condition, for the following assets:
Road markings and studs
Road signs
Noise barriers
Vehicle restraint systems.
We would then like to know what surveys are carried out currently, whether these are on a scheme/project level, or whether they are performed at network level. We are also seeking to know what equipment is used for monitoring, what is measured; what data is delivered, and how this data is then used to assess condition.
We will use the information, provided by stakeholders, to identify the key aspects that need to be monitored, how these key aspects can be monitored at a network level, and how the data can be translated into the information required to determine the condition.

Page 95 of 115
Stakeholder details
Organisation…………………………………………………………………………………………………………………………………………
Country in which organisation based……………………………………………………………………………………………………
Contact person: …………………………………………………………………………………………………………………………………
Function/job title: ……………………………………………………………………………………………………………………………….
Email: …………………………………………………………………………………………………………………………………………………..
In order to fully understand the answers given to the questionnaire, we may wish to conduct a short follow up interview, conducted via ‘phone. If you would be willing to participate in this, please provide your telephone number:……………………………………………………………………………………………………….. (Note that you will be asked via email for a convenient time to conduct this interview).
Definitions
Network level monitoring/surveys:
A network level survey or monitoring regime provides data for each length of asset or each individual asset on the road network. This may be achieved in just one year, or it may be organised over a number of years.
Noise Barrier A noise barrier is a structure, usually erected at the side of a carriageway, designed to reduce the noise level experienced by neighbouring properties.
Project level surveys A project or scheme level survey provides detailed data for a specific length (or lengths) on the road network. Project level surveys are usually performed when a need for maintenance has been identified, or where a network level survey has suggested that further investigation is requirement.
Road marking
A road marking is any kind of device or material that is used on a road surface in order to convey official information. They can be used to delineate traffic lanes, inform motorists and pedestrians or serve as noise generators when run across a road (rumble strips), or attempt to wake a sleeping driver when installed in the shoulders of a road. Road surface markings can also indicate regulation for parking and stopping.
Centre lines are the most common forms of road markings, providing separation between traffic moving in opposite directions, or between traffic moving in separate lanes. In PREMiUM, we will only be considering lane separating markings.
Retroreflective road stud
A road stud is a safety device used on roads, usually made with plastic, ceramic, thermoplastic paint or occasionally metal, and come in a variety of shapes and colours. Retroreflective studs include a lens or sheeting that enhances their visibility by reflecting vehicle headlights.

Page 96 of 115
Vehicle Restraint System
A vehicle restraint system is a structure, usually fixed at the side of a carriageway, designed to prevent vehicles from leaving the carriageway
Road network
Question Answer
1
What is the approximate length of your road network, split by road type (e.g. motorway, strategic dual carriageway, strategic single carriageway)?
Please answer the questions below for the assets for which you have knowledge. For those for which you don’t have knowledge, please can you suggest who we might contact, who may be able to answer the questions, or please ask them directly.

Page 97 of 115
Road Markings and Studs
Knowledge of Assets
Question Answer
2 What is the approximate length of your network for which road markings are present?
3 What is the approximate length of your network for which retroreflective studs are present?
Current Approach to Monitoring and Maintaining Assets and Asset Management
In this section of the questionnaire, we would like to find out whether monitoring of the assets’ condition is carried out, and if it is what asset properties are monitored and how they’re monitored. We would also like to know, if monitoring is not carried out, why it is not e.g. it is cheaper just to replace road markings every 3 years on a rolling basis than to monitor them and only replace those that are inadequate.
We are also seeking to find out how the assets are managed and what maintenance methods are applied to the assets and what triggers this maintenance e.g. asset age, measured condition.
Question Answer
4
What is your general approach to managing and understanding the condition of road markings (lane separating lines) and studs? For example
Do you have a clear view of the status of all assets i.e. a regular monitoring regime?
Do you perform ad hoc repairs if something goes wrong (is there a reporting system - details?)?
Is the approach based on age of the asset?
5
Where you have a monitoring regime, what does this measure and what methodology do you use? E.g.
Measurement of retroreflectivity using retroreflectometer (hand held or attached to a vehicle travelling at traffic speed)
Measurement of wear or corrosion.
6
Where you do not have a regime, do you feel there is a need for condition monitoring to map the state of these assets? If not, please tell us why not (e.g. the condition cannot be measured, regular replacement removes the need for monitoring).
7
Do you use an asset management system for managing road markings and studs (maintenance planning and forecasting budgets)?

Page 98 of 115
8 What methods of maintenance are applied to road markings and studs e.g. replacement, cleaning?
9
How do you decide if a road marking or stud requires each type of maintenance method listed in Q8? I.e. on what criteria are maintenance / repair decisions made: Is the decision based on e.g. the asset’s age, its measured condition etc.? Please give details.
10
If the maintenance is based on measured condition, are thresholds applied to the measurements?
If so are these thresholds defined in a standard or just within your organisation?
11
Do you combine different types of measurements, to make a decision on maintenance e.g. combine measurements of marking retro-reflectivity and wear?
Monitoring Assets at a network level
We have reviewed the standards relating to road markings and studs and have identified a number of properties that might be used for condition assessment. These are listed in the following tables. Please indicate whether any of these measures are currently monitored for your road network. We are particularly interested in whether the measures can be monitored at a network level or not, so please indicate whether the monitoring is carried out by slow speed surveys e.g. manual inspection of road signs, push-pull test for the posts of vehicle restraint systems, or whether they could be achieved at high speed e.g. from a vehicle travelling at traffic speed.
We would then like to know which asset properties are considered to be most important to determine their condition, so please indicate this in the “Level of importance” column by rating each property as either:
High importance – essential information to have for all assets on the network;
Medium importance – quite useful to have this information ; or
Low importance – nice to have but not essential information.
Property Characteristic
Is this measured or
recorded?
(Yes/No)
How is it measured?
(Type of instrument/test
method)
What level of importance would you assign to this characteristic for
assessment of condition?
(Low, Medium, High)
Inventory
Location e.g. start/end chainage (m), section label, marker post, GPS, spacing/gap, length, direction, etc.
Type of marking/stud

Page 99 of 115
Inventory
Road Markings Details - e.g. dimensions, class, colour, material, etc.
Date of Construction
Date of Last Inspection
Dates and details of maintenance
Other (please give details)
Visibility
Night-time visibility (e.g. proportion of light reflected back to light source)
Day-time visibility (e.g. Luminance Coefficient under Diffuse Illumination, brightness (Luminous Intensity) of a surface in a given direction per unit area, ratio of the luminance of the marking or stud to that of a perfect diffuser)
Colour (e.g. chromaticity co-ordinates)
Wear Index (e.g. amount of erosion)
Other (please give details)
Durability
Skid Resistance
Removability – e.g. ease of removing the line/stud
Hiding Power of Paint – e.g. a measure of the paint’s ability to obscure a background of contrasting colour
UV Ageing of the Paint
Resistance to UV Exposure
Rate of Degradation
Other (please give details)
Novel techniques for
measuring condition
What “novel” methods, i.e. not covered by existing standards, for measuring conditions have you tried on a project level? Were you satisfied with the results? Do you see the potential to use this method on network level?

Page 100 of 115
Road Signs
Knowledge of Assets
Question Answer
12 Roughly how many road signs do you have on your network?
Current Approach to Monitoring and Maintaining Assets and Asset Management
In this section of the questionnaire, we would like to find out whether monitoring of the assets’ condition is carried out, and if it is what asset properties are monitored and how they’re monitored. We would also like to know, if monitoring is not carried out, why it is not e.g. it is cheaper just to replace road markings every 3 years on a rolling basis than to monitor them and only replace those that are inadequate.
We are also seeking to find out how the assets are managed and what maintenance methods are applied to the assets and what triggers this maintenance e.g. asset age, measured condition.
Question Answer
13
What is your general approach to managing and understanding the condition of road signs? For example
Do you have a clear view of the status of all assets i.e. a regular monitoring regime?
Do you perform ad hoc repairs if something goes wrong (is there a reporting system - details?)?
Is the approach based on age of the asset?
14
Where you have a monitoring regime, what does this measure and what methodology do you use? E.g.
Measurement of retroreflectivity using retroreflectometer (hand held or attached to a vehicle travelling at traffic speed)
Measurement of wear or corrosion.
Measurement of structural integrity
15
Where you do not have a regime, do you feel there is a need for condition monitoring to map the state of these assets? If not, please tell us why not (e.g. the condition cannot be measured, regular replacement removes the need for monitoring).
16 Do you use an asset management system for managing road signs (maintenance planning and forecasting budgets)?
17 What methods of maintenance are applied to road signs e.g. replacement, cleaning, rust treatment, post reinforcement?

Page 101 of 115
18
How do you decide if a road sign requires each type of maintenance method listed in Q17? I.e. on what criteria are maintenance / repair decisions made: Is the decision based on e.g. the asset’s age, its measured condition etc.? Please give details.
19
If the maintenance is based on measured condition, are thresholds applied to the measurements?
If so are these thresholds defined in a standard or just within your organisation?
20
Do you combine different types of measurements, to make a decision on maintenance e.g. combine measurements of structural integrity and corrosion?
Monitoring Assets at a network level
We have reviewed the standards relating to road signs and have identified a number of properties that might be used for condition assessment. These are listed in the following tables. Please indicate whether any of these measures are currently monitored for your road network. We are particularly interested in whether the measures can be monitored at a network level or not, so please indicate whether the monitoring is carried out by slow speed surveys e.g. manual inspection of road signs, push-pull test for the posts of vehicle restraint systems, or whether they could be achieved at high speed e.g. from a vehicle travelling at traffic speed.
We would then like to know which asset properties are considered to be most important to determine their condition, so please indicate this in the “Level of importance” column by rating each property as either:
High importance – essential information to have for all assets on the network;
Medium importance – quite useful to have this information ; or
Low importance – nice to have but not essential information.
Property Characteristic
Is this measured or
recorded?
(Yes/No)
How is it measured?
(e.g. Type of instrument/test
method)
What level of importance would you assign to this
characteristic for assessment of condition?
(Low, Medium, High)
Inventory
Location - e.g. road name, number, area, chainage, section label, GPS, etc.
Identification Code
Cleaning Interval (years)
Material Performance Class
Date of installation
Dates and details of maintenance
Other (please give details)

Page 102 of 115
Visibility
Night-time visibility of sign (e.g. – the proportion of light reflected back to light source, )
Daytime visibility of sign (e.g. the ratio of the luminance of the sign compared to that of a perfect diffuser)
Colour of sign
Minimum Clear Visibility Distance
Obstruction/Obscuration – e.g. vegetation or dirt build-up blocking clear view of sign
Damage/Loss
Vertical/Horizontal Alignment of sign panels
Other (please give details)
Durability
Resistance to Weathering
Impact Resistance
Age of Material
Other (please give details)
Structural
Foundation Condition
Missing Parts
Wind Load Deflections
Other (please give details)
Legibility
Extent of Colour Fade
Contrast between Elements
Damage/Loss of Legend
Orientation
Other (please give details)
Other data - e.g. category (warning, hazard, regulatory, etc.), diagram number, photograph number, installation date etc.
Novel techniques
for measuring condition
What “novel” methods, i.e. not covered by existing standards, for measuring conditions have you tried on a project level? Were you satisfied with the results? Do you see the potential to use this method on network level?

Page 103 of 115
Noise Barriers
Knowledge of Assets
Question Answer
21 What types of noise barriers are present on your network and what is the approximate total length for each type?
Current Approach to Monitoring and Maintaining Assets and Asset Management
In this section of the questionnaire, we would like to find out whether monitoring of the assets’ condition is carried out, and if it is what asset properties are monitored and how they’re monitored. We would also like to know, if monitoring is not carried out, why it is not e.g. it is cheaper just to replace road markings every 3 years on a rolling basis than to monitor them and only replace those that are inadequate.
We are also seeking to find out how the assets are managed and what maintenance methods are applied to the assets and what triggers this maintenance e.g. asset age, measured condition.
Question Answer
22
What is your general approach to managing and understanding the condition of noise barriers? For example
Do you have a clear view of the status of all assets i.e. a regular monitoring regime?
Do you perform ad hoc repairs if something goes wrong (is there a reporting system – details?)?
Is the approach based on age of the asset?
23
Where you have a monitoring regime, what does this measure and what methodology do you use? E.g.
Measurement of noise absorption or reflection
Measurement of wear
Measurement of structural integrity
24
Where you do not have a regime, do you feel there is a need for condition monitoring to map the state of these assets? If not, please tell us why not (e.g. the condition cannot be measured, regular replacement removes the need for monitoring).
25 Do you use an asset management system for managing noise barriers (maintenance planning and forecasting budgets)?
26 What methods of maintenance are applied to noise barriers e.g. replacement, repainting, cleaning, patching, post reinforcement?

Page 104 of 115
27
How do you decide if a noise barrier requires each type of maintenance method listed in Q26? I.e. on what criteria are maintenance / repair decisions made: Is the decision based on e.g. the asset’s age, its measured condition etc.? Please give details.
28
If the maintenance is based on measured condition, are thresholds applied to the measurements?
If so are these thresholds defined in a standard or just within your organisation?
29
Do you combine different types of measurements, to make a decision on maintenance e.g. combine measurements of structural integrity and noise absorption?
Monitoring Assets at a network level
We have reviewed the standards relating to noise barriers and have identified a number of properties that might be used for condition assessment. These are listed in the following tables. Please indicate whether any of these measures are currently monitored for your road network. We are particularly interested in whether the measures can be monitored at a network level or not, so please indicate whether the monitoring is carried out by slow speed surveys e.g. manual inspection of road signs, push-pull test for the posts of vehicle restraint systems, or whether they could be achieved at high speed e.g. from a vehicle travelling at traffic speed.
We would then like to know which asset properties are considered to be most important to determine their condition, so please indicate this in the “Level of importance” column by rating each property as either:
High importance – essential information to have for all assets on the network;
Medium importance – quite useful to have this information ; or
Low importance – nice to have but not essential information.
Property Characteristic
Is this measured or
recorded?
(Yes/No)
How is it measured?
(i.e. Type of instrument/test
method)
What level of importance would you
assign to this characteristic for
assessment of condition?
(Low, Medium, High)
Inventory
Date of Installation, Contract ID, Scheme
Acoustic Type – e.g. reflective, absorptive
Acoustic Element Composition e.g. timber, concrete, metal, composites, plastic
Geometry – e.g. height, angle
Location Data - e.g. road name, section label, start/end chainage, gps etc.

Page 105 of 115
Inventory
Manufacturer Declared Performance Characteristics
Date of Last Inspection
Physical Condition Reports
Details of Complaints Lodged
Dates and details of maintenance
Suitable as vehicle restraint system (there are combined systems).
Other (please give details)
Non-Acoustic Durability
Impact from Stones
Shatter Resistance
Long-term Non-Acoustic Performance
Other (please give details)
Structural Integrity
Resistance to Loads
Vibration & Fatigue
Other (please give details)
Visibility Light Reflectivity
Other (please give details)
Acoustic Ability
Sound Reflection
Airborne Sound Insulation
Sound Diffraction
Insertion Loss
Long-Term Acoustic Performance
Other (please give details)
Environment
Environmental Protection - e.g. environmental risk assessment
Other (please give details)
Safety
Resistance to Brushwood Fire
Impact from Collision
Maximum allowable distance between emergency exits/doors
Other (please give details)
Novel techniques for
measuring condition
What “novel” methods, i.e. methods not covered by existing standards, for measuring conditions have you tried on a project level? Were you satisfied with the results? Do you see the potential to use this method on network level?

Page 106 of 115
Vehicle Restraint Systems
Knowledge of Assets
Question Answer
30 What types of vehicle restraint systems are present on your network and what is the approximate total length for each type?
Current Approach to Monitoring and Maintaining Assets and Asset Management
In this section of the questionnaire, we would like to find out whether monitoring of the assets’ condition is carried out, and if it is what asset properties are monitored and how they’re monitored. We would also like to know, if monitoring is not carried out, why it is not e.g. it is cheaper just to replace road markings every 3 years on a rolling basis than to monitor them and only replace those that are inadequate.
We are also seeking to find out how the assets are managed and what maintenance methods are applied to the assets and what triggers this maintenance e.g. asset age, measured condition.
Question Answer
31
What is your general approach to managing and understanding the condition of vehicle restraint systems? For example
Do you have a clear view of the status of all assets i.e. a regular monitoring regime?
Do you perform ad hoc repairs if something goes wrong (is there a reporting system – details?)?
Is the approach based on age of the asset?
32
Where you have a monitoring regime, what does this measure and what methodology do you use? E.g.
Measurement of wear or corrosion (slow speed or traffic speed test).
Measurement of height
Measurement of structural integrity
33
Where you do not have a regime, do you feel there is a need for condition monitoring to map the state of these assets? If not, please tell us why not (e.g. the condition cannot be measured, regular replacement removes the need for monitoring).
34
Do you use an asset management system for managing vehicle restraint systems (maintenance planning and forecasting budgets)?
35 What methods of maintenance are applied to restraint system e.g. replacement, repainting, cleaning, patching, post reinforcement?

Page 107 of 115
36
How do you decide if a restraint system requires each type of maintenance method listed in Q35? I.e. on what criteria are maintenance / repair decisions made: Is the decision based on e.g. the asset’s age, its measured condition etc.? Please give details.
37
If the maintenance is based on measured condition, are thresholds applied to the measurements?
If so are these thresholds defined in a standard or just within your organisation?
38
Do you combine different types of measurements, to make a decision on maintenance e.g. combine measurements of structural integrity and corrosion?
Monitoring Assets at a network level
We have reviewed the standards relating to vehicle restraint systems and have identified a number of properties that might be used for condition assessment. These are listed in the following tables. Please indicate whether any of these measures are currently monitored for your road network. We are particularly interested in whether the measures can be monitored at a network level or not, so please indicate whether the monitoring is carried out by slow speed surveys e.g. manual inspection of road signs, push-pull test for the posts of vehicle restraint systems, or whether they could be achieved at high speed e.g. from a vehicle travelling at traffic speed.
We would then like to know which asset properties are considered to be most important to determine their condition, so please indicate this in the “Level of importance” column by rating each property as either:
High importance – essential information to have for all assets on the network;
Medium importance – quite useful to have this information ; or
Low importance – nice to have but not essential information.
Property Characteristic
Is this measured or
recorded? (Yes/No)
How is it measured? (i.e. Type of
instrument/test method)
What level of importance would you
assign to this characteristic assessment of
condition? (Low, Medium, High)
Inventory
Asset Number, Road Number, Location, GPS
Description (type & shape of beam, containment level), Length
Date of Last/Next Inspection
Date of installation
Dates and details of maintenance
Other (please give details)

Page 108 of 115
Durability
Presence of corrosion/rust
Presence of damage
Other (please give details)
Structural
Post Stability
Presence and condition of fixings (Connections, Bolts, Caps, lap screws)
Beam Alignment/Overlap
Orientation (Post/Beams) - e.g. posts fitted & beam overlap follow the direction of travel
Ground Bearing Capacity
Impact Acceptance
Other (please give details)
Clearance
Mounting Height - e.g. height from ground level to middle of barrier beam
Setback Distance - e.g. lateral distance between face of barrier and the roadside.
Working Widths - e.g. distance between traffic and side of the barrier before impact and maximum lateral position after impact
Minimum Barrier Length (Approach/Departure Lengths to/from object that barrier is protecting
Other (please give details)
Placement Proximity to Hazards - e.g. laybys, bus stops, roundabouts, slip roads, water sources, etc.
Novel techniques for
measuring condition
What “novel” methods, i.e. methods not covered by existing standards, for measuring conditions have you tried on a project level?
Were you satisfied with the results?
Do you see the potential to use this method on network level?

CEDR Call 2014: Asset Management and Maintenance
Page 109 of 115
Appendix B: Survey Provider Questionnaire

Page 110 of 115
Stakeholder consultation
Introduction to the PREMiUM project PREMiUM (Practical Road Equipment Measurement Understanding and Management) has been let under the CEDR 2014 call for Asset Management and Maintenance and is being funded by the National Road Authorities in Austria, Belgium (Flanders), Finland, Germany, Ireland, Netherlands, Norway, Sweden and UK. It is a 2 year project that commenced in October 2015.
Compared to the management of pavement and bridge/structures assets, the approach to the management of road equipment assets is less well developed. Inspections are often carried out of these assets but the approaches to inspection regimes and the inspection methods vary e.g. regular condition assessment surveys versus replacement based on life expectancy with monitoring undertaken during safety inspections (which focus only on damage and failures that impact the safety of the road user). The inspections are often manual visual assessments, although there are examples of traffic-speed survey methods in some countries for the assessment of, for example, the visibility of road markings.
Even where a regime exists for the collection of information on equipment assets there is then a need to consider how this information is managed by a road authority. Many national authorities now operate powerful asset management systems, which allow data to be collated on road assets. Again, in comparison with road pavements, there is evidence of significant gaps in this area for road equipment.
Finally, where data do exist, and are accessible to the road owner, there is a need to be able to analyse and interpret this information to determine condition, identify maintenance needs and prioritise maintenance. For the equipment asset types under consideration in this work there is a range of experience in the application of analysis and interpretation methods that could allow the asset to be understood at the network level. Through the development of suitably focussed regimes and the development of appropriate indicators, there is potential to improve the ability to manage these assets
We envisage that the PREMiUM project will help road administrations to establish a maintenance regime that minimises the risk of failure of the asset and yet enables the road administration to focus maintenance expenditure on these assets in an efficient manner.
We have established a project team that includes representatives from the UK, Austria, Belgium, Ireland and Sweden. To help ensure our project outputs are relevant and focussed we are also trying to establish a “PREMiUM Reference Group” containing stakeholders from National Road Authorities; equipment manufacturers and users; researchers and users of the data.
The purpose of this questionnaire is to determine what asset properties you feel are important to know about, in order to assess asset condition, for the following assets:
Road markings and studs
Road signs
Noise barriers
Vehicle restraint systems.
We would then like to know what surveys are carried out currently, whether these are on a scheme/project level, or whether they are performed at network level. We are also seeking to know what equipment is used for monitoring, what is measured; what data is delivered, and how this data is then used to assess condition.
We will use the information, provided by stakeholders, to identify the key characteristics that need to be monitored, how these key characteristics can be monitored at a network level, and how the data can be translated into the information required to determine the condition.

Page 111 of 115
Stakeholder details
Organisation…………………………………………………………………………………………………………………………………………
Country in which organisation based……………………………………………………………………………………………………
Contact person: …………………………………………………………………………………………………………………………………
Function/job title: ……………………………………………………………………………………………………………………………….
Email: …………………………………………………………………………………………………………………………………………………..
In order to fully understand the answers given to the questionnaire, we may wish to conduct a short follow up interview, conducted via ‘phone. If you would be willing to participate in this, please provide your telephone number:……………………………………………………………………………………………………….. (Note that you will be asked via email for a convenient time to conduct this interview).
Definitions
Network level monitoring/surveys:
A network level survey or monitoring regime provides data for each length of asset or each individual asset on the road network. This may be achieved in just one year, or it may be organised over a number of years.
Noise Barrier A noise barrier is a structure, usually erected at the side of a carriageway, designed to reduce the noise level experienced by neighbouring properties.
Project level surveys A project or scheme level survey provides detailed data for a specific length (or lengths) on the road network. Project level surveys are usually performed when a need for maintenance has been identified, or where a network level survey has suggested that further investigation is requirement.
Road marking A road marking is any kind of device or material that is used on a road surface in order to convey official information. They can be used to delineate traffic lanes, inform motorists and pedestrians or serve as noise generators when run across a road (rumble strips), or attempt to wake a sleeping driver when installed in the shoulders of a road. Road surface markings can also indicate regulation for parking and stopping.
Centre lines are the most common forms of road markings, providing separation between traffic moving in opposite directions, or between traffic moving in separate lanes. In PREMiUM, we will only be considering lane separating markings.
Retroreflective road stud A road stud is a safety device used on roads, usually made with plastic, ceramic, thermoplastic paint or occasionally metal, and come in a variety of shapes and colours. Retroreflective studs include a lens or sheeting that enhances their visibility by reflecting vehicle headlights.

Page 112 of 115
Vehicle Restraint System A vehicle restraint system is a structure, usually fixed at the side of a carriageway, designed to prevent vehicles from leaving the carriageway
Please answer the questions below for the assets for which you have knowledge.
General
Question Answer
1 For which road network(s) have you had or do you have a contract to provide asset surveys for?
2 For which of the four assets do you provide survey/monitoring services?
Please answer the following questions, for the assets for which you provide survey services.
Road Markings and Studs
Question Answer
3
What survey methods/techniques do you currently use to monitor the condition of road markings or studs? What measurements are recorded? Please list all methods and all relevant measurements. Please indicate whether the methods are carried out at high speed, whether they are manual etc.
4 Please indicate whether any of the slow speed survey methods listed above could be performed at traffic speed.
5
How is the inspection performed? Please describe how the condition of road markings and studs is determined? How do you define the condition of road markings and studs? (For example: Scale 1-5; Yes/No; good condition – bad condition)
6 Does the inspection take place according to a standard? If so, please provide details of this.
7 How often does inspection take place?
8
Do you register the type/position of the road markings/studs (e.g. transverse position, spacing, width, construction etc.)? If so, please provide details of this.

Page 113 of 115
Road Markings and Studs
Question Answer
9 What are the yearly costs per km for these measures?
10
Are you aware of any novel or emerging technology that could be used to provide high speed measurements of road marking or stud condition? If so, please provide details of this
Road Signs
Question Answer
11
What survey methods/techniques do you currently use to monitor the condition of road signs? What measurements are recorded?
Please list all methods and all relevant measurements.
Please indicate whether the methods are carried out at high speed, whether they are manual etc.
12 Please indicate whether any of the slow speed survey methods listed above could be performed at traffic speed.
13
How is the inspection performed? Please describe how the condition of road signs is determined? How do you define the condition of road signs? (For example: Scale 1-5; Yes/No; good condition – bad condition)
14 Does the inspection take place according to a standard? If so, please provide details of this.
15 How often does inspection take place?
16 What are the yearly costs per km for these measures?
17
Are you aware of any novel or emerging technology that could be used to provide high speed measurements of road sign condition? If so, please provide details of this

Page 114 of 115
Noise barriers
Question Answer
18
What survey methods/techniques do you currently use to monitor the condition of noise barriers? What measurements are recorded?
Please list all methods and all relevant measurements.
Please indicate whether the methods are carried out at high speed, whether they are manual etc.
19 Please indicate whether any of the slow speed survey methods listed above could be performed at traffic speed.
20
How is the inspection performed? Please describe how the condition of noise barriers is determined? How do you define the condition of noise barriers? (For example: Scale 1-5; Yes/No; good condition – bad condition)
21 Does the inspection take place according to a standard? If so, please provide details of this.
22 How often does inspection take place?
23 What are the yearly costs per km for these measures?
24
Are you aware of any novel or emerging technology that could be used to provide high speed measurements of noise barrier condition? If so, please provide details of this

Page 115 of 115
Vehicle Restraint Systems
Question Answer
25
What survey methods/techniques do you currently use to monitor the condition of vehicle restraint systems? What measurements are recorded?
Please list all methods and all relevant measurements.
Please indicate whether the methods are carried out at high speed, whether they are manual etc.
26 Please indicate whether any of the slow speed survey methods listed above could be performed at traffic speed.
27
How is the inspection performed? Please describe how the condition of restraint systems is determined? How do you define the condition of restraint systems? (For example: Scale 1-5; Yes/No; good condition – bad condition)
28 Does the inspection take place according to a standard? If so, please provide details of this.
29 How often does inspection take place?
30 What are the yearly costs per km for these measures?
31
Are you aware of any novel or emerging technology that could be used to provide high speed measurements of vehicle restraint system performance or condition? If so, please provide details of this.