identifying red-banded thrips (selenothrips rubrocinctus ... · thrips cause silvering of guava...
TRANSCRIPT

IDENTIFYING RED-BANDED THRIPS (Selenothrips rubrocinctus Giard)
RESISTANCE IN GUAVA (Psidium guajava L.)
A THESIS SUBMITTED TO THE GRADUATE DIVISION OF THE UNIVERSITY OF HAWAII IN PARTIAL FULFILLMENT
OF THE REQUIREMENTS FOR THE DEGREE OF
MASTER OF SCIENCE
IN HORTICULTURE
MAY 1977
By
Blair Cooper
Thesis Committee:
Henry Y. Nakasone, Chairman Richard W. Hartmann Toshiyuki Nishida

11
We certify that we have read this thesis and that in our opinion
it is satisfactory in scope and quality as a thesis for the degree of
Master of Science in Horticulture.
THESIS COMMITTEE
/ f ChiChairman

ACKNOWLEDGEMENTS
The author wishes to acknowledge the assistance and support
provided by Mr. Raul Mosqueda Vazquez through constant and appropriate
advice on matters both personal and professional in the furtherance of
this study progressing to the accompanying thesis.

TABLE OF CONTENTS
ACKNOWLEDGEMENTS.......................................... iii
LIST OF TABLES............................................ vi
LIST OF ILLUSTRATIONS.................................... vii
INTRODUCTION ............................................. 1
REVIEW OF LITERATURE...................................... 3
Guava............................................... 3
Origin and Distribution ......................... 3Botany of the Crop.............................. 3
Red-Banded Thrips .................................... 4
Classification .................................. 4Origin and Distribution ......................... 4H o s t s .......................................... 5Biology of the Red-Banded Thrips ................. 5Morphology of Thrips Stages ..................... 6Habits of the A d u l t ............................ 8Habits of the Larvae and Pupae................... 8Description of Injury and Mode of Feeding....... 9
Insect Resistance .................................... 11
Definition........................ 11Mechanisms of Resistance ......................... 12Tests for Thrips Resistance..................... 14
MATERIALS AND METHODS .................................... 16
Host Plants.......................... 16Field Sampling...................................... 17Antibiosis Tests on TVfo Sister Trees in the Field . . . . 19Life Cycle S t u d y .................................... 21Preliminary Preference Tests on Leaves .............. 23Preference Tests on Leaves of Eleven Clones ........... 25Preliminary Preference Tests on Fruits .............. 25Preference Tests on Fruits of Eleven Clones ........... 28Statistical Transformation .......................... 28
RESULTS AND DISCUSSION .................................... 30
Seasonal Abundance of Thrips ......................... 30Relationship of Seasonal Abundance and Environment . . . 30
iv
Page
V
Spatial Distribution of Thrips in Progeny Field ....... 41Half-Sib Families Show Different Levels of Infestation . 42Levels of Infestation on 7-Year Old Clonal Trees . . . . 42Thrips Survival on Two Trees Which Differed
in Susceptibility................................ 43Correlation Between Number of Thrips and Damage ........ 46Suggested Field Selection Techniques ................. 49Life Cycle Duration.................. 49Preference Between Species .......................... 55Preference Between an Apparently Resistant
and an Apparently Susceptible Clone . . . ....... 55Preference for Leaves of Clones ....................... .58Preference for Fruits of Clones ....................... 58Comparison of Laboratory Data with
Field Observations................................ 63
SUMMARY AND CONCLUSIONS .................................. 66
APPENDIX................................................. 68
LITERATURE CITED............................................. 71
TABLE OF CONTENTS (Contd.)
Page
t

1 Monthly Thrips Distribution on 12 ProgeniesEach of 11 C l o n e s.................................... 31
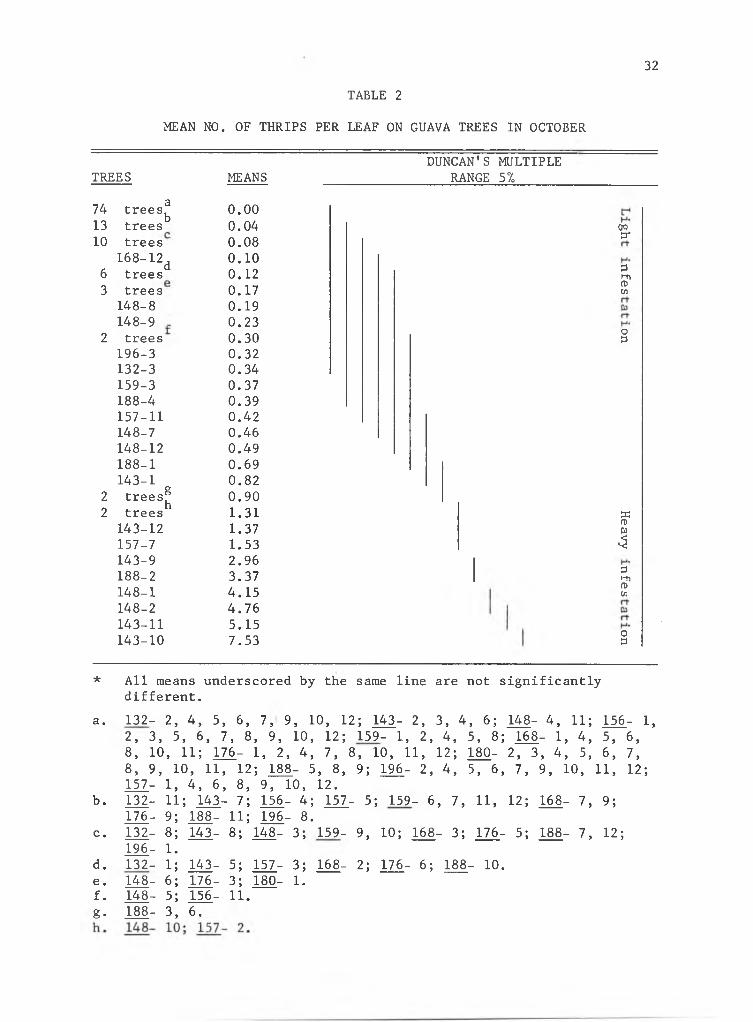
2 Mean Number of Thrips Per Leaf in Progenies ofClones From October Sample............................ 32
3 Mean Number of Thrips Per Leaf in 8 MonthSample of Clones .................................... 44
4 Comparison of Means in ObligatoryFood Experiments .................................... 45
5 Correlation of Number of Thrips with PercentDamage on Leaves and F r u i t s ........................... 47
6 Duration of Larval and Pupal Stages ................... 50
7 Thrips Per Leaf Disk of Guava and Cashew............... 56
8 Preference for Clones 168 and 1 4 3 ..................... 57
9 Results of Laboratory Leaf Preference Teston 11 Clones.......................................... 59
10 Fruit Preference Among 11 Clones .................. 60
11 Fruit Preference Among 6 Clones .................. 61
12 Fruit Preference Among 4 Clones .................. 62
Appendix
13 Daily Precipitation March 1975 -February 1976 at Waimanalo............................ 69
14 Daily Temperature March 1975 -February 1976 at Waimanalo............................ 70
vi
LIST OF TABLES
Table Page

V11.
1 Antibiosis Cage.................................... 20
2 Leaf Damage R a t i n g ................................. 22
3 Fruit Damage Rating ............................... 22
4 Life Cycle Cage..................................... 24
5 Leaf Preference Cage (Disks)....................... 24
6 Leaf Preference (Leaf Halves) ....................... 26
7 Fruit Preference Cage............................ . . 29
8 Correlation of Monthly Thrips Populations in132 Trees with Minimum and Maximum MeanMonthly Temperatures .............................. 33
9 Spatial Distribution of Thrips in ProgenyField During October 1975 .......................... 34
10 Spatial Distribution of Thrips in ProgenyField During May 1975 .............................. 35
11 Leaf Silvering..................................... 36
12 Russeted Fruits and Silvering of Leaves ............. 36
13 Correlation of Monthly Thrips Populations in6 Susceptible Trees with Maximum and MinimumMean Monthly Temperatures.......................... 37
14 Correlation of Monthly Thrips Population in132 Trees with Total Monthly Rainfall ............... 39
15 Correlation of Monthly Thrips Populations in6 Susceptible Trees with Total Monthly Rainfall . . . . 40
16 Thrips Egg ....................................... 51
17 One Day-Old First Instar Thrips ..................... 51
18 Three Day-Old First Instar Thrips .................... 52
19 Second Instar Thrips ............................... 52
LIST OF FIGURES
Figure Page

Vlll
Figure Page
20 Prepupal Stage Thrips ............................... 53
21 Pupal Stage Thrips ................................. 53
22 Adult Thrips in a Colony........................... 54
LIST OF FIGURES (Contd.)

INTRODUCTION
Guava (Psidium guajava L.) was first mentioned as a host for the
red-banded thrips (Selenothrips rubrocinctus Giard) in Hawaii in 1910
(Bagnall, 1910). Today, it is recognized as a major pest of guava
(Mitchell 1973). Heavy damage to commercial and wild guavas on Oahu,
Hawaii was reported in 1967, 1968 and 1969 (Cooperative Economic Insect
Reporter 1967, 1968, 1969). Light infestations of the red-banded
thrips cause silvering of guava leaves (Purseglove 1968, Mitchell 1973),
while severe infestations can cause defoliation (Smith 1953). Infested
guava fruits become scarified (Mitchell 1973) and eventually turn brown
(Ruehle 1948), making it difficult to know when the fruit is ready for
harvest. The attack on very young fruits may cause fruit drop and a
subsequent loss in productivity.
Guava has been grown and processed commercially in Hawaii for many
years. It is most often processed and stored frozen as puree. Later
on it is reprocessed to make nectars and other beverages, as well as
james, jellies, bakery and dairy products (Brekke 1973). Guava juice
has 2-5 times more vitamin C content than orange juice (Hamilton and
Wenkam 1967). Traditionally, most guavas have been picked from wild
stands. Recently, there has been interest in developing the guava as
an industry in Hawaii. This would require cultivated orchards in which
plant growth, harvesting and fruit quality can be controlled (Bullock
1973, Gerakas and Lee 1974).
Since red-banded thrips can be very destructive on guavas and since
pesticides are expensive and the object of intense regulation by the
Environmental Protection Agency, this study was initiated to find out if

variation in resistance exists in guava and, if it does, to develop
suitable methods for identifying useful levels of resistance.

3
REVIEW OF LITERATURE
Guava
Origin and Distribution
The guava is native to Tropical America where it was first
discovered by early Spanish and Portuguese explorers. These explorers
introduced the fruit to the Philippines, India and elsewhere and it has
become naturalized in many tropical countries. The guava was brought
to Hawaii by Don Marin around 1800 (Hamilton and Seagrave-Smith 1954).
It is often considered to be a noxious weed especially in pastures.
Botany of the Crop
The guava belongs to the Myrtaceae or Myrtle family (Neal 1965).
It is a small, low branching tree or shrub which ranges from 3-10
meters in height (Allen 1967). Suckers often grow from the roots.
The smooth green or reddish brown bark peels off in thin layers,
leaving a mottled pattern on the trunk (Neal 1965). Young twigs are
square in cross-section, pubescent and green in color (Ruehle 1948,
Chandler 1964).
The leaves are opposite with short petioles 3-10 mm long. The
blade is oblong to oval from 5-15 cm long, smooth on top and hairy
beneath. It has a prominent pinnate venation, indented above and
raised below (Neal 1965, Purseglove 1968, Chandler 1964).
The flowers are axillary with a persistent calyx. They are borne
singly or in 2-3 flowered cymes (Purseglove 1968).
The inferior fruit is a many seeded berry with the persistent
calyx often attached at fruit maturity. Fruit shape varies from round
and oval to pyriform. The immature fruit is light green, becoming

bright yellow at maturity. The exocarp is very thin. The mesocarp
color varies from white to pink, salmon or even sulfur yellow,
depending on the cultivar. The seeds are usually imbedded in the pulp
(Neal 1965, Chandler 1964, Allen 1967, Purseglove 1968).
Other related species with edible fruits include the strawberry
guava (P. cattleianum Sabine), its botanical form lucidum Degener,
P. guineense Sub and P. friedrichsthalianum (Berg.) Nied.
Red-Banded Thrips
Classification
The red-banded thrips belongs to the family Thripidae which is in
the sub-order Terebrantia of the order Thysanoptera (Lewis 1973).
The Red-banded thrips was originally identified and named by Giard
in Paris in 1901 from specimens from the West Indies and then in 1908
Franklin reclassified the genus on the basis of structure and called it
Heliothrips rubrocincta (Urich 1911). Karny then placed this insect in
a new sub-genus that he called Selenothrips rubrocinctus in 1911
(Russell 1912). Inasmuch as it was first identified on cacao, the
insect was generally called cacao thrips. In Florida where cacao is
not grown, this thrips was observed attacking mango and avocado. It
was given the name red-banded thrips because of the red band across the
first two abdominal segments (Russell 1912).
Origin and Distribution
It is generally agreed that the red-banded thrips is native to
tropical America (Urich 1911, Russell 1912, Reyne 1921, Callan 1943a).
However, in 1909 Maxwell-Lefroy reported that the red-banded thrips was
introduced to the West Indies from Ceylon (Russell 1912). This thrips
4

is widespread throughout cacao growing countries in the African and
American tropics (Callan 1943a, Russell 1912) as well as in the
tropical islands in the Atlantic and the Pacific (Russell 1912). It
was also been reported in Mexico (Johansen 1974), Florida (Russell
1912) and in India (Ananthakrishnan and Muraleedharan 1974). It will
probably not move any farther north than Florida since it is a tropical
insect (Russell 1912).
Hosts
Cacao (Theobroma cacao L.) and cashew (Anacardium occidentale L.)
are the two most important commercial host plants of the red-banded
thrips (Fennah 1963). Many other common tropical plant species have
been reported to be hosts. These include the following plants: guava
(P. guajava), polycarpum, mango (Mangifera indica L.), tropical almond
(Terminalia catappa L.), avocado (Persea americana Mill.), rose apple
(Eugenia jambos L.) and macadamia (Macadamia integrifolia Maiden and
Betche (Reyne 1921, Ananthakrishnan and Muraleedharan 1974, Russell
1912, Cooperative Economic Insect Reporter 1974). Cashew was preferred
over rose apple, mango and guava (Ananthakrishnan and Muraleedharan
1974). In Surinam the red-banded thrips preferred fully expanded new
leaves of plants in the following order: lipstick plant (Bixa oreliana
L.), Jambosa vulg. (sic), mango, tropical almond and cacao (Reyne 1921).
Biology of the Red-Banded Thrips
Females are usually more abundant than males in most thrips
species. No males of the red-banded thrips were observed in the West
Indies by Russell (1912), but a few were observed in Trinidad by Urich
(1911). In Surinam 16 males were recorded in a population of 1107
5

red-banded thrips (Reyne 1921). Likewise, the male to female sex ratio
of the onion thrips (Thrips tabaci Lindeman) varied from 1:1 in the
eastern Mediterranean region to 1:1000 in Hawaii and 0:3000 in the
Sudan (Lewis 1973).
Red-banded thrips eggs are usually inserted singly in the lower
epidermis of the leaf or in a protected area of the epidermis of the
fruit. It takes approximately 12 days for the first instar to emergeoat temperatures between 20 and 30 C (Bailey 1935). The duration of the
first and second larval instars varies from 6 days to as long as 16
days, depending on temperature (Reyne 1921, Bailey 1935, Russell 1912).
The third or prepupal instar lasts about 1-4 days and the fourth or
pupal instar, 1-7 days, again depending on temperature (Russell 1912,
Reyne 1921).
The shortest total life cycle observed was 16-18 days in Trinidad.oIn a Washington D.C. greenhouse at 21.1 C the total life cycle ranged
from 28-43 days (Russell 1912).
The first two larval or nymphal instars are the feeding stages.
The last two instars, the prepupal and pupal instars are non-feeding
stages (Lewis 1973).
Thrips populations are usually lowest during the rainy season due
to unfavorable conditions for reproduction (Urich 1911, Reyne 1921).
Populations on cashew rise drastically during the dry season in
Trinidad. However, on cacao the population has been observed sometimes
to increase even during the wet season in Trinidad (Fennah 1963).
Morphology of Thrips Stages
The egg of the red-banded thrips is thin, transparent and kidney
6

shaped, 0.26 mm long and 0.10 mm wide (Urich 1911).
A newly hatched larva is translucent, spindle-shaped and about
0.25 mm in length. The head is cubical and pale yellow with red eyes.
The antennae are 7 or 8-segmented. The abdomen is 10-segmented. The
first and second abdominal segments are banded by a bright red pigment.
There are 4-6 long setae at the tip of the abdomen (Russell 1912).
Normally, this first instar larva molts around the fifth day (Russell
1912, Reyne 1921).
The second stage larva has a longer, more cylindrical body than
the first stage, measuring approximately 1.01 mm in length. The color
of the body is translucent white to pale orange with a very prominent
red band on the first 3 abdominal segments. The body is also covered
with many bristly black setae. The last abdominal segment bears 4 long
black hairs. Antennae are 7-segmented extending foreward from the head
The eyes are red and the legs are hyaline (Russell 1912) .
The fusiform shape of the prepupa closely resembles the shape of
the adult thrips. It is 1.09 mm long and 0.26 mm wide. Three pairs of
setae are present on the head; 2 behind the head and 1 between the eyes
The 7-segmented antennae are translucent white with an orange-tipped
first segment and extend foreward from the head. The forewing and
hindwing pads are distinct, translucent white, and extend to the second
and third abdominal segments, respectively. A band of bright red
pigment covers half of the first and all of the second and third
abdominal segments. Numerous rows of setae cover the body, head and
legs (Russell 1912). The prepupa has no mouthspines for feeding
(Reyne 1921).
The pupa also has the same general shape as the adult. It is 1.02
7

mm long and 0.26 mm wide. The coloration is approximately the same as
that of the prepupa. The red eyes are larger than in the prepupal
stage and there are 3 ocelli in a triangle between the eyes. The
antennae in this stage conspicuously project backwards, and lie on the
head (Russell 1912).
On emerging, the adult female is translucent, but after the first
day, the body turns black. No red band is visible. Its body length
varies between 1.10 and 1.40 mm long. The male has a much smaller body
with a tapering, slender abdomen. Four feather-like wings, that do not
extend beyond the abdomen, are present. The antennae are once again
projecting foreward (Urich 1911, Russell 1912, Reyne 1921).
Habits of the Adult
Adults generally feed on the underside of leaves but may
occasionally be found on the upper leaf surface. They are often found
feeding in colonies with larvae and pupae near leaf veins. When
disturbed, they will jump or crawl quickly away. Jumping is
accomplished by a sudden beating of the wings (Reyne 1921). On cacao
the female chooses tender young leaves on which to deposit her eggs.
She inserts them one at a time into holes made by the ovipositor in the
epidermal layer. The egg in each hole is then covered by a drop of
fecal matter which serves to conceal and protect the egg (Russell 1912,
Urich 1911).
Habits of the Larvae and Pupae
The larvae on cacao are generally found feeding on the underside of
the leaves. They are often seen feeding with adults and near pupae. If
the colony is not disturbed and the food supply is good, they will
8

remain on one side of the leaf throughout their entire life cycle. One
striking characteristic of the larvae is the ball of liquid excrement
which is always carried at the tip of its uplifted abdomen supported
by 6 long hairs. When this fecal drop becomes too heavy to support, it
is voided on the leaf where it dries and turns brown. Larvae prefer
the shade to the sun. If exposed to bright light or heat they move
rapidly in search of cooler shady areas (Reyne 1921, Russell 1912).
Description of Injury and Mode of Feeding
A description of the structure of the mouthparts of thrips is
necessary for understanding their mode of action. Thrips mouthparts,
located under the first segment of the thorax, form a wide conical
proboscis known as the mouthcone. This cone is bent downwards and
backwards at a 45° angle to the body. The tip of the cone is usually
blunt but may be sharply pointed. All thrips mouthcones are asym
metrical. The face of the cone consists of the clypeus and the labrum
which are slightly separated by a membrane. Both sides of the cone
consist of the triangular shaped part of the maxilla which bears a tri
segmented palp. The back of the cone is formed by the labium bearing
two bi-segmented palps at its tip. The labium serves as a flexible
flap since it extends past the labrum and the maxillae. The tips of the
labium are hook-like and are used to grasp the surface of the feeding
site (Wardle and Simpson 1927, Lewis 1973).
Housed inside the cone are the piercing organs: Two thin maxillary
stylets, the more heavily sclerotized left mandibular stylet, and, in
some species, a median stylet or hypopharynx may be present (Wardle and
Simpson 1927, Lewis 1973). Mouthparts of larvae are similar to those of adults.
9
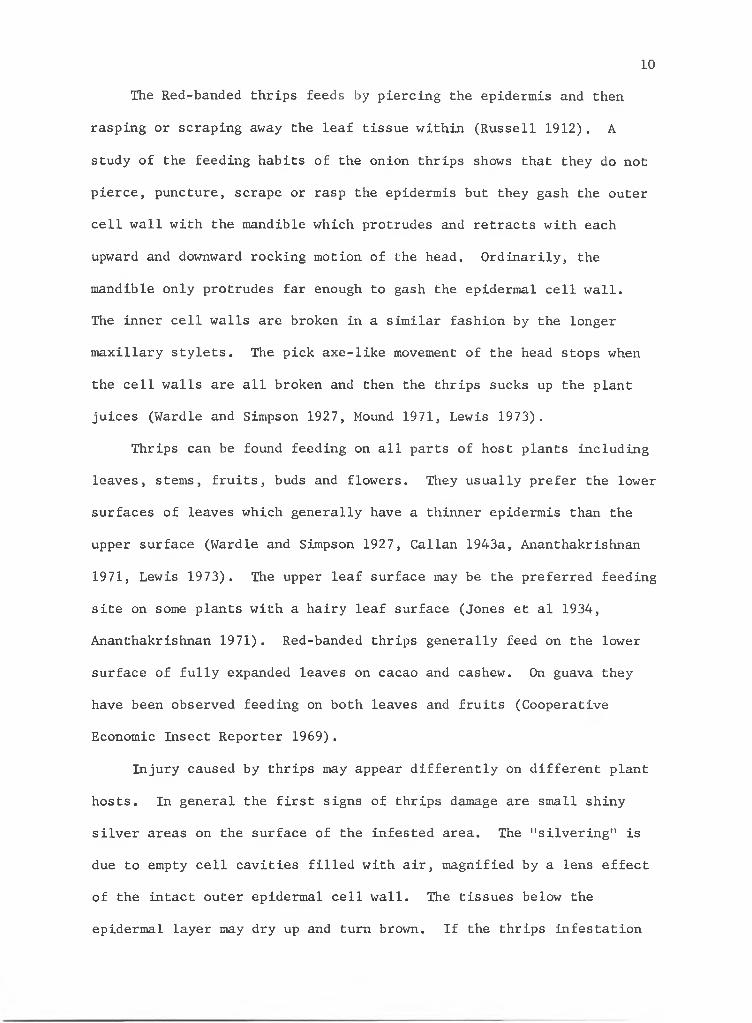
The Red-banded thrips feeds by piercing the epidermis and then
rasping or scraping away the leaf tissue within (Russell 1912). A
study of the feeding habits of the onion thrips shows that they do not
pierce, puncture, scrape or rasp the epidermis but they gash the outer
cell wall with the mandible which protrudes and retracts with each
upward and downward rocking motion of the head. Ordinarily, the
mandible only protrudes far enough to gash the epidermal cell wall.
The inner cell walls are broken in a similar fashion by the longer
maxillary stylets. The pick axe-like movement of the head stops when
the cell walls are all broken and then the thrips sucks up the plant
juices (Wardle and Simpson 1927, Mound 1971, Lewis 1973).
Thrips can be found feeding on all parts of host plants including
leaves, stems, fruits, buds and flowers. They usually prefer the lower
surfaces of leaves which generally have a thinner epidermis than the
upper surface (Wardle and Simpson 1927, Callan 1943a, Ananthakrishnan
1971, Lewis 1973). The upper leaf surface may be the preferred feeding
site on some plants with a hairy leaf surface (Jones et al 1934,
Ananthakrishnan 1971). Red-banded thrips generally feed on the lower
surface of fully expanded leaves on cacao and cashew. On guava they
have been observed feeding on both leaves and fruits (Cooperative
Economic Insect Reporter 1969).
Injury caused by thrips may appear differently on different plant
hosts. In general the first signs of thrips damage are small shiny
silver areas on the surface of the infested area. The "silvering" is
due to empty cell cavities filled with air, magnified by a lens effect
of the intact outer epidermal cell wall. The tissues below the
epidermal layer may dry up and turn brown. If the thrips infestation
10

is heavy these brown spots coalesce. A whole leaf may dry up, turn
brown and fall off prematurely (Ananthakrishnan 1971, Lewis 1973).
Cacao, mango and cashew are all defoliated by severe attacks of
the Red-banded thrips. It is the continual defoliation which does the
most damage. In Surinam cacao pods turn brown when attacked so the
fruits must be scraped with a sharp object to determine ripeness.
Heavy thrips infestations can cause some cacao trees to die. Others
survive but may not bear fruits (Reyne 1921). Wild guavas on San Thome
were defoliated and killed by a heavy thrips infestation (Urich 1928).
Thrips may also damage leaves and fruits in the process of
oviposition. Damage may also occur from the deposition of fecal matter
on the fruits and leaves, leaving unsightly, discolored spots caused by
the dried feces and an associated fungus (Lewis 1973, Ananthakrishnan
1971). During the larval stage 6-10 relatively large fecal drops are
produced. Adults deposit about 10 fecal drops per day, but these are
smaller than those produced by the larvae (Reyne 1921).
Insect Resistance
Definition
Resistance stems from the interrelationship between plant and
insect. The classic definition of insect resistance is given by
Painter (1968):
Resistance of plants to insect attack may be defined as the relative amount of heritable qualities possessed by a plant which influence the ultimate degree of damage done by the insect. In practical agriculture it represents the ability of a certain variety to produce a larger crop of good quality than do ordinary varieties at the same level of insect population.
Levels of resistance have been classified as follows:
Immunity is the absence of any damage or infestation.
11

High resistance is the presence of a very low level of damage or
infestation.
Low resistance is the presence of less damage or infestation than
average.
Susceptibility is the presence of average or above average damage
or infestation.
High susceptibility is the presence of much higher than average
damage or infestation.
Three other causes of the lack of damage or infestation may occur.
These are host evasion, induced resistance and escape. They are all
categorized as pseudoresistance (Painter 1968). Host evasion occurs
when a plant passes through its susceptible stage while the insect is
either not present or present only in low numbers. Induced resistance
may be a temporary increase in resistance due to environmental changes
around the plant. Escape is the lack of infestation of a susceptible
plant due to the nature of the insect population activity, distribution,
or chance (Painter 1968).
Mechanisms of Resistance
It is desirable to know the mechanism of resistance in order to
develop possible screening methods and adopt an appropriate breeding
technique. Three mechanisms have been identified which may be involved
individually or in combination to impart resistance to a plant (Painter
1968). "Preference or non-preference is used to denote the group of
plant characters and insect responses that lead to or away from the use
of a particular plant or variety for oviposition, food or shelter or
combinations of the three (Painter 1968)." Antibiosis is the "tendency
12

to prevent, injure or destroy (insect) life (Painter 1968)." Insects
feeding on a plant with such a mechanism may be affected by reduced
fertility, reduction in size, longer life cycle and higher mortality
in the first instar. Tolerance is the ability of the plant to recover
from insect damage in the presence of insect populations comparable to
those supported by susceptible plants (Painter 1968).
Preference is the mechanism involved in imparting resistance in
the following cases. Infested leaves of susceptible guava, mango, rose
apple and cashew plants were found to have high concentrations of free
amino acids while plants of the same species with non-infested leaves
had fewer free amino acids in lower concentrations. Cashew, which had
more free amino acids in higher concentrations than guava, rose apple
and mango, was the most susceptible plant host tested. There was no
difference in susceptibility among the latter three species (Ananthak
rishnan and Muraleedharan 1974). Part of the resistance in the onion
variety White Persian is due to its morphology and growth habit. It
has rounded leaves which touch each other in a limited plane whereas
other, more susceptible, varieties have flat leaves with a greater
surface area touching each other, thus providing more protection from
the surrounding environment. The White Persian also has wider angles
formed by the leaf blade with the sheath which again provides less
protection than the more susceptible varieties (Jones el al 1934).
The following are examples of antibiosis mechanisms. The
resistance to the red-banded thrips in cacao is reported to be most
likely due to the thickness of the leaf which resists puncturing by the
insect (Callan 1943a). Onions which are resistant to onion thrips have
a thicker epidermis than the susceptible varieties (Jones et al 1934).
13

Cotton resistance to the onion thrips is partially attributed to the
thickness of the epidermis of the leaf. However, it was found that a
few resistant varieties had very thin epidermal layers (Abdel-Gawaad
et al 1973). Gossypol, a naturally occurring insecticidal substance
found in all the glanded varieties of cotton (Bottger et al 1964) is
being studied as a possible cause of thrips resistance in cotton
(Gawaad and Soliman 1972).
Tests for Thrips Resistance
A three step program was set up to identify red-banded thrips
resistance in cacao in Trinidad. The first step was the selection of
trees which had few or no thrips in the field, while surrounding trees
were heavily infested. In the second step the apparently resistant
trees selected in the field were subjected to a series of laboratory
tests. Food preference tests on leaf disks with first instar larvae
in a large petri dish showed significant differences. Obligatory food
tests with first instar larvae on whole leaves inside a large jar for
10 days showed that 50% of the larvae on the resistant type were dead
and the live ones were small and unhealthy, while only a few larvae on
the control leaves were dead and the live ones appeared healthy.
Obligatory food tests on cuttings in the greenhouse showed much less
evidence of feeding on the resistant type than on the control. When
the resistant type was planted in a heavily infested area it proved to
have good resistance (Callan 1943a).
Thrips resistance in peanuts (Arachis hypogaea L.) was measured in
the field by counting thrips on foliar buds and by rating damage to
leaves. Color photographs showing each level of damage were used for
reference (Young et al 1972).
14

Antibiosis or obligatory food tests and preference tests were
carried out in the laboratory to determine peanut resistance. In the
antibiosis tests the coefficient of variation was 587o, and there were
few significant differences. The preference tests, however, showed
significant differences (Kinzer et al 1972).
Nakasone (unpublished data) rated damage on guava trees in the
field. Differences in levels of infestation were constant over a period
of 1 year.
15

16
MATERIALS AND METHODS
Host Plants
All guava plants utilized for this study are located at the
University of Hawaii, Waimanalo Experimental Farm in three fields
designated J-l, J-2, and Q-2. Planted in J-l are 4 replications of
7-year old trees of cultivar Beaumont (B-30) and 10 clones selected for
high yield and fruit quality. Two trees of each clone were used in
this study. 'Beaumont' is a local seedling selection of unknown
parents and clones 132, 143, 148, 156, 157, 159, 168, 176 and 180 are
all seedling selections of 'Patillo.' Clone 196 is a seedling selection
of the cultivar Pink Acid. Clones 156, 148 and 180 had been rated
resistant for summers. The others were not rated (Nakasone, unpublished
data). Planted in J-2 are a total of 780 trees which are 3-year old
open pollinated seedlings from clones 132, 143, 148, 156, 157, 159, 168,
176, 180, 188 ('Patillo' seedling) and 196. A total of 132 of these
seedlings were selected for this study. They consisted of 12 seedlings
from each of 11 clonal parents. Each set of 12 progeny included four
which had appeared susceptible and 8 which had appeared resistant in a
previous rating (Nakasone, unpublished data). Fruits from one tree of
the newly named cultivar Ka hua kula (097) a selected seedling of
'Beaumont' were used in the laboratory.
The 3-year old trees in field J-2 were spaced 6 feet within rows
and 12-15 feet between rows. The trees had been allowed to grow without
pruning so that branches of adjacent trees overlapped and many low
growing branched touched the ground. Thus, in the row there was a
continuous mass of foliage not quite as dense as a hedge row. These

trees were all fertilized in May 1975 with 3 pounds each of a 15-15-15
mix except for the individual trees 156-4 and 156-9 which were
fertilized with 10 pounds of the same mix and tip pruned in an attempt
to force them to flower and fruit at the same time so they could be
used in an antibiosis test.
Trees in field J-l were spaced 18 feet within rows and 25 feet
between rows. These trees had been pruned to a single trunk type of
growth and the lower branches touching the ground and those interfering
with mechanized operations had been removed. Clonal trees used in
laboratory experiments were each given 10 pounds of a complete 15-15-15
fertilizer mix in February 1976.
Pesticides were purposely not sprayed in fields J-l and J-2 to
allow natural insect populations to build up.
Several alternate hosts for the red-banded thrips are planted in
fields near J-l and J-2. Macadamia and other guavas are planted in
fields to the north. Mangoes border J-l and J-2 on the south. More
mangoes and two cashew trees are in an arboretum to the west.
Thrips for experiments were collected from a tropical almond tree
in the arboretum at the Waimanalo Experimental Farm, or from Psidium
araca planted in 5 gallon pots on the Manoa Campus of the University
of Hawaii.
Field Sampling
Thrips population counts in the field were used to measure the
differences in levels of infestation between trees and differences in
seasonal abundance and spatial distribution of thrips in the field.
Monthly thrips counts were made on 132 open pollinated guava
17

seedlings in field J-2. Thrips were counted on a sample of twenty
leaves per tree that were fully expanded and hardened, on the present
year's growth generally one or two nodes into the brown portion of
the twig and were from protected areas of the tree (close to but not
touching the ground). The samples were placed in a plastic bag and
stored in a refrigerator in the laboratory until they could be counted.
Thrips counts were made with the aid of a hand lens or a very low
powered disecting microscope. All samples were taken on the last two
days of each month. Since October 1975 was the month with the highest
thrips population and a cursory examination of the data for the remain
ing 11 months showed a distribution similar to that in October, the
October data was analyzed with a heirarchical design to indicate trends
in thrips infestation for the year. The sample size of 20 leaves was
found to be more than sufficient since optimum sample was calculated to2
be 6 leaves with the formula given by (Lewis, 1973) n = wherem2
n = sample size, m = the sample average and s = the standard deviation.
Correlations were made between monthly thrips populations and
average minimum monthly temperature, average maximum monthly tempera
tures, and total monthly rainfall. A multiple correlation was made
among monthly thrips populations on the 6 most susceptible trees average
minimum monthly temperature and total monthly rainfall using the formula
r-_ _ = r12 - r13 r23______ from Snedecor and Cochran (1967) r. =9 9
(1 - rl3 >(1 - r23 >
r^ = total thrips, and r^ = minimum temperature. It was thought that
the trees with the heaviest infestation would be the most likely to
show any effects of temperature and/or rainfall.
18

Thrips counts were also made on the clones in field J-l. Two
trees of each of the 11 clones were sampled for 8 months in the same
manner as the seedlings in Field J-2. These data were analyzed using
a randomized complete block design.
Antibiosis Tests on Two Sister Trees in the Field
Obligatory food tests on leaves and fruits on 2 seedlings of clone
156 at 2 different times, August 11 - September 15 and October 23 -
November 21, 1975 were carried out to test thrips survival on an
apparently susceptible seedling and an apparently resistant seedling
and to measure the amount of damage done by a known number of thrips.
In the August-September period only leaves were tested. In the October-
November period both leaves and fruits were tested.
Thrips in the pupal stage were transferred from leaves of a
tropical almond tree with a 000 camel's hair brush into cages on the
leaves or fruits of the guava trees. The cages on the leaves were
small celluloid cages around a single leaf similar to that illustrated
by Peterson (1947) in Plate #31 (Fig. 1). The dimensions of the .1 mm
thick acetate sheet for the leaf cage are 11.5 x 25.5 cm. The organdy
sleeve is also 11.5 x 25.5 cm and the end piece of organdy is 11 cm in
diameter. The acetate sheet is first taped together with a thin strip
of double-stick tape then glued forming a cylinder. The 11.5 x 25.5
organdy is fastened to the end of the cylinder with tape and glue
forming a sleeve and then the 11 cm organdy piece is attached to the
open end forming a cage 8 cm in diameter and 21 cm in length. After 30
days the leaves or fruits were removed from the trees (still in the
cages) and taken to the laboratory where counts were made of the number
19

FIGURE 1. ANTIBIOSIS CAGE

of thrips alive per leaf or fruit and the percentage of the leaf
surface which had turned silver (Fig. 2) or the percentage of the fruit
surface which had been sacrified and covered with fecal matter (Fig. 3)
was estimated. The completed fruit cage is shorter than the leaf cage.
It is 9 cm in diameter and 16 cm long. The cylinder made from a
rectangular piece of acetate sheet 8 x 27.5 cm and the sleeve is made
with a piece of organdy 11 x 26.5 cm. The end is covered with organdy
12 cm in diameter.
Five initial numbers of thrips were transferred into the cages:
0, 1, 5, 10, and 20. Four replications were used for each antibiosis
test on either leaves or fruits on each plant at each time. One cage
was found missing in each of five separate tests, thus it was necessary
to calculate a value for the missing data with the formula given by
Cochran and Cox (1957). Comparisons were made between individual trees,
between leaves and fruits on the same tree, and between leaves in the
two periods using only the 5, 10, and 20 initial cage populations.
Treatment means were compared using LSD or Cochran's t' method of
analysis of independent samples when the variances are different
(Snedecor and Cochran, 1967). Correlations were made between percent
damage and both the initial and final number of thrips per leaf or
fruit.
Life Cycle Study
A life cycle study of the red-banded thrips on guava leaves was
initiated to establish the normal length for the cycle on guava. Forty-
four, 1-day old larvae were placed on 44, 1.5 cm square sections of
fully hardened 'Beaumont' guava leaves which were floated on water in
44, 60 x 15 mm petri dishes, one to a dish in the laboratory at room
21

22
orn*RiP5 ao-THRi?} 0-T#fOfc>
CENTIMETERS
FIGURE 2. LEAF DAMAGE RATINGMiddle Leaf = 100% Silvering Outer Leaves = 0% Silvering
FIGURE 3. FRUIT DAMAGE RATING3 Fruits on Left = 100% Russeting 3 Fruits on Right = 0%, Russeting
temperature (22.2°C) (Callan, 1947) (Fig. 4). Daily observations were
made and records kept on the number of days per instar and the general
physical condition and habits of the thrips.
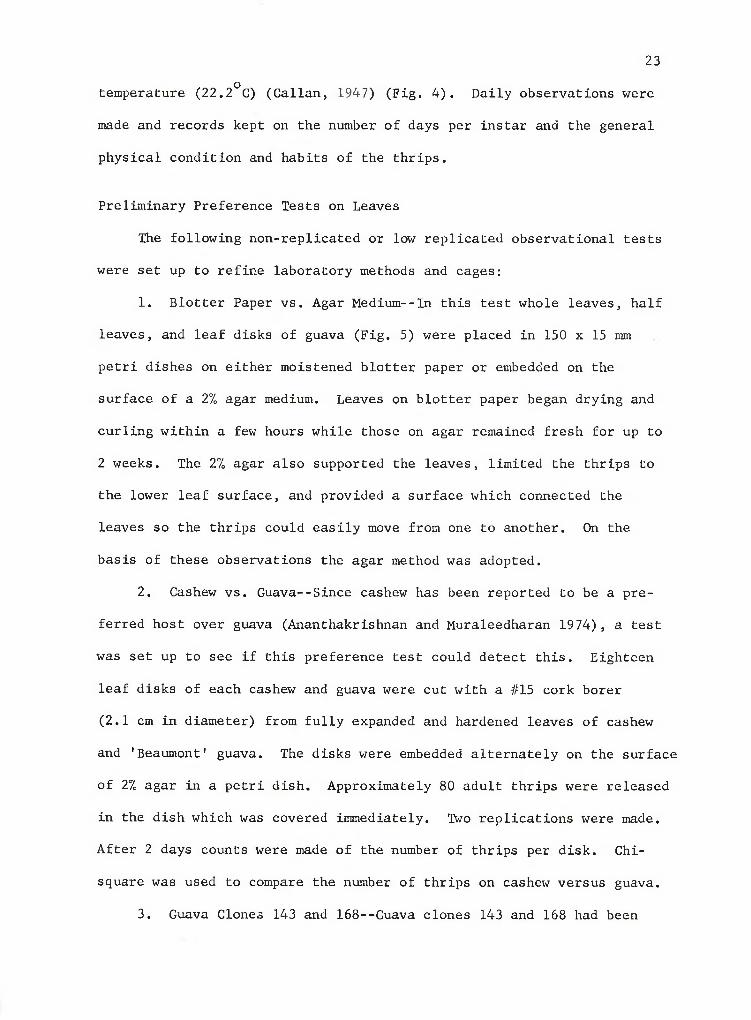
Preliminary Preference Tests on Leaves
The following non-replicated or low replicated observational tests
were set up to refine laboratory methods and cages:
1. Blotter Paper vs. Agar Medium--In this test whole leaves, half
leaves, and leaf disks of guava (Fig. 5) were placed in 150 x 15 mm
petri dishes on either moistened blotter paper or embedded on the
surface of a 2% agar medium. Leaves on blotter paper began drying and
curling within a few hours while those on agar remained fresh for up to
2 weeks. The 2% agar also supported the leaves, limited the thrips to
the lower leaf surface, and provided a surface which connected the
leaves so the thrips could easily move from one to another. On the
basis of these observations the agar method was adopted.
2. Cashew vs. Guava--Since cashew has been reported to be a pre
ferred host over guava (Ananthakrishnan and Muraleedharan 1974), a test
was set up to see if this preference test could detect this. Eighteen
leaf disks of each cashew and guava were cut with a #15 cork borer
(2.1 cm in diameter) from fully expanded and hardened leaves of cashew
and 'Beaumont' guava. The disks were embedded alternately on the surface
of 27o agar in a petri dish. Approximately 80 adult thrips were released
in the dish which was covered immediately. Two replications were made.
After 2 days counts were made of the number of thrips per disk. Chi-
square was used to compare the number of thrips on cashew versus guava.
3. Guava Clones 143 and 168--Guava clones 143 and 168 had been
23

24
FIGURE 4. LIFE CYCLE CAGE
LEAF p r e f e r e n c e c a g e
FIGURE 5. LEAF PREFERENCE CAGE (DISKS)

observed in the field to differ in the amount of thrips damage
(Nakasone, unpublished data). Eighteen leaf disks 2.1 cm in diameter
from both clones were embedded in a 150 x 15 mm petri dish in the
laboratory at room temperature. Approximately 50 first instar thrips
were placed in the dish and it was covered. Approximately the same
number of thrips were released in another 150 x 15 mm petri dish which
contained % leaf of clone 168 and % leaf of clone 143 (Fig. 6). Daily
counts of thrips and fecal spots on each were made for 3 days. Counts
were analysed using chi-square. This test was set up to see if
differences in preference observed in the field could be detected by a
preference test in the laboratory.
Preference Tests on Leaves of Eleven Clones
A preference test with the 11 clones for which field observations
had been made was run to test if apparent differences in preference
observed in the field could be detected in a laboratory test. A random
ized complete block design with 11 replications was used. One leaf disk
3.2 cm in diameter of each clone was embedded in a 1% agar which had
been poured in the lid of a 150 x 15 mm petri dish. Leaf disks were
larger than before because only one disk of each clone was placed in the
dish rather than 18. A 1% agar medium was used since it was found to
work as well as a TL agar medium but was less expensive. Agar was
poured in the lid of the petri dish so the bottom could be pushed into
the agar to seal the cage so no thrips could escape. Daily counts were
made of thrips and fecal drops per disk.
Preliminary Preference Tests on Fruits
1. Agar versus no agar--The recovery of thrips from whole mature
25

26
FIGURE 6. LEAF PREFERENCE CAGE (% LEAF)
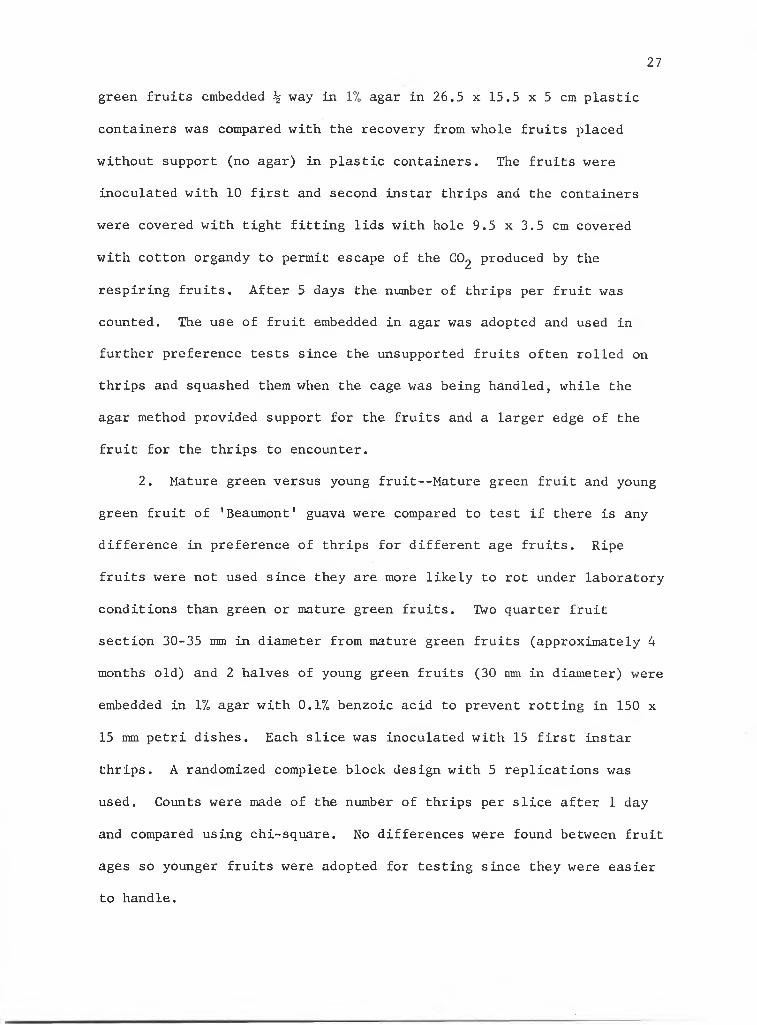
green fruits embedded \ way in 1% agar in 26.5 x 15.5 x 5 cm plastic
containers was compared with the recovery from whole fruits placed
without support (no agar) in plastic containers. The fruits were
inoculated with 10 first and second instar thrips and the containers
were covered with tight fitting lids with hole 9.5 x 3.5 cm covered
with cotton organdy to permit escape of the CO2 produced by the
respiring fruits. After 5 days the number of thrips per fruit was
counted. The use of fruit embedded in agar was adopted and used in
further preference tests since the unsupported fruits often rolled on
thrips and squashed them when the cage was being handled, while the
agar method provided support for the fruits and a larger edge of the
fruit for the thrips to encounter.
2. Mature green versus young fruit--Mature green fruit and young
green fruit of 'Beaumont' guava were compared to test if there is any
difference in preference of thrips for different age fruits. Ripe
fruits were not used since they are more likely to rot under laboratory
conditions than green or mature green fruits. Two quarter fruit
section 30-35 mm in diameter from mature green fruits (approximately 4
months old) and 2 halves of young green fruits (30 mm in diameter) were
embedded in 1% agar with 0.1% benzoic acid to prevent rotting in 150 x
15 mm petri dishes. Each slice was inoculated with 15 first instar
thrips. A randomized complete block design with 5 replications was
used. Counts were made of the number of thrips per slice after 1 day
and compared using chi-square. No differences were found between fruit
ages so younger fruits were adopted for testing since they were easier
to handle.
27

Preference Tests on Fruits of Eleven Clones
A preference test on fruits of the 11 clones for which Field
observations and leaf preference tests had been made was run to see if
fruit preference results would confirm the other two. One young fruit
half (30-35 mm in diameter) of each clone was embedded in agar with
0.17o benzoic acid in 26.5 x 15.5 x 5 cm plastic containers (Fig. 7).
Each fruit half was inoculated with 15 first and second instar thrips
and the containers were covered with tight fitting lids. A randomized
complete block design with 6 replications was used. The number of
thrips on each fruit were counted 3 days after inoculation.
The four least preferred fruits from the previous experiment were
compared with 'Beaumont' and 'Ka hua kula,' 2 commercial cultivars in a
similar trial in a randomized complete block design with 9 replications.
The four least preferred clones from this trial were also tested alone
in a randomized complete block design with 8 replications.
Statistical Transformation
Unless otherwise stated all data were transformed using \l x + 1
which is necessary to stablilize the variance when many counts are
small (Snedecor and Cochran 1967). Transformed means were compared with
LSD, Cochran's t' or Duncan's Multiple Range Test (Duncan 1955). Means
were retransformed by squaring the transformed mean and subtracting 1.
28

29
FIGURE 7. FRUIT PREFERENCE CAGE

30
RESULTS AND DISCUSSION
Seasonal Abundance of Thrips
The monthly variation of thrips populations on the trees in
Field J-l is shown in Figure 8 and Table 1. Thrips populations were
highest between September and January. October was the month with
the highest thrips population with January nearly as high. A second
peak occurred in May but it was considerably lower than the peak between
September and January. There was a 20-fold increase in population from
August to October (Table 1).
No dead or defoliated trees were observed. Only a few trees
supported high enough thrips populations (Table 2, Figs. 9, 10) to
cause some silvering of leaves and scarring of fruits (Figs. 11, 12).
Since severe thrips infestations in guava cause fruit russetation and
defoliation (Smith, 1953) and have even caused the death of wild guava
stands (Urich, 1928), the level of infestation at this time at Waimanalo
was considered to be light.
Relationship of Seasonal Abundance and Environment
There was no correlation between average maximum or minimum monthly
temperatures with monthly thrips totals on either all 132 trees (Fig. 8)
or on the 6 most highly infested progenies (Trees 143-10, 143-11, 148-2,
188-2 and 143-9) (Table 2, Fig. 13). Temperature is one of the two most
important environmental factors affecting thrips populations (Lewis
1973). Cooler temperatures would more likely be limiting to Waimanalo
since red-banded thrips is a species which developed in the warm
tropics. However, the lack of correlation between thrips population

TABLE 1
MONTHLY THRIPS ON PROGENIES OF 11 GUAVA CLONES AND A COMPARISON OF HALF-SIB FAMILIES WHEN INFESTATION IS HIGHEST (OCTOBER)
Monthly Thrips Total on 20 Leaves/Tree for 12 Trees/Family
1975 1976Family Mar Apr May Jun Jul Aug Sep Oct Nov Dec Jan Feb Tot Means
180 7 6 1 1 1 1 2 4 12 7 11 4 57 0.02156 2 0 4 3 2 5 8 8 21 20 69 12 154 0.02168 0 2 12 4 0 0 3 10 17 25 87 14 174 0.04176 0 19 18 14 4 2 6 11 18 25 12 6 135 0.04196 7 26 9 2 6 3 0 11 11 8 15 12 110 0.04132 0 2 2 4 4 1 1 13 42 49 73 8 199 0.04159 6 2 22 3 3 5 17 17 9 32 77 28 221 0.06157 0 59 21 95 39 2 4 93 50 170 143 21 697 0.23188 1 4 6 4 1 1 37 184 96 101 139 17 591 0.46148 43 6 28 29 64 5 103 319 95 60 289 28 1069 0.80143 53 130 308 98 35 28 182 430 185 191 130 33 1803 1.10
Tot 119 256 431 257 159 53 363 1100 556 663 1045 183
Comparison of October MeanNo. of Thrips/Leafa____
Duncan's Multiple Range*
H- ir* 3 H-mew(Dcn rtrT3rtH*O3
3 n>Hi 3re <d co v;3rtH-O3
a Means and multiple range test were calculated only for the October data and do not apply to the other months.
* All means underscored by the same line are not significantly different at the 95% level.
32TABLE 2
MEAN NO. OF THRIPS PER LEAF ON GUAVA TREES IN OCTOBER
TREES MEANSDUNCAN'S MULTIPLE
RANGE 51
74 atrees^ 0.0013 trees 0.0410 trees 0.08
168-12d 0.106 trees 0.123 trees 0.17148-8 0.19148-9 0.23
2 trees 0.30196-3 0.32132-3 0.34159-3 0.37188-4 0.39157-11 0.42148-7 0.46148-12 0.49188-1 0.69143-1 0.82
2 trees^ 0.902 ntrees 1.31143-12 1.37157-7 1.53143-9 2.96188-2 3.37148-1 4.15148-2 4.76143-11 5.15143-10 7.53
OQ3“
3hhfT>cn
O3
33rotuI3i-hmcn
O3
* All means underscored by the same line are not significantly different.
a. 132- 2, 4, 5, 6, 7, 9, 10, 12; 143- 2, 3, 4, 6; 148- 4, 11; 156- 1,2, 3, 5, 6, 7, 8, 9, 10, 12; 159- 1, 2, 4, 5, 8; 168- 1, 4, 5, 6,8, 10, 11; 176- 1, 2, 4, 7, 8, 10, 11, 12; 180- 2, 3, 4, 5, 6, 7,8, 9, 10, 11, 12; 188- 5, 8, 9; 196- 2, 4, 5, 6, 7, 9, 10, 11, 12; 157- 1, 4, 6, 8, 9, 10, 12.
b. 132- 11; 143- 7; 156- 4; 157- 5; 159- 6, 7, 11, 12; 168- 7, 9;176- 9; 188- 11; 196- 8.
c. 132- 8; 143- 8; 148- 3; 159- 9, 10; 168- 3; 176- 5; 188- 7, 12;196- 1.
d. 132- 1; 143- 5; 157- 3; 168- 2; 176- 6; 188- 10.e. 148- 6; 176- 3; 180- 1.f. 148- 5; 156- 11.g. 188- 3, 6.

TOTA
L NO
. TH
RIPS
/
MO
NTH
33
1--- 1 — I--- 1 1 I--- 1--- 1 1 1 i ■ 1 i i--- r
------ - AVG. MEAN TEMP
------»i. AVG. MAX. TEMP
■— -2 .AVG. MIN. TEMP
[ZZU.TOT. NO. THRIPS
r, = . 0690n .s .
r = . 1 2 5 2 n.s.2 ■ 3
FIGURE 8. TOTAL MONTHLY THRIPS POPULATION ON 132 GUAVA TREES AND MONTHLY AVERAGE MAXIMUM, AVERAGE MINIMUM, AND MEAN
TEMPERATURES
TEM
PE
RA
TUR
E

34
'*CVC. " \
0-5 THRIPS 20 LEAVES
6-10 THRIPS / 20 LEAVES
11-50 THRIPS / 20 LEAVES
50 + THRIPS / 20 LEAVES
TREES NOT SAMPLED
♦
FIGURE 9. SPATIAL DISTRIBUTION OF THRIPS IN PROGENY FIELD DURING OCTOBER 1975

FIGURE

36
FIGURE 12. FRUIT AND LEAF DAMAGE IN THE FIELD

TOTA
L NO
. OF
TH
RIP
S ON
SIX
SU
SCEP
TIBL
E TR
EE
S
37
FIGURE 13. TOTAL MONTHLY THRIPS POPULATION ON THE 6 MOST SUSCEPTIBLE TREES (TABLE 2) AND MONTHLY AVERAGE MAXIMUM, AVERAGE MINIMUM, AND MEAN
TEMPERATURES
' AVG. MEAN TEMP
v
« i.AVG. MAX. TEMP
o 2.AVG. MIN.TEMP
3.TOT. NO. THRIPS
r. = .5122 n.s.I • 3r2-3 = -4288 n.s.
A
JAN FEB MAR APR MAY JUN JUL AUG 1975
C JAN FEB 1976
30.0
29.0
28.0
270
26.0
2 5.0
24.0
23.0
22.0
21.0
20.0
19.0
18.0
0
TEM
PE
RA
TUR
E

levels and temperature seems to indicate that temperature was not a
limiting factor at this experimental site.
There was no correlation between total monthly rainfall and monthly
thrips totals on either all 132 trees or on the 6 most highly infested
trees (Figs. 14, 15). The total rainfall at the Waimanalo Experimental
Farm during the 12 months of this study was 766 mm, compared to the
average of 991 mm for the last 7 years (U. S. Weather Bureau 1970-1976).
However, there were 9 days which had more than 25 mm (Table 13). Four
of these days occurred in February 1976 and may have been the cause of
the drastic drop in the thrips populations from the previous month. Four
consecutive days of heavy rainfall, totalling 216 mm on November 24-27,
1975 fell just prior to the usual sampling date at the end of the month
and may have caused the drop from October. Heavy or sudden rain showers
can wash thrips from exposed leaves (Lewis 1973, Russell 1912). Except
for these two months when rainfall may have caused a decline in the
thrips populations rainfall did not seem to be a factor affecting the
thrips population levels.
The multiple correlation between the average minimum monthly
temperature, the total monthly rainfall and the monthly thrips population
for the 6 most highly infested trees was not significant (r = .2155).
Therefore, the low level of thrips infestations cannot be attributed to
temperature or rainfall or a combination of them.
The near by location of more preferred plant hosts may have been
one cause of low thrips populations on the guavas. Tropical almond,
mango, and macadamia which are reported hosts for the red-banded thrips
(Reyne 1921, Cooperative Economic Insect Reporter 1974) and cashew which
was reported to be preferred over guava by the red-banded thrips
38

TOTA
L NO
. TH
RIP
S /
MO
NT
H
39
n\\\
\
\I\
1200 -
1000 -
800 -
600 -
400 -
200 -
0 ■ JAN FEB1925
FIGURE 14. TOTAL MONTHLY THRIPS POPULATION ON 132 GUAVA TREES AND TOTAL MONTHLY RAINFALL
RAINFALL M
M

TOTA
L NO
. OF
TH
RIPS
ON
SIX
SU
SCEP
TIBL
E TR
EE
S
40
1975 1976
FIGURE 15. TOTAL MONTHLY THRIPS POPULATIONS ON THE 6 MOST SUSCEPTIBLE GUAVA TREES (TABLE 2) AND TOTAL
MONTHLY RAINFALL
RAINFALL M
M

(Ananthakrishnan and Muraleedharan 1974) are found in close proximity
to the guava fields. The tropical almond tree which was used as the
source of thrips for this study sometimes had a very severe infestation
when the infestation on guava was light.
Poor fruit production may have been another factor keeping the
thrips population low during the period of this study. Fennah (1963)
showed that the peak of thrips population numbers on cashew in Trinidad
concided with the period of fruit maturity. Fruit production was
observed to be low on these trees during this period, although no
records were kept. The peaks in thrips population in October to
January with a second lower peak in May do coincide almost exactly with
peaks of fruit production in Hawaii (Nakasone et al 1976).
Mitchell (1973) reported that natural enemies such as fungi and
predators usually keep the red-banded thrips on guava under fair control
even though occasional outbreaks do occur. However, in this study no
fungi were observed in the field and the number of predators observed
was so minimal that it was deemed unnecessary to report them. Thus,
natural enemies were not felt to be the cause of the low thrips
populations on guava.
Spatial Distribution of Thrips in Progeny Field
Figures 9 and 10 show the spatial distribution and concentration of
thrips in the field during October and May of 1975. In both months
thrips were heavily concentrated in a limited number of trees in a
definite area of the field. In May the highest concentration was in the
middle of the western edge of the field. Even though there was a high
concentration in this same area in October the highest concentration of
41
thrips was in the eastern corner.
The spatial distribution of thrips in the field was probably not
due to a normal random distribution of the population. A highly
significant correlation between Nakasone's previous ratings (Nakasone,
unpublished data) of these trees with the 12 month totals for the same
trees in this study, show that thrips population build up in the same
trees and the same areas of the field over a period of years. The
distribution is probably due to the tendency thrips have to aggregate
in distinct microhabitats which provide the most favorable, food,
shelter and sites of reproduction (Lewis 1973). In the field it is
possible to identify the most susceptible trees since they have the
highest infestation but the trees with few or no thrips are not
necessarily resistant, even when field populations are high (Callan
1943a). Therefore, laboratory tests are necessary for identifying
resistant trees.
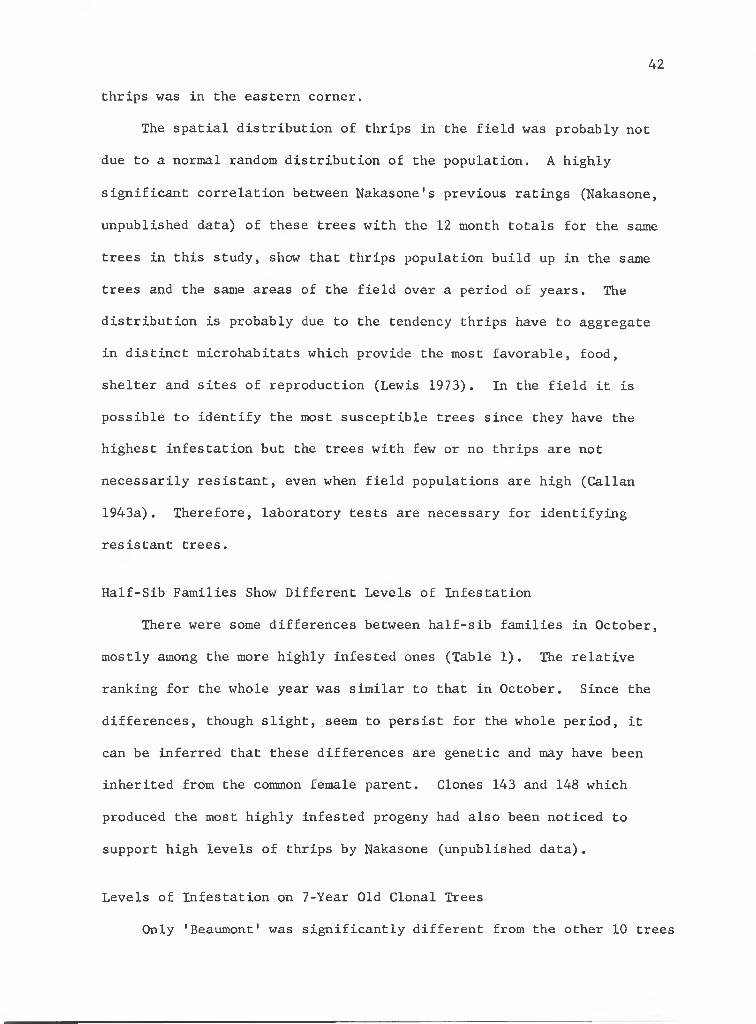
Half-Sib Families Show Different Levels of Infestation
There were some differences between half-sib families in October,
mostly among the more highly infested ones (Table 1). The relative
ranking for the whole year was similar to that in October. Since the
differences, though slight, seem to persist for the whole period, it
can be inferred that these differences are genetic and may have been
inherited from the common female parent. Clones 143 and 148 which
produced the most highly infested progeny had also been noticed to
support high levels of thrips by Nakasone (unpublished data).
Levels of Infestation on 7-Year Old Clonal Trees
Only 'Beaumont' was significantly different from the other 10 trees
42

tested (Table 3). 'Beaumont1 had a higher level of infestation than
the other trees. The differences in infestation previously noted by
Nakasone (unpublished data) were not detected. The reason was probably
the very low level of thrips infestation.
Many fewer thrips were found on these 7-year old trees in Field
J-l than on 3-year old trees in Field J-2 (Tables 1, 3). This was most
likely due to the much greater tree density and different growth habits
in the 3-year old field than in the 2-year old field (see Materials and
Methods). The 3-year old trees apparently provided a more preferable
microhabitat for thrips than did the 7-year old trees.
Thrips Survival on Two Trees Which Differed in Susceptibility
The results of the obligatory food tests on a possibly susceptible
and a possible resistant sister trees are presented in Table 4. In
August-September, when only leaves were tested, there was a significant
difference between the two trees. In October-November, when both leaves
and fruits were tested, there were no differences between trees. The
level of survival on the leaves of both trees in October-November was
the same as that of the possibly resistant tree in August-September.
The level of survival on the fruits of both trees at this time was
relatively high and significantly different from the level of survival
on the leaves at that time. In summary, in August-September, the leaves
of 156-4 showed high survival, 156-9 showed low survival, and fruits
were not tested. In October-November leaves of both trees showed low
survival, while fruits of both trees showed high survival.
The trees were fruiting in October-November but not in August-
43

44
TABLE 3
COMPARISON OF THE MEAN NUMBER OF THRIPS PER LEAF SAMPLED IN 2 REPLICATIONS OF 11 GUAVA TREES ONCE A MONTH FOR 8 MONTHS
(JULY '75-FEB. ’76)
Mean No. of Thrips / Leaf / 8 Months Trees Means "V
168 0.004
156, 196 0.007
157, 159 0.010
176, 180 0.012
148 0.016
143 0.038
132 0.048
Beaumont 0.150
* All means underscored by the same line are notsignificantly different at the 95% level with Duncan's Multiple Range Test.

TABLE 4
NUMBER OF THRIPS ALIVE AFTER 30 DAYS IN ANTIBIOSIS TESTS ON 2 GUAVA TREES
Treatment
Comparison Between Trees
Mean No. of Thrips Per Leaf Mean No. of Thrips Per FruitAug-Sept Oct-Nov Oct-Nov
156-4 156-9 LSD 156-4 156-9 LSD 156-4 156-9 LSD
20 Thrips 39.25 4.00 4.65* 4.00 1.00 1.35 ns 39.25 49.25 3.28 ns10 Thrips 32.75 2.50 1.44* 1.50 0.50 0.82 ns 17.75 30.50 0.88<3.20ans5 Thrips 49.00 4.25 4.55* 7.75 0.00 1.00<3.20ans 12.25 7.00 3.35 ns
Comparison Within Trees - Fruit: vs. Leaves, Oct-:NovTree 156-4 Mean No. of Thrips Tree 156-9 Mean No. of Thrips
Fruit Leaf LSD Fruit Leaf LSD20 Thrips 39.25 4.00 3.12* 49.25 1.00 4.10>3.20a*10 Thrips 17.75 1.50 3.44 ns 30.50 0.50 0.19*5 Thrips 12.25 7.75 2.68 ns 7.00 0.00 1.00<3.20ans
Comparison Between Periods
Tree 156-4 Mean No. of Thrips Tree 156-9 Mean No. of Thrips
Aug-Sept Oct-Nov LSD Aug-Sept Oct-Nov LSD20 Thrips 39.25 4.00 3.77* 4.00 1.00 1.14 ns10 Thrips 43.75 1.50 0.93* 2.50 0.50 1.15 ns5 Thrips 49.00 7.75 2.71 ns 4.25 0.00 1.00<3.20ans
* Indicates significant differences at the 95% level.a Comparisons made using Cochran's t'. In all other cases LSD is used to compare means. -p-ns Means not significantly different.

September. Adequate food for thrips may have been diverted from the
leaves to the developing fruits, rendering the leaves of the susceptible
156-4 now unable to support the thrips. This phenomenon was also
observed by Fennah (1963) who found red-banded thrips on developing
cashew fruits and not on leaf petioles on the same branch. He explained
this by the fact that the developing fruit is the storage organ which
receives not only the introgenous and other nutrient-rich compounds
taken up through the roots but also to a greater or less extent, those
mobilized and exported from adjacent leaves. Since the fruits on both
trees support the same high population level any resistance present in
156-9 is apparently expressed only by the leaves.
Correlation Between Number of Thrips and Damage
The initial number of thrips was positively and significantly
correlated with damage (percent surface area of leaf 'silvered' or
fruit scarified) in all cases (Table 5). The final number of thrips
found was also positively and significantly correlated with damage in
all cases but one. The correlation between final number of thrips with
damage on leaves of tree 156-4 during the October-November period was
non-significant.
Since the thrips were caged on the leaf or fruit, they had to feed
or die. Since most of the correlations of damage and initial thrips
population were higher then the correlations of damage and final thrips
population, it seems that the initial thrips populations attempted to
feed and caused the damage that was measured, even if the food source
was inadequate and the thrips were not able to survive. This difference
in the correlations between damage and initial or final thrips
46

TABLE 5
CORRELATION OF INITIAL AND FINAL NO. OF LIVE THRIPS WITH PERCENT DAMAGE IN OBLIGATORY FOOD EXPERIMENTS ON 2 GUAVA TREES
Aug 11 - Sept 15, 1975 Oct 23 - Nov 21, 1975• Leaves 156-9 Leaves 156-4 Leaves 156-9 Leaves 156-4 Fruits 156-9 Fruits 156-4
Rep.
Initial
Nc
of Thrips
Final
No.
of Thrips
Percent
Damage
Final
No.
of Thrips
Percent
Damage
Final
No.
of Thrips
Percent
Damage
Final
No.
of Thrips
Percent
Damage
Final
No.
of Thrips
Percent
Damage
Final
No.
of Thrips
Percent
Damage
A 0 0 0 0 0 0 0 0 0 0 0 0 0B 0 0 0 0 0 0 0 0 0 0 0 0C 0 0 0 0 0 0 0 0 0 0 0 0D 0 0 0 0 0 0 0 0 0 0 0 0
A 1 2 15 5 10 0 0 0 0 0 0 0 0B 0 1 15 5 0 0 0 0 0 0 11 20C 3 5 1 1 0 0 0 0 0 0 1 35D 0 5 6 1 0 5 0 0 0 0 0 0
A 5 10 40 110 90 0 0 14 1 0 10 0 10B 5 10 46 70 0 10 13 10 7 32 20 45C 2 1 10 1 0 0 4 5 5 25 22 50
A 10 7 40 57 100 0 0 1 2 24 25 0 50B 3 50 36 35 0 0 1 10 32 75 13 60C 0 1 37 35 2 1 4 1 35 35 19 30D 0 10 45 70 0 20 0 0 31 55 39 60
■P-■̂j

TABLE 5. (Continued) CORRELATION OF INITIAL AND FINAL NO. OF LIVE THRIPS WITH PERCENT DAMAGE INOBLIGATORY FOOD EXPERIMENTS ON 2 GUAVA TREES
Aug 11 - Sept 15, 1975 __________________Oct 23 - Nov 21, 1975___________________• Leaves 156-9 Leaves 156-4 Leaves 156-9 Leaves 156-4 Fruits 156-9 Fruits 156-4o to — — ■ ... , . . . . . .E5 P. • CO .co • cn • cn • cn • cn
• P O P . OP. o p . o p . o p . o p .rP P *P P -P 4J 2 ’H 4J 2 -P P JS -P p Z -P PP .P p pa) p ptu p ca) p p <u p a a) p pa)• p h <—' pp <u oo r _ , !p tu o o r i r i) to > - i .p <ut>o r i F <1)00 a i o o■' 2 ^ p <3 P H u 53 P H o aj P H P H O P P H OP. -PH c P 6 P P S P P B P P S P P B P P 6a) p o -p <p o p -Pm o p -p <p a)p *p <p <up -Ptp a>P -P<p a) pH M b O H Q H O H Q H O H Q H O H Q H O H Q H O H Q
A 20 7 60 34 100 1 0 4 50 77 90 73 95B 3 60 2 80 0 11 0 5 45 95 14 60C 6 5 47 80 1 15 11 20 50 95 54 70D 0 60 74 75 2 35 1 10 25 70 16 25
Correlation Initial No/ % Damage
.71695** .79071** .50424* .65309** .95128** .77262**
Correlation Final No/V, Damage .50165* .73741** .53192* .30086 .90519** .81947*** Correlation significant at the 9570 level
•HOO
populations are most noticeable in the trials in which the thrips did
not survive, leaves of 156-9 in August-September, and leaves of both
trees in October-November. When the thrips survived and multiplied,
the correlation was high between damage and final thrips number, as
well as with initial thrips number. Therefore, it is concluded that
damage ratings are not a good way to evaluate any possible antibiosis
in this test. However, under natural field conditions damage rating
may be expected to be correlated with thrips infestations since thrips
will not be forced to feed on unpalatable food sources.
Suggested Field Selection Techniques
The selection of resistant trees in the field by visual ratings
or sampling populations is not adequate, since trees with little or no
damage or few or no thrips maybe escapes, therefore further laboratory
and greenhouse testing of these apparently resistant trees is necessary.
A visual rating of trees during a severe infestation is probably the
best method for selecting apparently resistant trees. When field
populations are low sampling populations will probably be more accurate.
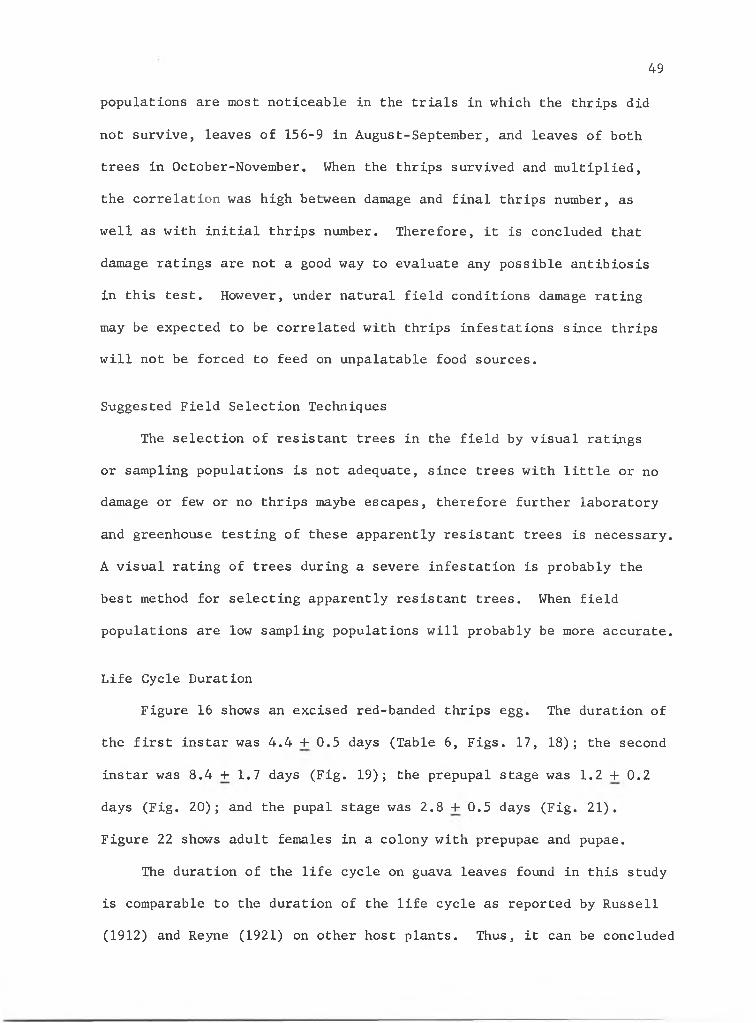
Life Cycle Duration
Figure 16 shows an excised red-banded thrips egg. The duration of
the first instar was 4.4 + 0.5 days (Table 6, Figs. 17, 18); the second
instar was 8.4 + 1.7 days (Fig. 19); the prepupal stage was 1.2 + 0.2
days (Fig. 20); and the pupal stage was 2.8 + 0.5 days (Fig. 21).
Figure 22 shows adult females in a colony with prepupae and pupae.
The duration of the life cycle on guava leaves found in this study
is comparable to the duration of the life cycle as reported by Russell
(1912) and Reyne (1921) on other host plants. Thus, it can be concluded
49

50
TABLE 6
DURATION OF THE LARVAL AND PUPAL STAGES OF THE RED-BANDED THRIPS
First Instar Second Instar Prepupa Pupa
Mean No. ofDays Duration 4.4+0.5 8.4+1.7 1.2+0.2 2.8+0.5
No. of ThripsObserved 44 24 23 21

51
FIGURE 17. ONE DAY-OLD FIRST INSTAR THRIPS (240X)

FIGURE 18. THREE DAY-OLD FIRST INSTAR THRIPS (40X)
FIGURE 19. SECOND INSTAR THRIPS (60X)

53
FIGURE 21. PUPAL STAGE (70X)

54
FIGURE 22. ADULTS IN A COLONY (15X)

that the food quality of the cultivar 'Beaumont' provides reasonable
nutrition for the thrips. Russell (1912) and Lewis (1973) have reported
that warmer temperatures speed up the life cycle of the red-banded
thrips. Therefore, it seems likely that the life cycle would be shorter
in the field since the temperature in the field is generally higher
than that in the laboratory (Table 14).
More than half of the thrips died during the course of this
experiment (Table 6). This may have been caused by the fungal-like
growth observed first on the legs of the thrips and later on other parts
of their body. It is possible that the thrips were weakened by the
fungus, and the life cycle was consequently prolonged.
Preference Between Species
The red-banded thrips strongly preferred cashew leaves over guava
leaves (Table 7). The results agree with the findings of
Ananthakrishnan and Muraleedharan (1974), so it was concluded that the
test probably could be used for detecting thrips preference among
different guava geno-types.
Preference Between an Apparently Resistant and an Apparently Susceptible Clone
The thrips showed a stronger preference for the more susceptible
clone 143 than for the more resistant clone 168 (Table 8). These
results gave further evidence that this laboratory preference test can
be used to detect differences in thrips preference. The number of
thrips on clone 168 dropped while the number on clone 148 grew from 1
day until 3 days after inoculation. This appears to show that clone
168 was not as desirable a food source as clone 143. Fecal spots,
55

56
TABLE 7
NUMBER OF THRIPS/LEAF DISK OF GUAVA AND CASHEW WITH CHI-SQUAREAND PROBABILITY VALUES
Two Days After Inoculation
ReplicationNo. of Thrips No. of Thrips
on Guava on Cashew Chi-Square df Probability
A 20 41 7.23 1 .01 - .001
B 17 38 8.02 1 .01 - .001
Totals 37 79 15.25 2
Source: Chi-Square Degrees of Freedom Probability
Totals 15.25 2
Summed Data 15.21 1 <4 .001
Homogeneity 0.04 1 .90 - .70

57
TABLE 8
THE PREFERENCE FOR CLONES 168 AND 143 EXHIBITED BY THE RED-BANDED THRIPS AS INDICATED BY THE NUMBER OF THRIPS AND FECAL SPOTS
Thrips/Clone
Days AfterInoculation Clone 168 Clone 143 Chi-Square df Probability
1 8 24 8.00 1 .01 - .001
2 2 32 26.47 1 < .001
3 0 49 48.02 1 c .001
Fecal Spots/Clone
1
2
3
0
1
5
0 0.00 0 0.000
21 18.18 1 <c.001
30 17.85 1 <.001

which are evidence of feeding, were significantly greater on clone 143
than on 168. This again supports the observation that clone 143 was a
more preferable food source than clone 168. Total number of fecal
spots per clone at the end of 2 and 3 days is significantly correlated
(r = 1.00), respectively. This indicates that fecal spots as well as
the number of thrips is a good indicator of thrips preference. Since
it is easier to count fecal spots than thrips, fecal spots should be
used as the index in the future. If quick results are desired then
thrips may be counted 1 day after inoculation.
Preference for Leaves of Clones
Data in Table 9 show that the leaves of clones 143 and 148 are the
most susceptible. 'Beaumont' and clone 196 were the next most
susceptible. Leaves of clones 180, 168, 132, 156, and 157 were the
most resistant. These differences were due to preference, but the
specific mechanisms involved are not known.
Preference For Fruits of Clones
Data in Table 10 show that fruit of clones 180 and 157 were
significantly different from the fruits of clone 132, but the remaining
8 clones were not significantly different from any of the clones. Four
clones from this experiment were tested along with 'Beaumont' and 'Ka
hua kula,' the other commercial cultivar. Only 'Beaumont' differed
significantly (Table 11) and was the most susceptible. When the 4 clones
which had the fewest number of thrips in the previous experiment were
tested together, they were further separated into least and most
preferred groups (Table 12). Clone 157 was the least preferred and clones
168 and 180 were the most preferred. The results of the three experiments
58

TABLE 9
MEAN NUMBER OF FECAL SPOTS PER LEAF DISK IN A LABORATORY PREFERENCE TEST OF 11 GUAVA CLONES 7 DAYS AFTER INOCULATION
Clones Mean No. of Spots/Disk*
180 2.3
168 2.4
132 2.7
156 3.1
157 3.6
159 7.4
176 8.1
196 9.3
Beaumont 9.8
148 15.2
143 19.4
* All means underscored by the same line are notsignificantly different at the 95% level as demonstrated by Duncan's Multiple Range Test.

TABLE 10
FRUIT PREFERENCE AMONG 11 CLONES USING YOUNG GREEN FRUITS
Clones Mean No. of Thrips/Fruit
180 5.86
157 6.13
148 7.35
196 8.92
176 9.89
168 10.76
156 14.68
143 14.68
Beaumont 16.47
159 16.81
132 18.36
* All means underscored by the same line are not significantly different at the 95%, level as demonstrated by Duncan's Multiple Range Test.

TABLE 11
FRUIT PREFERENCE AMONG 6 CLONES
Clones Mean No. i
180 6.18
157 6.95
148 7.82
168 7.94
Ka hua kula 11.32
Beaumont 20.62
* All means underscored by the same line are not significantly different at the 957> level as demonstrated by Duncan's Multiple Range Test.

TABLE 12
FRUIT PREFERENCE AMONG 4 GUAVA CLONES
*Clones Mean No. of Thrips/Fruit
157 7.79
148 8.34
168 12.98
180 13.98
* All means underscored by the same line are not significantly different at the 957, level as demonstrated by Duncan's Multiple Range Test.
seem to be somewhat contradictory and confusing since significant
differences are found between clones 157 and 180 in Table 12, while
there are no significant differences detected between these two clones
in Tables 10 and 11. Based on the findings in all 3 Tables there seems
to be very few significant differences in preference among all the
clones. Further research should be carried out to clarify these
findings.
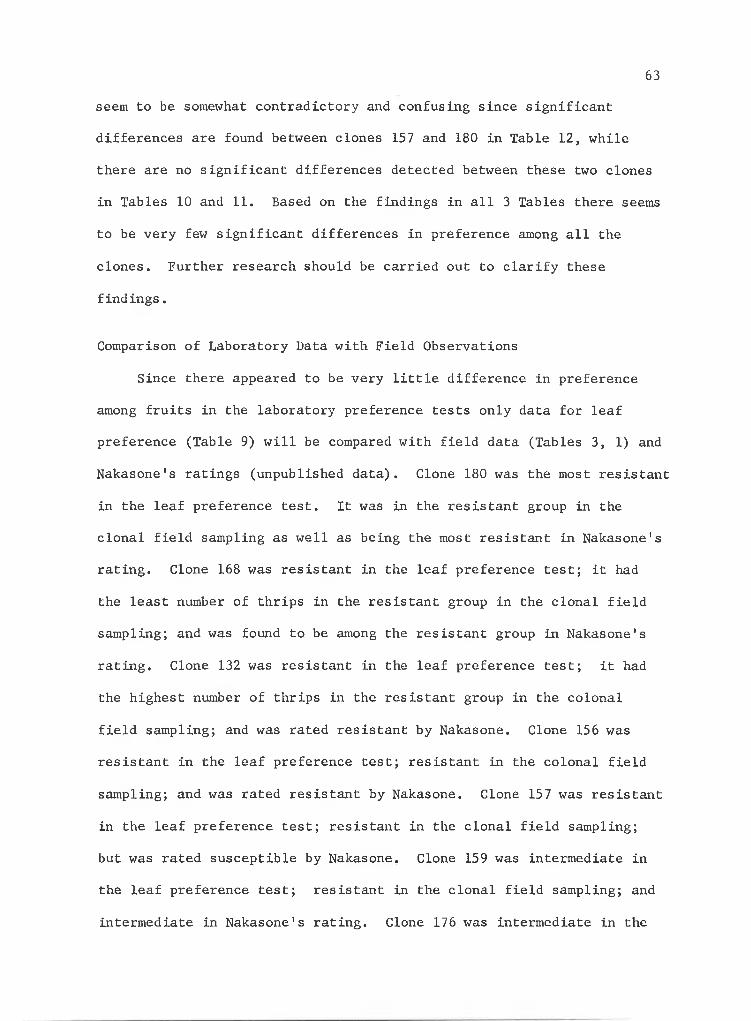
Comparison of Laboratory Data with Field Observations
Since there appeared to be very little difference in preference
among fruits in the laboratory preference tests only data for leaf
preference (Table 9) will be compared with field data (Tables 3, 1) and
Nakasone's ratings (unpublished data). Clone 180 was the most resistant
in the leaf preference test. It was in the resistant group in the
clonal field sampling as well as being the most resistant in Nakasone's
rating. Clone 168 was resistant in the leaf preference test; it had
the least number of thrips in the resistant group in the clonal field
sampling; and was found to be among the resistant group in Nakasone's
rating. Clone 132 was resistant in the leaf preference test; it had
the highest number of thrips in the resistant group in the colonal
field sampling; and was rated resistant by Nakasone. Clone 156 was
resistant in the leaf preference test; resistant in the colonal field
sampling; and was rated resistant by Nakasone. Clone 157 was resistant
in the leaf preference test; resistant in the clonal field sampling;
but was rated susceptible by Nakasone, Clone 159 was intermediate in
the leaf preference test; resistant in the clonal field sampling; and
intermediate in Nakasone's rating. Clone 176 was intermediate in the
63

leaf preference test; resistant in the clonal field sampling; and was
intermediate in Nakasone's rating. Clone 196 was susceptible in the
leaf preference test; resistant in the clonal field sampling; and was
resistant in Nakasone's rating. 'Beaumont' was susceptible in the leaf
preference test; the most susceptible in the clonal field sampling; and
was also susceptible in Nakasone's rating. Clone 148 was susceptible
in the leaf preference test; but it was resistant in the clonal field
sampling; and it was also resistant in Nakasone's rating. Clone 143
was the most susceptible in the leaf preference test; resistant in the
clonal field sampling; and it was the most susceptible in Nakasone's
rating.
The correlation between the mean number of thrips found on leaves
of clones in the field (Table 3) with the mean number of fecal spots
per clone (Table 9) was non-significant (r = .2212). The correlation
between Nakasone's rating of clones with mean number of fecal spots
per clone (Table 9) was also non-significant (r = -.4851). On the
other hand, the correlation between the total number of thrips found
on progenies of clones (Table 1) was highly correlated (r = .8275) with\
the mean number of fecal spots per clone in the laboratory leaf
preference test (Table 9).
The lack of correlation between the clones in the laboratory and
the clones in the field is probably due to the low thrips population in
the field. Many of those trees with few or no thrips may have been
escapes. This would account for the discrepancies between the findings
in the field and those in the laboratory. Populations in the seedling
trees were found to be much higher than in the clonal trees. This may
account for the significant correlation between clones in the laboratory
64

and progeny of clones in the field. According to Painter (1968) cage
tests are ordinarily more severe than a field test for resistant
varieties because the level of infestation is usually higher. Never
theless the results from cage tests usually check fairly well with
field results. Painter (1968) goes on to state that the validity of
cage and greenhouse tests must be checked repeatedly under field
conditions. Thus the following steps should be taken to further test
the most resistant varieties already identified in the preliminary
tests of this study: 1) laboratory antibiosis test; 2) greenhouse
preference test; 3) greenhouse antibiosis test; and 4) field test.

SUMMARY AND CONCLUSIONS
Sampling Thrips
1. Thrips populations were found to be low and thrips damage
was minimal during the year of this study.
2. Prevailing rainfall and temperatures were not correlated
with the size of thrips populations.
3. Some susceptible trees were easily identified by sampling
but the population pressure was not great enough to be able
to identify the most resistant trees. 'Beaumont' was the
only susceptible one among the clones sampled, while
seedlings of clones 143 and 148 were the most susceptible
among the open pollinated progenies of clones sampled.
4. The majority of the thrips population were found to
aggregate in a few trees.
Obligatory Food Tests
1. Thrips survived and reproduced better on fruits than on
leaves.
2. Silvering and russeting were correlated with the number of
thrips found on leaves and fruits.
Life Cycle Duration
1. The life cycle of the red-banded thrips on leaves of
'Beaumont' guava was found to be 4.4 + 0.5 days for the
first larval instar, 8.4 + 1.7 days for the second larval
instar; 1.2 + 0.2 for the prepupa and 2.8 + 0.5 for the pupa.

D. Leaf Preference Tests in Laboratory
1. The leaf preference test developed in this study worked
well as the first step in screening for thrips resistance
in clones in the laboratory.
2. The number of fecal spots and/or the number of thrips per
leaf disk can be used as an index to rate thrips
preference for leaves.
3. Leaves of clones 143, 148, 'Beaumont' and 196 were the most
susceptible.
4. Leaves of clones 168, 180, 132, 156 and 157 were the most
resistant.
E. Fruit Preference Tests in Laboratory
1. The fruit preference test developed in this study showed very
few differences in thrips resistance in clones in the
laboratory.
F. Comparison of Laboratory and Field Results
1. Clones 180, 168, 132 and 156 were the most resistant.
2. Clones 143, 148 and 'Beaumont' were the most susceptible.
3. Clones 157, 159, 156 and 196 were intermediate in resistance.
67

APPENDIX

TABU 13
DAILY PRECIPITATION mm - WAIMANALO EXPERIMENTAL FARM
D A T O P M O N T H
- i s U » » 1* » 16 V H
112.75 .25 1.75 .50 1.25 1.25 1.50 1.50 .50 .25 2.50 10.00 51.50 15.25 15.00
32.25 15.75 . 50 1.75 1.00 . 50 . 50 1.75 1 .00 1.25 . 25 5.00 . 50 2.00 .50
l ’ -00 2.75 3.75 .50 1.50 .50 1.00
5.50 . 7 5 .50 3.00 1.25
20.25 1.75 1.50 1.75 .25 3.00 1.00 *.25 4.75
11.00 2.75 .50 .25 1.25 2.00 1.00 .50 1.25
9.00 1.75 .25 4.25 1.30 .75
23.00 1.00 1.00 .50 1.25 3.75 2.50 4.25 .50 1.75 2.50 .75 .25 .25 2.75
246.25 . 25 . 75 . 75 . 50 2.75 3.00 . 25 1.00 . 50 1.75 . 50 5.50 1.00 10.25 3.00 35.50 21.00 74.00 *5.50 .1.00
23.75 2.00 1.75 3.00 2.50 6.75 4.75 2.00 .25 .25 .25 .25
7*.25 *.00 .25 .25 2.25 .75 1.25 .75 16.50 1.00 3.50 5.75 .75 .25 3.00
1*5.50 . 75 . 50 . 50 36.50 68.00 34.00 1.50 . 25 4.50 3.00 . 50 . 75 . 25 5.25 . 50 .25 2*.00
766.50
Umacm- O.S. Vaathar luruo - Cllaatologlcal Data - Hawaii, April 1975-March 1974
O'VO

TABLE 14
DAILT TEMPERATURE °C VADtANALO EXPERIMENTAL FARM
D A Y O P M O N T H
13 14 15 16 17 18
27.216.7
28.3 27.8 27.2 26.7 26.118.3 20.0 20.0 20.0 19.4
27.2 27.8 28.3 28.9 28.3 27.1
SEP
OCT
19 76
JAN
21.1 21.7 22.2 22.8 21.1 21.1
28.3 27.8 28.3 28.3 28.3 28.323.3 22.2 22.2 22.8 21.7 22.2
21.7 23.3 23.3 22.8 21.7 22.8
23.9 24.4 23.9 25.6 25.6 26.120.0 21.1 21.1 22.2 21.1 19.4
25.617.2
tourca: D.S. Vaathar Bureau Cl tau to log ica l Data - Hawaii, A p r il 1975-March 1976
o

71
LITERATURE CITED
Abdel-Gawaad, A. A., F. H. El-Gayar, A. S. Soliman, and 0. A. Zaghlool. 1973. Studies on Thrips tabaci Lind. X. Mechanism of Resistance to Thrips tabaci in Cotton Varieties. Z. Angew Entomol.73:251-255.
Allen, B. M. 1967. Malayan Fruits. Donald Moore Press, Ltd., Singapore, pp. 125-127.
Ananthakrishnan, T. N. 1971. Thrips (Thysanoptera) in Agriculture, Horticulture and Forestry- Diagnosis, Economics and Control. J. Scient. Ind. Res. 30: 113-140.
__________ and N. Muraleedharan. 1974. On the Incidence and Effectsof Infestation of Selenothrips rubrocinctus Giard (Thysanoptera, Heliothripinae) on Free Amino Acids of Some Susceptible Host Plants. Current Science. 43 (7):216-218.
Bagnall, R. S. 1910. Fauna Hawaiiensis Cambridge University Press, Cambridge, Mass. 3:699.
Bailey, S. F. 1935. Thrips as Vectors of Plant Disease. J. Econ. Ent. 28:856-863.
Brekke, J. E. 1973. Guava Processing. C.E.S. and H.A.E.S. University of Hawaii Miscellaneous Publication 111, pp. 6-7.
Bottger, G., E. T. Sheehan and M. J. Luke-Fehr. 1964. Relation of Gossypol Content of Cotton Plant to Insect Resistance. J. Econ. Ent. 57:283-285.
Bullock, R. M. 1973. Guava Production and Processing. C.E.S. and H.A.E.S. University of Hawaii Miscellaneous Publication 111, pp. 2-3.
Callan, E.McC. 1943a. Thrips Resistance in Cacao. Tropical Agriculture, Trinidad. 20 (7):127-135.
_________ . 1947. Technique for Rearing Thrips in the Laboratory.Nature. 160:432.
Chandler, W. H. 1964. Evergreen Orchards. Second Edition. Lea and Febiger, Philadelphia, pp. 326-333.
Cochran, W. G. and G. M. Cox. 1957. Experimental Designs. Second Edition. John Wiley and Sons, New York. pp. 611.
Cooperative Economic Insect Reporter. 1967. U.S.D.A. Plant Protection and Quarentine Program. 17 (5):63.

72
Cooperative Economic Insect Reporter. 1968. U.S.D.A. Plant Protection and Quarentine Program. 18 (33):802.
_. 1969. U.S.D.A. Plant Protection and QuarentineProgram. 19 (31):609.
_. 1974. U.S.D.A. Plant Protection and QuarentineProgram. 24 (25):468.
Duncan, D. B. 1955. Multiple Range and Multiple F Tests.Biometrics. 11:1-42.
Fennah, R. G. 1963. Nutritional Factors Associated with SeasonalPopulation Increases of Cacao Thrips (Selenothrips rubrocinctus Giard) on Cashew (Anacardium occidentale). Bull. Ent. Res. 53:681-713.
Gawaad, A. A. A. and A. S. Soliman. 1972. Studies on Thrips tabaci Lind. IX. Resistance of Nineteen Varieties of Cotton to Thrips tabaci Lind, and Aphis gossypii. Z. Angew Entomol. 70:93-94.
Gerakas, A. and C. Lee. 1974. Profit Potentials in Hawaii1s Guava. Department of Planning and Economic Development, State of Hawaii, pp. 91.
Hamilton, R. A. and H. Seagrave-Smith. 1954. Growing Guava forProcessing. Extension Bulletin 63, University of Hawaii, pp. 3-8.
Hamilton, R. A. and N. S. Wenkam. 1967. Nutritive Values of Major Fruit Crops Grown in Hawaii. H.A.E.S. University of Hawaii: Miscellaneous Paper No. 198. pp. 9.
Johansen, N, R. M. 1974. Four Species of Thrips on Cacao in Tabasco, Mexico. Revista Theobroma. 4 (l):29-38.
Jones, H. A., S. F. Bailey, and S. L. Emsweller. 1934. Thrips Resistance in the Onion. Hilgardia. 8:215-232.
Kinzer, R. E., S. Young, and R. R. Walton. 1972. Rearing and Testing Tobacco Thrips in the Laboratory to Discover Resistance in Peanuts. J. Econ. Ent. 65. (3):782-785.
Lewis, T. 1973. Thrips - Their Biology, Ecology and Economic Importance. Academic Press, New York. pp. 349.
Mitchell, W. C. 1973. Insect and Mite Pests of Guava. C.E.S. and H.A.E.S. University of Hawaii Miscellaneous Publication 111,
Mound, L. A. 1971. The Feeding Aparatus of Thrips. Bull. Ent. Res. 60:547-548.

73
Nakasone, H. Y., J. E. Brekke and C. G. Cavaletto. 1976. FruitYield Evaluation of Ten Clones of Guava (Psidium guajava 1.). H.A.E.S. and C.T.A. University of Hawaii Research Report 218,pp. 16.
Neal, M. C. 1965. In Gardens of Hawaii. Bishop Museum Press, Honolulu, Hawaii, pp. 632-633.
Painter, R. H. 1968. Insect Resistance in Crop Plants. The University Press of Kansas, Lawrence and London, pp. 520.
Peterson, A. 1947. A Manual of Entomological Equipment and Methods. Fifth Edition. Edwards Bros, Ann Arbor, Michigan, plate #31.
Purseglove, J. W. 1968. Tropical Crops - Dicotyledons. John Wiley and Sons, New York, pp. 414-419.
Reyne, A. 1921. De Cacaothrips. (Heliothrips rubrocinctus, Giard). Bull. Dept. Landb. Suriname 44, pp. 195-214.
Ruehle, G. D. 1948. The Guava, A Neglected Fruit with a PromisingFuture. Econ. Bot. 2 (3):306-325.
Russell, H. M. 1912. The Red-Banded Thrips. Bull. Bur. Ent.U.S.D.A. 99, pp. 17-29.
Smith, K. L. 1953. Growing and Preparing Guavas. Dept, ofAgriculture Tallahasse, Florida, pp. 48.
Snedecor, G. W. and W. G. Cochran. 1967. Statistical Methods.Sixth Edition. Iowa State University Press, Ames, Iowa, pp. 593.
U.S. Weather Bureau. 1970. U.S. Department of Commerce. Climatolo- gical Data - Hawaii. 66(13):5, 9.
1971. U.S. Department of Commerce. Climatological Data -Hawaii. 67(13):5, 9.
1972. U.S. Department of Commerce. Climatological DataHawaii. 68(13):5, 9.
1973. U.S. Department of Commerce. Climatological Data -Hawaii. 69(13):5, 9.
1974. U.S. Department of Commerce. Climatological Data -Hawaii. 70(13)5, 9.
1975. U.S. Department of Commerce. Climatological Data -Hawaii. 71(13):5, 9.
1976. U.S. Department of Commerce. Climatological DataHawaii. 72(13):5, 9.

74Urich, F. W. 1911. The Cacao Thrips (Heliothrips rubrocinctus,
Giard). Circular Board of Agriculture Trinidad, pp. 10.
_____ . 1928. San Thome Cacao Industry. Trop. Agric. Trinidad.5:275-278.
Wardle, R. A. and R. Simpson. 1927. The Biology of Thysanopterawith Reference to the Cotton Plant, III. The Relation Between Feeding Habits and Plant Lesions. Ann. Appl. Biol. 14:513-528.
Young, S., R. E. Kinzer, R. R. Walton, and R. S. Matlock. 1972. Field Screening for Tobacco Thrips Resistance in Peanuts. J. Econ.Ent. 65 (3):828-832