identifying factors that cause inventory build-ups and how to...
TRANSCRIPT

Akademin för Innovation, Design och Teknik
Identifying factors that cause
inventory build-ups and how to
solve it
Bachelor thesis,15 hp
Product and process development
Anders Eriksson and Anes Music
Supervisor, Company X: Value stream manager
Supervisor, Mälardalens högskola: Yuji Yamamoto
Examiner: San Aziz

2 (50)
Abstract
Companies have put much focus on production systems to generate and maintain
competitiveness which has contributed in less focus to logistics. The material flow is the
process after the main processes and has therefore been regarded as “unimportant”. If the
material flow fails, there can be consequences such as inventory-build ups or undersupply of
material. Lean thinking is one strategy that may be applied to analyze and identify wastes, but
the identification of problems has been harder to detect, while the ability to solve them has not
improved at the same rate.
Following two research questions has been asked to identify how companies should proceed to
improve their inventory management but also what factors contribute to the inventory build-
ups.
• What may cause excess inventory in manufacturing companies?
• How can a manufacturing company reduce WIP´s?
The research method is based on a qualitative approach with an interpretivist research
methodology to help answer the questions. A case study was done at a manufacturing company
to help answer the research questions. The data has been collected by observations trough
section B1 and unstructured interviews with both management and operators. The collected
data was later compared to the literature according to the inductive reasoning to be able to
make suggestions for improvements. The DMAIC tool has been a central point of this research
regarding the mapping of the current state and suggestion of a future state.
The case study was conducted at Company X AB in the middle of Sweden which is a company
that manufactures components and complete solutions. The focus on production has resulted in
less focus on the internal logistics. With the low focus on the internal logistics, inventory build-
ups have occurred.
The results points to the OEE being a contributing factor to the inventory build-up. The
availability of the both machines was low and therefore caused the OEE to be low. The low
availability was caused by long changeovers, staff shortages and emergency reparations. The
conclusions are that Company X must make improvements so that the factors of the low
availability decrease in frequency and severity to reduce the work-in-process (WIP). The
improvements should be approached with different lean-tools such as SMED, KANBAN, FIFO
and 5S.
Keywords: Lean, KANBAN, Internal logistics, FIFO, Inventory build-ups, standardized work

3 (50)
Sammanfattning
Företagen har lagt stort fokus på produktionssystem för att skapa och behålla
konkurrenskraftigheten vilket har bidragit till mindre fokus på logistiken. Materialflödet är
processen efter huvudprocesserna och har därför inte betraktats som lika viktigt. Om
materialflödet misslyckas kan det finnas konsekvenser som lageruppbyggnad eller
underutnyttjande av material. Lean thinking är en strategi som kan användas för att analysera
och identifiera slöserier, men identifieringen av problem har blivit svårare att upptäcka, medan
förmågan att lösa dem inte har förbättrats i samma takt. Följande två undersökningsfrågor har
ställts för att identifiera hur företag kan förbättra sin lagerhantering, men även vilka faktorer
som bidrar till lageruppbyggnader.
1. Vad kan orsaka lageruppbyggnad i producerande företag??
2. Hur kan företag minska produkter i arbete?
Forskningsmetoden är baserad på ett kvalitativt tillvägagångssätt med en interpretivistisk
forskningsmetodik som hjälper till att svara på frågorna. En fallstudie har genomförts på
företag X för att bidra med empiri och underlätta att svara på forskningsfrågorna. Uppgifterna
har samlats genom observationer och ostrukturerade intervjuer med både ledning och
operatörer. Den samlade datan jämfördes senare med litteraturen enligt det induktiva
resonemanget för att kunna ge bra förslag på förbättringar. DMAIC-verktyget har varit en
central punkt i denna forskning vad gäller kartläggning av nuvarande situation och förslag på
framtida förbättringar.
En fallstudie är genomförd på Company X AB som är etablerat i Mellansverige och är ett
företag som tillverkar motorkomponenter och kompletta lösningar till olika lastbilsföretag. Ett
stort fokus på produktion har resulterat i mindre fokus på den interna logistiken. Med ett lägre
fokus på den interna logistiken har lageruppbyggnader uppstått.
Resultaten från fallstudien pekar på att den låga OEE:n var en bidragande faktor till
uppbyggnaden av lager. Den låga tillgängligheten orsakades av långa omställningar,
personalbrist och akuta reparationer. Slutsatserna är att Company X måste göra förbättringar
inom faktorerna som orsakar låg tillgänglighet minskar i frekvens och tidskonsumption för att
minska produkterna i arbete. Förbättringarna bör tas fram med hjälp av olika leanverktyg som
SMED, KANBAN, FIFO och 5S.

4 (50)
Acknowledgement
We would like to express sincere gratitude to the Value stream manager at Company X. The
value stream manager helped us through the whole project and supported us with answers and
explanations to all the question that came up.
We also would direct a special thanks to Yuji Yamamoto, our supervisor from Mälardalens
Högskola. Yuji´s great knowledge contributed with guiding us down the right path and keeping
us motivated throughout the whole process.
Last but not the least, we would thank everyone involved helping us throughout the bachelor
thesis, family, friends and also the operators at Company X that helped us understand the
current state and standards.

5 (50)
Table of Contents
1. INTRODUCTION .......................................................................................................................................... 8
BACKGROUND ........................................................................................................................................... 8 PROBLEM FORMULATION ........................................................................................................................... 8 RESEARCH OBJECTIVES ............................................................................................................................. 9 DELIMITATIONS ......................................................................................................................................... 9
2. RESEARCH METHODOLOGY ................................................................................................................ 10
RESEARCH APPROACH ............................................................................................................................ 10 LITERATURE STUDY ................................................................................................................................ 10 CASE STUDY ............................................................................................................................................ 10 DATA COLLECTION .................................................................................................................................. 10 OBSERVATIONS ....................................................................................................................................... 11 INTERVIEWS ............................................................................................................................................ 11 ANALYSING OF DATA .............................................................................................................................. 11 RELIABILITY & VALIDITY ....................................................................................................................... 12
3. THEORETICAL FRAMEWORK .............................................................................................................. 13
STRATEGIES TO REDUCE WIP´S ............................................................................................................... 13 3.1.1. INVENTORY MANAGEMENT ................................................................................................................. 13 3.1.2. CONTROLLING INVENTORY-LANES WITH FIFO ................................................................................... 13 3.1.3. VISUALIZING THE PRODUCTION TO PREVENT OVERPRODUCTION BY USING KANBAN .......................... 14 3.1.4. REDUCING THE WIP LEVELS BY IMPLEMENTING VISUAL CONTROL.................................................... 15 3.1.5. STANDARDIZED WORK ........................................................................................................................ 16 3.1.6. KAIZEN ............................................................................................................................................... 17 3.1.7. STRUCTURE THE WORKPLACE WITH THE 5S TOOL ............................................................................... 17
FACTORS THAT MAY CAUSE EXCESS INVENTORY ..................................................................................... 19 3.2.1. REDUCING THE EXCESS INVENTORY WITH A PROPER WASTE MANAGEMENT ....................................... 19 3.2.2. SOLVING INVENTORY-BUILDUPS BY ACHIEVING HIGH OEE ................................................................ 19 3.2.3. MAINTAIN THE MACHINES TO ACHIEVE A HIGHER OEE ...................................................................... 20 3.2.4. SMED (SINGLE MINUTE EXCHANGE OF DIES) FOR REDUCING CHANGEOVER TIME .............................. 21 3.2.5. MULTI-SKILLED WORKFORCE TO PREVENT LOW AVAILABILITY .......................................................... 22
4. EMPIRICAL FINDINGS ............................................................................................................................ 23
CASE STUDY ............................................................................................................................................ 23 PRODUCTS IN FLOW 1 .............................................................................................................................. 23 LAYOUT / PROCESS ................................................................................................................................. 24 INVENTORY AREAS AND VISUAL CONTROL .............................................................................................. 25 LARGE QUANTITY INVENTORIES .............................................................................................................. 26 PALLETS .................................................................................................................................................. 27 TAKT ..................................................................................................................................................... 27 MACHINES ............................................................................................................................................... 27 OEE ........................................................................................................................................................ 28
CHANGEOVERS ........................................................................................................................................ 31 STAFF SHORTAGES .................................................................................................................................. 31 FILTER CLEANING .................................................................................................................................... 32 MAINTENANCE ........................................................................................................................................ 32 DEFECTS .................................................................................................................................................. 32 PRODUCTION PLANNING .......................................................................................................................... 32 OPERATORS ............................................................................................................................................. 33 PACKAGING ............................................................................................................................................. 33 TRANSPORTS ........................................................................................................................................... 33 NOTES ..................................................................................................................................................... 34 AXOS ..................................................................................................................................................... 34 DAILY MEETINGS ..................................................................................................................................... 35
5. ANALYSIS .................................................................................................................................................... 36
LAYOUT .................................................................................................................................................. 37
6 (50)
INVENTORY MANAGEMENT ..................................................................................................................... 37 KANBAN .................................................................................................................................................. 38 PRODUCTION FLOW ................................................................................................................................. 38 PRODUCT SCHEDULING ............................................................................................................................ 38 VISUAL CONTROL .................................................................................................................................... 39 OEE ........................................................................................................................................................ 39
5.7.1. CHANGEOVERS ................................................................................................................................... 40 5.7.2. MAINTENANCE .................................................................................................................................... 41 5.7.3. DEFECTS ............................................................................................................................................. 41 5.7.4. STAFF SHORTAGES .............................................................................................................................. 41 5.7.5. CHANGEOVER ..................................................................................................................................... 41
6. SUGGESTIONS FOR IMPROVEMENTS ................................................................................................ 43
OEE ........................................................................................................................................................ 43 PLANNING ............................................................................................................................................... 44 PEOPLE .................................................................................................................................................... 44 PROCESS .................................................................................................................................................. 44
7. CONCLUSION ............................................................................................................................................. 47
DISCUSSION ............................................................................................................................................. 47
8. REFERENCES ............................................................................................................................................. 49

7 (50)
Abbrevations
AXOS – Software which Company X uses to gather data from their processes.
DMAIC – Process improvement model
FIFO – First-in First Out
JIT – Just-in-Time
MC – Machine Cell
OEE – Overall equipment effectiveness
OUT1,2 – Outbound goods 1,2
SMED – Single minute exchange of die
TAKT – Pace which the production has to keep satisfying the customer demand
MC 1 – Type of machine
WIP – Work in process

8 (50)
1. Introduction
This chapter contains the Background of the study and is thereafter narrowed down to Problem
formulation, Research objectives and Delimitations of the project.
Background
Global companies must stay competitive to meet the customer demand for just-in-time
deliveries. To generate and maintain competitiveness, the proper flow of materials throughout
the manufacturing process is needed. Although, to remain competitive, the manufacturing
companies have been redesigning their production systems and implementing novel
technologies. The focus on the production system has resulted in high level of responsiveness
in flexibility to the customers but therefore contributed to minor attention to the logistics
(Negri, Perotti, Fumagalli, Marchet & Garetti, 2017).
The definition of logistics is transportation and storage of materials, parts and products in a
supply chain. The outbound and inbound processes from and to the warehouse or factory is
considered as logistics as well as internal and external material handling and transport (Zijm,
Klumpp, Regattieri, & Heragu,2019). The material flow in a producing company is the process
that is followed by the main processes which creates no value to the company, but it guarantees
that the value-adding processes can perform accurate. Because material flow in a producing
company is the process after the main-processes, it often regarded as an unimportant process. A
material flow has the task to supply and dispose operational units, like machines, in time. If the
material flow fails, there can be consequences such as material hold-ups or undersupply of
material. Quality is a key factor of material handling where quality heavily depends on the
commitment of coworkers because the operations within material handling is man based
(Schulze and Wüllner, 2006).
The main goal of material flow is a continuous and synchronous flow. The meaning of a
continuous flow is that there should be no interruptions and no unnecessary holdings of
inventory. Having a synchronous flow refers to that part is delivered on time, in the proper
time, exactly when they are needed. Overproduction, producing too much, too early or just in
case, is one factor that can cause unevenness of the material flow and is considered the largest
source of waste (Harrison & Hoek, 2008). Overproduction is also one of the seven major types
of non-value-adding wastes according to Liker (2004). Lean thinking is one strategy to use for
analyzing the process systematically to identify the incidence of the wastes where the aim
includes parts to flow through the processes evenly. The application of lean thinking involves
examination of the process, quantifying waste within it, identification of the root cause of the
waste, develop and implement solutions (Harrison & Hoek, 2008).
Problem formulation
It may be difficult for companies to know what may cause disturbances in the material flow
because the material flow is often regarded as an unimportant process according to Schulze and
Wüllner (2006). Organizations have invested considerable time and effort to improve their
processes, but it is not unusual to see the same problems returning. Insufficient effort has been
put on providing guidance on how to identify the causes of problems with effective diagnoses
and companies often implement quick fixes hoping it will address the problem. The
identification of problems has been harder to detect, but the ability to solve them has not
improved at the same rate (Okes, 2009). Furthermore, the more a company overproduces and
creates excess WIP’s, it becomes more difficult in keeping track of quality issues as Liker
(2004) describes.

9 (50)
Therefore, it is worth investigating what may cause disturbances in the material flow and how
to solve the problems. The material flow is especially interesting because it is not as prioritized
as the main-processes.
Research objectives
The purpose of the bachelor thesis is to find what factors could be causing excess inventory in
manufacturing companies. With excess inventory, the company will have more WIP´s than
needed, therefore it would be interesting to find how to control the production when the root
cause of the excess inventory is found.
• What may cause excess inventory in manufacturing companies?
• How can a manufacturing company reduce WIP´s?
Delimitations
Due to the length of the thesis, the DMAIC-model which was followed could not be followed
through fully. The improvements are suggestions and not something that is implemented, and
the control phase is not covered in the thesis.
The time-limit of the bachelor thesis was 20 weeks. Therefore, one case study was conducted
to collect the right amount of data. The case study was project-based on one company in the
manufacturing industry in Sweden.

10 (50)
2. Research methodology
The method chapter provides information about which Research Approach was used, how the
Literature study was conducted and how the Analysis of data was made.
Research Approach
To be able to understand the problem the thesis investigated, the research is based on the
qualitative and the interpretivist approach to try and answer the research objective. The
interpretivist approach mainly uses observations, interviews and other forms of data to be able
to understand a certain phenomenon. Mast and Lokkerbol (2012) states that when trying to
understand a situation, the idea of walking around in the production is a good. The reasoning
behind choosing the interpretivist approach was that the research questions would provide a
better answer if the data was collected through observations, data and interviews (Williamson,
2002).
By using the interpretivist approach, the inductive reasoning was also applied. The inductive
reasoning is used with the empirical data in combination with the different types of literature,
articles, books and interviews. The motive behind doing so is to find a pattern within the data
(Williamson, 2002).
The mapping of the current state and the suggestion of the future state was based on a DMAIC
cycle. DMAIC is a common tool to use when there is a desire and a need to make
improvements throughout different types of industries (Koning & Mast, 2006). Because of the
problem required a large collection of data and the problem was not clearly defined, the
DMAIC was chosen as a method to answer the research questions. The five steps which
DMAIC consists of are define, measure, analysis, improve, control (Mast & Lokkerbol, 2012).
Literature study
The theoretical framework is based on literature in the form of books and articles. Finding the
articles was done mainly through the databases of MDH Primo, Google Scholar and
ScienceDirect. The literature was used to provide a base for the thesis, with information
regarding the issues which Company X had. The theoretical area was internal logistics, but
throughout the thesis, there was a need of expanding the area to production to understand
Company X´s problem. The theoretical framework is used in combination with the empirical
data gathered from Company X to analyze the current situation. The articles presented in the
thesis is peer-reviewed in order to be certain of its quality (Williamson, 2002).
Case study
When trying to understand a problem or phenomena, the use of a case study is useful. A case
study could be used to investigate the problem in the natural setting. In the thesis, a single-case
study was conducted at a manufacturing company to assist in answering the research questions.
The reason for conducting a case study was to find data on the subject and compare it to the
theoretical framework (Williamson, 2012).
Data collection
The collection of the data was done through visiting Company X during several times in the
period of 2019-01-01 to 2019-04-23. To be able to reduce the WIP’s and keeping track of the
products throughout the production flows, the current standard needed to be mapped and
analyzed. The step of defining the current standard was done by walking through the

11 (50)
production floor and observing where the operators placed the materials throughout the entire
production flow.
To complement the data from the observations, unstructured interviews was conducted with the
operators. Unstructured interviews according to Holloway and Wheeler (2010) often start with
a broad open question concerning the area of study and narrows down to more specific
questions depending on what the responses are. Therefore, unstructured interviews were chosen
to generate qualitative data and so that the operator can talk about where the problem lies.
Lastly, the data from AXOS and a Value-Stream map of the processes, a current state was
constructed. The reason was that these methods would give a more accurate picture of the
entire section and see the important processes which Mast and Lokkerbol (2012) stated when
investigating a problem in a production system.
Observations
Observations are a part of the interpretivist approach and is used to provide an understanding of
the problem (Williamson, 2012). Furthermore, Mast and Lokkelbol (2012) strengthen that
theory that observations are a great way of understanding a problem, particularly in production
areas. The method used to observe the section was what Williamson (2012) calls, ‘Ad libitum’
which is less systematic and relies on the impressions the observers get. During the
walkthroughs that occurred each visit to Company X, observations were made and written
down on paper. The observations could be in various forms such as material flow patterns, how
the operators handled the products and numbers of articles in the storages.
Interviews
Interviews were performed at Company X in order to gather information on how the current
state was. The candidates for the interviews were both from management and the operators in
order to understand the situation from all perspectives. The interview strategy that was used
was the unstructured style. It meant that no set numbers of questions were used as a base, but
with the freedom of the interviewee to speak freely to gain insight about the problem
(Williamson, 2002). The questions were mainly about the standards but also questions about
how the production works. The interviews which was conducted at Company X was not
recorded due to the high-noise level, although the answers to the questions were written down
on paper during the interviews.
Analysing of data
The analysis of the data was comprised of two parts, one after the first visit to the case
company and the second after all empirical data was compiled. Conducting an analysis with an
interpretivist approach has the goal of providing an understanding of the problem or
phenomenon. Also, the analysis is a way to structure and get a clear picture of the data gathered
(Williamson, 2002).
The first analysis that was performed after the first visit and the aim was to investigate the
critical factors to the inventory build-up. To identify the factors what could cause the effect of
inventory build-up, the Ishakawa-diagram was used. An Ishakawa-diagram (cause-and-effect)
is used to find the causes of a certain phenomenon (effect) by using brainstorming for example
(Dahlgaard, Kristensen & Kanji, 2002). Once the Ishakawa-diagram was constructed with the
factors and sub-factors stated, the different factors that could contribute the most to the
inventory build-up was identified

12 (50)
The second data analysis was performed once the Ishakawa-diagram was complete by
combining the data gathered from case study through the observations, unstructured interviews
and AXOS with the theoretical framework. Furthermore, as the data had been analysed, the
suggestions for the improvements could be made.
Reliability & Validity
To ensure that the bachelor thesis achieved high reliability, the chosen literature was taken
from peer-reviewed sources only. The interviews were conducted with several operators to
gather information about the problem, whereas having data from multiple sources would
increase the reliability. The gathered data from AXOS ranged from the period 2019-01-01 to
2019-03-06 in order to reduce the fluctuations that can occur if only choosing data from one
specific date. By having the data gathered from a longer period, the data would become more
reliable and valid (Williamson, 2002).
13 (50)
3. Theoretical framework
The theoretical framework is split into two sections, which corresponds to the two research
questions. The first section will provide insight in different strategies in reducing the WIP’s in
flow 1. The second section covers the area of what might be the cause of the build-up of WIP’s.
Strategies to reduce WIP´s
The following theories contains information on what should be done to reduce WIP´s and the
benefits achieved by following the strategies.
3.1.1. Inventory management
To be able to have an efficient flow through production, the layout of the different flows has to
be placed in an optimal place. Placing the machines in a manner where the material is not
transported in a logical and optimal way may be costly for the companies. By optimizing the
material flow, it could lead to a reduction in the costs of material, the WIP’s and lastly, the time
to create a finished product (Chan & Tay, 2016). Also, a study conducted by Taj (2008)
investigated 65 manufacturing plants across China. The conclusion of the study was that the
areas of layout design, inventory handling by managers and setup times was the lowest scores
according to the data from the questionnaires.
A surplus in the inventories might come from several reasons. Kalagnanam, Dawande, Trumbo
and Lee (2000) suggested in their study that the surplus of inventory could come about because
of three reasons. Firstly, the orders which had been produced was no longer wanted by the
customers. Secondly, the quality of the products did not meet the customer's demand. Lastly,
the surplus of inventory was produced in order to make up for an unstable process with a low
OEE or other issues which related to production. According to Beullens and Janssens (2011)
that having surplus inventory can assist in meeting fluctuations in the market, the costs of
holding products in inventory might be costly as it affects the product and the company in
various ways. The definition of holding costs include cost of storage, deterioration, products
not needed anymore, handling the products plus the invested capital in the products.
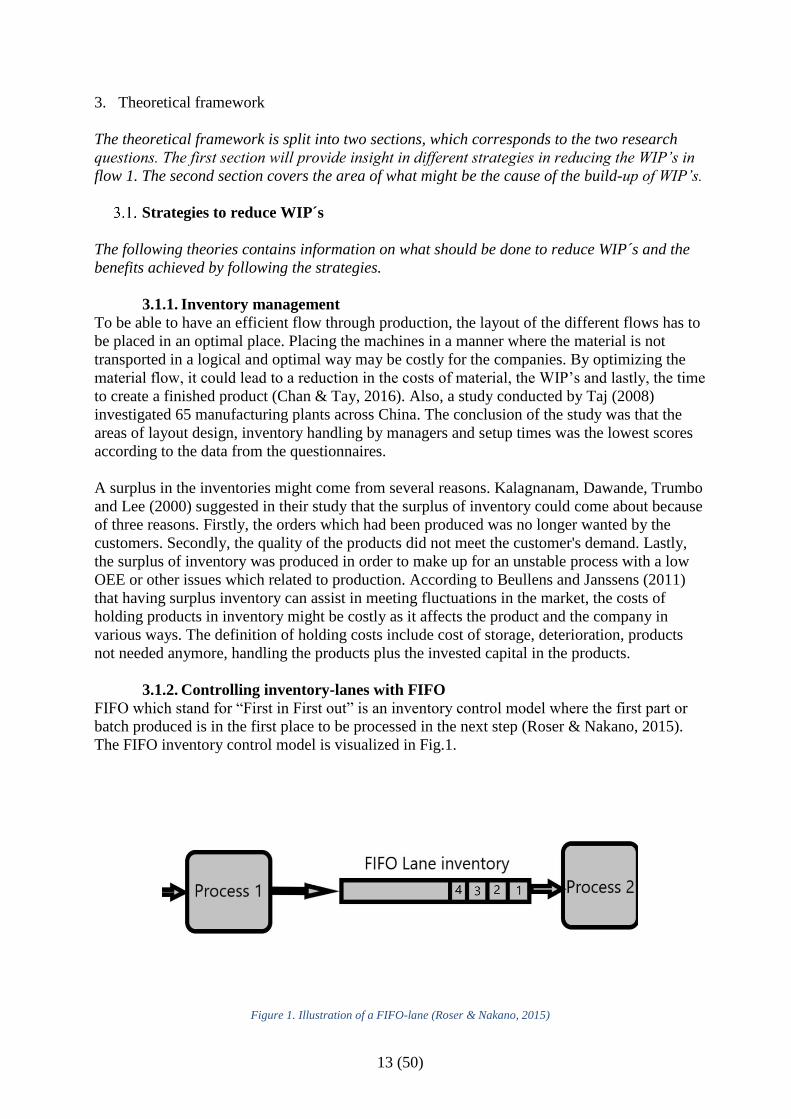
3.1.2. Controlling inventory-lanes with FIFO
FIFO which stand for “First in First out” is an inventory control model where the first part or
batch produced is in the first place to be processed in the next step (Roser & Nakano, 2015).
The FIFO inventory control model is visualized in Fig.1.
Figure 1. Illustration of a FIFO-lane (Roser & Nakano, 2015)

14 (50)
The Figure 1 represents a FIFO lane system. Process 1 produced one batch or item and it is in
the first place to be process in the next process. FIFO implementation requires a management
decision of the maximal number of items or batches in the lanes, where the process can be
compared to the KANBAN system. If the FIFO lane is full, process 1 will stop and if the FIFO
lane is empty, process 2 will stop (Roser & Nakano, 2015).
3.1.3. Visualizing the production to prevent overproduction by using Kanban
Kanban is the Japanese word for “signboard” which has become one and the same with
demand scheduling. Ohno (1988) developed Kanban to gain control over production between
processes and to allow the implementation of Just in time (JIT). At first, Kanban was
developed to reduce costs and manage the production flow, but today Kanban has become a
tool where there are possible to identify bottlenecks and allow continuous improvements
(Gross & McInnis 2003; Vatalaro & Taylor, 2005).
Kanban scheduling is used by the operator to visualize the production status, for example when
to start production or when the changeover should be conducted. Therefore, the production is
regulated by the actual usage rather than forecasted usage. True Kanban for a scheduling
process must only produce one product to replace the consumed product by its customer and
only produce product based on the signals from the customer. For example, empty pallets may
indicate that production will start or continue, and the full pallets indicates that the process
should stop (Gross & McInnis 2003; Vatalaro & Taylor, 2005).
Some of the benefits of Kanban scheduling according to Gross & McInnis (2003) are:
• Reduction of inventory
The Kanban quantities are calculated on the current condition with factors such as downtime,
scrap and changeover time and there should be a decrease in inventory levels. The inventory
can be reduced from 20 – 75 percent when using Kanban quantities.
• Improvement of flow
By reducing the inventory, there will be more free space on the production floor making it
possible for hanging up signs, setting up control points and setting up flow lanes. In this
category, the Kanban process will give the operators guidance on what and when to produce,
and when to stop the production.
• Prevent overproduction
Without control, it is easy to produce more than necessary. Kanban prevents overproduction by
specifying the number of items produced per pallet and how many pallets to be produced. The
employees follow visual signals, which lets the operators and supervisors know what to do and
when.
• Creates visual scheduling and management of the process
When the visual management strategies are followed properly, Kanban will eliminate the need
of paper schedule. The visual signal, for example containers, cards, floor markings and so on
contains information on what and how many to run and when and who to call for help. It also
tells the production sequence and typical colors are yellow for scheduling signals and red for
dangers signs.

15 (50)
• Improvement of the responsiveness to changes in demand
Kanban scheduling sets up maximum and minimum inventory levels. The levels provide visual
signals for when to produce or stop producing. Therefore, the production will stop when there
are no more products and will contribute to fast responsiveness to the customer.
3.1.4. Reducing the WIP levels by implementing Visual Control
A visual control system is a system that communicates significant information to people. The
visual signals are often created to influence and to control the specific process. The visual
signal is presented in a way where it triggers someone's attention resulting in psychical actions.
According to Ortiz & Park (2010), management departments may not understand the benefits
of the visual control system or may not know how to implement and design one. When
implementing the visual control system, the possibility opens for a proper flow of product but
also a balanced consumption and movement of inventory. The benefits of the implementation
of the visual control system are (Ortiz & Park, 2010; Grief 1991);
1. Employees waste less time by waiting
2. Correct decisions can be made on the production floor
3. Improvement of first-pass quality and reduction of rework
4. Reduction of work-in-process levels
5. Reduction of finished goods inventory level
An initiative to start a visual management system is the 5S tool. The visual management system
builds on 5S and by following the steps sort, set in order, shine, standardize and sustain, the
company can “create a new standard”. The sort phase contains actions such as only keeping the
tools needed for the work and exclude the tools not needed. When items and inventory has
been sort out, everything should be set in order. In the “set in order” phase, the purpose is to
organize the area so that everything has an address which improves the flow of material, work-
in-process and finished goods. Ortiz & Park (2010) emphasizes that in the “set in order phase”,
the team should have the mindset of making everything visual and accessible. The steps of the
“set in order” phase related to inventory are;
1. Position floor positions
By trying out and suggesting different layout styles, there should be no permanent decisions in
this phase. There should be an evaluation about how much space each workstation need, what
areas should be used for only work and the total amount of space needed to perform the tasks.
It is also needed to decide what the flow of material should be and begin to piece together the
processes.
2. Create an addressing system
When everything is in its optimal position and the choice of layout has been made, it is time to
create addresses. The address in this phase is a way to identify somethings location by using
floor markings. Big machines and stationery items do not require addresses because they are
not movable. But everything that can me moved, for example inventory should have an address
in form of floor markings. Putting an address on items saves time, reduces motion and prevents
confusion. According to Grief (1991), companies that lacks space should organize information
and items by priority, meaning that information can be hung from the ceiling and the floor.
Grief (1991) also mentions that information and addresses should be visible both internally and
externally, which enables contact with the external environment.
16 (50)
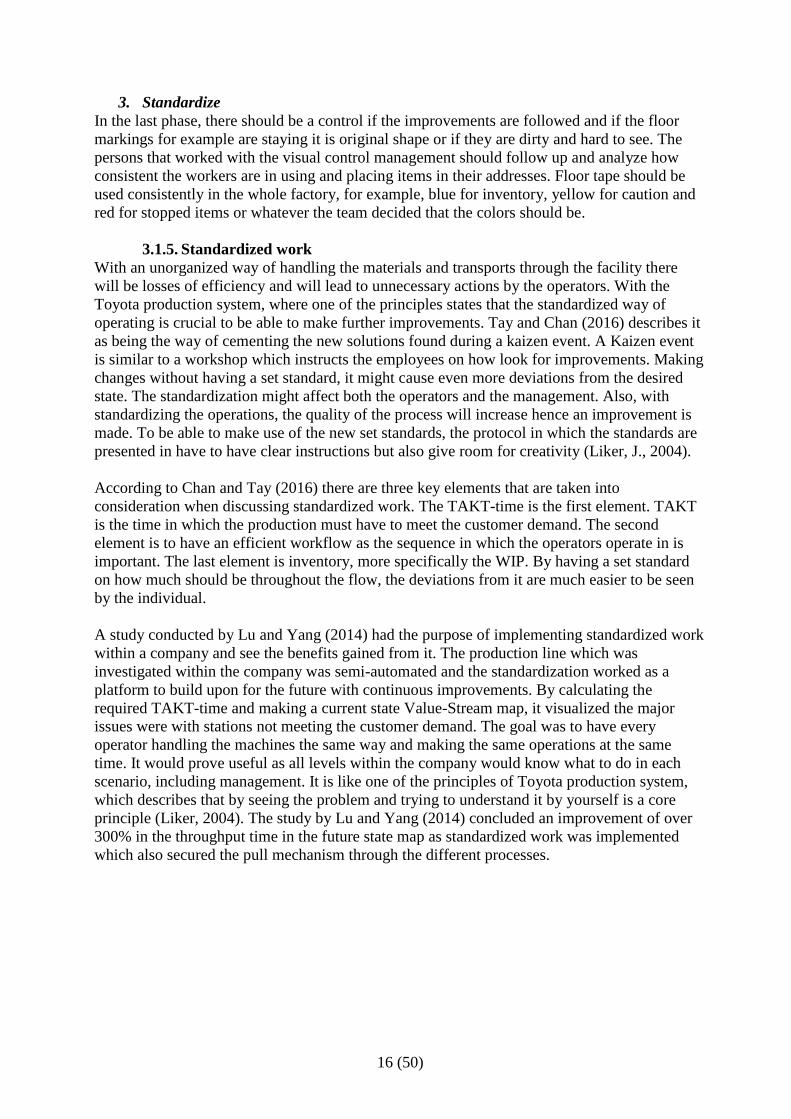
3. Standardize
In the last phase, there should be a control if the improvements are followed and if the floor
markings for example are staying it is original shape or if they are dirty and hard to see. The
persons that worked with the visual control management should follow up and analyze how
consistent the workers are in using and placing items in their addresses. Floor tape should be
used consistently in the whole factory, for example, blue for inventory, yellow for caution and
red for stopped items or whatever the team decided that the colors should be.
3.1.5. Standardized work
With an unorganized way of handling the materials and transports through the facility there
will be losses of efficiency and will lead to unnecessary actions by the operators. With the
Toyota production system, where one of the principles states that the standardized way of
operating is crucial to be able to make further improvements. Tay and Chan (2016) describes it
as being the way of cementing the new solutions found during a kaizen event. A Kaizen event
is similar to a workshop which instructs the employees on how look for improvements. Making
changes without having a set standard, it might cause even more deviations from the desired
state. The standardization might affect both the operators and the management. Also, with
standardizing the operations, the quality of the process will increase hence an improvement is
made. To be able to make use of the new set standards, the protocol in which the standards are
presented in have to have clear instructions but also give room for creativity (Liker, J., 2004).
According to Chan and Tay (2016) there are three key elements that are taken into
consideration when discussing standardized work. The TAKT-time is the first element. TAKT
is the time in which the production must have to meet the customer demand. The second
element is to have an efficient workflow as the sequence in which the operators operate in is
important. The last element is inventory, more specifically the WIP. By having a set standard
on how much should be throughout the flow, the deviations from it are much easier to be seen
by the individual.
A study conducted by Lu and Yang (2014) had the purpose of implementing standardized work
within a company and see the benefits gained from it. The production line which was
investigated within the company was semi-automated and the standardization worked as a
platform to build upon for the future with continuous improvements. By calculating the
required TAKT-time and making a current state Value-Stream map, it visualized the major
issues were with stations not meeting the customer demand. The goal was to have every
operator handling the machines the same way and making the same operations at the same
time. It would prove useful as all levels within the company would know what to do in each
scenario, including management. It is like one of the principles of Toyota production system,
which describes that by seeing the problem and trying to understand it by yourself is a core
principle (Liker, 2004). The study by Lu and Yang (2014) concluded an improvement of over
300% in the throughput time in the future state map as standardized work was implemented
which also secured the pull mechanism through the different processes.

17 (50)
3.1.6. Kaizen
With Kaizen comes incremental change, as there is a will to always improve the current
process. The process of kaizen will give the operators the freedom to contribute to the change
instead of blindly following the managements decisions. The companies which adopts and uses
the kaizen approach will also have to take into consideration on how to implement the changes
throughout the workforce and operators.
Chan and Tay (2016) describes Kaizen as the readiness of an organization to implement the
change. The first step is having operators in a state of mind, where for themselves wants to
learn and be able to search for issues in the process and strives to fix them. Secondly, an
information flow must be present between the different functions to be able to have a working
improvement process so that information is not being left out from specific teams. Lastly, a
method in which the company can ensure that the new standards are being followed by the
operators is crucial.
3.1.7. Structure the workplace with the 5s tool
Before lean can be implemented, there has to be an underlying basis of standardized work and
visual control. 5S is one of the many lean manufacturing programs. The five elements in the 5s
program contains various activities to eliminate wastes that causes errors, defects and injuries
at the workplace. The 5S program also creates a continuous process for improvements in the
work environment. The elements in 5s according to Liker (2004) are;
Figure 2 The 5s program
1. Sort
The first process is called sort. In this process, the activity is to sort out every item in the work
environment and only keep what is needed. To become and stay focused on the chosen area, it
is usually best to start the 5S implementation in a smaller area in the company.
This step is needed because it allows the company to see which tools or equipment are truly
needed for the work and which equipment and tools are adding value for the company (Ortiz &
Park, 2011).
18 (50)
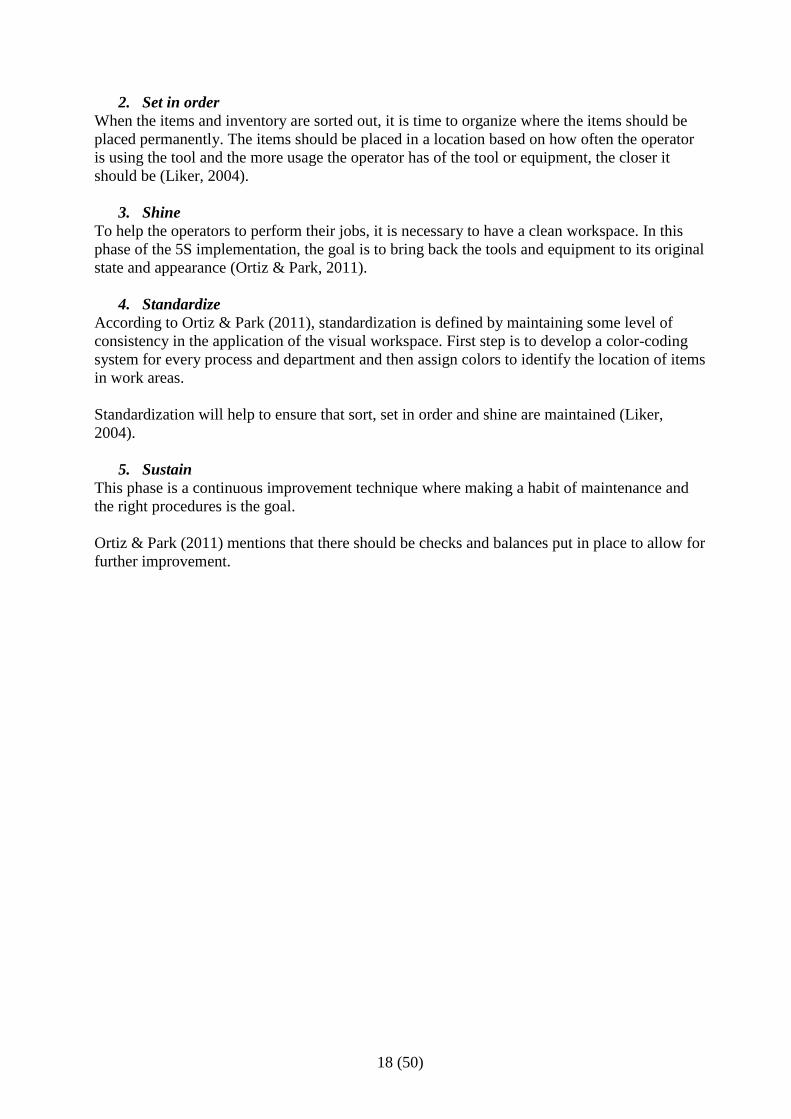
2. Set in order
When the items and inventory are sorted out, it is time to organize where the items should be
placed permanently. The items should be placed in a location based on how often the operator
is using the tool and the more usage the operator has of the tool or equipment, the closer it
should be (Liker, 2004).
3. Shine
To help the operators to perform their jobs, it is necessary to have a clean workspace. In this
phase of the 5S implementation, the goal is to bring back the tools and equipment to its original
state and appearance (Ortiz & Park, 2011).
4. Standardize
According to Ortiz & Park (2011), standardization is defined by maintaining some level of
consistency in the application of the visual workspace. First step is to develop a color-coding
system for every process and department and then assign colors to identify the location of items
in work areas.
Standardization will help to ensure that sort, set in order and shine are maintained (Liker,
2004).
5. Sustain
This phase is a continuous improvement technique where making a habit of maintenance and
the right procedures is the goal.
Ortiz & Park (2011) mentions that there should be checks and balances put in place to allow for
further improvement.

19 (50)
Factors that may cause excess inventory
The following section contains information on how a company may reduce overproduction by
having a proper waste management and by improving the OEE.
3.2.1. Reducing the excess inventory with a proper waste management
With having inventory placed all around the section, it can become costly for companies as
different types of wastes can appear. The following checklist, also called 7 + 1 wastes, is taken
from Liker (2004) which explains the different types of wastes which can occur during
production. All the activities explained below add no value yet increases costs.
1. Overproduction - This occurs when production continues to produce a certain product
which have not any orders to satisfy. In return causes inventory build-up and will cause
the employees to work more than necessary.
2. Unnecessary transports - These types of transports occur when long distances must be
travelled until reaching the target destination by having a poorly chosen route to the
storage or moving material in and out of storage frequently.
3. Overprocessing and Incorrect Processing - Both activities does not add any value to the
company, as it can cause the item to be scrapped, reworked or just by making
something the customer did not want. The overprocessing is when the products gets
more features then requires from the customer, which leads to the process taking more
time for the company. The incorrect processing might occur if a tool in the machine is
of poor quality or by poor handling of the materials. 4. Waiting - The waiting comes from that the employee has to wait for the part to arrive to
the workstation. It can be equipment downtime, bottlenecks in capacity and no work
orders at all.
5. Unnecessary movement - The employee has to make movements that can be deemed
unnecessary, which can search be to search for a particular item or having to walk and
grab a tool that is required for the process.
6. Excess inventory - Excess inventory can be a result of overproduction, poor equipment
uptime or large order quantities. It leads to the lead times becoming longer, the defects
might ‘hide’ in the inventory and extra costs as in storage and scrapping because of the
products not being wanted any longer by customers.
7. Defects - Defects can be defined as anything that does not make it past the testing
stations, where the product might require a repair or reworking. But it can also lead to
the item being scrapped and a requirement for a replacement is needed.
8. Unused creativity among the employees - The last type of waste occurs when the
management ignores the opinions and ideas which comes from the employees
themselves.
The main contributor of waste according to Ohno (1988) is overproduction as it can cause lack
of motivation to work with improvements necessary. By having large inventories, the surplus
could be used to hide the defects scrapped by just quickly replacing the product. The setup
times could be less crucial to reduce as the products are already waiting by the next station.
3.2.2. Solving inventory-buildups by achieving high OEE
The overall equipment efficiency (OEE) could be determine if the process is reliable. The OEE
uses three factors to determine the system reliability in which the result is shown in
percentages. By multiplying the respective factors, the product of the factors is the OEE. The
factors which are taken under consideration during the calculations are the availability,
20 (50)
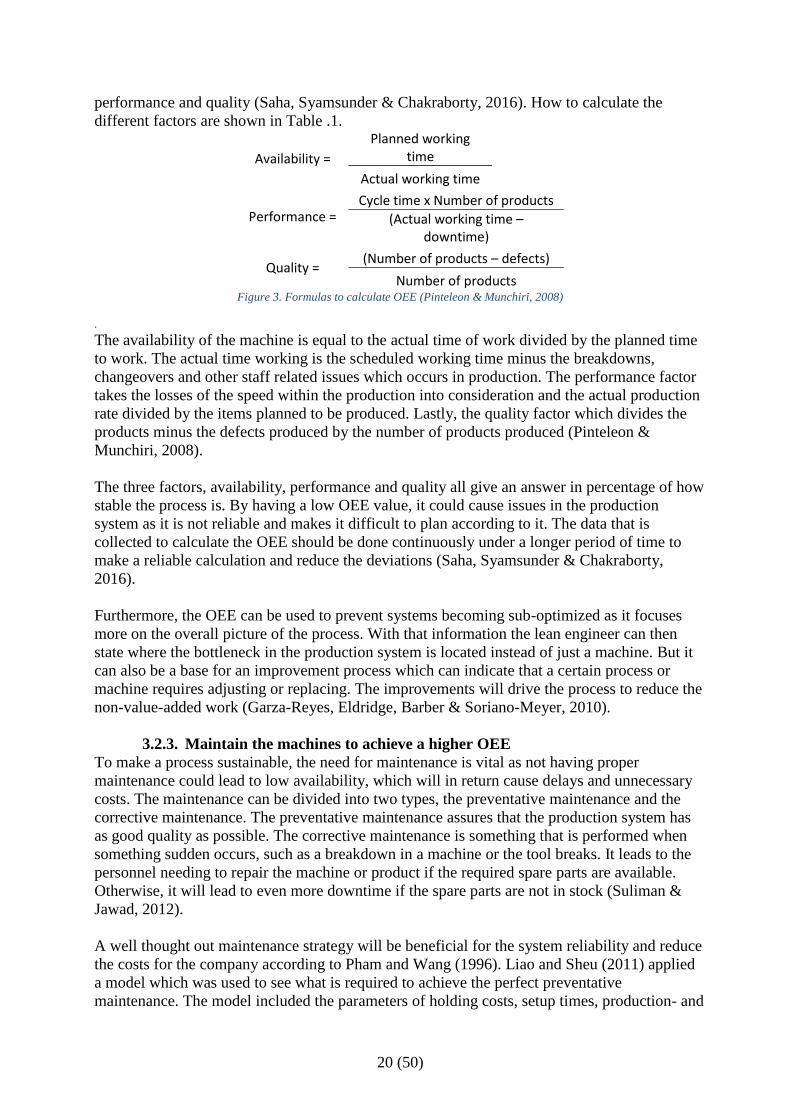
performance and quality (Saha, Syamsunder & Chakraborty, 2016). How to calculate the
different factors are shown in Table .1.
Availability =
Planned working time
Actual working time
Performance = Cycle time x Number of products
(Actual working time – downtime)
Quality = (Number of products – defects)
Number of products Figure 3. Formulas to calculate OEE (Pinteleon & Munchiri, 2008)
.
The availability of the machine is equal to the actual time of work divided by the planned time
to work. The actual time working is the scheduled working time minus the breakdowns,
changeovers and other staff related issues which occurs in production. The performance factor
takes the losses of the speed within the production into consideration and the actual production
rate divided by the items planned to be produced. Lastly, the quality factor which divides the
products minus the defects produced by the number of products produced (Pinteleon &
Munchiri, 2008).
The three factors, availability, performance and quality all give an answer in percentage of how
stable the process is. By having a low OEE value, it could cause issues in the production
system as it is not reliable and makes it difficult to plan according to it. The data that is
collected to calculate the OEE should be done continuously under a longer period of time to
make a reliable calculation and reduce the deviations (Saha, Syamsunder & Chakraborty,
2016).
Furthermore, the OEE can be used to prevent systems becoming sub-optimized as it focuses
more on the overall picture of the process. With that information the lean engineer can then
state where the bottleneck in the production system is located instead of just a machine. But it
can also be a base for an improvement process which can indicate that a certain process or
machine requires adjusting or replacing. The improvements will drive the process to reduce the
non-value-added work (Garza-Reyes, Eldridge, Barber & Soriano-Meyer, 2010).
3.2.3. Maintain the machines to achieve a higher OEE
To make a process sustainable, the need for maintenance is vital as not having proper
maintenance could lead to low availability, which will in return cause delays and unnecessary
costs. The maintenance can be divided into two types, the preventative maintenance and the
corrective maintenance. The preventative maintenance assures that the production system has
as good quality as possible. The corrective maintenance is something that is performed when
something sudden occurs, such as a breakdown in a machine or the tool breaks. It leads to the
personnel needing to repair the machine or product if the required spare parts are available.
Otherwise, it will lead to even more downtime if the spare parts are not in stock (Suliman &
Jawad, 2012).
A well thought out maintenance strategy will be beneficial for the system reliability and reduce
the costs for the company according to Pham and Wang (1996). Liao and Sheu (2011) applied
a model which was used to see what is required to achieve the perfect preventative
maintenance. The model included the parameters of holding costs, setup times, production- and

21 (50)
demand rates. The conclusion of the study was that need of failures, called imperfect
preventive maintenances, was needed to occur in order to achieve optimal preventative
maintenance, a sort of trial and error. Suliman and Jawad (2012) describes a model which also
wanted to examine the optimal preventative maintenance. The model presented by Suliman and
Jawad (2012) was investigated in a production system which only carried one product. The
purpose of the study was to investigate how the lot size affected the costs during maintenance.
The timing of the preventive maintenance was the primary focus and finding the best time to
perform the maintenance. The results presented in the article showed that by having fewer
inventories, the total costs were reduced but the time between the maintenances increased.
3.2.4. SMED (Single minute exchange of dies) for reducing changeover time
SMED is a tool within the lean manufacturing system that reduces waste which comes from of
time-consuming activities. The aim of SMED is to standardize and simplify operations linked
to changeover procedures. SMED was originally developed to improve machine tool setups,
but its principles can be applied to changeovers in all type of processes. SMED contributes to a
rapid and efficient way of changing a manufacturing process from producing one product to
another. The “Single minute” phrase indicates that it should take less than one minute, but the
true meaning is that it should take less than 10 minutes, in other words “single-digit minute”.
SMED enables smaller production lots and improvement of the flow. The setup operation is
divided into two parts, the internal and the external setup. The internal setup is defined as the
setup operation that only can be made when the machine is shutdown. The definition of the
external setup is when the setup activities can be performed while the machine is running,
before and after the shutdown (Ulutas, 2011). The three main sequences of SMED are
according to Shingo (1985) are:
1. Separate internal and external setup
2. Convert internal setup to external setup
3. Streamline all aspects of the setup operation
Which can be visualized in Figure 4;
Figure 4. Illustration of a SMED-process (Ulutas, 2011)
The application of SMED is divided into five steps according to Ulutas (2011). The first step is
to analyze the setup time. This can be done by recording the process with video camera and
then analyze the tasks, which will present the most time related waste in the changeover.

22 (50)
The second step is to eliminate inefficient time and followed by the third step, which is to
identify external and internal setup. The focus in the third step is put on dividing tasks that
requires the machine to be stopped and tasks that can be made before or after the machine is
shut down (Ulutas, 2011). According to Shingo (1985), the third step is the most important
step.
The fourth step is to convert internal setup to external setup, where the focus is on tasks related
with product and material handling, information gathering, cleaning, maintenance, adjustment
and control. For example, some activities can be finished before the machine stops and thereby
converted to external setup time (Ulutas, 2011).
The last step is standardization. This step requires checklists on how the changeover should be
done to succeed with the optimal changeover time. The changeover time will be a
standardization because the analyze has provided a precise time and not a prediction of the
changeover time (Shingo, 1985).
3.2.5. Multi-skilled workforce to prevent low availability
Companies are looking to stay ahead their competitors which had led that the human resources
have become a source for business flexibility. Having the human resources as a source of
competitiveness is especially true for companies with low automation rates. A company with a
low automation rate should consider developing or enhance the workforce with long-term
strategies such as cross-training programs. Multi-skilled workers are a key factor in order to
gain flexibility and high responsiveness (Attia, Duquenne & Le-Lann, 2014).
The skill of a worker is an evolving parameter that depends on what jobs the worker is assigned
to do. If a worker gets assigned to various jobs where they only will practice the same skill, the
productivity of the worker will increase. But only repeating the same skill will contribute to a
decrease of effectiveness of the operator in the skills they do not use. While always keeping the
same workers at the same jobs, companies will be dependent on these individuals and may be
forced to outsource missions within their core competencies (Attia, Duquenne & Le-Lann,
2014).

23 (50)
4. Empirical findings
The empirical data was gathered through a case study by walking around on the production
floor and making observations. Also, unstructured interviews were conducted to the operators
in order to fully understand the problem and the current standard. The data regarding the
machines comes from the software AXOS that Company X uses to monitor the production. In
this section, the data from the visits, observations, interviews and other data will be presented.
Case study
The bachelor thesis focused on the internal logistics of Company X in Sweden, which is a
manufacturing company. There are different sections in the factory, but the focus was on the
rocker arm manufacturing. Company X has focused on optimizing the machine cells and
implementing new technology to reduce cycle times and changeover time to meet the customer
demand. There is also a substantial effort to reduce waste in form of defects in the production
of the rocker arms (Personal communication, 1 January 2019).
Because Company X´s focus had been put on producing parts, the internal logistics has not
been prioritized. Therefore, while producing and not keeping track of material flow and the
work in process (WIP), Company X had areas in the section with excess inventory in unwanted
locations.The build-up of the inventory had caused areas within the B1 section to be filled with
both finished and unfinished products. The effect of the built-up inventory was that FIFO was
not followed and both the operators and management had difficulties in keeping track of the
products. The largest quantity of unwanted excess inventory had been building up within the
production line of flow 1. Flow 1 is one of the production flows in section B1 at Company X,
containing the machines MC (Machine Cell) 1 and MC 2 (Personal communication, 1 January
2019).
According to the Value Stream manager (Personal communication, 8 January 2019), the lack of
a standard which was followed had led to both unfinished, finished and stopped goods being
placed in areas which had no markings displaying inventory location. Having inventory placed
throughout the production flow, it caused confusion amongst the employees and the employees
could not keep track on the amount of WIP and finished goods (Personal communication, 8
March, 2019).
Products in flow 1
The production within the section of B1 had two different types of customer flows. Due to
secrecy, the customers are not named. Some flows had the option of switching production to a
second customer, but the investigated flow just had one customer. The product mix of flow 1
contained five different products from two different product families. The volume for flow 1 is
presented below in Table 1;
Flows in section B1 Production volume (pcs/week)
Flow 1 10471 Table 1 Production volume of flow 1 in section B1 (Company X, 2019).

24 (50)
Layout / Process
The map on how the products were transported through flow 1 is illustrated in Figure 5. The
layout shows the locations of all places where inventory is stored in flow 1, marked with blue
color. The raw materials which are added in the production’s lines are done by the operators
with the help of a forklift (Personal Communication, 20 February 2019).
Figure 5. View of the layout of flow 1 (Company X, 2019).
Figure 5 shows the current layout of section B1, where flow 1 is shown. The entry point of the
raw material is shown in Figure 5 at the top right position. The goods are the transported by a
rumbling table onto a conveyor which transported the products into pre-milling process. The
purpose of the rumbling table is to ensure the positioning is correct when entering the pre-
milling. If the product is not correctly placed on the conveyor, it is pushed by a machine onto
the rumbling table for another try. The goods are being processed in the pre-milling and then
transported internally to the MC 1. When the MC 1 process is complete, the goods are
transported by conveyor to the next cell, MC 2. If it was necessary to remove the products from
the conveyor, the operators could do so from either side of it. The finished goods are placed
below MC 2 in Figure 5 which is the final stop before being transported to the assembly. The
area below MC 2 of finished goods had become a problem because of the number of articles
produced. The intermediate storage is the area which is located in between MC 1 and MC 2.
The intermediate storage is used when a specific product is no longer the required product to
produce, in other word, when a sudden changeover is needed. Also, the intermediate storage is
used as the MC 1 continues to produce even though the MC 2 is shut down and not producing.
The operator must transport the materials manually to the intermediate storage and the route in
which the operator must take is displayed in the second picture of Figure 9 (Personal
Communication, 20 February 2019). Whereas the conveyor could be opened, and an operator
could move through the gap, but a regular pallet did not fit through it. During the visits, it
occurred that the conveyor between MC 1 and MC 2 was full of products not being processed
as the MC 2 was shut down (Personal Communication, 20 February 2019).

25 (50)
If a product had a tolerance that did not meet the requirements or if another defect was detected
the goods were then transported by the operator to a red marked area, which can be seen in
Figure 5. The goods placed in these sections are then inspected by the quality department to see
what the problem is and decide the necessary actions. The goods placed in the area are both
regular and fixed position pallets depending on where in the process the products are. When the
products are placed in a red marked area, the pallets get a red note, which shows that the
products are awaiting inspection. By observations made through several visits to Company X,
the red notes which follows the pallets through the production showed that some articles
currently had been there for more than two weeks prior the first visit (Personal
Communication, 20 February 2019).
In the past, Company X has utilized roller conveyors on the production floor in the areas of
OUT1 and OUT2 but removed them to implement a new machine cell. The OUT2 area is not
shown in the layout as the outbound goods placed there are not part of flow 1. According to the
operators, the roller conveyors which was used made it easier to follow FIFO (Personal
Communication, 20 February 2019).
Inventory areas and visual control
There are different inventory areas in section B1 at Company X. The inventory addresses are
partly marked up with different colors, but rarely followed as noted through the observations.
The inventory addresses are defined by markings on the production floor that indicates the
color for the specific type of items. The colors used at Company X are blue, red, black and
green. Fig. 6 is a display of the colors used in Company X (Personal Communication, 20
February 2019).
Figure 6. Display of the colour of tape on the floor (Company X, 2019).
Blue
Blue indicates that there only should be finished or unfinished articles in that area. There are
two areas with blue markings, one is located at the MC 1 station and the other is the by OUT1.
Because Company X has not prioritized the internal logistics, a new MC has been placed on the
area where there were blue markings, and the markings had not yet been removed. This has
caused the inventory in these areas has been pushed to the side, where there is available space,
but new markings have not been set up. The area in section B1 with blue markings is called
OUT1 and there are only articles in fixed position pallets produced from MC 2. The second
area that belongs to MC 1 is an area where the operator can place parts in regular pallets
produced from MC 1. That only occurred when MC 2 was stopped (Personal Communication,
20 February 2019).
Red
Red markings indicate stopped articles or emergency tools. There are different areas with red
marking on the production floor. The main area for stopped productions is in the center of
Figure 5 ‘Stopped Goods’. The stopped area is designed for two regular pallets, but there is an
average of 12 pallets in that area at the occasions that a visit was made at Company X. There is
an electric central next to the stopped area with “Don’t block this area” signs. Because of the
number of pallets placed there, the pallets block the electric central. Most of the stopped goods

26 (50)
pallets in this area contains parts coming from MC8 and MC 3 (Personal Communication, 20
February 2019).
Black
The black marking indicates that there should tools be placed and only the tools for the specific
machine. The tools were placed on carriages which was placed in these black markings
(Personal Communication, 20 February 2019).
Green
The color green indicates recycling areas. For example, there was containers in some of these
areas that picked up the material waste of the cutting and milling process (Personal
Communication, 20 February 2019).
Large quantity inventories
Within section B1, there were two areas which stood out with build-up of inventory. These
areas were both in flow 1. First one being the intermediate storage which was located in
between MC 1 and MC 2. The area is highlighted with a red circle in Figure 7, with the text
‘Intermediate storage’. During the visits it was observed that the parts that was stored there
could have been there for as long as three weeks without being processed further. The amount
stored there was ranging in between 15-20 regular pallets, which equals to 6450-8600 parts.
The notes which was in the regular pallets in the intermediate storage stated that the certain
products produced in the beginning of February was not finished until March 2019 (Personal
Communication, 20 February 2019).
Figure 7. Areas of unwanted inventory in (Company X, 2019).
The second storage was at the end of the flow 1 where the products awaited transports to the
OUT1. A red circle in Figure 7 on the bottom of the picture with the name ‘Fin. Goods’ and
‘End of flow 1’ indicate the location of these storages. The products were stored in regular
pallets until assembly needed products. When the products were required for the assembly, the
operator then placed them manually in fixed position pallets and performed a 100% control.
The storage below MC 2 was not a designated area for the products but was an effect of the
overproduction of products.

27 (50)
The problem which occurred was that the number of finished articles surpassed the storage
space in OUT1. In return, it had led to the operators placing the regular pallets anywhere there
is space. Because of the number of articles placed where there is space, the FIFO principles
was not followed. The operators think that handling and rearranging the pallets takes too much
time because it was required to move every pallet manually with the forklift. With an
unstructured OUT1, it had led to the assembly lines not picking up the pallets which had been
awaiting transport the longest time. The production for a certain order could exceed the needed
amount for fulfil the order, the OUT1 and OUT2 became full of finished goods. The OUT1
area is not visible from MC 2, causing difficulties when the operator has to know how many
pallets there are left in the area (Personal Communication, 20 February 2019).
In the picture of Figure 7, the areas which had the problems with inventory build-up of finished
goods is shown and red circled. The layout in Figure 5 suggests that there is one designated
place for outbound goods for flow 1, at the location of OUT1. The inventories which are red-
circled in the Figure 7 indicates the two extra areas where outbound goods had been building
up over time as the products was not needed for present orders. The inventories which had been
created in these areas had been causing issues regarding transporting and the ensuring of FIFO.
That was because the regular pallets were placed anywhere the was space and moving through
the production was made difficult and keeping track of the products (Personal Communication,
20 February 2019).
Pallets
At every visit at Company X, there was a large amount of inventory waiting to be processed,
packed up or collected by assembly in the B1 section. The inventory areas were mixed up with
different types of products and placed in two different types of pallets. One was a regular pallet
with the capacity of holding 430 pieces. The other pallet was a “fixed position pallet” where
the products were placed in positions either by robots or manually by an operator. The fixed
position pallet had the capacity of holding 192 pieces.
The fixed position pallet was used when produced directly to assembly and not to buffer. The
reason behind this is that the first process in the assembly was a robot picking up the parts and
could only do it from the fixed position pallets. Because the parts were made of steel, there was
a risk of corrosion when the parts were exposed to oxygen after the washing process. The
regular pallets were used when the parts were manufactured for buffer. The regular pallets had
a piece of paper in between every layer which acted as a protection for corrosion and could be
stored for weeks with a minimal risk of corrosion (Personal Communication, 20 February
2019).
TAKT
The TAKT which Company X followed was an average of 8300 products per week. The TAKT
could vary slightly from each order to the next. Flow 1 had the capacity to produce 72
products/h in the MC 1 and 90 products/h in the MC 2. The capacity was the ideal time for the
MC 1 and MC 2 as the OEE of the machines was 100% (Personal Communication, 6 Match
2019).
Machines
In section B1, there were four different flows which had similar machine setups. The common
denominator was that each flow had at least two cell-structured machine groups. The MC 1
machines processed the material by milling and drilling to the desired specifications. The flow
2 and 4 had the setup with two machine groups, MC’s, where each machine group had two
28 (50)
operations each. Flow 1 and flow 3 had one cellular MC which had all four operations within.
The operations that the MC’s could perform was polishing, washing, deburring and applying
bushings in the product (Personal Communication, 6 Match 2019).
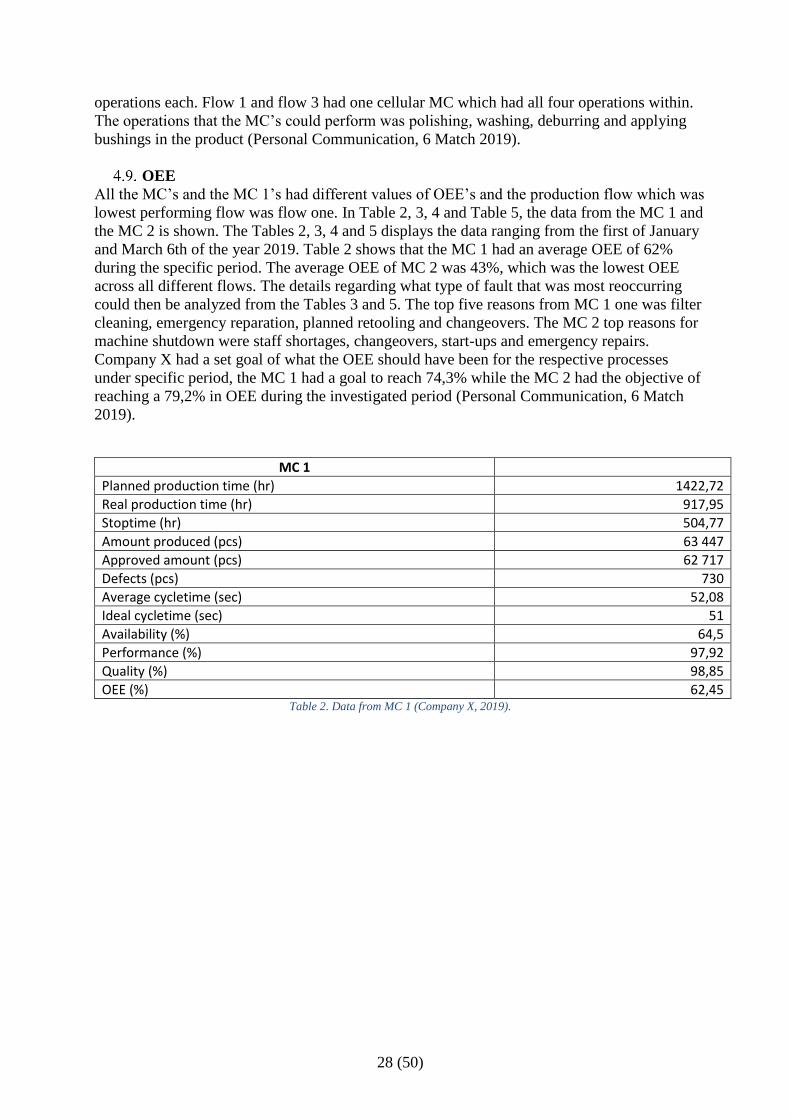
OEE
All the MC’s and the MC 1’s had different values of OEE’s and the production flow which was
lowest performing flow was flow one. In Table 2, 3, 4 and Table 5, the data from the MC 1 and
the MC 2 is shown. The Tables 2, 3, 4 and 5 displays the data ranging from the first of January
and March 6th of the year 2019. Table 2 shows that the MC 1 had an average OEE of 62%
during the specific period. The average OEE of MC 2 was 43%, which was the lowest OEE
across all different flows. The details regarding what type of fault that was most reoccurring
could then be analyzed from the Tables 3 and 5. The top five reasons from MC 1 one was filter
cleaning, emergency reparation, planned retooling and changeovers. The MC 2 top reasons for
machine shutdown were staff shortages, changeovers, start-ups and emergency repairs.
Company X had a set goal of what the OEE should have been for the respective processes
under specific period, the MC 1 had a goal to reach 74,3% while the MC 2 had the objective of
reaching a 79,2% in OEE during the investigated period (Personal Communication, 6 Match
2019).
MC 1
Planned production time (hr) 1422,72
Real production time (hr) 917,95
Stoptime (hr) 504,77
Amount produced (pcs) 63 447
Approved amount (pcs) 62 717
Defects (pcs) 730
Average cycletime (sec) 52,08
Ideal cycletime (sec) 51
Availability (%) 64,5
Performance (%) 97,92
Quality (%) 98,85
OEE (%) 62,45 Table 2. Data from MC 1 (Company X, 2019).

29 (50)
Table 3 Causes of stop, MC 1 (Company X, 2019).
4 096,35
3 619,22
3 448,15
3 034,23
2 879,18
2 159,72
1 446,75
1 438,62
904,32
820,67
552
43
140
11
15
25
5
57
11
4
7,42
84,17
24,63
275,84
191,95
86,39
289,35
25,24
82,21
205,17
0,00 500,00 1 000,00 1 500,00 2 000,00 2 500,00 3 000,00 3 500,00 4 000,00 4 500,00
Filter Cleaning
Emergency reparation
Planned retooling
Changeover
Staff shortages
Measurement
Planned maintenance
Measurement adjustment
Misplaced part
Stops related to staff
Causes of stop MC 1
Average time consumption (min) Occasions Total time (min)

30 (50)
MC 2
Planned production time (hr) 1488,35
Real production time (hr) 860,03
Stoptime (hr) 628,32
Amount produced (pcs) 59 674
Approved amount (pcs) 58 927
Defects (pcs) 747
Average cycletime (sec) 51,88
Ideal cycletime (sec) 40
Availability (%) 57,8
Performance (%) 77,10
Quality (%) 98,75
OEE (%) 43,99 Table 4 Data from MC 2 (Company X, 2019).
Table 5 Causes of stop, MC 2 (Company X, 2019).
6 831,10
3 395,32
2 609,80
2 250,35
1 916,30
1 605,20
1 461,77
1 450,82
1 241,57
1 037,18
22
11
10
41
184
28
21
189
95
69
310,50
308,67
260,98
54,89
10,41
57,33
69,61
7,68
13,07
15,03
0,00 1 000,00 2 000,00 3 000,00 4 000,00 5 000,00 6 000,00 7 000,00 8 000,00
Staff shortages
Changeover
Start-up
Emergency rep. bushingpress
Sensor error
Sorting
Emergency rep. deburr
Outbound full
Material shortage
Problems related to bushingp.
Causes of stop MC 2
Average time consumption (min) Occasions Total time (min)

31 (50)
Changeovers
The changeovers which were performed in section B1 was done manually by the operators,
which required at least one operator to perform. Performing a changeover meant replacing the
tools, adjusting the fixtures and change the settings in the software of the machine to match the
upcoming production. When the changeover had been performed in the machine, test pieces
were produced before resuming full production. For each fixture replaced in the MC 1 or MC, a
test piece was produced to test and measure, where the test pieces were transported by an
operator for measurement. A machine controlled the test pieces to see that they were within the
set tolerances (Personal Communication, 20 February 2019). The time a changeover took to
perform differed from one operator because of the lack of a standard. The time was also
affected what type of changeover was performed. As performing a major changeover between
the product families required more time than changeovers performed within the product
families. Performing a changeover within the product family required about 15 minutes
compared to a changeover between the product families which could take up 10 hours.
According to an operator, the time to perform a major changeover in MC 1 took 10 hours and
that was the time until a first piece had been produced and measured (Personal
Communication, 20 February 2019). During the start-up it meant that the machine was changed
mechanically but not ready to resume production. It was during the start-up, the test pieces
were produced and tested. Table 3 showed the data where the changeovers average are 273
minutes (4,55h) and the average time of measurement of 86 minutes (1,4h).
For MC 2, the changeover took four to eight hours depending on which of the operators who
performed it, plus one hour of measuring the test pieces according to the management
(Personal Communication, 20 February 2019). Although, the data from Table 5 displayed the
average time of changeover being 308 minutes (5,1h).
The average time it took to measure a test piece was 15 minutes. But according to several
operators, the measuring could take several hours to conduct. Additionally, every 15 minutes,
the operator manually had to put the next test piece in the machine. Because of the operator not
standing around and waiting for the products to be finished, the operator has to return every 15
minutes to change product in the machine. The machines which were required for the operator
to measure the test piece could be occupied by another department or another operator in
section B1. When a machine performed a changeover, that operator got prioritization with
measuring and jumped the queue in the measurement room (Personal Communication, 20
February 2019).
Staff shortages
In Table 3 and 5, the data displays the number of times and total amount of time that the
personnel have been absent from the workstations. In MC 2, the staff shortages in the biggest
single reason for the machine not being utilized. In MC 1, the staff shortages come in fifth
place of coded reasons for the machine not being available to process. According to the Value
Stream Manager, Company X was sensitive for sudden changes in personnel. As filling the
empty slot when an operator is sick, which can leave the machine standing still an entire shift
(Personal communication, 23 April 2019). Currently, workers are not swapping between the
different production flows, they stay on the same machines in the specific flow.

32 (50)
Filter cleaning
Filter cleaning is the number one reason for the MC 1 not being available for production as
shown in Table 3. Filter cleaning is done to remove the metal shards which is the waste from
the MC 1 process. By not removing the shard could result in poor quality in the process and the
products requiring rework. The solution of having filter cleaned was temporary at first, but has
become the standard way of handling the problem (Personal communication, 23 April, 2019).
Maintenance
The data in Table 3 and 5 shows that the category of emergency reparations was a big
contributor to the low OEE. The total amount of time spent on repairing the machine is second
on the list for the MC 1 and the fourth and seventh place for the MC 2. The category of planned
retooling is when exchanging tools for the machine with new tools. The data in the Table 3
shows that the MC 1 has planned maintenance as a factor in the availability which had occurred
five times á 286 minutes each. MC 2 is not affected by the planned maintenance as the MC 1,
as the planned maintenance is not a top reason for the MC 2 not being available for production.
Defects
The scrap rate of Company X was 730 pieces in the MC 1 and 747 pieces in the MC 2 in set
period from January until March 6th. By multiplying the MC 1 quality ratio and the MC 2’s
quality ratio, the production systems quality ends up at 97,61%. The products that did not meet
the set tolerances was sent to the check stations. At the check stations, an operator or a quality
manager performed analysis on the product to see if it could be reworked. If the product was
ok, the product was put back into the production flow. The rechecked material could be placed
anywhere in the designated area and it could mean that even if the product was produced at an
earlier time then other products in the system, it might be finished later (Personal
communication, 4 March, 2019).
To cope with the quality issues with certain machines, the operators had to perform a so called
100% control on each product which the final machine in the production flow had produced.
The check could be applied on each production flow but was currently performed at the end of
the production line of flow one and three as quality issues had occurred there (Personal
communication, 4 March, 2019).
Production planning
The production planning is employed by one person and had the responsibility of handling the
production planning for the entire factory. The production planning was done with the
software, SAP, where the orders from the customers could be seen. The production planner had
the ambition to spread out the workload to be able to meet the customer demand. When
planning the production of section B1, the production planner used the assembly’s TAKT-
times. The TAKT-times for assembly was 75 parts/hour for customer 1 and 115 parts/hour for
customer 2 (Personal Communication, 20 February 2019).
The focus of the production planner was to make sure that the assembly lines always had
products available to assemble which had led to overproduction. But the production planner
mentioned that one of the reasons for overproducing parts was the because of the low OEE that
MC 2 and MC 1 had. As the machines were not reliable enough and had very long changeover
times (Personal Communication, 20 February 2019).

33 (50)
The production planner’s method of informing the operators of what products that need to be
produced differed from the customer 2 flows and customer 1 flows. Flow 1 produces for
customer 1 and received a list from production planning which had information about what
needed to be produced during the day but the article numbers on the notes was not the correct
ones for the production. The article numbers on the list matches the article numbers which the
assembly had instead of the production. According to the operators, they had learnt what article
number corresponds to the products in the production flows and because there was a large
amount of finished goods inventory, the operator in flow 1 usually did not have to perform a
changeover. The operator only had to place the required number of products in fixed position
pallets with an 100% control. The notes were only what the assembly had to send out to their
customer which caused great confusion if someone new to the factory tried to understand the
specific information (Personal Communication, 27 February 2019).
Compared to the customer 2 flows, no list was necessary. The flows which produced parts for
the customer 2 had a base product, also called the high runner. The high runner is the common
product which the production flow produces. If the production planning required a different
product to be produced, a changeover was performed. Once the task was finished the operator
switched back to the base product. If the order was of low volume, the full number of products
for the order was produced but a buffer was also made to avoid a changeover in the future if a
low volume order would occur again of the same item (Personal Communication, 20 February
2019).
Operators
The MC 1 and MC 2 is run by one operator respectively. The transports of material in between
the stations was also managed by the operators and the changeovers are performed by the
operators as well. Each production flow had a total of two operators per shift and the
production was running 24 hours per week on a five-shift basis. The operators performed the
basic maintenance of the machine, such as the filter cleaning (Personal Communication, 20
February 2019).
Packaging
When the assembly line required the products from production flow one, the operator then had
to pick up the products in the regular pallet and place it in a fixed position pallet. Production
flow 1 was the only flow which operated in that way. Although, the other flows all had the
finished products placed in fixed position pallets except when produced to buffer. According
the operators, the packaging was both slow and tedious as in some cases a shift in what product
the assembly demanded could change quickly. It would cause the products which had been
placed in the fixed positions pallets to be replaced in the regular pallets from the fixed position
pallets (Personal Communication, 20 February 2019).
Transports
The operators managed the transports of material with the help of pallet loaders and trucks. The
production flow one had the problem with inventory build-up in locations not designated for it.
The route which the products were transported to the intermediate storage was long. In Figure 8
the routing of the transports is shown in orange. If the material was stored in the intermediate
storage, the materials then had to be manually put on the conveyor when it was going to be
used again. By manually putting the products on the conveyor, it required twice the work to
conduct according the operators. The conveyor had the possibility of opening and closing,
enabling the operators to walk through. But where the gap which was created was not big
enough to fit the pallets (Personal Communication, 20 February 2019).

34 (50)
Figure 8. The route of the transports to the intermediate storage (Company X, 2019).
Notes
With each pallet, a note with information about what type of products the batch had was
included. Each note had a color which represented what type of product it was. The note had
information about which product it was, article number, which processes it had gone through
and what the upcoming processes was. After each station, the operator that processed the
products in the machine, signed the note. The signing of the note was done so the next station’s
operator and the management knew who previously had handled the product. Notes could have
the same color but were from different flows in some occasions. The notes however could be
misleading, as by observation, some notes could state that the next process should be a MC but
was finished and awaited transports to the assembly line according to the Value Stream
Manager. Also, the notes could state a certain number of products which the pallet contained,
which did not necessarily match the amount in the pallet. (Personal Communication, 20
February 2019).
AXOS
The reports done to AXOS included information regarding how well the processes were doing,
the changeovers, reasons for the breakdowns etc. A total of how many parts per day could be
seen for a later evaluation of how well it met the TAKT-time. According to the operators and
the management, the reporting of changeovers varied from person to person. As one operator
might report the entire changeover as one. But another operator might split the reports in two.
The operator might report the mechanical changeover as the changeover and then log a second
report when the start-up of the machine was occurring (Personal Communication, 6 March
2019).

35 (50)
Daily meetings
The manager and the engineers of section B1 had daily meetings in the morning and a complete
rundown of how the previous day went. The results were presented for example, what went
wrong, if there is any activity that is extra important to focus on, what was good and did section
B1 meet the TAKT of the day. During the meetings the planning for the current day was
presented and put up on a whiteboard with information. In the meeting room, a whiteboard
contained information about upcoming maintenance, which people that were on site and other
tasks (Personal Communication, 20 February 2019).
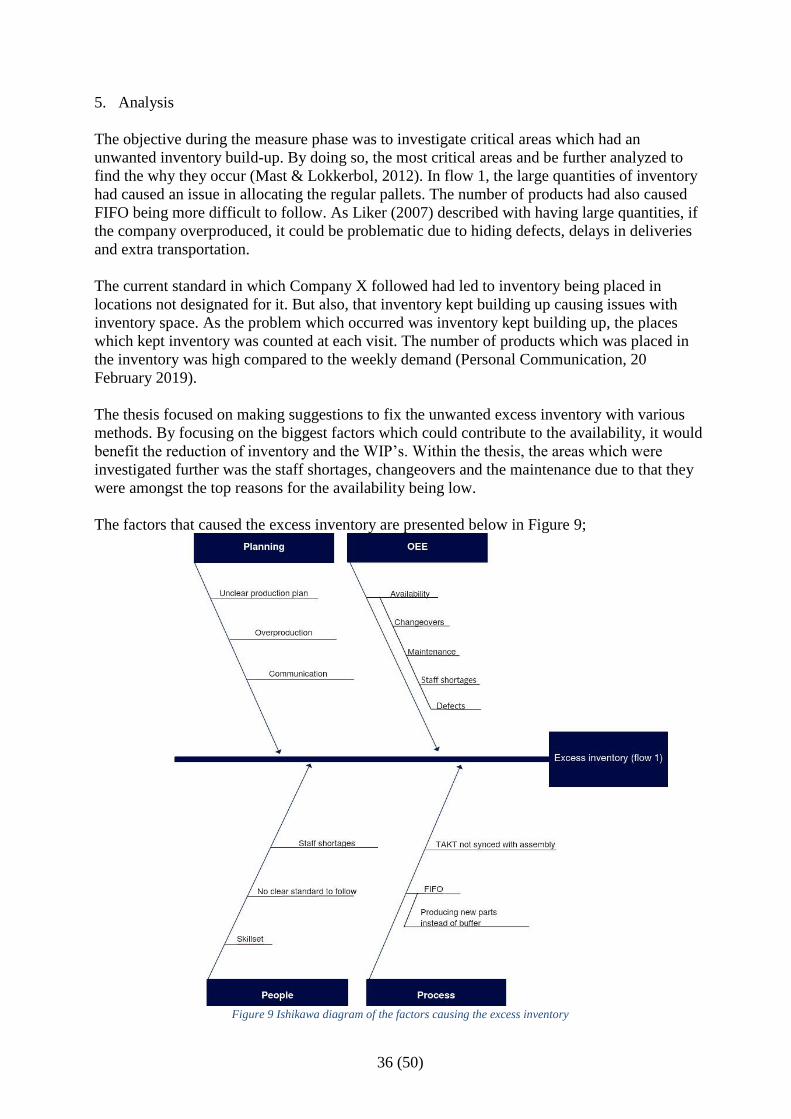
36 (50)
5. Analysis
The objective during the measure phase was to investigate critical areas which had an
unwanted inventory build-up. By doing so, the most critical areas and be further analyzed to
find the why they occur (Mast & Lokkerbol, 2012). In flow 1, the large quantities of inventory
had caused an issue in allocating the regular pallets. The number of products had also caused
FIFO being more difficult to follow. As Liker (2007) described with having large quantities, if
the company overproduced, it could be problematic due to hiding defects, delays in deliveries
and extra transportation.
The current standard in which Company X followed had led to inventory being placed in
locations not designated for it. But also, that inventory kept building up causing issues with
inventory space. As the problem which occurred was inventory kept building up, the places
which kept inventory was counted at each visit. The number of products which was placed in
the inventory was high compared to the weekly demand (Personal Communication, 20
February 2019).
The thesis focused on making suggestions to fix the unwanted excess inventory with various
methods. By focusing on the biggest factors which could contribute to the availability, it would
benefit the reduction of inventory and the WIP’s. Within the thesis, the areas which were
investigated further was the staff shortages, changeovers and the maintenance due to that they
were amongst the top reasons for the availability being low.
The factors that caused the excess inventory are presented below in Figure 9;
Figure 9 Ishikawa diagram of the factors causing the excess inventory

37 (50)
Layout
To have efficient transports, the flow must be logically planned so that the necessary transports
within the production is kept short and the route is simple. In all the production flows, the
transport route for the products was straightforward if everything went according to the plan.
The path in which the products are transported within their respective production line is shown
in Figure 5. Also, the machines and MC 1’s are not simply moved, and requires a major
operation to be able to move them. A lot of companies do not prioritize in having is focus on
the production layout, which Taj (2008) concluded in a study which was conducted across
China. The study investigated how the companies worked with a constructed LEAN-model. It
was concluded that the planning of the layout was one of the lowest scoring areas. Whereas the
production flow 1 have a well-functioning material flow if everything is up and running and the
only problem that occurs in production flow one when a shutdown happens or if sudden
changeover is performed in the MC 2.
If a sudden changeover occurs, the operator firstly must remove the materials from the machine
and then from the conveyor, the products manually into regular pallets. Secondly, the operator
then must transport the materials according to the route illustrated in Figure 8. Lastly, the
materials which are placed in the intermediate storage then must manually put up on the
conveyor when the time comes to produce the articles again (Personal Communication, 20
February 2019). Table 3 and 5 shows the number of machine-shutdowns and changeovers had
occurred during the period. The data could suggest that the transports were done frequently by
the operator. The transports done is non-value adding work and is like what in Liker (2004)
identified as so-called waste in unnecessary transports. With the help of planning, maintenance
and shorter changeovers could reduce the amount frequency of transports. It is similar to what
Chan and Tay (2016) states, where an optimization of the entire production flow would
decrease the amount of work in process, reduce the costs and furthermore produce the articles
in a quicker pace. Ignoring material flow optimization could become costly for the companies
(Chan & Tay, 2016).
Inventory management
Having inventory can in some way secure that orders are delivered in time and prevent problem
with fluctuations in the demand. But having inventory stored can have its downsides as well. If
products are stored for a longer period, the products run a risk for deterioration and would
require scrapping. Also, by having a large quantity in inventory, the holding costs of the lot is
large. Beullens and Janssens (2011) defines the holding costs as invested capital in the product,
storage costs and handling of the products. The holding cost definition can be what Company X
does when moving the material into the intermediate storage in production flow one, placing
the products in pallets and then being forced to put them back into the pallets because of a
sudden change (Personal Communication, 27 February, 2019).
The inventory which had been building up in production flow one is shown in Figure 7. The
number of products in the inventory was exceeding a week’s demand. The problems which had
occurred throughout production line was that the regular pallets were placed where it seem fit.
With that said, FIFO was not followed by the operators because of the sheer number of pallets
placed everywhere. The reason for not following FIFO and moving the regular pallets around
was the time it took to do so, as moving several pallets to secure FIFO took too much time and
energy according to the operators (Personal Communication, 20 February 2019). The moving
of materials can be linked to the waste of both unnecessary transports, time and movements as
Liker (2004) states that both are considered non-value adding.

38 (50)
Not only does the quantity in inventory possess a risk of scrapping because of deterioration.
Which is shown in the number of defects is about 2.5% according to Table 2 and 4 for the
respective machines. But also, as Ohno (1988) describes that large quantities of inventory can
hide the defects and true quality issues in the production lines. Additionally, the employees
might not want to make improvements to the process because of the overproduction which is
performed. In Company X’s case, it is difficult in saying that the reason for the inventory is just
overproduction, whereas overproducing to cope with unstable processes is a proper action.
Kalagnanam, Dawande, Trumbo and Lee (2000) explains as a possible reason for extra
inventory being produced because of the instability in the process. What the production
planning also says, that the goal is to secure the quantity of products in one go, instead of
performing changeovers frequently. The production planners say that the changeover times are
too long to produce small volumes and be forced to switch back and forth (Personal
Communication, 20 February 2019).
Kanban
The visual system is implemented and somewhat used in different areas of section B1. There
visual system contains floor markings that indicates different signals of what should be put in
the area. There are also notes with each pallet that indicates information about the products.
Production flow
Company X had paper signs on every batch produced indicating what the next process is and
what the last process was. The information was handwritten, and it also had time produced,
date, serial number and the operators sign. The notes were in some occasions misleading
because they could lack information or just not updated since the last process. Although, the
notes had color coding’s for each product type which made it easier to identify what type of
product was placed in the pallet (Personal Communication, 20 February 2019).
Gross & McInnis (2003) claims that one of the benefits with following Kanban and having a
proper visual management can support the paper signs or completely remove them. For
example, the implementation of a FIFO lane combined with floor markings with a specific
color indicates when the pallets have been produced and where they have been produced.
According to Gross & McInnis (2003), calculating Kanban quantities can reduce inventory by
25% to 75%. Company X does not have an inventory size calculation of key factors such as
downtime, scrap and changeover time. Downtime and scrap are digitally calculated with the
help of AXOS but the changeover time in Company X is estimated. The estimation of the
changeover time in MC 1 and MC 2 can range from two hours to two days according to
Personal Communication (20 February 2019).
Product scheduling
The current situation at Company X regarding the visual product scheduling for MC 2 is non-
existing. The operators were verbally told to change the product mix or to stop producing,
otherwise they just produce the same item-type that the previous shift produced. Although, the
production planning department does provide a product schedule to the operators in MC 2, but
that is not for the production flow one. Instead, the paper schedule is what the assembly section
must produce. It contributes to confusion between some operators because the part number is
not the same at the assembly station as in production flow one (Personal Communication, 20
February 2019). Gross & McInnis (2003) mentions that by using Kanban scheduling and
setting a maximum and minimum inventory levels, the levels will provide visual signals for
when to produce and when to stop. Company X does not have Kanban scheduling, nor

39 (50)
maximum or minimum inventory levels. The operators just continue to produce unless they are
told not to or when the machine breaks down according to Personal Communication (20
February 2019).
By just producing and not following the Kanban scheduling, there will be a lack of control
regarding inventory build-ups according to. If the inventory gets reduced, there is going to be
an improvement of the flow. Improvement of the flow means that there is a possibility to have
an organized and structured flow with signs, control points, flow lanes and floor markings
(Gross & McInnis, 2003).
Visual control
There is a visual management system at Company X, but it is not used properly. The areas
which has blue markings are often full by pallets so that the markings are barely visible. There
is one main area in the center of section B1 with red markings, but it is also occupied with a
large amount of stopped parts making the red markings non-visible. The only floor markings
that are followed are the black and green colors, indication machine tools and recycle
containers. Ortiz & Park (2010) mentions the importance of a proper visual control
management. As the benefits of visual control are time savings, reduction of motion and
prevention of confused employees.
There are other factors that can cause time waste and confusion between employees at
Company X. Ortiz & Park (2010) describes the steps in the 5S program where the first step is
to place everything in order, which Liker (2004) also mentions. The key is to place everything
work-related in the most optimal and time effective way according to the operators work
activities. In MC 2, the parts produced must be shipped to OUT1. The area OUT1 is not visible
from the MC 2 which leads to that the operator needs to walk over to OUT1 and check how
many pallets there are left. The operator does know the actual takt of the assembly but does not
get a notification that the pallet has been taken.
OEE
By reducing the quantities in inventory and aiming for the implementation of KANBAN, a first
step is having a stable process is crucial. Having breakdowns occurring frequently does not
make it easy to plan accordingly as with the case of Company X, which had an OEE which was
low regarding the set goal. In making improvements to the OEE, it prevents the production
system to become sub-optimized (Garza-Reyes, Eldridge, Barber & Soriano-Meyer, 2010).
The empirical data from the machines was taken from AXOS during the period of 2019-01-01
to 2019-03-06. Using the data from a longer set period, increases the accuracy of the data.
Also, it reduces the deviations in data that can occur if the set period was short. It is what Saha,
Syamsunder and Chakraborty (2016) described as being a good way of understanding the OEE,
where collecting data from a longer set period of time would be provide more reliable data and
it would be less deviations.
The low OEE of MC 1 comes mainly from the availability. The availability was at 64%
whereas the total OEE percentage of MC 1 was at 62,45% which was shown in Table 2. It
means that the planned working time is low in respect to the actual time worked according to
the definition by Pinteleon and Munchiri (2008).The availability losses in the MC 1 comes
from the filter cleaning, emergency breakdowns, changeovers and planned retooling which
corresponds to what Saha, Syamsunder and Chakraborty (2016) describes as possible losses in
the availability.

40 (50)
MC 2 had the OEE of 43,99% according to Table 4, where contributors to it was both the
availability and the performance rate. The availability was 57,8% and the performance rate was
at 77,10%. The performance rate comes from speed losses and sudden changes which will
implicate the production, such as the staff shortages. The combination of having the low OEE
of both the machines and the production planning will to produce gives a hint of why the
inventory builds up. It can be done by identifying the most important reason for the bottlenecks
within a production line is important. The study done by Lu and Yang (2014) with the help of a
Value-Stream map did. The information that was gathered in the Value-Stream map made it
easier for Lu and Yang (2014) to see the real bottleneck.
5.7.1. Changeovers
Performing the changeovers efficiently with the shortest amount of time is paramount to enable
the production system to be flexible. As the current changeovers within the production line
flow 1 takes more than several hours to complete. The MC 1 requires up to 10 hours to be up
and running if switching to another product family (Personal Communication, 20 February
2019). The low OEE was one of the explanations the production planner had to why the
inventory kept building up, as the both the MC 1 and MC 2 had such low OEE percentages.
The production planners' reason could be seen as what Kalagnanam, Dawande, Trumbo and
Lee (2000) describes as building up a surplus of inventory to cope with instability within
processes. By having such inventory, the customer demand can be more easily satisfied
according to the production planner (Personal Communication, 20 February 2019).
The sudden changeovers could provide the operators with extra workload as having to pick the
finished products in and out of the regular pallets. The transport route that was taken in order to
place the products in the intermediate storage near the MC 1 is long and will give the operator
twice the amount of work as the operator then has to re-place the products on the conveyor
when the products are in demand again (Personal Communication, 20 February 2019). The
long transport route to the intermediate storage is required to take as the gap in the conveyor is
too narrow and the MC 1 is not being moved. A focus on reducing the frequency of them
should be prioritized, as the transports are not value adding activities. MC 2 has a quicker
changeovers time then the MC 1 but it still can take up to eight hours to perform both
mechanically and with the measurements of the test pieces. The reduction of the changeover
times could minimize the waiting time which is one of the 7 +1 wastes within TPS Liker
(2004).
The data in Table 3 and Table 5 shows that the average times of the changeovers are
3034minutes (50,56h) and 3395 minutes (56,58h) respectively. The numbers could be
misleading whereas Company X does not have any set standard when reporting what type of
changeover is performed. For example, the category of start-up might be included in the
changeovers according to the Value Stream Manager (Personal Communication, 20 February
2019). By not having any standardized routine when logging the changeovers, the actual times
the different changeovers takes are just a rough estimate. Furthermore, without the proper
standards when both performing and reporting the changeovers and it is difficult in finding
areas of improving, whereas Liker (2004) states that the standardized work could be a base for
continuous improvements. It is similar to what Chan and Tay (2016) describes about Kaizen
events. With no set standards in how to perform them, making improvements will become
difficult. Also, the core of standardized work and that the standardization of the sequence a
certain task or operation is vital. Both the reporting of the changeovers and performing the
changeover could differ in time between the operators which can indicate that no standard is
followed.
41 (50)
5.7.2. Maintenance
The filter cleaning is done on many occasions in the MC 1, although the removing of residue is
done in order to prevent quality issues and keeping the operations running. The filter cleaning
is similar to what Suliman and Jawad (2012) describes what planned maintenance is, which is
something done in order to ensure the systems reliability and quality. But Company X does not
report the filter cleaning as such preventative maintenance because it was supposed to be just a
temporary solution. Also, Pham and Wang (1996) claims that having a well thought of
maintenance strategy would be good economically for the company as having a machine
breakdown causes issues in the production system. Company X had to repair both the MC 1
and the MC 2 frequently during the investigated period, which had led to the production
systems availability to suffer. The emergency repairs are similar to what Pham and Wang
(1996) describes as corrective maintenance. It is when something within the machine occurs
which requires repair instantly.
The MC 1 has the category of planned maintenance in the Table 3 and it shows that it is being
prioritized in order to fix the problems before the need of corrective maintenance arises. But in
the MC 2’s case, the category of planned maintenance is not shown in the Table 5. The reasons
for this may vary, where one reason might be that it is not being prioritized at all or that the
amount required to perform it is low. Liao and Sheu (2011) applied a model to find optimal
preventative maintenance and the conclusion was that planned maintenance had to fail to learn
and furthermore optimize it. Having a trial and error strategy in order to learn from it, could
benefit Company X in the long team, as the optimal preventative maintenance will be reached.
In the article by Suliman and Jawad (2012), it was concluded that with a longer period between
the preventive maintenance would decrease the inventory levels and decrease the total costs.
5.7.3. Defects
The defects can be linked to waste in both time and to the overproduction of products. Taiichi
Ohno (1988) describes that defects can hide within batches that have been produced, exceeding
the daily demand of products. Hence, overproducing the products. The waste in time occurs
when the operators must perform the 100% check as a quality issue had arisen in one of the
previous batches.
5.7.4. Staff shortages
According to Attia, Duquenne & Le-Lann (2014), it is crucial to have a multi-skilled workforce
to gain flexibility and achieve high responsiveness. By observations, it was noticed that
Company X´s operators in the section B1 always worked in the same flows. Because Company
X are sensitive for changes in personnel, for example if someone suddenly gets sick, staff
shortages are a high reason of why the machine are not operating. Attia, Duquenne & Le-Lann
(2014) mentions that companies that are dependent on individuals may force to outsource their
missions. The dependency of qualified workers at Company X is an issue, where the total stop-
time is at 162 hours for MC 1 and MC 2.
5.7.5. Changeover
The changeovers contribute greatly to the availability of MC 1 and MC 2 by reducing the time
in which a changeover takes, the availability will be increased. With a prioritization of
improving the major changeovers, the ones performed across the products families, the
flexibility of the production system would increase.
By having a tool in which helps to reduce the time of changeovers would benefit the MC 1 and
MC 2 greatly. The application of the LEAN-tool, SMED, could prove useful to reduce the

42 (50)
changeover time. With a SMED-project, the changeover time could be reduced and a new
standard in how to perform a changeover could be introduced. According to Ulutas (2011), the
first step of a SMED operation is to analyze the actual time the changeover takes. Ulutas
(2011) suggests the use of a video recorder to record the entire changeover procedure in order
to be able to analyze the video and determine the total time and actions needed for the current
changeover. Secondly, with the help of the video the unnecessary actions in the changeover
will be removed. Thirdly, the categorization of the different steps, is the performed action an
internal or external step. As Shingo (1985) means that the third step of categorizing is crucial
and most important. Furthermore, the fourth step is to see if any of the external steps could be
done before the changeover or during the start up. Lastly, with the new model, the process of
performing a changeover is now the new standard. The new standard could be used as a base
for continuous improvements, which Lu and Yang (2004) states.

43 (50)
6. Suggestions for improvements
The analysis showed that the inventory build-up occurs because of the investigated factors high
occurrence and severity. Making improvements in such way that these factors decrease in
frequency and severity. The improvements could lead to more flexibility in the planning of the
production and hence, requiring less inventory to be built-up.
The improvements should be sequentially implemented by starting with the highest factor
contributing to the excess inventory which are presented in Table 6. The sequence is chosen
because everything is connected to the OEE factor. If the OEE is high and trustworthy, the
production planning may only produce the products required for the order. When OEE and
planning are in order, Company X can start to educate their employees to possibly solve the
staff shortage issue. People is put under planning because when the planning creates a clear
production schedule for flow 1, the VSM manager may know how many employees are
required for each day and that may help the manager to avoid staff shortages. When the OEE is
higher, the planning department produces only what needed and the staff shortages are lower,
Company X can thereupon begin to implement tools to standardize and improve the process.
Suggestions Sequence of improvements
OEE 1
Planning 2
People 3
Process 4
Table 6 Sequence of implementing the suggestions
OEE
Sorting the issue of the low OEE flow 1, the flexibility of production will increase hence giving
the production planner more room to plan in such way that the inventory build-up does not
arise to the same levels. In the MC 1, the availability was the major contributor for the low
OEE, whereas the performance rate and availability were the biggest contributors in the MC
2’s OEE.
Company X has to create a standardized routine in how the reporting of failures are done.
Currently, the operators do what feels best for them and with the new standard, time times of
the categories will be more accurate and easier to follow up on and improve. The analysis
showed that with standardized work comes great improvements if utilized correctly.
By only producing the necessary products, the transports between the MC 1 and the
intermediate storage will be reduced, hence reduce the waste in transports. With applying a
clear order plan which shows the operators what they need to produce and when, will reduce
the double work that is currently occurring as the operators has to pick the products in and out
from the regular pallets.
Firstly, to be able to make improvements to the changeovers an accurate time of how long a
changeover took to perform is necessary. With collecting of the times, the changeovers took to
perform, it will work as the new standard. Secondly, the use of a SMED-project on both the
MC 1 and MC 2 could prove useful in order to reduce the actual time the changeover took. By
recording the changeover process, Company X can analyze the video and then remove
unnecessary steps in the process. Furthermore, the steps the operators take in order to perform
the changeover could be categorized into internal and external steps. The separation of the
44 (50)
internal and external steps would show what could be done parallel to the changeover and what
is required to make the changeover mechanically. The new standard regarding how the
operators should perform the changeovers will be the base for the continuous improvements
and future Kaizens (Ulutas, 2011).
The data from the Table 3 and 5 suggests that the corrective maintenance and planned
maintenance plays a major part in the low availability. Even though the reasons for the
emergency reparations are not known, the need to reduce the corrective maintenance will
improve the systems reliability. As having the production stopping frequently because of
machine breakdowns makes it difficult to plan accordingly. The planned maintenance needs to
be improved in order to reduce the corrective maintenance. Also, making a permanent solution
for the filter cleaning will reduce that category and probably increase the planned maintenance
instead.
Planning
Achieving a higher OEE, the number of products which production flow 1 can produce will
increase. As the OEE increases, it will give the production planning the flexibility of producing
only the required products. The current standard is to produce extra products because of the
changeover’s times, OEE and a personal preference. If this is applied, the inventories may be
reduced.
People
Staff shortages is a common reason of the MC 2 and MC 1 stop time. The staff shortage stood
for 10% of the total stop time in MC 1 and 18% in MC 2. The total time of staff shortages in
the period of 2019-01-01 to 2019-03-06 are 162 hours. Attia, Duquenne & Le-Lann (2014)
talks about the importance of gaining a multi-skilled workforce which enables the flexibility
and may reduce staff shortages. Company X may cross-train the workers so that the skill-levels
in B1 is streamlined, meaning that every operator has the same knowledge of the processes.
Process
In order to achieve a standardized and visualized system, Company X can use the 5S program.
By following the five steps sort, set in order, shine, standardize and sustain which Liker (2004)
describes, Company X may create more space and improve their visual management. When the
OEE is high and trustworthy, our suggestion is that Company X starts with;
Sort
Company X should begin the 5S program with the flow 1 as the main focus. Ortiz and Park
(2011) mentions that it is best to start the 5S program in one specific area in the company to
become and stay focused. Company X has to evaluate how much of their inventory is adding
value to them. The built-up inventory that is not adding value to Company X should be
prioritized and delivered to assembly whenever they need it, meaning that Company X should
send the finished goods before they start to produce new batches. Because some floor marking
is used, and some are not, a suggestion is that Company X removes all inventory floor
markings, so they can create a new system. By removing all floor markings and the built-up
inventory, Company X can “start from the beginning” and enable a successful implementation
of 5S.

45 (50)
Set in order
When the built-up-inventory is cleared, and the floor markings removed, the next step is to
create a permanent placement of the inventory. In this step, it can be to consider a FIFO lane
implementation with the maximal number of pallets as Roser and Nakano (2015) mentions.
Company X can also consider implementing Kanban combined with FIFO lanes. This may
benefit Company X in having full control over the production between processes and enable
the implementation of JIT which Gross and McInnis (2003) stated. For the purpose of
implementing Kanban, the OEE must be tolerably high so that the production planning can rely
on having a controlled low amount of finished goods without worrying of late shipment
Our suggestion is to implement both Kanban and FIFO lanes. Company X has roller conveyors
that were not in use. The implementation of the conveyors may act as a Kanban signals in flow
1, meaning that when the assembly delivers empty pallets, it is a signal to start the production.
It is important to have two roller conveyors in flow 1, one for the empty pallets and one for
pallets with finished parts. The roller conveyor for the finished goods signals that the assembly
may have problems and that the flow 1 production should stop until there is an empty pallet on
the other conveyor. The implementation of the roller conveyors also enables and simplifies the
implementation of FIFO lanes, because the conveyors ensures the placement of pallets are
according to FIFO.
The Kanban scheduling system is not functional without some form of visual control; therefore,
the positioning of the roller conveyors should be close to MC 2 so that the operator can see the
Kanban signals from the workspace and to reduce waste in movement. If there is not space for
roller conveyors near MC 2, Company X should consider implementing a barcode system
where the operator always gets a notification when something is picked up or delivered to the
conveyors.
Figure 10. Vision of the FIFO-system (Personal Communication, 2019).

46 (50)
Shine
Because the roller conveyors have been stored outside, Company X may need to refurbish them
and do an overall service. Our suggestion is that Company X considers cleaning all surfaces of
the roller conveyor to help the operators so perform their jobs, which Ortiz and Park (2011)
stated in the step shine.
Standardize
When the roller conveyors are in order and the Kanban scheduling done, it is necessary to
maintain some level of consistency in the workspace. For example, it should not be allowed to
put any inventory on other places than the roller conveyors. The Kanban scheduling should be
the pull signal and there should not be any production if there are not empty pallets on the
conveyors. It is a good idea for Company X to educate their operators in using Kanban
scheduling to keep the consistency and improve the understandings of the process. It is also in
this step where floor markings should be conducted to visualize the workspace. Our suggestion
is that Company X keeps their current color-coding to avoid confusion between different
sections in the company. The roller conveyors should have red or yellow-colored areas around
them. The color red or yellow indicates that nothing should be put in front, behind nor on the
sides of the conveyors.

47 (50)
7. Conclusion
The conclusion will provide a short description of the research questions and then provide the
answers for them.
RQ1: What may cause excess inventory at a manufacturing company?
The first research questions which regards the factors that could cause excess inventory at a
manufacturing company was investigated. With conducting a case study at a manufacturing
company to examine what the factors could be, the research question could be answered.
The case company that was visited had experienced a build-up of inventory and wanted to
know why it kept on building up and how to deal with the issue. In making observations,
interviewing operators and analyzing the data from the monitoring software, a clear picture of
what factors contributed to the build-up the most was identified.
In the production flow 1, which consisted of two machine cells, the machine cells were
unreliable due to a low number in the OEE. Furthermore, the OEE had been caused by long
changeover times, high amount of corrective maintenance and staff shortages. With these
factors in mind, the production planner had to make sure that the assembly had products to
assemble even though the system was unreliable. The method that was used was to produce to
buffer, overproduce, which made sure that required products was procured. The production had
led to the inventory being crowed and made operators to place the products where room was
available.
RQ2: How can a manufacturing company reduce the WIP’s?
In making changes to these factors, the reliability of the production system will increase. It will
give the production planner the flexibility in only having the required products for the order
instead of producing extra to buffer. With a standardized approach to the reporting of
changeovers it will prove as a base for future improvements by Kaizen’s which may increase
the availability of the production system. By increasing the reliability of the system, the need
for the number of products currently held in inventory at Company X is not needed, hence
reducing the WIP’s of production flow 1.
With the reduction of the WIP´s, it creates a possibility to apply a 5S program. Combining the
5S program with FIFO and KANBAN will result in a controlled inventory management. FIFO
will ensure that the first item produced is the first item to be picked up by assembly while the
Kanban scheduling will control on how many WIP´s are currently in the flow.
Discussion
The identified factors which had caused inventory build-up at Company X were only specific
to that company. If another case study would be conducted at another company, other factors
might appear as well.
Other ideas that can decrease the changeover times is to investigate the possibility in having
production flows which only consists of the same product family. By implementing such
feature will remove the need for the major changeovers which contribute to a high percentage
in the availability.
For the reduction of WIP’s to be in full effect, the production planner needs to have courage
and the will to change the culture. Previously, the production planner produced because the it

48 (50)
felt good to have it in buffer. But if the changes are implemented, the planner needs to adapt
and produce only according to the orders.
The data from AXOS is limited to the period of 2019-01-01 – 2019-03-06. The limitation may
cause unreliability in further research with different numbers of the average OEE depending on
the length of the chosen period.
49 (50)
8. References
Chan, O.C., &. Tay, L. H. (2018). Combining lean tools application in kaizen: a field study on
the printing industry. International Journal of Productivity and Performance
Management, 67(1). 45-65. doi:10.1108/IJPPM-09-2016-0197
Dahlgaard, J. J., Kristensen, K. & Kanji, K. G. (2002). Fundamentals of total quality
management. London: Taylor & Francis.
El-Awad, A., Philippe, D., & Le-Lann, M. J. (2014), Considering skills evolutions in multi-
skilled workforce allocation with flexible working hours, International Journal of
Production Research. 52(15), 4548-4573. doi:10.1080/00207543.2013.877613
Garza‐Reyes, A., Jose,. Eldridge. S., Barber, K., & Soriano‐Meier, H. (2010). Overall
equipment effectiveness (OEE) and process capability (PC) measures: A relationship
analysis, International Journal of Quality & Reliability Management. 27(1), 48-62.
doi: 10.1108/02656711011009308
Grief, M. (1991). The Visual Factory, Building Participation Through Shared Information.
Portland: Productivity Press
Gross, M.J., & McInnis, R.K. (2003) Kanban made simple: demystifying and applying
Toyota’s legendary manufacturing process. New York: Amacom
Harrison, A., & Hoek, V.R. (2008). Logistics Management and Strategy, Competing through
the supply chain. Harlow: Pearson Education Limited
Hollway W, Jefferson T (1997) Eliciting narrative through the in-depth interview. Qualitative
Inquiry, 3(1), 53-70. doi:10.1177/107780049700300103
Kalagnanam,, J. R., Dawande, M. W., Trumbo, M., & Lee, S. H. (2000). The surplus inventory
matching problem in the process industry. Institute for Operations Research and the
Management Sciences, 48(4), 505-516. doi:10.1287/opre.48.4.505.12425
Koning, D. H., & Mast, D. J. (2006). A rational reconstruction of Six‐Sigma's breakthrough
cookbook, International Journal of Quality & Reliability Management. 23(7), 766-787.
doi:10.1108/02656710610701044
Liao, L. G., & Sheu, H. S. (2011). Economic production quantity model for randomly failing
production process with minimal repair and imperfect maintenance. International
Journal of Production Economics. 130(1), 118-124.
doi:10.1080/00207721.2012.659702
Liker, J.K. (2004). The Toyota way: 14 Management Principles from the World’s Greatest
Manufacturer. McGraw-Hill
Lu, J. C., &. Yang, T. (2015). Implementing lean standard work to solve a low work-in-process
buffer problem in a highly automated manufacturing environment, International
Journal of Production Research. 53(8), 2285-2305.
doi:10.1080/00207543.2014.937009
Mast, D. J., & Lokkerbol, J. (2012). An analysis of the Six Sigma DMAIC method from the
perspective of problem solving. International Journal of Production Economics.
139(2), 604–614. doi:10.1016/jijpe.2012.05.035
Negri. E., Perotti, S., Fumagalli, L., Marchet, G., & Garetti, M. (2017). Modelling internal
logistics systems through ontologies. Computers in Industry, 88, 19–34.
doi: 10.1016/j.compind.2017.03.004
Ohno, T. (1988) Toyota Production System: Beyond Large-Scale Production. Portland:
Productivity Press.
Okes, D. (2009). Root Cause Analysis, The Core of Problem Solving and Corrective Action.
Milwuakee: Quality Press.
Ortiz, A.C., & Park, R.M. (2010) Visual Controls, Applying Visual Management to the
Factory. New York: Productivity Press
50 (50)
Pham, H., & Wang, H. (1996). Imperfect Maintenance. European Journal of Operational
Research. 94(3), 425-438. doi:10.1016/S0377-2217(96)00099-9
Pintelon, M. Y. A, Liliane, N. P., & Muchiri, N. (2008). Performance measurement using
overall equipment effectiveness (OEE): Literature review and practical application
discussion. International Journal of Production Research, Taylor Francis. 46 (13),
3517-3535. doi:10.1080/00207540601142645
Roser, C. & Nakano, M. (2015). Guidelines for the Selection of FIFO Lanes and Supermarkets
for Kanban-Based Pull Systems – When to Use a FIFO and When to Use a
Supermarket. In Umeda S., Nakano M., Mizuyama H., Hibino H., Kiritsis D., von
Cieminski G. (eds) APMS 2015. IAICT, vol 460, pp. 282-289. Springer, Heidelberg
(2015).
Schulze, L, Wüllner, A (2006). The Approach of Automated Guided Vehicle Systems, 2006
IEEE International Conference On Service Operations And Logistics, And Informatics,
Service Operations And Logistics, And Informatics. SOLI '06. IEEE International
Conference On, p. 522 Shingo, S. (1985). A revolution in manufacturing: the SMED
system. Productivity Press, Stamford, Connecticut.
Suliman, M.A.S., & Jawad, H.S. (2012). Optimization of preventive maintenance schedule and
production lot size. International Journal of Production Economics. 137(1). 19-28.
doi: 10.1016/j.ijpe.2012.01.006
Taj, S. (2008) Lean manufacturing performance in China: assessment of 65 manufacturing
plants, Journal of Manufacturing Technology Management. 19(2). 217-234.
doi:10.1108/17410380810847927
Ulutas, B. (2011). An application of SMED methodology. World Academy of Science,
Engineering and Technology. 79. 100-103. doi:10.5281/zenodo.1083869
Vatalaro, C.J., & Taylor, E. R. (2005). Implementing a Mixed Model Kanban System: The
Lean Replenishment Technique for Pull Production. New York: Productivity Press.
Williamson, K. (2002). Research methods for students, academics and professionals
Information management and systems. 2. ed: Wagga Wagga, New South Wales.
Zijm, H., Klumpp, M., Regattieri, A., & Heragu, S. (2019). Operations,
Logistics and Supply Chain Management. Cham: Springer International Publishing AG.