identifying and evaluating revenue strategies for parks
TRANSCRIPT
San Jose State University San Jose State University
SJSU ScholarWorks SJSU ScholarWorks
Master's Projects Master's Theses and Graduate Research
2015
Identifying and Evaluating Revenue Strategies for Parks and Identifying and Evaluating Revenue Strategies for Parks and
Recreation Departments across the Western United States Recreation Departments across the Western United States
Beth Pinkston San Jose State University
Follow this and additional works at: https://scholarworks.sjsu.edu/etd_projects
Part of the Recreation, Parks and Tourism Administration Commons
Recommended Citation Recommended Citation Pinkston, Beth, "Identifying and Evaluating Revenue Strategies for Parks and Recreation Departments across the Western United States" (2015). Master's Projects. 414. DOI: https://doi.org/10.31979/etd.n539-8e2z https://scholarworks.sjsu.edu/etd_projects/414
This Master's Project is brought to you for free and open access by the Master's Theses and Graduate Research at SJSU ScholarWorks. It has been accepted for inclusion in Master's Projects by an authorized administrator of SJSU ScholarWorks. For more information, please contact [email protected].
Identifying and Evaluating Revenue Strategies for Parks and Recreation Departments across the Western United States
Beth Pinkston
A Thesis Quality Research Project Submitted in Partial Fulfillment of the Requirements for the Masters of Public Administration
1
Introduction The City of San Jose Parks, Recreation, and Neighborhood Services department’s
core services are to provide recreation and community services and to maintain and
operate parks. The department’s vision is to be a national leader among Parks and
Recreation departments by cultivating healthy communities through quality programs and
dynamic public spaces. Its mission is to build healthy communities through people, parks
and programs. This study revolved around the concept of financial sustainability for
Parks and Recreation departments. Many Parks and Recreation departments are highly
dependent on their municipality’s general fund. This can cause programming and
sustainability issues when there is a budget shortfall and the general fund has to be
reduced.
The City of San Jose has been using several tactics in order to be less dependent
on its general fund including grant applications, partnerships with other local
governments, reuse programs, facility rentals, and sponsorships or naming rights for local
businesses or corporations. In 2009, the City of San Jose passed the “Pricing and
Revenue Policy” in order to be more consistent with council policy and remain within
approved cost recovery goals. The Parks, Recreation, and Neighborhood Services
Department (PRNS) made the goal to increase its cost recovery level to forty percent by
2014. Recently, the City of San Jose Parks and Recreation Department has reached a
thirty-nine percent cost recovery rate.
The Recreation and Community Services Division Manager initiated the idea of
surveying other large cities along the western United States to see what methods their
Parks and Recreation Departments are employing to be financially sustainable. The goal
2
of this this paper has been to study the strategies currently being implemented to
determine which would be feasible and beneficial for the City of San Jose Parks and
Recreation Department to adopt. The concept of feasibility was be analyzed in terms of
simplest and smoothest implementation processes, and the concept of beneficial was
analyzed in terms of highest level of financial savings or gain for the department.
The City of San Jose seeks to be a dynamic and innovative leader among the
nation’s Parks and Recreation Departments. This project has helped foster that
commitment by researching innovative programs and policies that may be beneficial for
the City of San Jose to implement and by also helping to lead the way for other cities to
become less dependent on their municipality’s general fund. Therefore, the two research
questions for this project are as follows: 1). What revenue strategies are being adopted in
large cities across the western United States to enable Parks and Recreation Departments
to be financially sustainable and less dependent on their municipal general fund? 2).
Which of these strategies would be the most feasible and beneficial for the City of San
Jose to implement?
Background
In 2007-2008, prior to the implementation of the Pricing and Revenue Policy of
2009, the City of San Jose Parks, Recreation, and Neighborhood Services department had
an operating budget of close to $70 million dollars. The programs or services the City of
San Jose PRNS department provided tended to be free or well below the market value. As
reported in the PRNS Pricing and Revenue Policy Memorandum dated March 2009, the
cost recovery rate for the department was approximately 22%, meaning that 78% of
program costs were supported by the general fund. The department focused more on the
3
importance of delivering services to the community rather than on how cost effective the
service was or how beneficial the service was to the community (Pricing and Revenue
Policy 2009).
Given the fiscal environment and the significant general fund budget deficit, the
PRNS department re-evaluated the services it provided and evolved its service mentality
to better match its resources. The department could eliminate or greatly reduce services,
increase user fees, or find other alternative strategies to generate more revenue. The
PRNS department decided upon two major actions: (1) to revise its Green Print, a
twenty-year plan and business model for the department, and (2) to develop the Pricing
and Revenue Policy, which provided guidelines for the department to determine how to
be less dependent on the City of San Jose’s general fund.
The current Green Print is comprised of several sections, including an elements
section, which states the vision, mission, guiding principles, goals, and strategies for the
PRNS department for the next twenty years. Within the body of the document, there are
three major sections, which include financing and marketing strategies, facilities and
programs within the PRNS department, and urban planning area strategies. The section
on financing and marketing strategies is useful for understanding the various revenue
strategies that recreation departments might employ. For example the financing section
suggests the three options of created income, partnerships, and differential pricing
methods. The area of created income includes pursuing grants, sponsorships, and
foundation funding. The area of partnerships involves working alongside both private and
public entities in order to build relationships with volunteer groups, school districts, and
community based organizations. Lastly, the area of differential pricing methods includes
4

adding a variety of differential rates based on weekend or weekday times for facility
rentals, as well as, early bird registration opportunities in order to best accommodate the
schedules and price points of potential customers (Green Print Table of Contents 2009).
These sections in the Green Print highlight what the City of San Jose is currently doing
to pursue sustainable revenue strategies for the Parks, Recreation, and Neighborhood
Services department.
The previous Green Print was written in September of 2000. Since then, there had
been numerous changes in the City of San Jose’s environment, causing a need to update
the original Green Print. The original format planned on receiving an annual investment
of $60 million dollars to complete all intended projects by the year 2020. However, based
on the fiscal situation of 2009, which included declining revenues in PRNS’s operating
and capital funds, the Green Print was revised to include realistic expectations of when
projects could be delivered or completed. The updated Green Print also shifted the
department’s focus towards projects that would build a sustainable foundation for the
future (Green Print Introduction 2009). The new goals of the department included
providing environmentally and financially sustainable recreation programs and
infrastructure assets, environmentally responsible recreation facilities, accessible
recreation opportunities in order to be responsive to the health of the community,
partnering with the community in order to promote environmental stewardship and
volunteerism, improving the livability of the surrounding community by providing
quality programs and facilities, and lastly, by providing nationally recognized parks,
trails, open spaces, recreation amenities and programs that meet the growing needs of the
community (Green Print Elements 2009).
5
The new Pricing and Revenue Policy for PRNS was approved in June 2009. It
provided a framework for the department to determine how much to subsidize services,
created a financially sustainable approach to recreation services and facilities, and
ensured affordable access to programs and services. All fees and charges for PRNS
services now developed have to be consistent with the policy.
The five guiding principles are:
1. Identify the level of benefit a customer receives to determine the subsidy
level. The three different levels of benefit are public, merit, and private services.
Public services are highly subsidized because they provide the highest level of
benefit to the community (Examples include youth services or access to
neighborhood parks), Merit services have a combination of community benefit
and individual/private benefits (Examples include swim classes or senior
recreation), and Private services have individual benefit with little to no
community benefit (Examples include dance or piano lessons).
2. Calculate the cost of services and include direct and indirect costs.
3. Determine the cost recovery goals by considering the level of benefit (described
in point one), cost of service, and the availability of funding.
4. Ensure affordable access by providing scholarships.
5. Create revenue by pursuing sponsorships and grants. Another strategy to generate
more revenue is to diversify the pricing method (prime and non-prime time rates)
to optimize when a facility is used that best fits schedules and price points.
Develop partnerships with other agencies to enhance services and keep the
programs affordable.
6
These five guiding principles have assisted the PRNS executive leadership staff to
determine sustainable pricing methods for the services, programs, and classes the
department provides to the public. A positive implication of these guiding principles has
been the ability for the department to calculate costs that are competitive with the average
market rate when providing private services, such as dance or soccer lessons, for the
community. These principles have also created a way for offering needed public services,
such as, youth services or access to neighborhood parks, at an affordable rate for
community members who need them. Every city has unique and differing needs, and
these guiding principles have worked at identifying the needs and wants of the
community, creating pricing methods that are financially sustainable for the department,
providing scholarships for those in need, and utilizing collaborative partnerships to
enhance current programs and services.
The general fund subsidy for PRNS reduced from 78% to 72% after the first year
the policy was implemented. The department’s general fund dependence has further been
reduced in each subsequent year and in 2013-2014, the reliance was estimated to be just
below 40%. As highlighted in the 2013 Annual Report for PRNS, 20,318 participants
enrolled in programs and services. PRNS provided 582 programs for adults, 2,815
programs for children, and 168 programs for special needs individuals. It is also
estimated that the City also partnered with over 300 various community-based
organizations and outside agencies (City of San Jose PRNS Annual Report 2013).
Significance
This topic has been important to research due to the numerous stakeholder groups
it will benefit. The stakeholders of this research project include Parks and Recreation
7
Department administrative staff who implement the pricing policies, field staff who carry
out policies, the organizations who partner with the city or choose to sponsor a city
program, program participants who partake in the City of San Jose’s recreation services,
and third party community members who benefit from the positive externalities of the
department’s services. What are the interests of these stakeholders? Administrative
personnel value cost efficiency and the ability to grow the cost recovery rate of the
department. Field staff value customer service and increasing the number of participants
who enroll in their programs or receive their services. Outside organizations often give
out of benevolence or with the additional opportunity of marketing their organization.
Program participants value receiving quality recreation experiences at an affordable
price. This research project aims to provide a benefit to all stakeholder groups by
researching revenue strategies that will increase the cost recovery rate of the department
while also continuing to offer sustainable, quality programs for the public.
The intent of this paper has been to benefit the City of Jose Parks, Recreation, and
Neighborhood Services Department, as well as, other large cities across the western
United States. In research databases, which house scholarly articles, one would find that
the body of knowledge is full of articles devoted to park conservation and revenue
strategies for national and state parks. There is a limited amount of data available that
focuses specifically on recreation services offered at a local level. The lack of available
research for the local level park system has led to the motivation behind writing this
paper. Therefore, a reason for completing this research paper was contributing to the data
available involving local Parks and Recreation departments. Finally, the overarching
purpose of this research project was to add to the scholarly knowledge available in order
8
to help administrative staff when proposing policy changes to council members and local
policy makers. In addition, the purpose of utilizing a survey was to learn from other
municipalities and gain insight from their experiences. In the long run, effective revenue
strategies will help valuable and well-loved programs endure during times of financial
difficulty.
Literature Review
This review will address some work already completed on parks departments and
national recreation agencies, which provides valuable information to this study. In a
general sense, this literature review will explore research about local government cut
back management strategies. It will explore general parks and recreation management
and how these agencies are working to increase revenues and provide a sustainable
income. Current and recent tactics for identifying financial strategies and public
perspectives on these financial strategies will be addressed as well. The outline of this
literature review will address five major questions regarding revenue strategies for local
parks and recreation departments.
1. What previously complied or published studies provide the best available information?
2. What do these selected studies conclude about local government parks and recreation fiscal management and revenue strategies?
3. What are the apparent methodical strengths and weaknesses of these studies? 4. What remains to still be discovered about the topic? 5. What appears to be, according to the studies selected, the most effective
methods for developing new information on this topic?
First, what previously complied or published studies provide the best available
information? When searching through research databases, there are numerous
articles on public agency fiscal management, but not much research specifically on
local parks and recreation departments. The relevant research that was ultimately
9
included for use in this project touched on topics as broad as surveying the public’s
opinion with respect to how local governments are handling fiscal stress, as well as,
articles describing how local government agencies view intergovernmental financial
aid during times of instability. Articles with a more narrow focus, such as a case
study on the City of Santa Ana, were incorporated because they looked at the
detailed components involved in a community overcoming its high budget deficit.
Second, what do these selected studies conclude about local government parks
and recreation fiscal management and revenue strategies? The studies, articles, and
documents that have been selected have proven beneficial because they cover both the
explanation of current and plausible revenue strategies, as well as, survey results of the
public’s perspectives on these strategies. The following paragraphs will focus on question
number two and dive deeper into what each individual scholarly source has found. The
first few articles will look at the issue of government financial resources at large, and the
latter articles will focus primarily on the specific components of parks and recreation
departments.
Dellar and Maher (2006) found that local governments treat Federal and
intergovernmental aid differently during times of stability and instability. During times of
stability, local governments will treat the aid transfers as permanent and most likely build
it into its base budget. However, in times of instability, local governments will treat aid
transfers as stimulatory and use it as a temporary source of funding. In addition, in times
of instability, local governments are more inclined to cut quality of life services, such as,
libraries, parks, and recreation services. Parks and recreation services are one of the first
services to be downsized when there is fiscal stress (Dellar & Maher 2006).
10
Carr, et al (2010), surveyed residents of the state of Michigan to learn their
priorities in times of government fiscal stress. A majority of residents would allow for tax
increases for public safety services. However, when referring to non-public safety
services, such as, street cleanings, garbage collection, and parks and recreation services, a
majority of residents were in support of contracting out services to nearby governments
and private vendors. Residents did not necessarily support cutting public employee
positions or wages. Instead, residents were in favor of creating strategies to continue the
current status of local public services (Carr, et al. 2010). This article helps illuminate the
public’s views surrounding government budget deficits.
The next two sources are helpful because they show in two specific case studies
how communities chose to handle fiscal stress. The first article is a case study of the City
of Santa Ana (McGrath 2013), which focuses on the strategies the city chose in order to
overcome its current budget deficit. Some of the strategies included outsourcing its fire
department, as well as, other city services, negotiating employee compensation
reductions, revenue increases, expenditure controls, and service reductions. The second is
a case study on a large recreational park in Canada that has a majority of its programs and
activities successfully operated by volunteers. Barnes and Sharpe (2009) looked at how
host agencies view and engage with their volunteers. Suggestions are given in order to
strengthen the relationship between the community members who offer their time and
talents and the parks and recreation staff who oversee the parks and recreation facilities.
The authors call for no longer using the term “volunteer” but instead using the term
“friend” (Page 7). An adaptive goal is to develop a more informal and flexible
11

relationship in order for non-staff members to want to support the recreation activities in
their community.
Some research focuses on the protection and upkeep of our parks on both a
federal and local level, finding it imperative to not only preserve our parks, but to also
protect them in a financially, sustainable way. Morgan (1996) addresses the concern for
protecting and managing state parks. Many parks become over developed and thus,
become no longer feasibly sustainable. The author suggests for state parks to be divided
into three different types of categories: natural areas, historical areas, and recreational
areas. By distributing these categories evenly throughout the state, public resources will
be allocated more equitably with a more financially sustainable approach. The author also
advocates for private businesses or entrepreneurs to partake in owning or constructing the
luxury or recreational aspects of state parks. This would cause the state government to act
in a supervisory role rather than an operational role. This article is relevant because it
would be beneficial to research whether any of these ideas for state parks could be
applied to local city parks (Morgan 1996).
Krinsky and Simonet (2011) study the workforce that manages and takes care of
local parks and explore the concept of privatization of parks and how that might affect
the neighboring communities. A poorly maintained park often depresses the real estate
value surrounding the park. Parks that are maintained in good condition add to the local
economic development and benefit nearby landowners (Krinsky & Simonet 2011). This
concept may be beneficial to research further to test whether it is possible to partner with
private businesses in order to maintain local parks in depressed areas and create new
revenue strategies for local parks and recreation departments.
12
Lau (2012) looks at alternative ways of providing recreation services to lower
income and underserved communities. Local recreation departments can partner with
private businesses and non-profits to offer mobile and relatively inexpensive ways for
local residents to stay active and physically healthy. Lau considers the concept of
transitioning parks agencies from being producers of parks to facilitators of recreational
services (Lau 2012). Findings diverge concerning possible benefits of partnering with
private organizations. Lau has concluded that there are many positive benefits to Public
Private Partnerships (PPP); while other researchers (Krawchenko, et al. 2011) are not
fully convinced the benefits will outweigh the costs.
Krawchenko, et al. 2011 argue against the use of Public Private Partnerships
(PPP) under certain circumstances. These circumstances include when the use of a certain
public space is highly controversial, when there involves an unsolicited bid, when the
procurement method is sole-sourced, and when councilors are funded by the private
partner involved in the bid. Local governments need to be aware of public scrutiny and
need to stray away from situations that have the appearance of self-interest and private
gain. The authors do not, however, argue to do away with all Public Private Partnerships.
Not all partnerships are negative, and they can be used as an effective tool for delegating
public services to local businesses (Krawchenko, et al. 2011).
Some researchers have found that PPP provide positive benefits. HeeSoun (2006)
argued that even though it is common to assert the statement that it is financially
beneficial to contract out public services to outside entities, it is difficult to prove the
level of efficiency and cost savings when contracting out a public service. This research
study was able to show that contracting out to nonprofit organizations produces a higher
13
cost savings compared to contracting out to private organizations and other governments.
Secondly, HeeSoun found that manager council government types are more likely to
contract out local services than provide services directly. Finally, when contracting out to
private organizations, the expenditures were higher than when contracting out to other
governments or nonprofit organizations.
Another alternative that is often suggested is instituting user fees or charges. Sun
and Jung (2012) explore the effectiveness of instituting user charges for local public
services. They study parks and recreation services, as well as, sewage services and
demonstrate that a greater reliance on user charges will result in a lower expenditure level
for parks and recreation services (Sun, et al. 2012). This helps to solidify the current
research because it is important to either discover new strategies or confirm already
known strategies for increasing revenue for the parks and recreation department.
Dietl poses an intriguing thought, which can possibly be applied to public
recreation agencies. He focuses on the business economics of sport leagues and clubs and
was able to find that the level of social welfare increased as the club became more win
maximizing. Moving from a non-profit status to the level of profit-maximizing status also
caused the level of social welfare to increase (Dietl 2009). This strategy may be worth
researching in the future in order to possibly increase both the level of revenue and the
level of social welfare in local parks and recreation departments.
Financing Outdoor Recreation touches on several recommendations for financing
parks and recreation departments. A few options include utilizing general obligation and
revenue bonds as a way for state and local governments to afford capital investments, as
well as, instituting entrance, parking, or user fees. Two other ideas presented are federal
14
grants and loans programs. The author recommends that the federal grants should not
exceed more than forty percent of the cost and should be instituted as a matching
program. The author suggests that grants be used for planning, the acquisition of land,
and the development of facilities. Federal loans are suggested for cases where immediate
funds are needed but are not available (Financing Outdoor Recreation 2002).
Samnaliev, et al (2006), focused on the public’s view of alternative funding
sources for parks and recreation departments. It is interesting to note that in 2002, the
author of Financing Outdoor Recreation focused primarily on the use of loans and
grants; however, in the listing of alternative funding options by Samnaliev, et al. in 2006,
grants and loans are not mentioned. The more recent available literature on revenue
strategies seems to suggest that perspectives of local public officials has changed over
time from placing a high reliance on federal loans to no longer wanting to increase their
reliance on federal funding and wanting to shift their attention to the private market and
corporate sponsorships. This shows that revenue strategies for parks and recreation
departments has shifted and developed over time, and there is still much to be discovered
in this area of research.
Samnaliev, More, and Stevens (2006), aimed to describe current public opinion
regarding instituting fees for recreation and possible alternative revenue sources for parks
and recreation services. These alternative sources included donations, sponsorships,
facility closures, and outsourcing to outside organizations. The study surveyed over 800
responses from Idaho and New Hampshire residents. The goal of surveying two different
states was to check for any major differences in thought between east coast and western
15

residents. The study found that western residents appear to be more involved their parks
and recreation departments (Samnaliev, et al. 2006).
Based on the survey responses received by Samnaliev, et al., the researchers
decided it would be most beneficial to institute a mixed policy using several of the
revenue alternatives. Corporate sponsorships were accepted for the use of educational
facilities and visitor centers. The idea of instituting a fee or donation system was
considered acceptable by non-frequent users. However, more frequent users were less
accepting of instituting fees and were marginally accepting of the concept of donations.
The authors found negative aspects of each of these resource alternatives. For example, it
was stated that donations might not bring in enough sustainable revenue, and corporate
sponsorships may create an atmosphere with too much commercialization that involves
the private industry more than originally envisioned. Overall, the research authors believe
that, yes, there are more efficient and sustainable revenue options available, but the
government should move with caution as the public’s opinion still appears very
impressionable (Samnaliev, et al. 2006).
Before one can move forward with new research, it is important to assess how
existing research has been conducted. The following segment will discuss the third
question, what are the apparent methodical strengths and weaknesses of these studies?
This literature review reveals a consistent balance of each of various types of
methodologies. It is comprised of four case studies, two surveys, four statistical analysis
tests, and three descriptive secondary data studies. Each of these methodologies has its
strengths and weaknesses, and each methodology is useful depending on the context of
the research.
16

Case studies are beneficial because they can be in depth and very detailed with
many findings, however, they can also be too specific that the researcher cannot apply the
findings to other situations. For example, the case study on the large recreational park in
Canada provided useful tactics and recommendations, however, one needs to be cautious
of assuming what worked for the Canadian park will be successful for the City of San
Jose Parks and Recreation department. Surveys can hold a large sample size, which can
increase the applicability to other situations, however a weakness of surveys is the
possibility of having data based on respondents’ opinions and personal perspectives and
not on factual data. However, if the researcher is looking for public opinion, this can be a
beneficial method to use. For example, the survey from Carr et al. 2010 gives the reader
the opinions and perspectives of local Michigan residents regarding cutback
management. This survey provides this current research project with data that shows
residents do not always favor cutting public job or reducing public wages. Local
Michigan residents are also in favor of using new and innovative revenue strategies to
maintain the status of current public programs (Carr et al. 2010). This survey succeeded
in providing data that can be used as a foundation for further research in the area of
public revenue strategies.
Statistical analysis tests are often seen as more reliable and valid if based on
numerical data and not on personal opinion. However, these tests can be costly and very
time consuming, and the researcher needs to have the ability to decipher and interpret the
numerical data accurately. It is important to note the difference between correlation and
causation. For example, HeeSoun (2006) found that financial savings occur when
contracting out to non-profits and other governments when compared to private
17
organizations. The data showed that financial savings is correlated with non-profits, but
the data did not prove that using a non-profit caused the increase in financial savings.
One must be cautious of claiming a causation that is merely a correlation of two pieces of
data.
Lastly, descriptive secondary data is sometimes easier to obtain and can cover a
wide range of research findings. One area of caution is to be aware of using irrelevant or
outdated secondary data. For example, the article Financing Outdoor Recreation 2002,
may not hold the most current data, considering that most of revenue strategies
mentioned were bonds, capital investments, or federal loans. The suggestions may be
beneficial, however, they may already be considered common knowledge and not
actually providing any new data to the reader. The article, however, is beneficial to this
research to see where public revenue strategies are currently and what is considered the
status quo for pursuing public funding.
Looking back, one source, which has proved to be particularly beneficial to the
research, is the survey on the public’s attitudes regarding financing public recreation
lands because it involves the acceptability level of the public towards alternative ways to
raise recreation revenues. Another valuable source is the case study on alternative
approaches for meeting the needs of underserved communities. This case study provides
a creative array of revenue and programming strategies that could possibly be added to
the City of San Jose Parks and Recreation department. Lastly, of the statistical analysis
studies, both the study on contracting out recreation services and the study on instituting
user fees provided a strong foundation of revenue strategies on which the City of San
Jose can base its data collection.
18
In summary, the research focused primarily on parks systems, ranging from
discussing how a park’s upkeep and value affect the neighboring communities to
discussing involving community members and volunteers as a means to run and oversee
recreation parks programs. Existing literature also incorporated the possibility of Public
Private Partnerships and contracting out parks and recreation services. Numerous articles
touched on public perception of contracting out local services and how a Public Private
Partnership might affect local recreation participants and the surrounding community. A
few researchers argued that public private partnerships would bring about positive results,
such as, bringing in revenue for large recreational parks and also providing recreational
needs for underserved communities. Other researchers believed that Public Private
Partnerships might not be the most efficient or public trust building avenue to go down. A
few articles mentioned that instituting user charges and fees were more forthright and
open than Public Private Partnerships about where public money was being allocated.
Overall, the available literature supports the need for new and innovative revenue
strategies, while also suggesting that public opinion and cost efficiency need to be the
foundation for discovering new revenue strategies.
Even though the available literature on local recreation departments consists of
valuable resources, there are still areas in need of research. The fourth question asks what
remains to still be discovered about the topic? To be more specific, what remains to still
be discovered about revenue strategies and sustainable financial planning for parks and
recreation departments? Additional research on the use of private donations, grants,
partnerships, naming rights, and sponsorships would be useful. For example, the private
sector, as well as, individual contributions towards recreation equipment, such as exercise
19
and fitness materials, and technological equipment, such as computers for a youth or
senior citizen lab, could possibly be sponsored by an outside organization. This avenue of
financing for recreation services is worth researching.
Some specific areas to research include asking the following questions: Which
cities have attempted and are using any of the formerly mentioned revenue strategies?
For the recreation and parks departments that have implemented these strategies, how
much revenue has been acquired? Have these strategies been beneficial? Was there a
smooth implementation or public acceptance of these revenue strategies? If pursued, the
research to answer these questions could potentially lead local city departments into a
more fiscally responsible and sustainable future.
In conclusion, the fifth and final question asks, what appears to the most effective
methods for developing new information on this topic? Both surveys and secondary data
have proved to be the most beneficial research methods thus far. The surveys developed a
strong working knowledge on how the public views parks and recreation services, as well
as, current or proposed financial strategies. This has provided a strong foundation on
what research has already found and where it now needs to continue. Secondary data has
shown what studies have already been conducted, thereby, allowing this research to not
merely become a repetition of past studies. Therefore, some possible sources of data that
can further this specific area of research include Parks and Recreation administrative staff
surveys, parks and recreation departmental budget documents, annual reports, and local
policies highlighting ten year or twenty year plans for specific parks and recreation
departments. This research paper hopes to add to the exiting literature by surveying the
revenue strategies that western cities are currently implementing. The ultimate goal of
20

this paper is to provide more insight into how local cities can ensure their parks and
recreation departments are cost recovery and financially sustainable.
Methodology
The two main methods for collecting data for this study were surveys and
secondary data. For this project, the following two research questions have been analyzed
in greater detail: 1) What revenue strategies are being adopted in large cities across the
western United States to enable Parks and Recreation Departments to be financially
sustainable and less dependent on their municipal general fund? 2) Which of these
strategies would be the most feasible and beneficial for the City of San Jose to
implement?
The first question focused on revenue strategies that are currently being
implemented across the western United States. It first involved defining what cities
needed be surveyed and second what specific revenue strategies needed to be researched.
The western cities surveyed included large cities from California, Oregon, Washington,
Arizona, and Nevada, such as, San Diego, San Jose, San Francisco, Fresno, Sacramento,
Portland, Seattle, Phoenix, Tucson, and Las Vegas. These cities were chosen because
they had a high population rate, ranging from just under 500,000 to over a million
residents. Although it has a high population rate, Los Angeles was not selected. With
over three million residents, selecting Los Angeles would have created an outlier with a
much larger population and size than the other cities in the study. Therefore, the cities of
San Diego, San Jose, San Francisco, Fresno, and Sacramento were selected because they
had the next top five highest population rates in California. Portland, Oregon; Seattle,
Washington; Phoenix, Arizona; Tucson, Arizona; and Las Vegas, Nevada; were selected
21
because they are the only cities in their respective states that had a population rate above
500,000.
In order to survey these cities, phone and email surveys with key administration
staff from each of these large cities were administered to receive a listing of the strategies
currently being implemented in each of their respective cities. The first step involved
researching the names and contact information of the directors, assistant directors,
division managers, superintendents, analysts, fund development staff, and supervisors
from each city’s parks and recreation department websites. The next step consisted of
contacting, via phone and email, each of the previously mentioned positions to ask if they
would be interested in completing the survey. The goal was to survey a variety of the
formerly mentioned parks and recreation personnel in order to receive sufficient
information about each city’s policies. This could have taken as little as one survey per
city or as much as five surveys per city. The anticipated end result was to acquire enough
data to create a strong response from each city for each survey question.
The survey focused on the revenue strategies of grants, corporate sponsorships,
naming rights, donations, and contracting out to private or non-profit organizations. The
survey also addressed discovering new revenue strategies that were not formerly
mentioned. The specific survey questions are listed near the end of this methodology
section. The goal was to survey the strategies currently being implemented and of these
strategies, decide which would be feasible and beneficial for the City of San Jose Parks
and Recreation Department to employ. The concept of feasibility was analyzed in terms
of simplest and smoothest implementation processes, and the concept of beneficial was
analyzed in terms of highest level of financial savings or gain for the department.
22
During the data collection period, seven of the ten selected cities were able to
return a full, completed survey. Therefore after entering the collected survey data, in
order to hopefully locate more data, annual reports were reviewed to learn which revenue
strategies are currently being implemented. This review process involved searching each
city’s parks and recreation website for its annual reports and fiscal year budget
documents. For example, the City of San Jose Parks and Recreation Department, has
uploaded its annual reports from the past several years for the public to read. In these
annual reports, it has been clearly stated what new strategies the department is using and
which of the strategies have been successful. Ideally each of the proposed cities would
have had the same annual report information readily available on its website. However,
not all of the departments had this information readily available on its department’s
website or online archives. The review process found that several cities did not compose
a department annual report, but rather the department revenue information was included
in the city wide annual budget.
In retrospect, it would have been beneficial to have found an annual report for
each of the respective cities to determine whether any current revenue strategies led to
recognized successes or lessons to learn from. One would have been able to gain a
working knowledge of this based on the outcome of the annual reports. Annual reports
are often written as a success story of the past year’s endeavors, and they may have also
included lessons learned from the previous year’s decisions. Having a report from each of
the cities would have been useful for this study because they would have been written
with parks and recreation employees and customers in mind. They are often written with
23
the intention of being clear and concise outlining the growth and major decisions that
have taken place over the previous year.
The second research question involved an analysis of phone and email surveys to
explore which strategies were considered most feasible and beneficial to implement.
Phone and email surveys were chosen in order to bring qualitative insights to the
analysis. The second component of the research question focused on the professional
perspectives of key parks and recreation personnel in order to learn from them. The
survey questions were successful because they solicited the advice and feedback of
administrative staff. The questions asked which strategies were beneficial and how to
implement these successful revenue strategies. The survey helped identify which
strategies were not successful and why specific strategies were not implemented.
The respondents had the flexibility of being conducted through phone or email,
depending on the preference of the respondent. It was originally presumed that the survey
would take around twenty to thirty minutes to complete, however each survey took about
one hour to complete. The survey sample size was contacted in late December and early
January and asked if they are interested in participating in this project. Surveys were
conducted for roughly two months, from the beginning of January through the end of
February. In the findings section, the collected data will be displayed in tables. There is
one table per survey question to display the varying responses amongst the seven cities
that completed a survey. Fortunately, the data collection process also received enough
information to create a table for each of the revenue strategies, showing the strengths and
weaknesses that each of the respective cities associates with each of the different revenue
strategies.
24
One anticipated outcome was to confirm whether large western cities are using
the following types of revenue strategies: grants, corporate sponsorships, naming rights,
donations, and contracting out to private or non-profit organizations. Another anticipated
outcome was to discover a revenue strategy that was not formerly mentioned. Lastly, an
anticipated outcome was to hear why specific strategies have been or have not been
implemented in each of the respective cities. The following section lists out the survey
questions asked of key Parks and Recreation employees and executive staff. The first five
questions of the provided survey focused on the first research question, “What revenue
strategies are being adopted in large cities across the western United States to enable
Parks and Recreation Departments to be financially sustainable and less dependent on
their municipal general fund?” Questions six through thirteen of the provided survey
focused on the second research question, “Which of these strategies would be the most
feasible and beneficial for the City of San Jose to implement?”
Parks and Recreation Services Revenue Strategies Survey 1. What percentage of your Parks and Recreation budget comes from the
municipal general fund?
2. Is your Parks and Recreation department working towards becoming less
dependent on your city’s general fund?
3. If no, what is the reason for not pursuing a higher cost recovery level for the
parks and recreation department?
4. If yes, what is the fiscal goal your department is aiming towards in order to
become less dependent on the general fund?
25
5. What financial strategies are currently being used to become more financially
cost recovery and less dependent on the general fund?
6. Of the financial strategies currently being used, which had the most successful
implementation process?
7. Of the financial strategies attempted over the past decade, what strategies
proved to be unsuccessful?
8. Which revenue strategies were met with least amount of resistance?
9. Which revenue strategies were met with a high level of resistance?
10. Out of the financial strategies used, which strategies provided the most benefit
for the department?
11. If not already mentioned, has your department pursued any of the following
revenue strategies: grants, corporate sponsorships, naming rights, donations, and
contracting out to private or non-profit organizations?
12. What advice or feedback would you offer other parks and recreation
departments in order for their department to succeed in implementing cost recovery
revenue strategies?
13. What do you see as the strengths and weaknesses of each of these five
strategies?
The overall goal of this project has been to combine quantitative data with
professional knowledge and opinion to develop a stronger working knowledge of the
revenue strategies currently being implemented in Parks and Recreation departments
across the western United States. Another component was to discover what has and has
26
not worked for other cities. The City of San Jose Parks and Recreation department is
currently pursuing increasing its cost recovery level; therefore, the purpose behind this
methodology was to identify whether other large cities are also pursuing higher cost
recovery levels, and at what percentage other cities are aiming for their budgets to be less
dependent on the general fund. Parks and Recreation departments may vary in the
wording of their specific missions and goals, however, all Parks and Recreation
departments share a need to be financial sustainable in order to continue to provide the
services the members of their communities know and love.
Findings
While collecting the survey data, several cities were very eager to answer the
questions. This was an encouragement that the research topic was indeed relevant and
necessary. Some cities were very quick to respond with a completed survey, while other
cities took a lot longer to respond. A word of advice to those who wish to survey local
government departments or state agencies: plan accordingly and do not request survey
information in the height of budget season. In retrospect, the first initial survey inquiries
could have been sent out a month before they were, due to the high work demands of
budget season. It was also quickly realized that the amount of time to conduct the survey
was longer than anticipated. It was originally thought that a phone survey would last
thirty minutes. Some of the phone surveys conducted lasted over an hour. This was due to
the wealth of information that the department staff was willing and able to offer. This
again was encouraging to see that this research topic carried with itself a high level of
interest, as well as, the possible benefit it could bring to local parks and recreation
departments. Some people who were surveyed requested that their answers remain
27

anonymous; therefore, the data tables listed in Appendix A at the end of this paper have
had the city name removed. Instead there is a random number associated with each of the
answers. A few areas for the survey responses were left blank. This is due to not
receiving a completed survey from a city. If the city did not give a complete answer, an
attempt was made to research the answer on the city’s website. If the website was still
unable to provide the answer, it was left blank. This was to ensure that the paper did not
include information that was not fully accurate or truly reflective of each of the parks and
recreation departments.
At the end of this paper, one will first read in Appendix A that each of the thirteen
survey questions has its own table representing the data collected from the each of the
respective cities. Secondly, in Appendix B, there are several tables listing out the
strengths and weaknesses that the selected cities associated with each of the revenue
strategies. In Appendix C, there are tables listing out specific revenue strategies that the
various cities have employed, such as, contracting out services, corporate sponsorships,
grants, and naming rights. Three things should be noted for Appendix C. First, none of
the cities shared any specific examples of a donation, therefore, there is no donation table
listed. Second, even though examples of partnerships were not asked for specifically on
the survey, some cities offered examples of partnerships that have been beneficial for
their parks and recreation department, therefore, there is a table listing partnership
examples. Third, this area does list out the city name because the information regarding
each specific city is already public knowledge, whether through the city’s website or a
news article.
28
The following several paragraphs will describe what the various responding cities
answered for each of the thirteen questions. Following that, this findings section will
finish with a narrative summary of the first research question, “What revenue strategies
are being adopted in large cities across the western United States to enable Parks and
Recreation Departments to be financially sustainable and less dependent on their
municipal general fund?” After the findings section, this paper will close with an
application and conclusion section which will focus on answering the second research
question “Which of these strategies would be the most feasible and beneficial for the City
of San Jose to implement?”
Starting with survey question one, “What percentage of your Parks and
Recreation budget comes from the municipal general fund?” the responses varied from as
low as ten percent to as high as one-hundred percent. The average percentage of the
selected cities was sixty-one percent. The data showed that one of the cities had brought
down its dependence on the general fund to a very low point of ten percent, while another
city had not decreased its general fund dependence and still receives its whole budget
from the general fund. The data also shows that on average, there is a trend for western
parks and recreation departments to receive about two-thirds of the department budget
from the general fund.
Question two, “Is your Parks and Recreation department working towards
becoming less dependent on your city’s general fund?” focused on answering whether or
not western cities are pursuing less dependence on their city’s general fund. Only one city
replied no. Three cities responded with both a yes and no answer (reasons for having both
a yes and no answer are provided in questions two and three). Three cities replied with a
29
definite yes answer. The data showed that a vast majority of the selected western cities
are working towards becoming less dependent on their city’s general fund.
Question three, “What is the reason for not pursuing a higher cost recovery level
for the parks and recreation department?” provided some explanations for why a
department may not have the ability to become less dependent on the general fund or why
it is beneficial to retain dependence on the general fund. For example, one city stated that
there is a benefit to still having reliance on the general fund, because in difficult fiscal
times, the general fund spreads its capital funding evenly. Another reason provided by a
few cities argued that still relying on the general fund helped the department to provide
services to all residents through the use of subsidy programs. The departments went on to
share that increased revenue is certainly a goal each year, but the fees and charges
schedule and the level of cost recovery are established by Mayor and Council. It has been
determined that basic services generate a lower level of cost recovery. In some cities, the
Mayor and Council have determined that these basic services should be affordable to the
general public. Lastly, one city stated that it is essential to pursue revenue strategies,
however the department must be aware of public perception. The department needs to
balance reducing costs while still maintaining quality services, and the department also
needs to balance the ability to increase revenue with maintaining the public’s trust and
commitment to its services.
Question four, “What is the fiscal goal your department is aiming towards in
order to become less dependent on the general fund?” resulted in a wide range of
answers. One city had yet to set any fiscal goals while another city had already achieved
the goal it had set a few years ago. One city stated that it was difficult to know a specific
30
cost recovery percentage rate to aim for, but the city was currently doing a cost of service
assessment. The survey respondent was hopeful that after the assessment, the fiscal goal
in terms of a cost recovery rate might become clearer to the department.
Some goals were general in nature while others were specific in providing a
numerical percentage for their cost recovery goal. For example, one city stated that it did
not have a specific fiscal target to aim for, however, the department was aiming towards
the following concepts: Enhancing and broadening the budget, increasing revenue
sources, and enhancing the current level of services. Another example of a general fiscal
goal involved a goal for commercialized, individualized services as well as Enterprise
Fund services. Finally, one city mentioned that the driving goal for becoming less
dependent on the general fund was the annual budget and the reduction target mandated
by the Mayor.
Some cities provided specific fiscal goals that included a cost recovery level it
was aiming towards. One city had set the goal to become at least 40% cost recovery and
decreasing its reliance on the city’s general fund. This department stated that it was 22%
cost recovery in fiscal year 2008-2009, and it recently achieved the goal of 40% cost
recovery level in fiscal year 2013-2014. Another city shared that it had set a goal to reach
a 35% cost recovery level by June 2015 and a 50% cost recovery level by June 2017.
Whether the goal is general or specific, the answers reveal that most cities have already
begun to incorporate or implement strategic fiscal goals in order to become less
dependent on their city’s general fund.
Question five, “What financial strategies are currently being used to become
more financially cost recovery and less dependent on the general fund?” provided
31
several examples of strategies that western parks and recreation departments are currently
implementing. Some financial strategies involved raising fees, cutting expenditures,
contracting out services, grant writing, utilizing partnerships and corporate sponsorships,
developing a customer relations management database, completing a cost of service
assessment, creating a brand for the department, and utilizing existing inventory. One city
also mentioned that the strategic use of leases and concessions from bike, canoe, and
kayak rentals had helped to increase revenue.
Another city developed a computer system to maximize the use of public lands
for rental agreements while also protecting and ensuring the land would not be negatively
impacted. This computer system helped the department to increase its revenue through
maximizing the use of their public lands. For example, sports reservations and concert
series rent out the public spaces. The department developed this system with the two-fold
strategy of increasing revenue for the department, while also maintaining the
commitment to being good stewards of the land they oversee. A third benefit to this
strategy was having the ability to develop outside partnerships in order to provide
services and world-class events to the public.
Lastly, a few cities mentioned that their parks and recreation department follows
an approved Revenue and Pricing Policy to achieve specific levels of cost recovery based
on the type of services the department provides. The Pricing and Revenue Policy for one
city was described as a mechanism for allocating the use of public funds, creating a
financially sustainable approach for recreational services and facilities, maximizing the
use of programs and facilities, and ensuring affordable access to programs and services.
Even though an approved Pricing and Revenue Policy was not listed as a specific strategy
32
to achieve a higher level of cost recovery, the cities, which have created one, stated that it
acts as a powerful tool for the department to ensure it reaches its cost recovery goals.
Question six, “Of the financial strategies currently being used, which had the
most successful implementation process?” focused on discovering which strategies the
selected cities viewed as successful. Several examples mentioned incorporating new fees
or increasing current fees. One of the successful fee increases was the cost for renting a
boat spot. The price had not been raised in years, and there was little resistance in raising
the fee. Another strategy included increasing fees in the top five revenue-producing
programs in the department, for this specific department, the lighting and registration for
sports fields were listed as the successful examples. The notion of increasing rental space
fees was commonly supported amongst the selected cities. Several cities shared that one
of the ways the department was going to close the anticipated yearly savings target was to
increase athletic field and facility space fee charges. One of the reasons behind this
notion was that, even with fee increases, the price for a wedding venue, sports field,
birthday party, or business meeting would still be cheaper than the private market option.
A second successful financial strategy included contracting with outside
organizations to sell food at public spaces or parks because the parks and recreation
department was able to receive a small percentage of the revenue brought in. This avenue
also included utilizing public spaces for public concert series in various parks. Another
example involved partnering with outside organizations, such as, the YMCA or other
non-profits, to reopen and operate sites that originally had to be closed due to budget
cuts. These partnerships helped the department to still provide needed services to the
public, that the department was not currently doing. One city shared that engaging with
33
the community and ensuring affordable access for community members was a strategy
that was successfully implemented. Lastly, one strategy, which was highly successful,
was the commitment to determining cost recovery goals, creating specific revenue
strategies for the department, and regularly revising the fees and charges pricing strategy
while incorporating flexibility to change based on trends in the market.
Question seven, “Of the financial strategies attempted over the past decade, what
strategies proved to be unsuccessful?” asked the selected cities to share what they had
discovered to be unsuccessful. The most commonly used answer was fee increases. Fee
increases were described as the most challenging and were often developed to into a two-
step fee increase process to mitigate the challenge. Other cities also mentioned that
instituting fees had been difficult when assessing economic needs of the surrounding
community. These cities advised that the department needed to remember to look at each
fee individually when proposing fee increases.
One city gave the specific example of how increasing fees for public attractions
had been highly unsuccessful. Their department operates public gardens that people can
visit. Even with attempting a two-tier fee increase, the public was not pleased. The public
shared that they felt the department had begun to “privatize” the garden and asked to
keep the admission prices lower. Ultimately, the department did not increase admission
fees. One city shared that calculating the cost of service had proven to be a challenging
task for them due to the City’s fiscal structure and tracking and the complexity of the
programs. For example, they mentioned that attempting a cost recovery model was not
successful for their Senior Nutrition Program. Lastly, one city stated that planning
ongoing programs with funds from a few select large donors was unsuccessful because
34

the department now had additional expenditures without any new consistent revenue to
cover those expenditures.
Question eight, “Which revenue strategies were met with the least amount of
resistance?” attempted to discover which strategies had little resistance during its
implementation. Ironically, fee increases was listed for a majority of the responses. One
city explained that raising program revenues showed little resistance because, even after
an increase in price, public classes and venues are cheaper than private options. For
example, the department could raise the price for swimming or dance lessons, fitness and
gym memberships, facility reservations for parties or wedding venues, and field
reservations for sports leagues and still be competitive with the private market price.
Another city stated that instituting a fee structure could be smooth with low resistance
depending on the specific user group affected. For example, this same city agreed that
instituting fees based on the use of the facility were received with a low amount of
resistance.
One city mentioned that the fees and charges that had been adopted by the City
Manager’s Office to the Budget office to create adopted fees for their department had a
low amount of resistance. Instituting or increasing fees had resistance only because it was
a new way of doing business and a new mind set, however, the cost recovery goal effort
was a department wide effort and a large scale in implementation, thus helping to
decrease the resistance level. One department stated that corporate sponsorships for gyms
and special events had shown little resistance and a high level of potential for their staff
to pursue. One city shared that it was very difficult to answer this question because most
of the strategies they had pursued were met with a high level of resistance. Lastly, one
35
city said the mode of least resistance for their department was offsetting the General Fund
by rightsizing different lines of business, such as aquatics and the natural resources unit.
This strategy was welcomed because it did not result in service level cuts. Adjustments
were based on an historical analysis of revenues, and expenses were easily accepted.
Question nine, “Which revenue strategies were met with a high level of
resistance?” focused on sharing lessons that the various departments had learned from
strategies that were met with a lot of resistance. One city shared that contracting with a
private company to sell commodities or food on public property had a lot of public
resistance. Even when the department attempted to contract with small, local businesses,
the public saw the effects as negative. The department also tried contracting with cell
phone companies because the use of the land would be only in cell towers and the
physical representation of the contract would be discrete, but this strategy received a lot
of resistance as well. They realized that a lot of resistance seemed to arise whenever the
department would attempt to contract out for the commercial use of public lands.
Even though increasing fees was previously listed under the category of least
resistance for most cities, some cities listed fee increases under this question, stating that
implementing an increase in field use fees was very difficult, causing the city to create a
tiered approach to raising fees over the course of two years. Another department
explained that increasing fees and levels of cost recovery for basic services to the larger
general public was met with public frustration and pushback. For example, a third city
shared that instituting cost recovery for their Senior Nutrition Program was a very
difficult challenge.
36
Another area that was met with a high level of resistance was gaining support for
sponsorship and partnership revenues. In one particular city, the Mayor and Council
supported the idea, but difficulties arose when trying to agree on which specific
sponsorships would be allowed, such as, deciding which entities would be accepted for a
park or facility naming right. One department listed grants as a strategy to refrain from
using because they are not always assured. This city went on to explain that grants can
receive a lot of resistance internally from department staff because they are beneficial for
one time projects but not for ongoing programs, and financial staff must be aware of this
common pitfall of grants.
Question ten, “Out of the financial strategies used, which strategies provided the
most benefit for the department?” provided several examples of strategies the selected
cities considered to be beneficial. Most of the examples provided were different from
each other, meaning there was not much repetition or overlap in the answers. The
following sentences show the variety of answers that were given. One city stated that
using public lands for big events, that draw large crowds and provide a high public
benefit strengthened the department’s relationship with the public. Another city said that
maximizing the use of the land for facility or field reservations brought in a high level of
revenue for the department. The increase of reservation fees and lighting fees for sports
fields was mentioned as one of the most beneficial decisions one department had made in
the past several years. One department answered that rightsizing its different lines of
business had been the most beneficial strategy implemented.
Planning ahead, one city explained the need to ensure the implementation of a
long-term funding strategy for the growth and replacement of assets. This city also shared
37
two highly beneficial strategies. First, the use of government bonds which the city can
renew every ten years, and second, the institution of a System Development Charge Fee
in order to have reserve funding for a growth in population. Another beneficial strategy
mentioned by a different city was fund transfers, stating that it is imperative to remember
that all of the departments are apart of the same city and allowing extra funding to go to
other departments benefits the city as a whole. Lastly, one city revealed that integrating a
philosophy of a cost recovery model throughout the whole department, while also having
the staff to incorporate the model provided a high level of benefit to the department.
Question eleven, “If not already mentioned, has your department pursued any of
the following revenue strategies: grants, corporate sponsorships, naming rights,
donations, and contracting out to private or non-profit organizations?” gave a picture of
how many cities were utilizing the previously listed revenue strategies. The data reported
that the top two most commonly used strategies were grants and contracting out. Both of
these strategies were currently being employed by six different western cities. Donations
and corporate sponsorships were next in line for the most utilized strategy. Both
donations and corporate sponsorships were listed by five different cities. Naming rights
was the least pursued strategy with only four cities stating they had ever used the naming
rights strategy. The answers to this question also revealed that two different cities have
pursued the use of all five strategies for their parks and recreation department.
Question twelve, “What advice or feedback would you offer other parks and
recreation departments in order for their department to succeed in implementing cost
recovery revenue strategies?” provided several suggestions and pieces of advice that the
various parks and recreation departments had gained from past experiences. The first set
38
of examples of advice involved working successfully with others: remember to determine
your stakeholders before making any revenue changes, look at the needs of the
surrounding community and the market at large when making revenue changes, get the
support of any appointed advisory committees, as well as, the elected body. Remember
that the general public has to be part of the discussion, and they must be assured that
services will be improved.
Other points of advice revolved around attempting to implement a new revenue
strategy. Remember to identify clear and realistic outcomes. Establish short term and
long-term goals for the project. Ensure that there are adequate resources to accomplish
your goals. Get buy in from executive managers, staff, and customers. Know the required
rules and procedures to implement the proposed changes, and remember that transitions
and changes take time.
A few cities provided advice surrounding the implementation of new fees or the
increase of current fees. The cities explained that the department should have in place a
system of collecting data that can accurately reflect the true costs of running and
maintaining programs within the department. For example, fees might have remained the
same to benefit public users, but operating costs could have increased. Without a pricing
justification and effective data, the department could easily be placed in a defensive
position when it comes to changing prices due to increased operational costs. In order to
further strengthen the rationale behind fee increases, have clearly defined cost recovery
goals that have been reviewed and approved by both the executive and legislative sides.
The process for defending fee increases will be less resistant if those fee increases result
in meeting stated cost recovery goals.
39
The last words of advice were focused on the long term planning of parks and
recreation departments. Some departments shared that strategic staff placement can have
a lasting impact on the services the department is able to provide to the public. For
example, each department needs highly trained staff; who are successful in community
engagement, as well as, staff who are successful in grant writing. One city advised other
parks and recreation departments to utilize public lands for field or facility reservations,
as well as, possible restaurants. They instructed that having privately owned public
spaces improves the quality of the land while also providing the department with outside
resources with whom it can collaborate. They also encouraged other cities to remember
that the parks and recreation department is a steward of the public land and must prepare
accordingly to protect the land and also repair aging infrastructures for the community.
Finally, for one city, successful planning for the future of their parks and recreation
department meant utilizing ten year bond issuances as a debt financing strategy, rolling
over twenty year bond issuances to maintain current assets, retaining a strong balance of
general fund subsidy with externally generated resources so the department does not
exclude lower income populations from its services, and keeping its external resources
diverse so their department was not overly dependent on a single corporate sponsorship
or one continued grant to run your program.
The final question of the survey, number thirteen, “What do you see as the
strengths and weaknesses of each of these five strategies?” resulted in several examples
of the strengths and weaknesses of each of the five revenue strategies. The complete list
of the positive and negative attributes of each strategy can be found in Appendix B at the
end of the paper. For example, two weaknesses listed for grants were that grants are often
40
only available for one time projects but not for operating funds, and grants require a lot of
staff time to apply for. However, two positive attributes are that grants can be utilized to
maintain trails and creeks and having a successful grant writer can bring in large financial
gains. The two points for the weaknesses of corporate sponsorships explained that
numerous rules often regulate the specifics of a sponsorship agreement and what the
department needs may not be what the corporation intends to do with the finances (For
example: New sports jerseys versus irrigation or lighting). The two examples listed for
the strengths of corporate sponsorships stated there are a large variety of corporate
organizations to choose from and work with, and if successful, this revenue strategy
provides the department with the ability to work with an organization who has rich
financial resources and who supports the recreation programs or parks.
The two weaknesses of naming rights are having a name associated with the
department that does not align with the department health/wellness mission or vision and
it can be politically contentious. The data listed the following two strengths for naming
rights: the ability to lease park spaces and the roofs of maintenance buildings to cell
phone carriers. This can be a good partnership that does not come with too many
obligations, and they also allowed for some sufficient financial amounts and
opportunities for one-time projects. Two reasons for why a donation is a weak revenue
strategy explained that donations can sometimes cause inequities (For example, the areas
of town that receive enough donations are often the more affluent neighborhoods, leaving
the underserved areas without) and that donations are not a reliable source of revenue for
ongoing programs. It was stated, however, that donations have these two strengths:
donations are beneficial for unique, noncore programs that when containing many
41
donation sources, can offset the direct costs of that unique program and donations allow
for some sufficient financial amounts and opportunities for one-time projects.
Lastly, the collected data listed the following two reasons for weaknesses of
contracting out its services: resources need to be available to develop and maintain the
relationships with the service provides to ensure service delivery and the public may view
contracting out as privatizing public resources or lands. Contracting out recreational
services showed these two strengths: contracting out to an expert of the field who can
operate the service more efficiently (example: a golf course) and contracting out to non-
profit organizations, who can provide a higher cost savings and a stronger community
impact by utilizing volunteers. Overall, each city provided a rationale behind why their
department had either successfully implemented the proposed strategy or why the
department had chosen to not pursue the strategy.
In conclusion of this findings section, the following paragraphs will include a
narrative on the first research question: What revenue strategies are being adopted in
large cities across the western United States to enable Parks and Recreation
Departments to be financially sustainable and less dependent on their municipal general
fund?” To begin, the data shows that on average, there is a trend for western parks and
recreation departments to receive about two-thirds of the department budget from the
general fund. The data also shows that a vast majority of the selected western cities are
working towards becoming less dependent on their city’s general fund. Only a few cities
provided reasons for not pursuing less reliance on the general fund (The specific reasons
are formerly listed under question three. Whether the goal is general or specific, the data
42
answers reveal that most cities have already begun to incorporate or implement strategic
fiscal goals in order to become less dependent on their city’s general fund.
The data also shows that all of the cities employ at least one of the suggested
revenue strategies: grants, corporate sponsorships, naming rights, donations, and
contracting out to private or non-profit organizations. Some cities are actively pursuing
all five of the strategies while other cities have only relied on one or two of the strategies.
The data reported that the top two most commonly used strategies were grants and
contracting out. Both of these strategies were currently being employed by six different
western cities. Donations and corporate sponsorships were next in line for the most
utilized strategy. Both donations and corporate sponsorships were listed by five different
cities. Naming rights was the least pursued strategy with only four cities stating they had
ever used the naming rights strategy. The fact that all of the cities are openly pursuing
one or more of the strategies shows that western parks and recreation departments are
adopting revenue strategies in order for their services to become more financially
sustainable.
As a final restatement summary, some specific financial strategies involved
raising fees, cutting expenditures, contracting out services, grant writing, utilizing
partnerships and corporate sponsorships, developing a customer relations management
database, completing a cost of service assessment, creating a brand for the department,
and utilizing existing inventory. Other beneficial strategies have included the use of
leases and concessions from bike, canoe, and kayak rentals, as well as, adding costs to
rent a boat space from the parks and recreation department harbor. All of these have
helped to increase revenue for various departments. Another strategy involved creating a
43
computer system to maximize the use of public lands for rental agreements while also
protecting and ensuring the land would not be negatively impacted. Several cities shared
that they utilized facility rentals for their public buildings and parks. This included
venues for weddings, graduations, and sports field reservations. It was also stated that
strategic staff placement provided the department with high revenue gains through
successful grants applications and corporate sponsorships. Lastly, a successful financial
strategy included contracting with outside organizations to sell food or provide
community events at public spaces and parks because the parks and recreation
department was able to receive a small percentage of the revenue brought in.
Overall, the data appears to show that western cities, based on the individual
needs and demands of their specific communities, are instituting the revenue strategies,
which are most acceptable by the public. Even if a certain strategy may result in large
financial gains for the department, several cities have stated that they will not pursue the
plausible strategy if the public has had a negative reaction to it. This leads the researcher
to once again realize the high value that public perception weighs on the outcome of a
successful revenue strategy. As this paper transitions into the final section of applying the
second research question, “Which of these strategies would be the most feasible and
beneficial for the City of San Jose to implement?” it is important to remember the
importance that public demand plays in the role of selecting and pursuing revenue
strategies. As public servants and stewards of public lands, the executive leadership of
parks and recreation departments must regularly take into account the needs and opinions
of community members. Successful revenue strategies involve continuing well-loved
programs while also being a strategy that the public openly supports.
44
Analysis and Conclusion
This section will utilize the data to explain interpretations of the findings, as well
as, share possible recommendations for the City of San Jose to take. More specifically,
this section will focus on answering the second research question, “Which of these
strategies would be the most feasible and beneficial for the City of San Jose to
implement?” To end, this paper will suggest ways this area of research can expand in the
future.
To begin, the data collection of this research paper provided several key points for
parks and recreation departments to apply to their own individual cities. The following
paragraphs will share some key interpretations of the findings to help departments
succeed in increasing their cost recovery rate. First, remember to include the opinion of
the public when proposing new revenue strategies. Invest the extra time needed to
conduct community meetings, surveys, and newsletters to gain the insight and opinion of
the community. Pursuing community buy in will always be a benefit to any cause. If the
parks and recreation department hopes to continue to offer quality programming that the
community will support, the parks and recreation department needs to invest the time and
energy into learning what the community wants.
Second, remember that the parks and recreation department has been elected as a
steward of public lands. When pursuing possible revenue strategies, it is imperative that
the parks and recreation leadership staff demonstrate decisions that protect the
environment and position the department to remain as good stewards of the land. This
mindset will help the department pursue environmentally sustainable revenue approaches
while also retaining the trust of the public at the same time. In addition, it is important to
45
remember that a vast majority of community members care about preserving public lands
and not privatizing the lands. If the department is proposing a revenue strategy that
involves collaborating with a private organization, it is essential to be as transparent as
possible and openly share with the public the costs and benefits associated with pursuing
the collaborative partnership.
Third, when reassessing fee rates and charges, know the current market rate for
the programs and classes being offered. Keeping the city prices lower than the market
rate will help parks and recreation departments remain competitive. Remember the value
that donations and scholarships bring towards ensuring affordable access for all residents.
Maintain a certain level of flexibility when instituting fee rates and charges. The first
several attempts may not put the department at a competitive advantage. Be willing to
adapt and change the fee rates in a manner that will allow more residents to enjoy
services. Flexibility and strong customer service will ultimately result in a larger
customer base for the department in the long run.
The final key applicable point is to intentionally project ahead. Only use one-time
funding for one-time projects. Do not use the addition of new finances to create ongoing
programs. Use one-time additional resources to maintain and update assets, purchase
supplies, or finish a project that clearly has a completion date. Remember that guaranteed
ongoing funding through grants and donations is rare; therefore, plan according when
making projections or promises to the public. Lastly, prepare a comprehensive plan to
provide sustainable long-term funding for capital assets and infrastructures. Programs and
classes are valuable; however, unless the department plans accordingly, there will not be
any sustainable infrastructures to house the classes and programs that benefit the public.
46
Of the data collected, in terms of simplest and smoothest implementation
processes, it is suggested that the two most feasible strategies to implement are 1) public
sponsorships of community events and 2) adjusting fees and charges to be competitive
with market rates. A majority of the responding cities perceived these two strategies as
successful in their implementation processes. The first strategy of incorporating public
sponsorships of community events has been successful due to the large crowds it can
bring to the city, as well as, the high level of community benefit the various events bring
to the public. Some examples worth pursuing are large concert series and other
corporately sponsored events. Ideally, this strategy would help the public see the
community benefit in partnering with a private organization, and that not all public
private partnerships result in privatizing public lands. The second strategy selected as the
most feasible for implementation is the increase of prices in order to compete with the
market rate. Western parks and recreation departments are fortunate enough to work
around some of the most beautiful landscapes in the county. Departments can utilize this
opportunity to provide relatively inexpensive wedding and birthday venues for the public,
while earning some consistent revenue for the department. In addition, several western
cities stated that both facility rentals and fee adjustments have helped their department
improve its level of financial sustainability.
Using the definition of highest level of financial savings or gain for the
department, the second category of most beneficial strategy for departments to implement
involved the following four strategies: 1) the strategic placement of staff in grant writing
and collaborative partnership positions, 2) the utilization of naming rights and corporate
sponsorships, 3) the development of a computer system to determine the maximum
47
utilization of public lands while still protecting the land and maintaining high quality
lands, and 4) the increased use of privately owned public spaces. Under the first strategy
of strategic staff placement, one city recorded that with the right staff pursuing grants,
their department had been able to generate millions of dollars in grant revenue on a
regular basis. This city also went on to state that if a department is willing to make the
investment to hire a professional grant writer, the monetary results will far outweigh the
salary paid to the professional grant writer. The second strategy of naming rights and
corporate sponsorships was seen as financially beneficial by the cities that utilize them.
However, it must be noted that even though the financial gains may be high, each city
must weigh the perception of the public with the benefit that could be received through
the corporate sponsorship or naming right. In the long run, public perception will
outweigh any possible benefit; therefore, the department should plan according and
involve community input from strategy conception to conclusion.
The third most beneficial strategy listed is to develop a computer system, which
can accurately reflect what the maximum utilization of public lands could be without
negatively affecting the quality of the lands. For example, one city mentioned that it uses
this system to determine how often the sports fields can be rented out and how often
public land venues can be reserved for events, while still maintaining enough time for the
land to rest from use and be watered for an appropriate amount. This system looks at the
long-term sustainability of the lands. The city even mentioned that it has denied
reservation permits if the land use had already been maximized. This approach also
supports the concept of pursuing public buy in by remembering that the parks and
recreation department must maintain the ability to be good stewards of the land entrusted
48
to them. This leads to the fourth and final strategy of utilizing privately owned public
spaces. This strategy focuses on allowing private individuals or organizations to buy the
land from the city, if the land will be maintained as a public space. Since the private
individual or organization will own the land, it will hopefully be maintained at a high
level of quality because the owner is a financial stakeholder in the land. The ultimate goal
of this fourth strategy is two-fold: to increase the quality of public spaces and to improve
the strength of the city’s collaborative relationships.
The final paragraphs of this paper will share a few possible recommendations for
the City of San Jose to take as well as future research ideas that would complement the
research of this paper. The first recommendation for the City of San Jose Parks,
Recreation, and Neighborhood Services Department is to conduct annual or semi-annual
collaborative meetings with other western cities. The goal of this action step is to build
and strengthen professional relationships between the executive staff of large western
cities in order to share revenue ideas, successes, and lessons learned amongst the varying
cities. Joining together with the same goal in sight will hopefully assist each of the
departments in reaching its targeted fiscal goals. The second recommendation for the City
of San Jose is to incorporate community input as much as possible when pursuing
revenue strategies. Invest the time and resources required to administer surveys, hold
community meetings, and share public newsletters in each of the council districts.
Incorporate the community to discover which specific strategies they would support.
With the support of the community behind the department, pursuing and implementing a
proposed strategy will result in a much smoother implementation process. Finally, the last
recommendation for the City of San Jose is to consistently have in place a system for
49
calculating current operating costs. Even though the price of a class or program may have
remained the same, the indirect and direct costs of operating the class and program have
increased over time. Having a system in place will help employees, as well as, executive
staff accurately state the true operating costs of the program when adjusting rates or
requesting more funding.
In reflecting on this research paper, one must ask what future areas of research
can be done to complement and add to the research completed for this project. There are
two main areas of future research that would greatly benefit the area of sustainable
revenue strategies for local parks and recreation departments. The first additional area of
research would involve surveying the different types and structures of local governments
to see how their leading representatives perceive alternative revenue strategies for parks
and recreation departments. Surveying the council district and mayoral representatives
directly could possibly help parks and recreation departments understand the perspective
of their local governing bodies. This future research could also possibly reveal the
common ground that local parks and recreation departments have with their city officials,
as well as, the advice and political perspectives that city officials might have regarding
the implementation of alternative revenue strategies for local parks and recreation
departments.
The second additional area of research would revolve around surveying private
corporations to see their perspective on partnering with local parks and recreation
departments through the use of donations, grants, sponsorships, and naming rights. This
future area of research would be beneficial because it would help clarify if private
corporations are interested in working alongside local parks and recreation departments
50
and if so, what revenue strategies would be ideal for them to employ. This survey would
also possibly help create a stronger relationship between local government and private
corporations by showing how a private organization can assist parks and recreation
departments in providing quality services for the public.
In conclusion, this research paper has focused on surveying what revenue
strategies are currently being implemented by large cities along the western United
States, and of those strategies, which would be the most feasible and beneficial for the
City of San Jose to implement. This research paper has proven that a majority of western
states are pursuing alternative forms of funding in order to increase the financial
sustainability of their local parks and recreation departments. Parks and recreation
department programs and services help to improve not only the health but also the quality
of life that residents can enjoy. In order to better serve the community members who
utilize local services, the topic of sustainable revenue strategies will continue to be a
pressing need for future research.
51
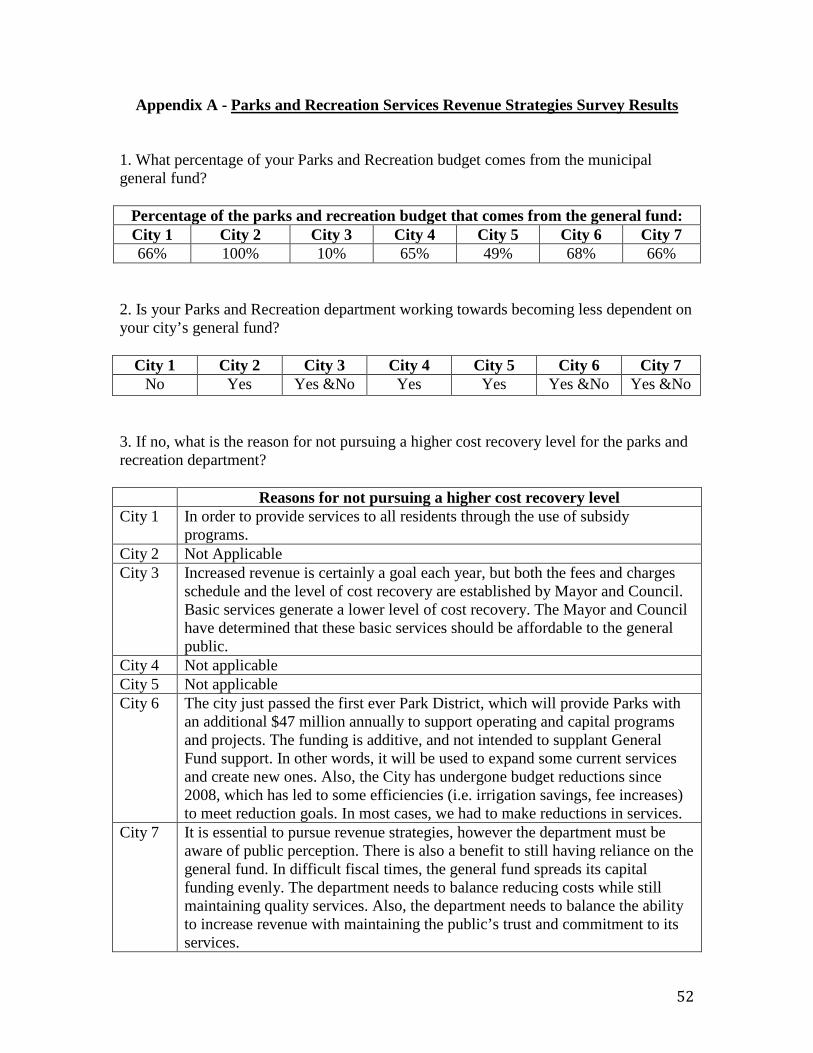
Appendix A - Parks and Recreation Services Revenue Strategies Survey Results 1. What percentage of your Parks and Recreation budget comes from the municipal general fund?
Percentage of the parks and recreation budget that comes from the general fund: City 1 City 2 City 3 City 4 City 5 City 6 City 7 66% 100% 10% 65% 49% 68% 66%
2. Is your Parks and Recreation department working towards becoming less dependent on your city’s general fund?
City 1 City 2 City 3 City 4 City 5 City 6 City 7 No Yes Yes &No Yes Yes Yes &No Yes &No
3. If no, what is the reason for not pursuing a higher cost recovery level for the parks and recreation department? Reasons for not pursuing a higher cost recovery level City 1 In order to provide services to all residents through the use of subsidy
programs. City 2 Not Applicable City 3 Increased revenue is certainly a goal each year, but both the fees and charges
schedule and the level of cost recovery are established by Mayor and Council. Basic services generate a lower level of cost recovery. The Mayor and Council have determined that these basic services should be affordable to the general public.
City 4 Not applicable City 5 Not applicable City 6 The city just passed the first ever Park District, which will provide Parks with
an additional $47 million annually to support operating and capital programs and projects. The funding is additive, and not intended to supplant General Fund support. In other words, it will be used to expand some current services and create new ones. Also, the City has undergone budget reductions since 2008, which has led to some efficiencies (i.e. irrigation savings, fee increases) to meet reduction goals. In most cases, we had to make reductions in services.
City 7 It is essential to pursue revenue strategies, however the department must be aware of public perception. There is also a benefit to still having reliance on the general fund. In difficult fiscal times, the general fund spreads its capital funding evenly. The department needs to balance reducing costs while still maintaining quality services. Also, the department needs to balance the ability to increase revenue with maintaining the public’s trust and commitment to its services.
52
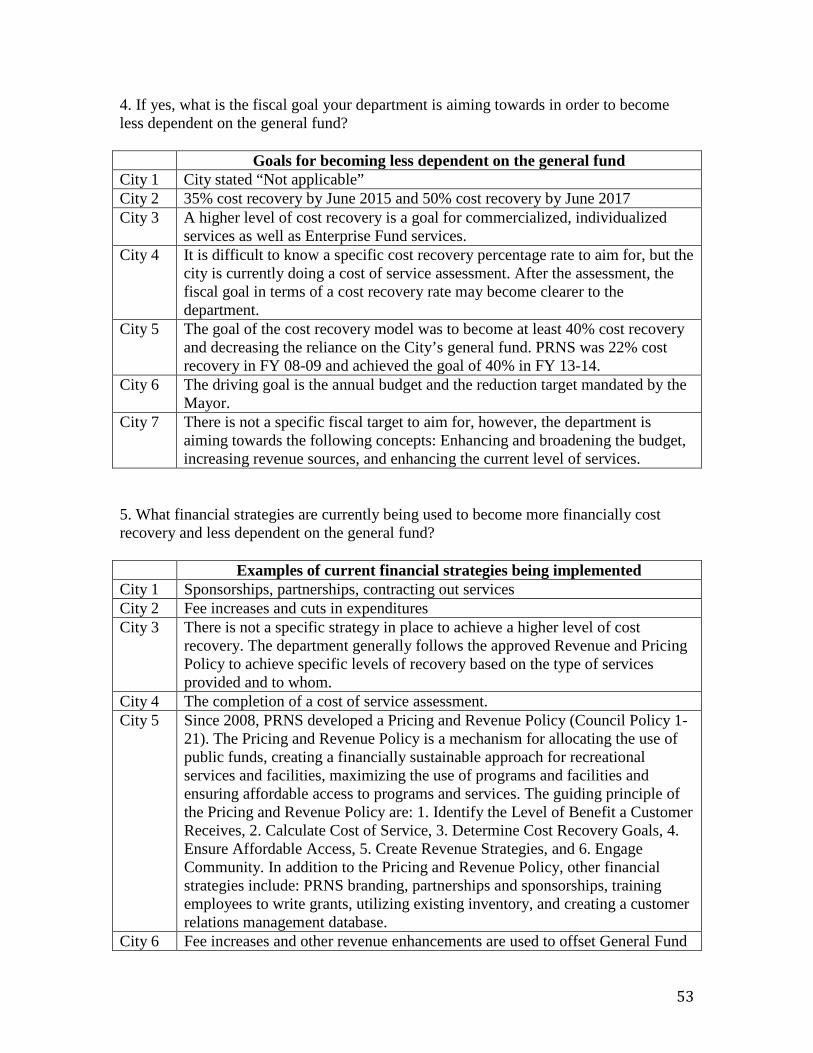
4. If yes, what is the fiscal goal your department is aiming towards in order to become less dependent on the general fund? Goals for becoming less dependent on the general fund City 1 City stated “Not applicable” City 2 35% cost recovery by June 2015 and 50% cost recovery by June 2017 City 3 A higher level of cost recovery is a goal for commercialized, individualized
services as well as Enterprise Fund services. City 4 It is difficult to know a specific cost recovery percentage rate to aim for, but the
city is currently doing a cost of service assessment. After the assessment, the fiscal goal in terms of a cost recovery rate may become clearer to the department.
City 5 The goal of the cost recovery model was to become at least 40% cost recovery and decreasing the reliance on the City’s general fund. PRNS was 22% cost recovery in FY 08-09 and achieved the goal of 40% in FY 13-14.
City 6 The driving goal is the annual budget and the reduction target mandated by the Mayor.
City 7 There is not a specific fiscal target to aim for, however, the department is aiming towards the following concepts: Enhancing and broadening the budget, increasing revenue sources, and enhancing the current level of services.
5. What financial strategies are currently being used to become more financially cost recovery and less dependent on the general fund? Examples of current financial strategies being implemented City 1 Sponsorships, partnerships, contracting out services City 2 Fee increases and cuts in expenditures City 3 There is not a specific strategy in place to achieve a higher level of cost
recovery. The department generally follows the approved Revenue and Pricing Policy to achieve specific levels of recovery based on the type of services provided and to whom.
City 4 The completion of a cost of service assessment. City 5 Since 2008, PRNS developed a Pricing and Revenue Policy (Council Policy 1-
21). The Pricing and Revenue Policy is a mechanism for allocating the use of public funds, creating a financially sustainable approach for recreational services and facilities, maximizing the use of programs and facilities and ensuring affordable access to programs and services. The guiding principle of the Pricing and Revenue Policy are: 1. Identify the Level of Benefit a Customer Receives, 2. Calculate Cost of Service, 3. Determine Cost Recovery Goals, 4. Ensure Affordable Access, 5. Create Revenue Strategies, and 6. Engage Community. In addition to the Pricing and Revenue Policy, other financial strategies include: PRNS branding, partnerships and sponsorships, training employees to write grants, utilizing existing inventory, and creating a customer relations management database.
City 6 Fee increases and other revenue enhancements are used to offset General Fund
53
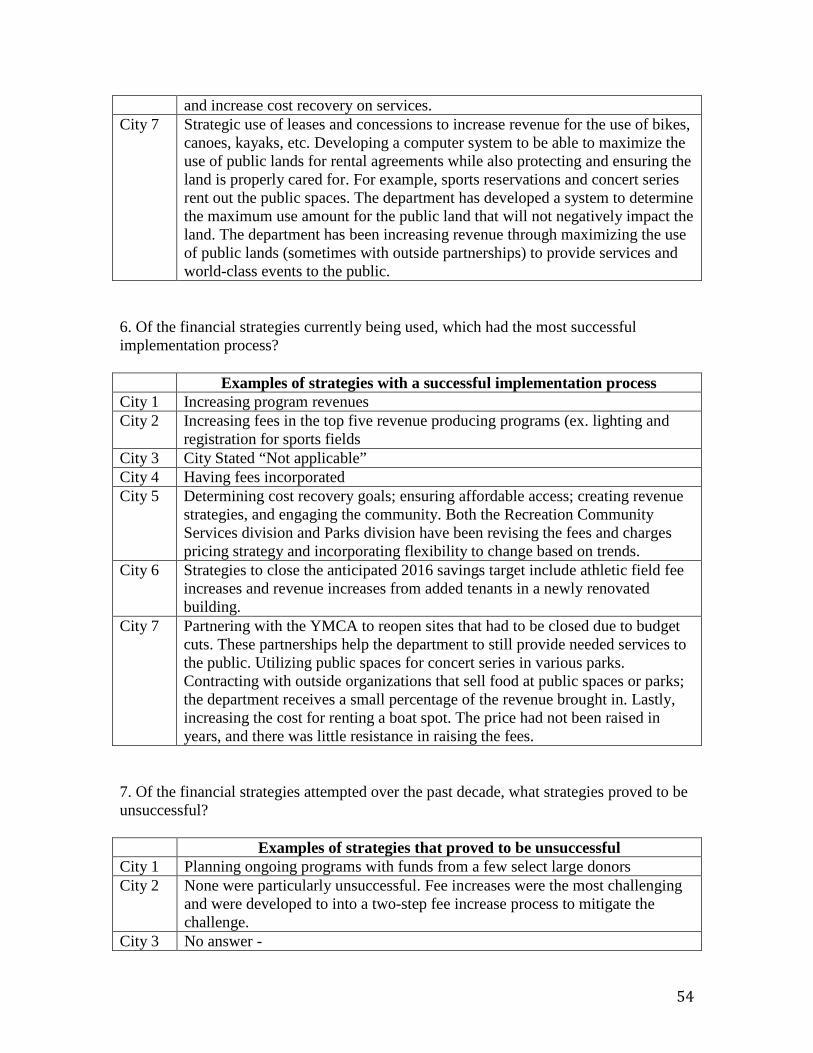
and increase cost recovery on services. City 7 Strategic use of leases and concessions to increase revenue for the use of bikes,
canoes, kayaks, etc. Developing a computer system to be able to maximize the use of public lands for rental agreements while also protecting and ensuring the land is properly cared for. For example, sports reservations and concert series rent out the public spaces. The department has developed a system to determine the maximum use amount for the public land that will not negatively impact the land. The department has been increasing revenue through maximizing the use of public lands (sometimes with outside partnerships) to provide services and world-class events to the public.
6. Of the financial strategies currently being used, which had the most successful implementation process? Examples of strategies with a successful implementation process City 1 Increasing program revenues City 2 Increasing fees in the top five revenue producing programs (ex. lighting and
registration for sports fields City 3 City Stated “Not applicable” City 4 Having fees incorporated City 5 Determining cost recovery goals; ensuring affordable access; creating revenue
strategies, and engaging the community. Both the Recreation Community Services division and Parks division have been revising the fees and charges pricing strategy and incorporating flexibility to change based on trends.
City 6 Strategies to close the anticipated 2016 savings target include athletic field fee increases and revenue increases from added tenants in a newly renovated building.
City 7 Partnering with the YMCA to reopen sites that had to be closed due to budget cuts. These partnerships help the department to still provide needed services to the public. Utilizing public spaces for concert series in various parks. Contracting with outside organizations that sell food at public spaces or parks; the department receives a small percentage of the revenue brought in. Lastly, increasing the cost for renting a boat spot. The price had not been raised in years, and there was little resistance in raising the fees.
7. Of the financial strategies attempted over the past decade, what strategies proved to be unsuccessful? Examples of strategies that proved to be unsuccessful City 1 Planning ongoing programs with funds from a few select large donors City 2 None were particularly unsuccessful. Fee increases were the most challenging
and were developed to into a two-step fee increase process to mitigate the challenge.
City 3 No answer -
54
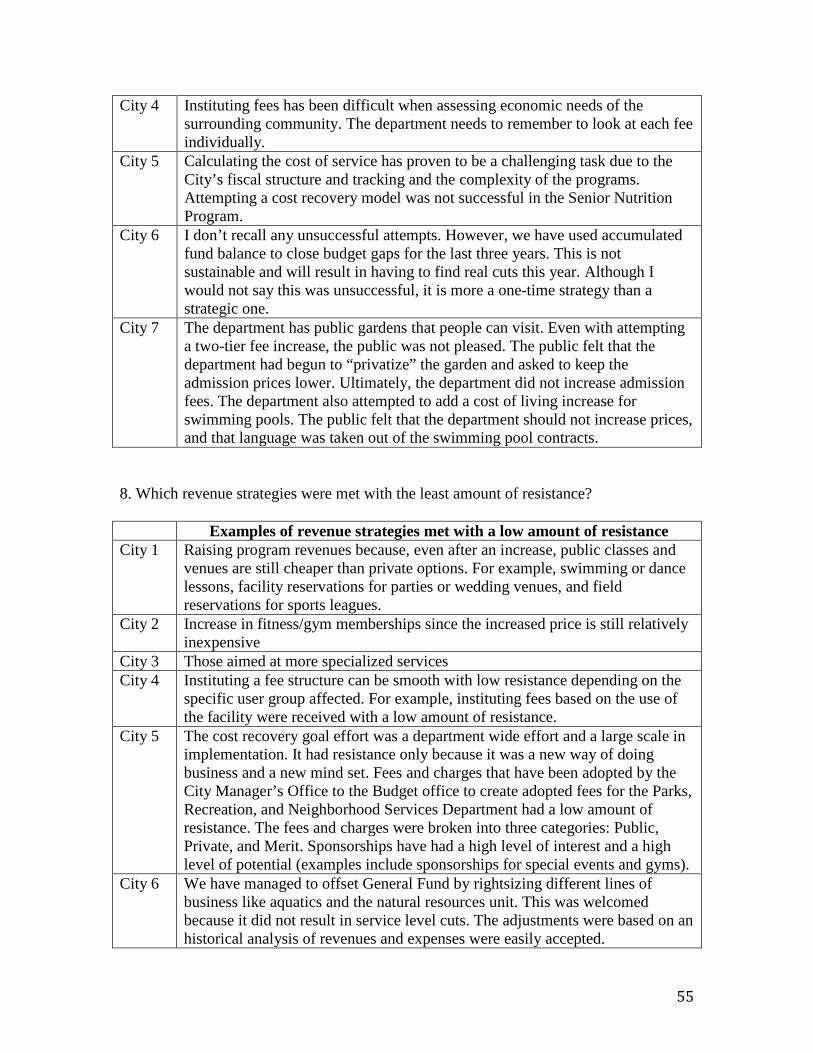
City 4 Instituting fees has been difficult when assessing economic needs of the surrounding community. The department needs to remember to look at each fee individually.
City 5 Calculating the cost of service has proven to be a challenging task due to the City’s fiscal structure and tracking and the complexity of the programs. Attempting a cost recovery model was not successful in the Senior Nutrition Program.
City 6 I don’t recall any unsuccessful attempts. However, we have used accumulated fund balance to close budget gaps for the last three years. This is not sustainable and will result in having to find real cuts this year. Although I would not say this was unsuccessful, it is more a one-time strategy than a strategic one.
City 7 The department has public gardens that people can visit. Even with attempting a two-tier fee increase, the public was not pleased. The public felt that the department had begun to “privatize” the garden and asked to keep the admission prices lower. Ultimately, the department did not increase admission fees. The department also attempted to add a cost of living increase for swimming pools. The public felt that the department should not increase prices, and that language was taken out of the swimming pool contracts.
8. Which revenue strategies were met with the least amount of resistance? Examples of revenue strategies met with a low amount of resistance City 1 Raising program revenues because, even after an increase, public classes and
venues are still cheaper than private options. For example, swimming or dance lessons, facility reservations for parties or wedding venues, and field reservations for sports leagues.
City 2 Increase in fitness/gym memberships since the increased price is still relatively inexpensive
City 3 Those aimed at more specialized services City 4 Instituting a fee structure can be smooth with low resistance depending on the
specific user group affected. For example, instituting fees based on the use of the facility were received with a low amount of resistance.
City 5 The cost recovery goal effort was a department wide effort and a large scale in implementation. It had resistance only because it was a new way of doing business and a new mind set. Fees and charges that have been adopted by the City Manager’s Office to the Budget office to create adopted fees for the Parks, Recreation, and Neighborhood Services Department had a low amount of resistance. The fees and charges were broken into three categories: Public, Private, and Merit. Sponsorships have had a high level of interest and a high level of potential (examples include sponsorships for special events and gyms).
City 6 We have managed to offset General Fund by rightsizing different lines of business like aquatics and the natural resources unit. This was welcomed because it did not result in service level cuts. The adjustments were based on an historical analysis of revenues and expenses were easily accepted.
55
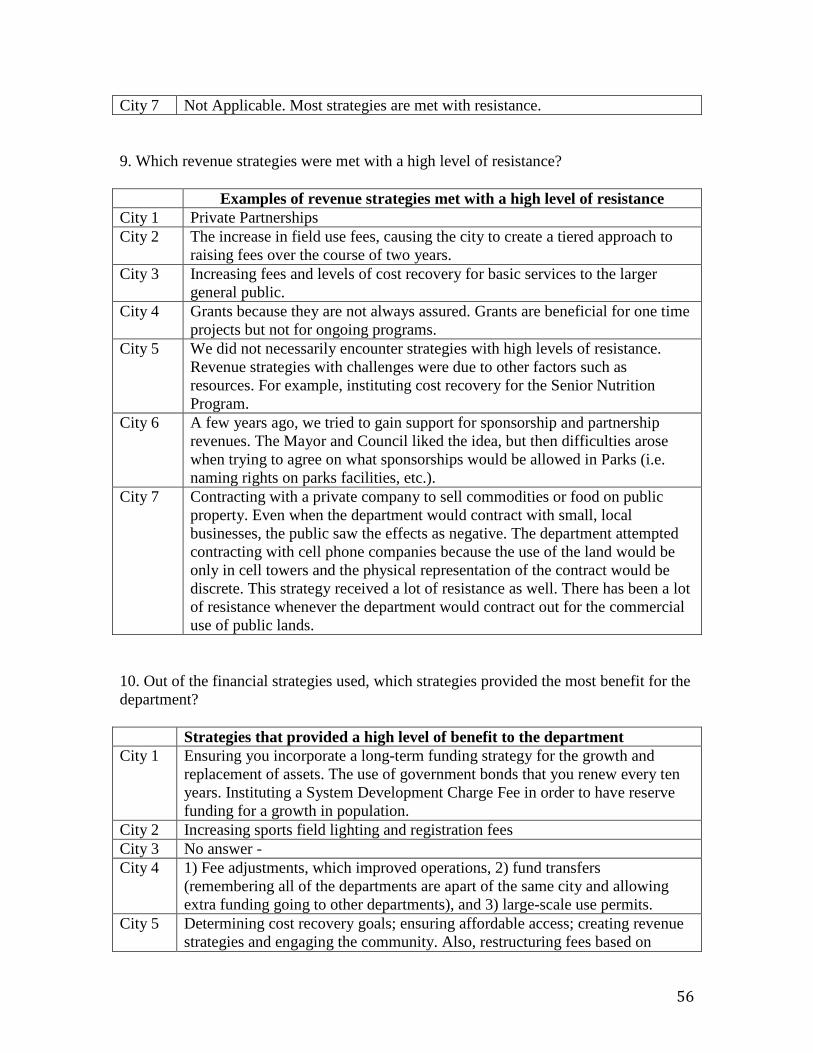
City 7 Not Applicable. Most strategies are met with resistance. 9. Which revenue strategies were met with a high level of resistance? Examples of revenue strategies met with a high level of resistance City 1 Private Partnerships City 2 The increase in field use fees, causing the city to create a tiered approach to
raising fees over the course of two years. City 3 Increasing fees and levels of cost recovery for basic services to the larger
general public. City 4 Grants because they are not always assured. Grants are beneficial for one time
projects but not for ongoing programs. City 5 We did not necessarily encounter strategies with high levels of resistance.
Revenue strategies with challenges were due to other factors such as resources. For example, instituting cost recovery for the Senior Nutrition Program.
City 6 A few years ago, we tried to gain support for sponsorship and partnership revenues. The Mayor and Council liked the idea, but then difficulties arose when trying to agree on what sponsorships would be allowed in Parks (i.e. naming rights on parks facilities, etc.).
City 7 Contracting with a private company to sell commodities or food on public property. Even when the department would contract with small, local businesses, the public saw the effects as negative. The department attempted contracting with cell phone companies because the use of the land would be only in cell towers and the physical representation of the contract would be discrete. This strategy received a lot of resistance as well. There has been a lot of resistance whenever the department would contract out for the commercial use of public lands.
10. Out of the financial strategies used, which strategies provided the most benefit for the department? Strategies that provided a high level of benefit to the department City 1 Ensuring you incorporate a long-term funding strategy for the growth and
replacement of assets. The use of government bonds that you renew every ten years. Instituting a System Development Charge Fee in order to have reserve funding for a growth in population.
City 2 Increasing sports field lighting and registration fees City 3 No answer - City 4 1) Fee adjustments, which improved operations, 2) fund transfers
(remembering all of the departments are apart of the same city and allowing extra funding going to other departments), and 3) large-scale use permits.
City 5 Determining cost recovery goals; ensuring affordable access; creating revenue strategies and engaging the community. Also, restructuring fees based on
56
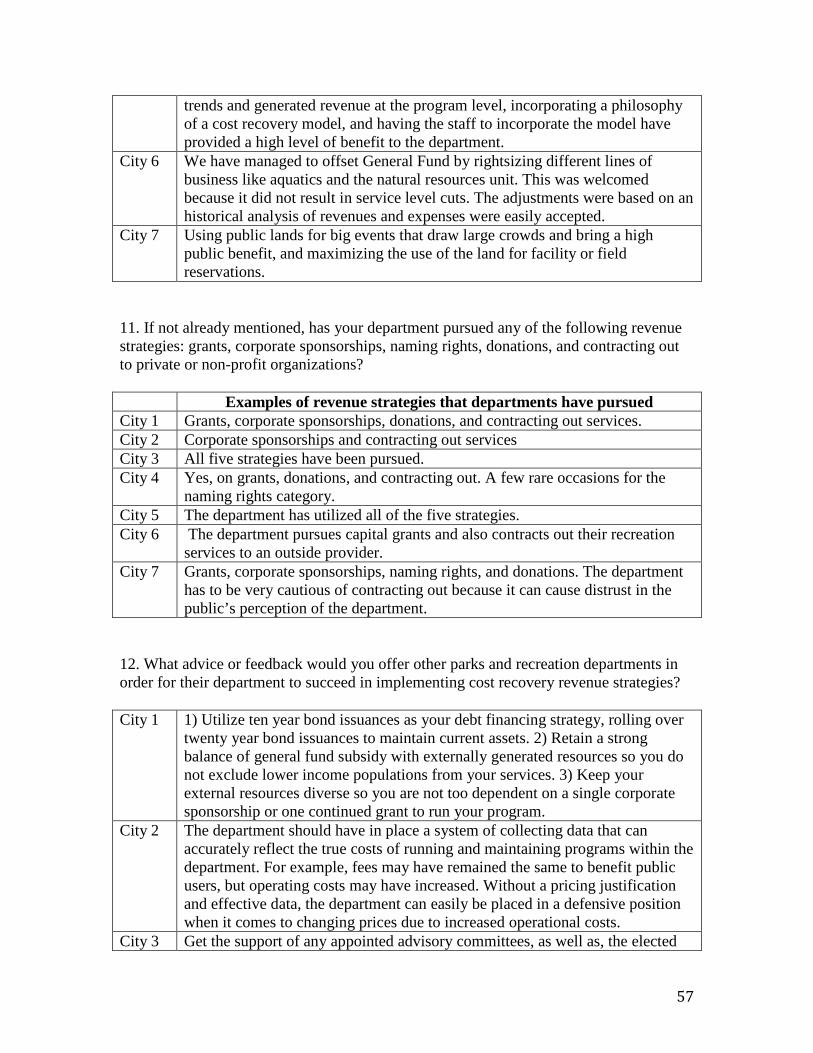
trends and generated revenue at the program level, incorporating a philosophy of a cost recovery model, and having the staff to incorporate the model have provided a high level of benefit to the department.
City 6 We have managed to offset General Fund by rightsizing different lines of business like aquatics and the natural resources unit. This was welcomed because it did not result in service level cuts. The adjustments were based on an historical analysis of revenues and expenses were easily accepted.
City 7 Using public lands for big events that draw large crowds and bring a high public benefit, and maximizing the use of the land for facility or field reservations.
11. If not already mentioned, has your department pursued any of the following revenue strategies: grants, corporate sponsorships, naming rights, donations, and contracting out to private or non-profit organizations? Examples of revenue strategies that departments have pursued City 1 Grants, corporate sponsorships, donations, and contracting out services. City 2 Corporate sponsorships and contracting out services City 3 All five strategies have been pursued. City 4 Yes, on grants, donations, and contracting out. A few rare occasions for the
naming rights category. City 5 The department has utilized all of the five strategies. City 6 The department pursues capital grants and also contracts out their recreation
services to an outside provider. City 7 Grants, corporate sponsorships, naming rights, and donations. The department
has to be very cautious of contracting out because it can cause distrust in the public’s perception of the department.
12. What advice or feedback would you offer other parks and recreation departments in order for their department to succeed in implementing cost recovery revenue strategies? City 1 1) Utilize ten year bond issuances as your debt financing strategy, rolling over
twenty year bond issuances to maintain current assets. 2) Retain a strong balance of general fund subsidy with externally generated resources so you do not exclude lower income populations from your services. 3) Keep your external resources diverse so you are not too dependent on a single corporate sponsorship or one continued grant to run your program.
City 2 The department should have in place a system of collecting data that can accurately reflect the true costs of running and maintaining programs within the department. For example, fees may have remained the same to benefit public users, but operating costs may have increased. Without a pricing justification and effective data, the department can easily be placed in a defensive position when it comes to changing prices due to increased operational costs.
City 3 Get the support of any appointed advisory committees, as well as, the elected
57
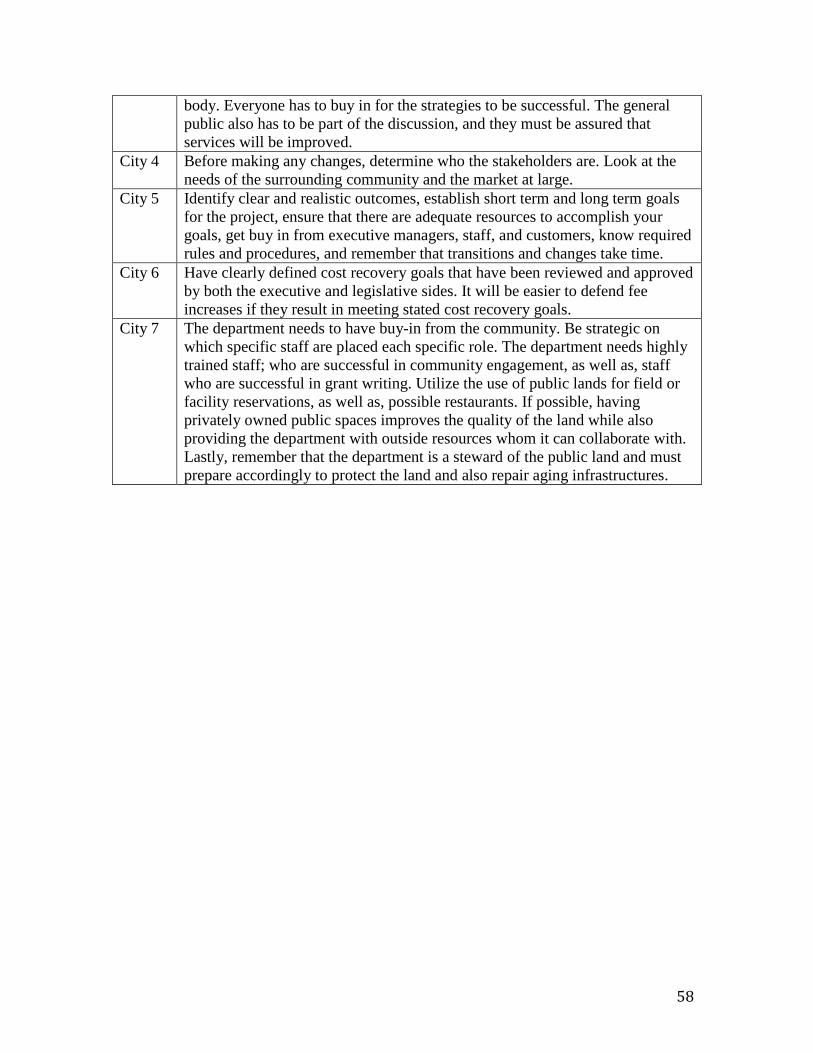
body. Everyone has to buy in for the strategies to be successful. The general public also has to be part of the discussion, and they must be assured that services will be improved.
City 4 Before making any changes, determine who the stakeholders are. Look at the needs of the surrounding community and the market at large.
City 5 Identify clear and realistic outcomes, establish short term and long term goals for the project, ensure that there are adequate resources to accomplish your goals, get buy in from executive managers, staff, and customers, know required rules and procedures, and remember that transitions and changes take time.
City 6 Have clearly defined cost recovery goals that have been reviewed and approved by both the executive and legislative sides. It will be easier to defend fee increases if they result in meeting stated cost recovery goals.
City 7 The department needs to have buy-in from the community. Be strategic on which specific staff are placed each specific role. The department needs highly trained staff; who are successful in community engagement, as well as, staff who are successful in grant writing. Utilize the use of public lands for field or facility reservations, as well as, possible restaurants. If possible, having privately owned public spaces improves the quality of the land while also providing the department with outside resources whom it can collaborate with. Lastly, remember that the department is a steward of the public land and must prepare accordingly to protect the land and also repair aging infrastructures.
58
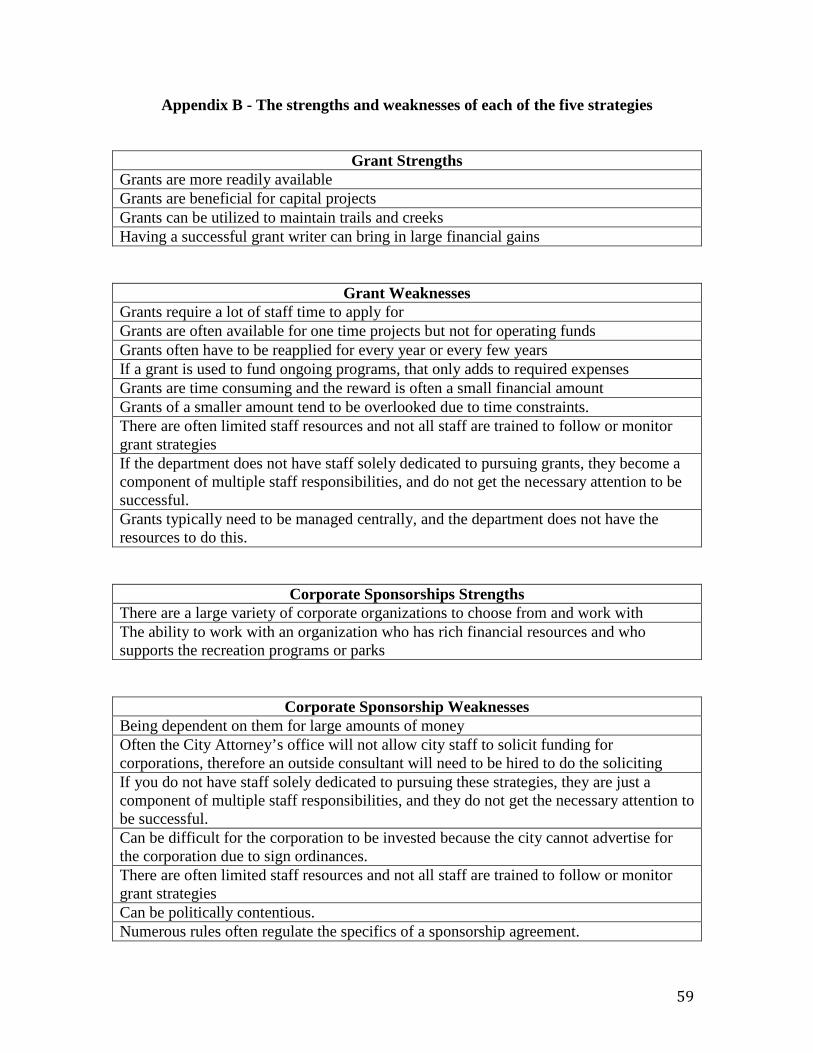
Appendix B - The strengths and weaknesses of each of the five strategies
Grant Strengths Grants are more readily available Grants are beneficial for capital projects Grants can be utilized to maintain trails and creeks Having a successful grant writer can bring in large financial gains
Grant Weaknesses Grants require a lot of staff time to apply for Grants are often available for one time projects but not for operating funds Grants often have to be reapplied for every year or every few years If a grant is used to fund ongoing programs, that only adds to required expenses Grants are time consuming and the reward is often a small financial amount Grants of a smaller amount tend to be overlooked due to time constraints. There are often limited staff resources and not all staff are trained to follow or monitor grant strategies If the department does not have staff solely dedicated to pursuing grants, they become a component of multiple staff responsibilities, and do not get the necessary attention to be successful. Grants typically need to be managed centrally, and the department does not have the resources to do this.
Corporate Sponsorships Strengths There are a large variety of corporate organizations to choose from and work with The ability to work with an organization who has rich financial resources and who supports the recreation programs or parks
Corporate Sponsorship Weaknesses Being dependent on them for large amounts of money Often the City Attorney’s office will not allow city staff to solicit funding for corporations, therefore an outside consultant will need to be hired to do the soliciting If you do not have staff solely dedicated to pursuing these strategies, they are just a component of multiple staff responsibilities, and they do not get the necessary attention to be successful. Can be difficult for the corporation to be invested because the city cannot advertise for the corporation due to sign ordinances. There are often limited staff resources and not all staff are trained to follow or monitor grant strategies Can be politically contentious. Numerous rules often regulate the specifics of a sponsorship agreement.
59
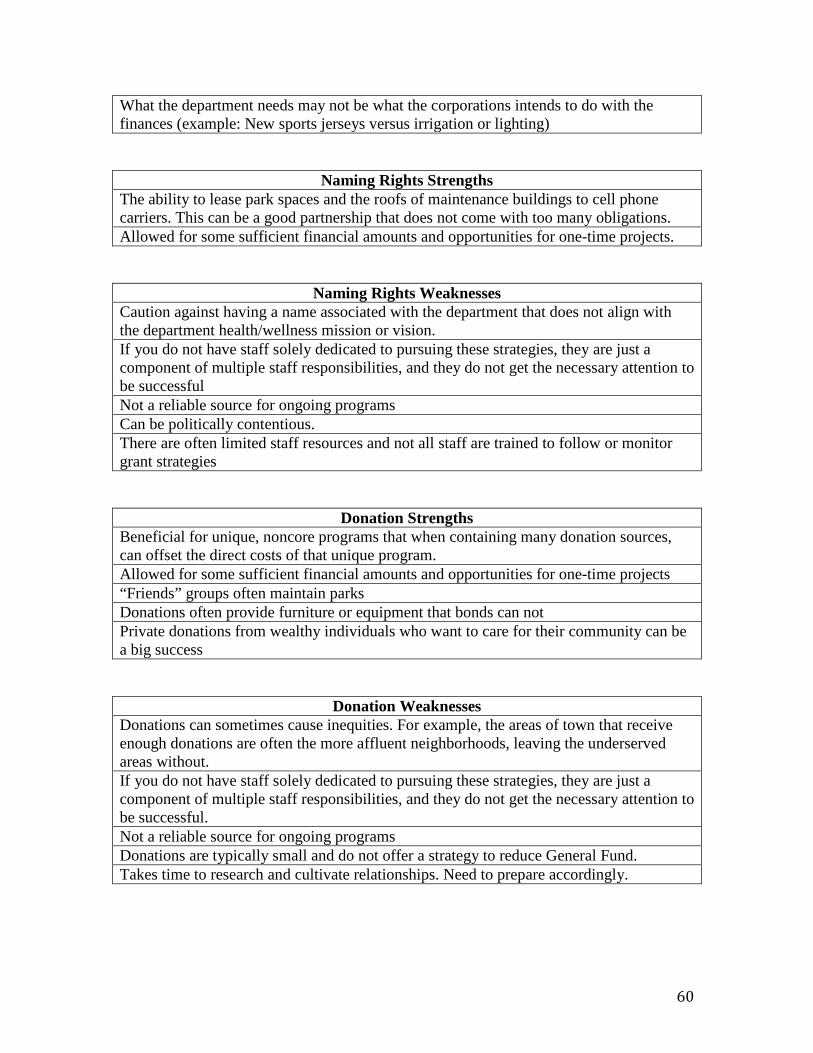
What the department needs may not be what the corporations intends to do with the finances (example: New sports jerseys versus irrigation or lighting)
Naming Rights Strengths The ability to lease park spaces and the roofs of maintenance buildings to cell phone carriers. This can be a good partnership that does not come with too many obligations. Allowed for some sufficient financial amounts and opportunities for one-time projects.
Naming Rights Weaknesses Caution against having a name associated with the department that does not align with the department health/wellness mission or vision. If you do not have staff solely dedicated to pursuing these strategies, they are just a component of multiple staff responsibilities, and they do not get the necessary attention to be successful Not a reliable source for ongoing programs Can be politically contentious. There are often limited staff resources and not all staff are trained to follow or monitor grant strategies
Donation Strengths Beneficial for unique, noncore programs that when containing many donation sources, can offset the direct costs of that unique program. Allowed for some sufficient financial amounts and opportunities for one-time projects “Friends” groups often maintain parks Donations often provide furniture or equipment that bonds can not Private donations from wealthy individuals who want to care for their community can be a big success
Donation Weaknesses Donations can sometimes cause inequities. For example, the areas of town that receive enough donations are often the more affluent neighborhoods, leaving the underserved areas without. If you do not have staff solely dedicated to pursuing these strategies, they are just a component of multiple staff responsibilities, and they do not get the necessary attention to be successful. Not a reliable source for ongoing programs Donations are typically small and do not offer a strategy to reduce General Fund. Takes time to research and cultivate relationships. Need to prepare accordingly.
60
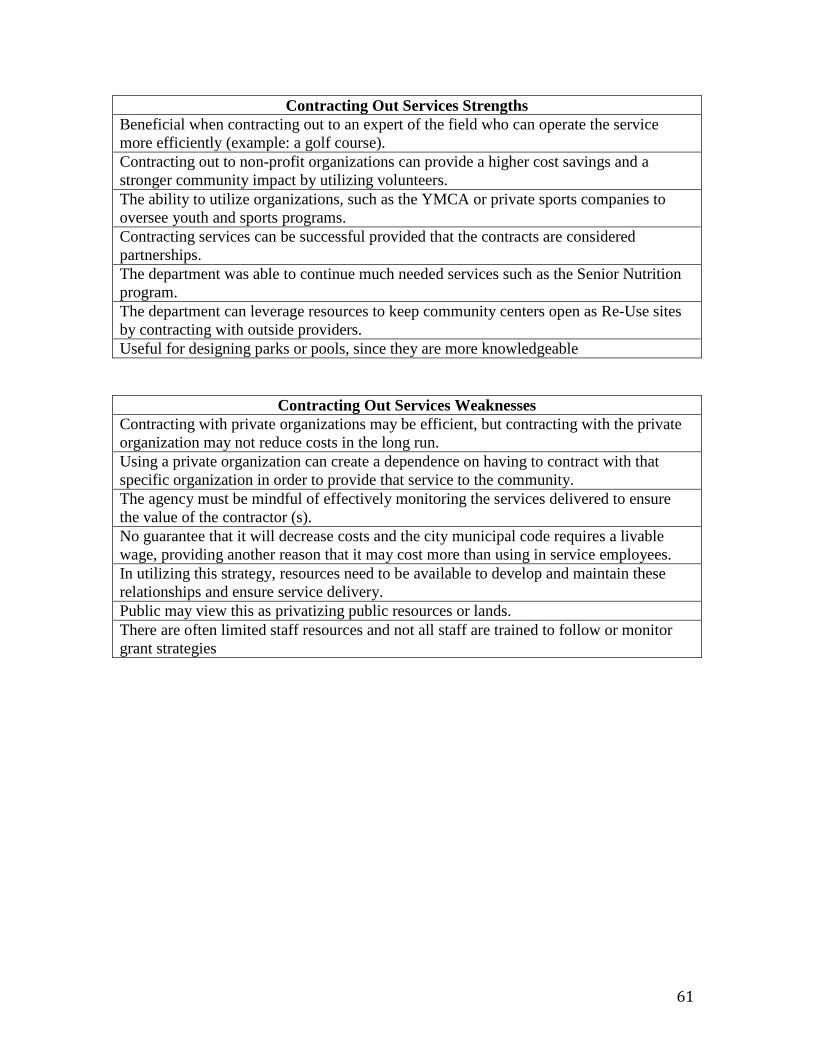
Contracting Out Services Strengths Beneficial when contracting out to an expert of the field who can operate the service more efficiently (example: a golf course). Contracting out to non-profit organizations can provide a higher cost savings and a stronger community impact by utilizing volunteers. The ability to utilize organizations, such as the YMCA or private sports companies to oversee youth and sports programs. Contracting services can be successful provided that the contracts are considered partnerships. The department was able to continue much needed services such as the Senior Nutrition program. The department can leverage resources to keep community centers open as Re-Use sites by contracting with outside providers. Useful for designing parks or pools, since they are more knowledgeable
Contracting Out Services Weaknesses Contracting with private organizations may be efficient, but contracting with the private organization may not reduce costs in the long run. Using a private organization can create a dependence on having to contract with that specific organization in order to provide that service to the community. The agency must be mindful of effectively monitoring the services delivered to ensure the value of the contractor (s). No guarantee that it will decrease costs and the city municipal code requires a livable wage, providing another reason that it may cost more than using in service employees. In utilizing this strategy, resources need to be available to develop and maintain these relationships and ensure service delivery. Public may view this as privatizing public resources or lands. There are often limited staff resources and not all staff are trained to follow or monitor grant strategies
61
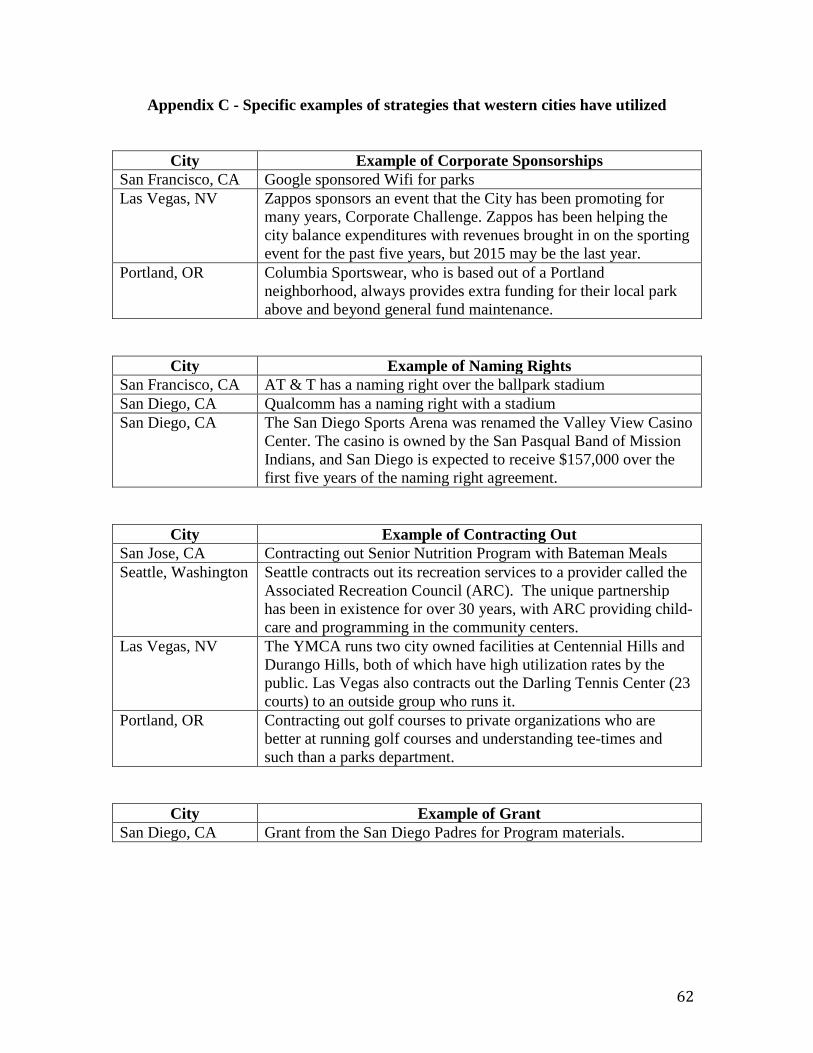
Appendix C - Specific examples of strategies that western cities have utilized
City Example of Corporate Sponsorships San Francisco, CA Google sponsored Wifi for parks Las Vegas, NV Zappos sponsors an event that the City has been promoting for
many years, Corporate Challenge. Zappos has been helping the city balance expenditures with revenues brought in on the sporting event for the past five years, but 2015 may be the last year.
Portland, OR Columbia Sportswear, who is based out of a Portland neighborhood, always provides extra funding for their local park above and beyond general fund maintenance.
City Example of Naming Rights San Francisco, CA AT & T has a naming right over the ballpark stadium San Diego, CA Qualcomm has a naming right with a stadium San Diego, CA The San Diego Sports Arena was renamed the Valley View Casino
Center. The casino is owned by the San Pasqual Band of Mission Indians, and San Diego is expected to receive $157,000 over the first five years of the naming right agreement.
City Example of Contracting Out San Jose, CA Contracting out Senior Nutrition Program with Bateman Meals Seattle, Washington Seattle contracts out its recreation services to a provider called the
Associated Recreation Council (ARC). The unique partnership has been in existence for over 30 years, with ARC providing child-care and programming in the community centers.
Las Vegas, NV The YMCA runs two city owned facilities at Centennial Hills and Durango Hills, both of which have high utilization rates by the public. Las Vegas also contracts out the Darling Tennis Center (23 courts) to an outside group who runs it.
Portland, OR Contracting out golf courses to private organizations who are better at running golf courses and understanding tee-times and such than a parks department.
City Example of Grant San Diego, CA Grant from the San Diego Padres for Program materials.
62
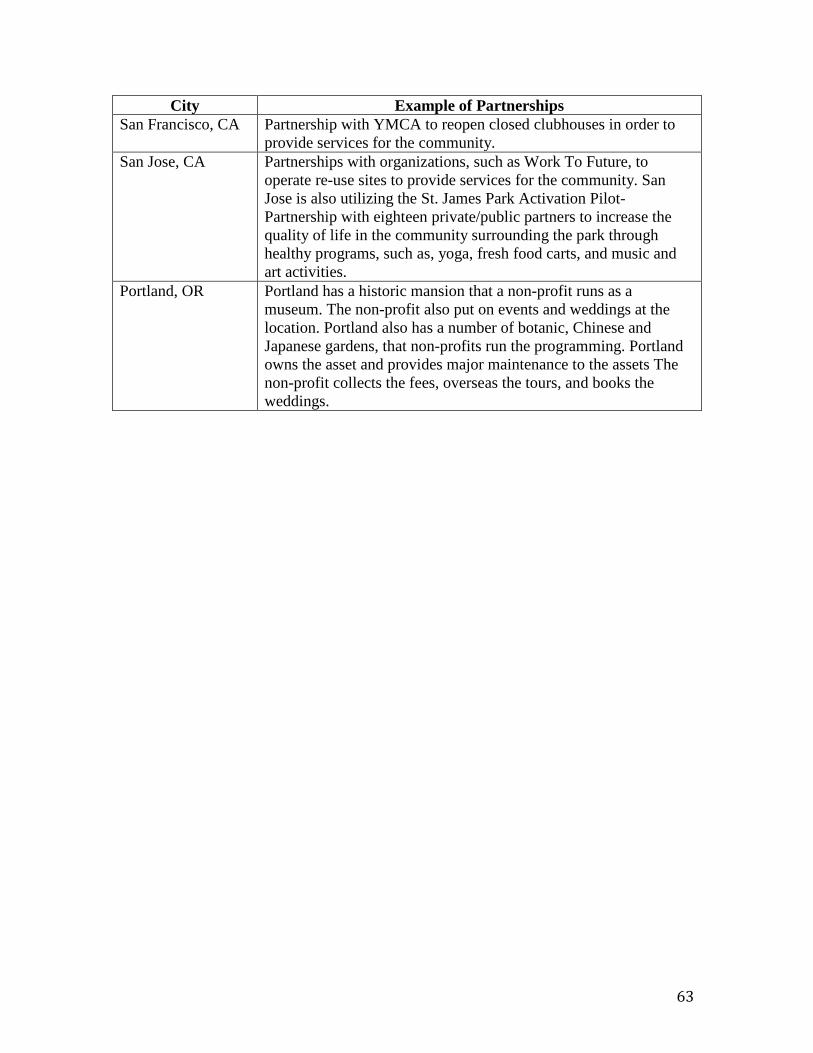
City Example of Partnerships San Francisco, CA Partnership with YMCA to reopen closed clubhouses in order to
provide services for the community. San Jose, CA Partnerships with organizations, such as Work To Future, to
operate re-use sites to provide services for the community. San Jose is also utilizing the St. James Park Activation Pilot- Partnership with eighteen private/public partners to increase the quality of life in the community surrounding the park through healthy programs, such as, yoga, fresh food carts, and music and art activities.
Portland, OR Portland has a historic mansion that a non-profit runs as a museum. The non-profit also put on events and weddings at the location. Portland also has a number of botanic, Chinese and Japanese gardens, that non-profits run the programming. Portland owns the asset and provides major maintenance to the assets The non-profit collects the fees, overseas the tours, and books the weddings.
63
References
Balagso, A. City of San Jose Parks, Recreation, and Neighborhood Services Department. 2009. Annual Report: Strategies for sustainability. San Jose, CA: U.S. Balagso, A. City of San Jose Parks, Recreation, and Neighborhood Services Department. 2010. Annual Report. San Jose, CA: U.S.
Barnes, M. L., & Sharpe, E. K. (2009). Looking Beyond Traditional Volunteer Management: A Case Study of an Alternative Approach to Volunteer Engagement in Parks and Recreation. Voluntas: International Journal Of Voluntary & Nonprofit Organizations, 20(2), 169-187. Retrieved August 27, 2014, from Political Science Complete database. Carr, J. B., Elling, R., & Krawczyk, K. (2010). Confronting Hard Times in Local Government: Public Views About Responding to Fiscal Stress. Conference Papers-American Political Science Association, 1-38. Retrieved August 27, 2014, from Political Science Complete database. City of San Jose Parks, Recreation, and Neighborhood Services Department. 2009. City of San Jose Green Print: 2009 Strategic Plan Update. San Jose, CA: U.S. City of San Jose Parks, Recreation, and Neighborhood Services Department. 2009. Pricing and revenue policy (Resolution number 74983). San Jose, CA: U.S. Deller, S. C., & Maher, C. S. (2006). A Model of Asymmetries in the Flypaper Effect. Publius: The Journal Of Federalism, 36(2), 213-229. Retrieved September 6, 2014, from Social Sciences Full Text database. Dietl, H., Lang, M., & Werner, S. (2009). Social Welfare in Sports Leagues with Profit-Maximizing and/or Win-Maximizing Clubs. Southern Economic Journal, 76(2), 375-396. Retrieved September 6, 2014, from Social Sciences Full Text database. Edmonds-Mares, J. City of San Jose Parks, Recreation, and Neighborhood Services Department. 2011. Annual Report: Accomplishments, results, and performance on cost recovery goals. San Jose, CA: U.S. Edmonds-Mares, J. City of San Jose Parks, Recreation, and Neighborhood Services Department. 2012. Annual Report: Accomplishments, results, and performance on cost recovery goals. San Jose, CA: U.S. Edmond-Mares, J. City of San Jose Parks, Recreation, and Neighborhood Services Department. 2013. Annual Report: 360 degrees of service to the community. San Jose, CA: U.S.
64
Financing Outdoor Recreation. (2002). Parks & Recreation, 37(6), 74. Retrieved October 4, 2014, from Political Science Complete database. HeeSoun, J. (2006). Contracting Out Parks and Recreation Services: Correcting for Selection Bias Using a Heckman Selection Model*. International Journal Of Public Administration, 29(10/11), 799-818. Retrieved August 27, 2014, from Political Science Complete database.
Krawchenko, T., & Stoney, C. (2011). Public Private Partnerships and the Public Interest: A Case Study of Ottawa's Lansdowne Park Development. Canadian Journal Of Nonprofit & Social Economy Research / Revue Canadienne De Recherche Sur Les OSBL Et L'économie Sociale, 2(2), 74-90. Retrieved September 6, 2014, from Social Sciences Full Text database.
Krinsky, J., & Simonet, M. (2011). Safeguarding Private Value in Public Spaces: The Neoliberalization of Public Service Work in New York City's Parks. Social Justice, 38(1/2), 28-47. Retrieved September 6, 2014, from Social Sciences Full Text database.
Lau, C. (2012). Alternative Approach to Meet the Recreational Needs of Underserved Communities: The Case of Florence-Firestone. Public Works Management & Policy, 17(4), 388-402. Retrieved August 27, 2014, from Political Science Complete database.
McGrath, M. (2013). Fiscal Sustainability Case Investigation City of Santa Ana City of Santa Ana. National Civic Review, 102(1), 7-11. Retrieved September 6, 2014, from Social Sciences Full Text database.
Morgan, J. (1996). Resources, recreationists, and revenues: A policy dilemma for today's state park systems. Environmental Ethics, 18(3), 278. Retrieved September 23, 2014, from Humanities International Complete database.
Samnaliev, M., More, T., & Stevens, T. (2006). Financing Public Recreation Lands: Attitudes About Alternative Policies. Journal Of Park & Recreation Administration, 24(3), 24-49. Retrieved October 4, 2014, from Political Science Complete database.
Sun, R., & Jung, C. (2012). Does User-Charge Financing Reduce Expenditure Levels for the Charge-Financed Services?. American Review Of Public Administration, 42(2), 170-185. Retrieved August 27, 2014, from Political Science Complete database
65