identification of quality visual-based learning material ... · identification of quality...
TRANSCRIPT

Journal of STEM Teacher EducationVolume 47Issue 1 JITE Spring Article 7
2010
Identification of Quality Visual-based LearningMaterial for Technology EducationPetros KatsioloudisOld Dominion University
Follow this and additional works at: http://ir.library.illinoisstate.edu/jste
This Article is brought to you for free and open access by ISU ReD: Research and eData. It has been accepted for inclusion in Journal of STEM TeacherEducation by an authorized administrator of ISU ReD: Research and eData. For more information, please contact [email protected].
Recommended CitationKatsioloudis, Petros (2010) "Identification of Quality Visual-based Learning Material for Technology Education," Journal of STEMTeacher Education: Vol. 47: Iss. 1, Article 7.Available at: http://ir.library.illinoisstate.edu/jste/vol47/iss1/7
Identification of Quality Visual-based Learning Material for Technology Education
Petros Katsioloudis
Old Dominion University
In learning environments, the visual elements of courses, lessons, and presentations play an important role in learning. Well-conceived and rendered visuals help any audience understand and retain information (Wileman, 1993).
It is widely known that the use of visual technology enhances learning by providing a better understanding of the topic as well as motivating students. Visualization methods are extensively credited for simplifying the presentation of difficult subjects as well as aiding cognition; their use in the power engineering industry and education is enjoying significant growth (Idowu, Brinton, Hartmn, Nehard, Abraham, Boyer, 2006). Content visualization can facilitate the learner’s acquisition of information. It is related to the individual’s level of perceptual and associative learning in the content area. The individual must have sufficient experience and maturity to realize that using visualization is merely an attempt to represent reality vicariously (Dwyer, 1978). Much of intended visual communication or self-expression is not perceived, or often misunderstood, especially if it is complex (Lantz, 2000).
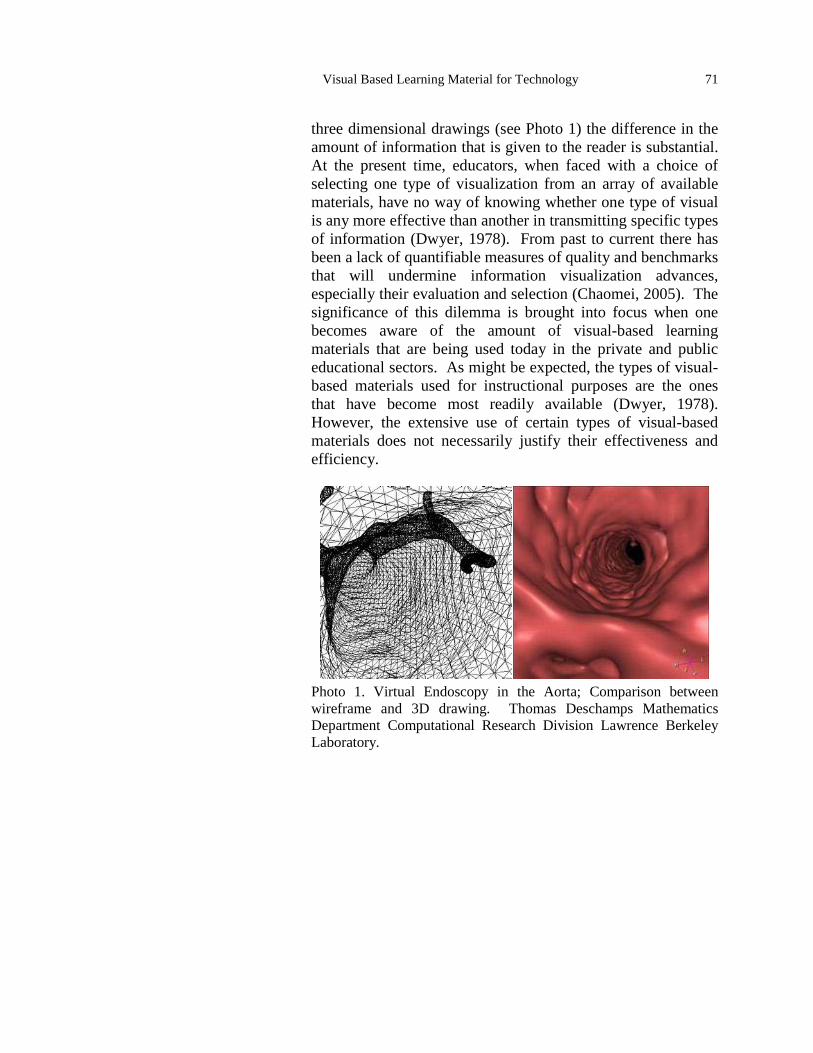
If all visual-based learning materials (tables, figures, photos, etc.) were equally effective in facilitating student achievement of all kinds of educational objectives, there would virtually be no problem associated with this type of instruction (Dwyer, 1978). However, this is not the case since there are many different types of visuals, differing in the amount of realistic detail they contain. When comparing wireframe and a Petros Katsioloudis is an Assistant Professor at Old Dominion University. He can be reached at [email protected].
Visual Based Learning Material for Technology 71
three dimensional drawings (see Photo 1) the difference in the amount of information that is given to the reader is substantial. At the present time, educators, when faced with a choice of selecting one type of visualization from an array of available materials, have no way of knowing whether one type of visual is any more effective than another in transmitting specific types of information (Dwyer, 1978). From past to current there has been a lack of quantifiable measures of quality and benchmarks that will undermine information visualization advances, especially their evaluation and selection (Chaomei, 2005). The significance of this dilemma is brought into focus when one becomes aware of the amount of visual-based learning materials that are being used today in the private and public educational sectors. As might be expected, the types of visual-based materials used for instructional purposes are the ones that have become most readily available (Dwyer, 1978). However, the extensive use of certain types of visual-based materials does not necessarily justify their effectiveness and efficiency.
Photo 1. Virtual Endoscopy in the Aorta; Comparison between wireframe and 3D drawing. Thomas Deschamps Mathematics Department Computational Research Division Lawrence Berkeley Laboratory.
72 JOURNAL OF INDUSTRIAL TEACHER EDUCATION
The importance of knowing how to select the best type of visual-based learning materials is recognized throughout higher education; however, with the exception of some descriptive literature, few studies have been conducted to identify the essential indicators of useful visual-based learning materials in technology education courses for the middle and high school grades (Lantz, 2000). The reason this is being emphasized for grades 7-12 is because technology education is mainly offered in those grades due to federal funding guidelines such as the Carl D. Perkins Vocational and Technical Education Act (2006) that provides federal funds "…to help provide vocational-technical education programs and services to youth and adults in middle school, high school and college level” (Wileman, 1993, p.3).
Since the early 1980s there has been little research to use when selecting specific types of visuals that will be most effective and efficient in facilitating student achievement of designated learning objectives. What is needed is systematic research efforts focused on three basic areas designed to provide data on: (a) what specific individual difference variables in learners actually make a difference in student achievement in the teaching learning process, (b) which of these individual difference variables interact significantly with different kinds of visualization used to complement oral/printed instruction, and (c) what is the extent of the range within specific individual difference variables that are accommodated by the use of specific types of visualization (Dwyer, 1978).
Once one can describe what makes a particular visual successful, it can be applied to the design to enhance visuals. In instruction, an image may be studied for a long time by the viewer and still not be useful (Lantz, 2000). Therefore, it is essential to identify the indicators of quality visual-based learning materials for technology education curricula and other
Visual Based Learning Material for Technology 73
K-12 instruction. Moreover, it is important to validate these indicators through involvement of educational members in the field of visual learning and technology education. These include technology education experts who have knowledge related to visual learning and practical experience, are involved in the creation of related materials, are a useful source of information to develop and validate the indicators of visual-based learning materials for technology education.
Research Questions and Hypotheses
The major emphasis of this study involved determining
quality indicators of visual-based learning material in technology education for grades 7-12 to transmit information effectively, and also quality indicators of the learner’s characteristics to be exposed to such material. To achieve this task two research questions were proposed dealing with visual-based learning material:
1. What indicators must visual-based learning material in technology education for grades 7-12 have to be effective in transmitting information?
2. What are the indicators of the learner’s characteristics that impact the selection of visual-based learning material in technology education for grades 7-12?
From these research questions, four hypotheses were created. The null and alternative hypotheses were:
H1: The median of the middle school population for each quality indicator for visual based learning material in technology education for grades 7-12 equals the median of the high school population for each quality indicator for visual-based learning material in technology education for grades 7-12. H0: Θ1 = Θ2.

74 JOURNAL OF INDUSTRIAL TEACHER EDUCATION
The alternative hypothesis for this test was: With respect to at least one of the inequalities, the median of the middle school population for each quality indicator for visual-based learning material in technology education for grades 7-12 is greater than the median of the high school population for each quality indicator for visual-based learning material in technology education for grades 7-12. H0: Θ1 < > Θ2. The null hypothesis for this test was:
H2: The median of the middle school population for each quality indicator for visual-based learning material in technology education for grades 7-12 equals the median of the high school population for each quality indicator for visual-based learning material in technology education for grades 7-12. H0: Θ1 = Θ2. The alternative hypothesis for this test was:
With respect to at least one of the inequalities, the median of the middle school population for each quality indicator for visual-based learning material in technology education for grades 7-12 is greater or less than the median of the high school population for each quality indicator for visual-based learning material in technology education for grades 7-12. H0: Θ1 > Θ2 or H0: Θ1 < Θ2
H3: In the underlining population the sample represents the correlation between the ranks of subjects on middle school responses and high school responses equal some value higher than 0. H0: ρs > 0
Visual Based Learning Material for Technology 75
The alternative hypothesis for this test was: In the underlining population the sample represents the
correlation between the ranks of subjects on middle school responses and high school responses equals some value lower or equal to 0. H0: ρs ≤ 0 The null hypothesis for this test was:
H4: The median of the middle school population for each quality indicator for visual based learning material in technology education for grades 7-12 equals the median of the high school population for each quality indicator for visual-based learning material in technology education for grades 7-12. H0: Θ1 = Θ2. The alternative hypothesis for this test was:
With respect to at least one of the inequalities, the median of the middle school population for each quality indicator for visual-based learning material in technology education for grades 7-12 is greater than or less than the median of the high school population for each quality indicator for visual-based learning material in technology education for grades 7-12. H0: Θ1 > Θ2 or H0: Θ1 < Θ2
Research Methodology
The Delphi technique for achieving consensus among
experts was determined to be the best method for the purpose of this study. Studies comparing the Delphi’s results with other methods confirmed the effectiveness of the method related to generating ideas and the use of participants’ time (Ulschak, 1983). Lang (1998) described the Delphi method as
76 JOURNAL OF INDUSTRIAL TEACHER EDUCATION
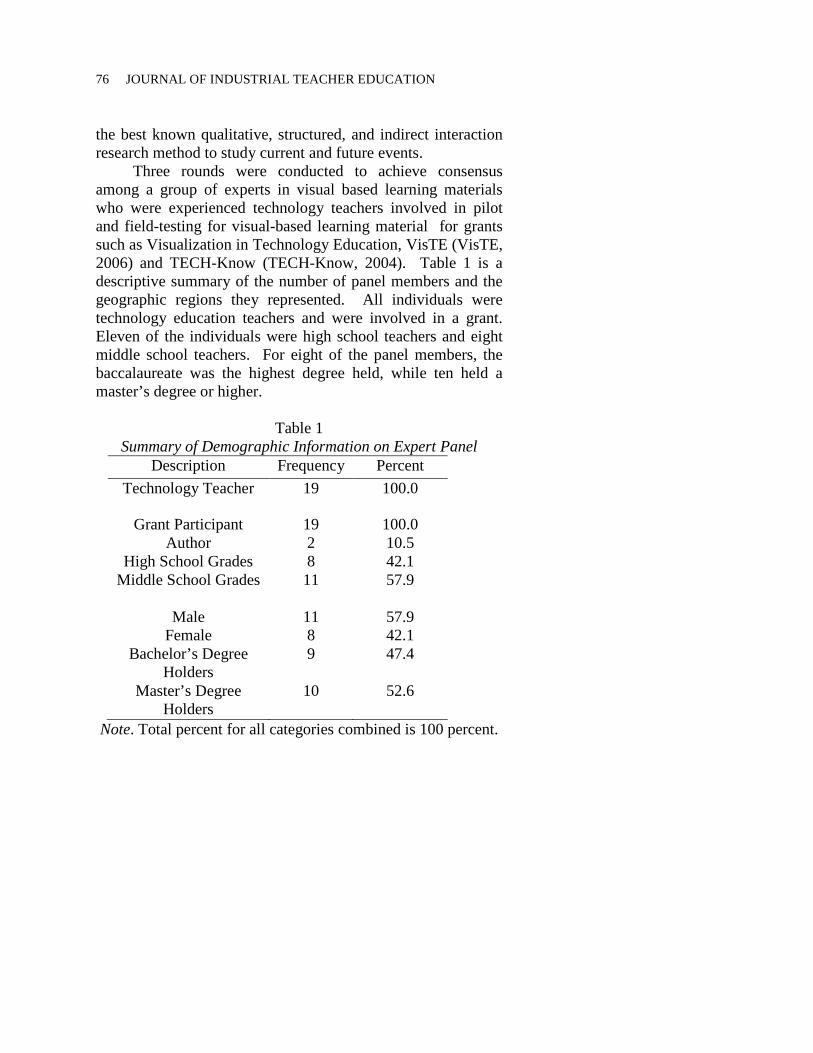
the best known qualitative, structured, and indirect interaction research method to study current and future events. Three rounds were conducted to achieve consensus among a group of experts in visual based learning materials who were experienced technology teachers involved in pilot and field-testing for visual-based learning material for grants such as Visualization in Technology Education, VisTE (VisTE, 2006) and TECH-Know (TECH-Know, 2004). Table 1 is a descriptive summary of the number of panel members and the geographic regions they represented. All individuals were technology education teachers and were involved in a grant. Eleven of the individuals were high school teachers and eight middle school teachers. For eight of the panel members, the baccalaureate was the highest degree held, while ten held a master’s degree or higher.
Table 1
Summary of Demographic Information on Expert Panel Description Frequency Percent
Technology Teacher 19 100.0
Grant Participant 19 100.0 Author 2 10.5
High School Grades 8 42.1 Middle School Grades 11 57.9
Male 11 57.9 Female 8 42.1
Bachelor’s Degree Holders
9 47.4
Master’s Degree Holders
10 52.6
Note. Total percent for all categories combined is 100 percent.
Visual Based Learning Material for Technology 77
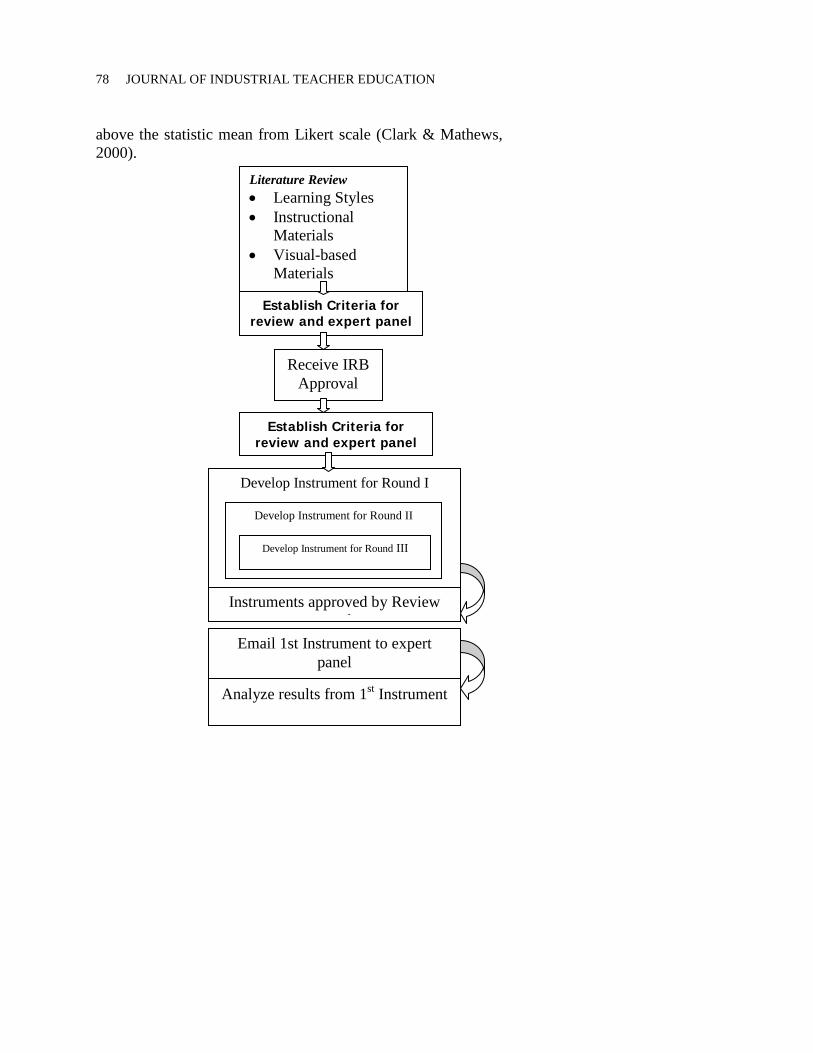
Quality indicators included in Round I instrument of this modified Delphi were derived through literature review. Examples of quality indicators were established and placed in a survey instrument. Once a review panel approved the instrument, the expert panel was given access to the instrument on the web through a username and password. See Figure 1. An email was sent to panel members after two weeks as a reminder to complete and return the instrument. Results from Round I were tabulated, with like indicators collapsed together.
Round I of the modified Delphi method began with the development of a questionnaire to identify the quality indicators of visual-based learning material in grades 7-12 for technology education programs. The questionnaire gave directions and definitions that were critical to the participant as well as to the study so that every panel member was using the correct format when completing the questionnaire. It also used the same definitions of key terms used in the instrument. Examples of related indicators from the review of literature were presented to aid the participants in format for typing a new indicator or modifying an existing one, as well as to start the brainstorming process.
Participants remained anonymous to each other, avoiding influences of reputation, authority, or affiliation. This enabled panel members to change their opinions without losing face (Lantz, 2000). Round II of the modified Delphi method included the rating and ranking of indicators from Round I. The instrument was developed and sent to the review panel for verification. The indicators were placed in random order. This round consisted of rating each indicator from the previous round. Indicators with a mean of 3.01 or higher from a Likert scale of 1-5 were kept for the next round. Round III consisted of ranking the information gathered from Round II. Indicators kept from this round were those that ranked in the 50 percent
78 JOURNAL OF INDUSTRIAL TEACHER EDUCATION
above the statistic mean from Likert scale (Clark & Mathews, 2000).
Establish Criteria for review and expert panel
Develop Instrument for Round I
Develop Instrument for Round II
Develop Instrument for Round III
Instruments approved by Review l
Email 1st Instrument to expert panel
Analyze results from 1st Instrument
Establish Criteria for review and expert panel
Literature Review • Learning Styles • Instructional
Materials • Visual-based
Materials
Receive IRB Approval

Visual Based Learning Material for Technology 79
Figure1. Outline of Research
Findings
The major emphasis of the study involved determining
the indicators for visual-based learning material to be used in technology education for grades 7-12. These indicators must transmit information effectively and must be based on the characteristics of learners who will be exposed to such material. In the three modified Delphi rounds, a panel of experts in the field of technology education identified visual based quality indicators through a consensus process. The modified Delphi method used in this study validated the quality indicators through the use of consensus-drawing processes.
Modify 2nd Instrument
Email 2nd Instrument to expert panel
Analyze results from 2nd Instrument
Email 3rd Instrument to expert panel
Analyze results from 3rd round
Instruments approved by Review panel
Instruments approved by Review panel
Nonparametric Statistical tests: Kruskal-
Mann Whitney U
nonparametric test

80 JOURNAL OF INDUSTRIAL TEACHER EDUCATION
Stratification measures used for locating expert panel members helped ensure that the indicators represented consensus from across the United States. The statistical tests applied during the study validated that consensus was being achieved and thus consensus-gathering strategies used within the study were appropriate.
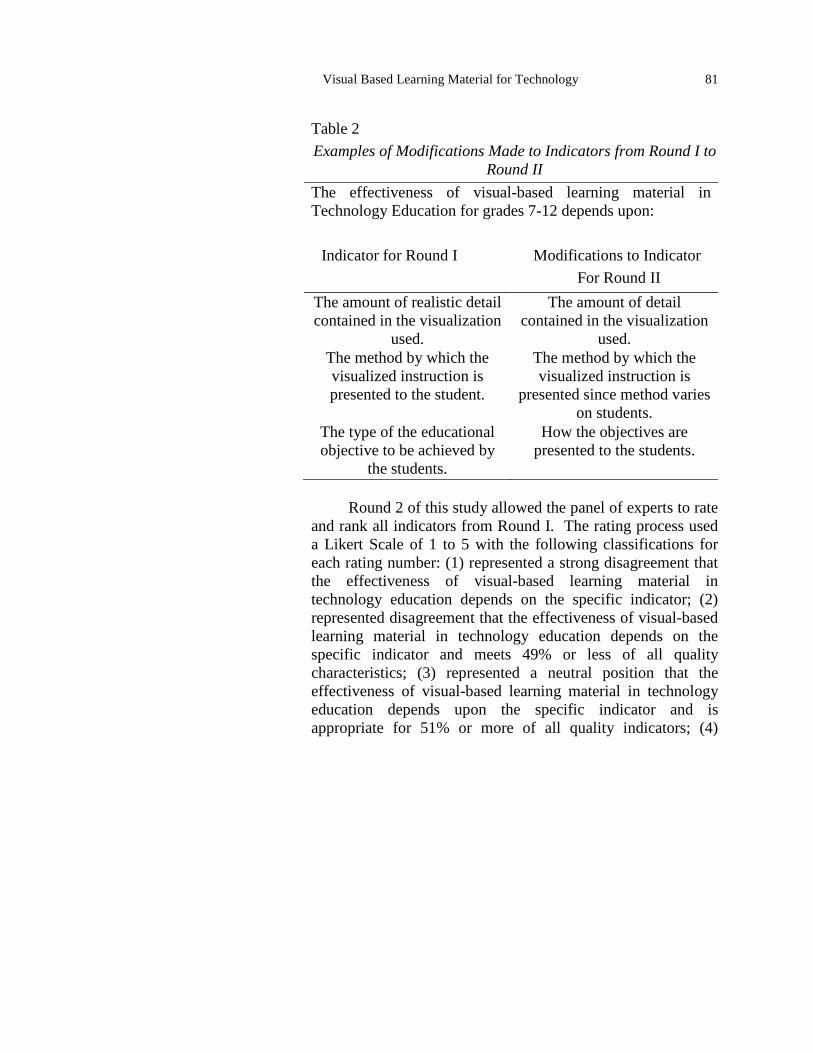
In Round I the majority of the indicators suggested by the expert panel members was alike in meaning, but defined with different wording. The study started 7 indicators and the total number of new indicators suggested by the expert panel members at the end of Round I was 12. Table 2 shows the example indicators modified by the researcher to meet the suggestions made by the expert panel. These modifications were approved by the review committee prior to being accessed by the panel of experts in Round II. The panel members could keep or reject any example indicators given to them in this round or modify the example indicators. The majority of the panel members, 90.5 percent, completed and returned the questionnaire. The majority of respondents, over 99.0 percent, suggested keeping most of the example indicators.
Visual Based Learning Material for Technology 81
Table 2 Examples of Modifications Made to Indicators from Round I to
Round II The effectiveness of visual-based learning material in Technology Education for grades 7-12 depends upon:
Indicator for Round I Modifications to Indicator
For Round II The amount of realistic detail contained in the visualization
used.
The amount of detail contained in the visualization
used. The method by which the visualized instruction is presented to the student.
The method by which the visualized instruction is
presented since method varies on students.
The type of the educational objective to be achieved by
the students.
How the objectives are presented to the students.
Round 2 of this study allowed the panel of experts to rate and rank all indicators from Round I. The rating process used a Likert Scale of 1 to 5 with the following classifications for each rating number: (1) represented a strong disagreement that the effectiveness of visual-based learning material in technology education depends on the specific indicator; (2) represented disagreement that the effectiveness of visual-based learning material in technology education depends on the specific indicator and meets 49% or less of all quality characteristics; (3) represented a neutral position that the effectiveness of visual-based learning material in technology education depends upon the specific indicator and is appropriate for 51% or more of all quality indicators; (4)

82 JOURNAL OF INDUSTRIAL TEACHER EDUCATION
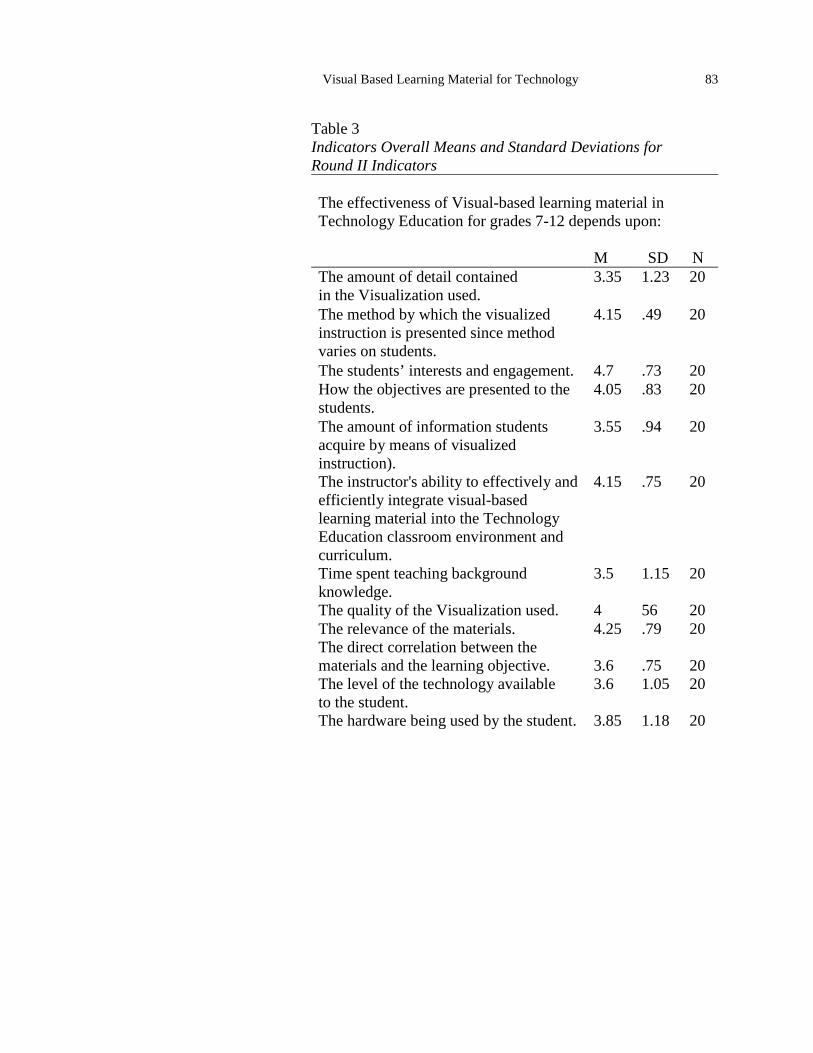
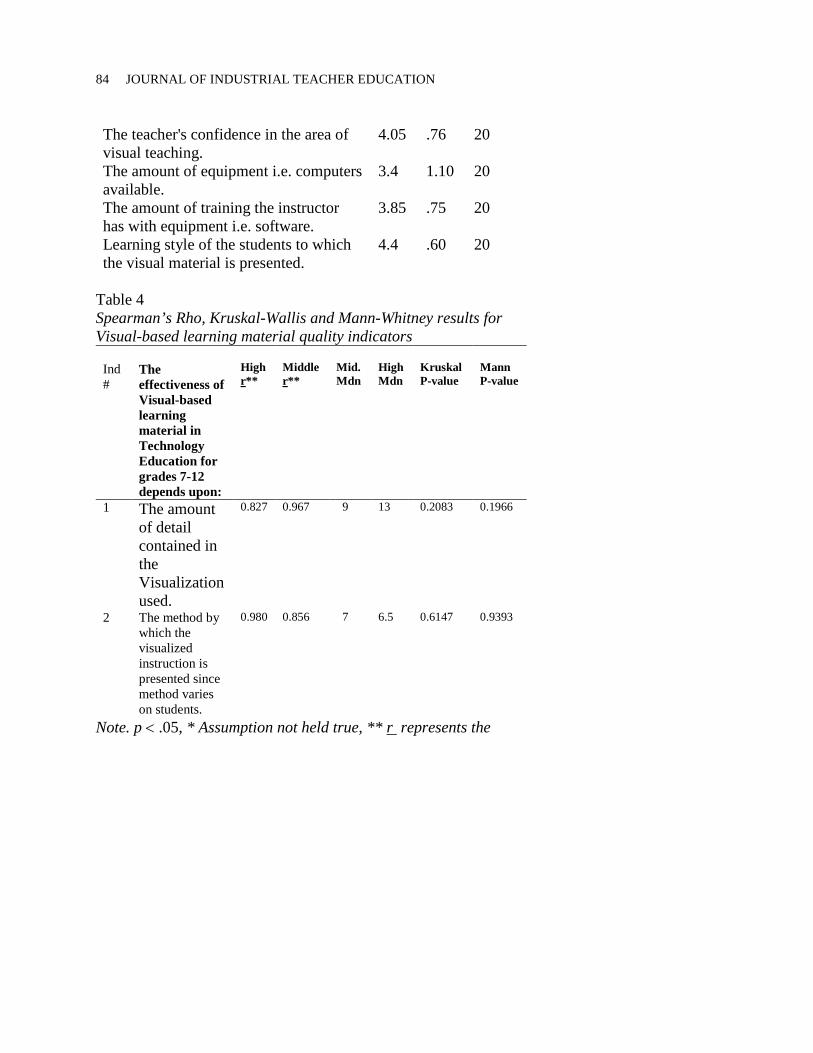
represented an agreement that the effectiveness of visual-based learning material in technology education depends on the specific indicator and is appropriate for 75% or more of all quality indicators; and (5) represented a strong agreement that the effectiveness of visual-based learning material in technology education depends on the specific indicator and is appropriate for 100% of all quality indicators. Once all data were collected, statistical means and standard deviations were calculated for each indicator. The indicators with a mean of 3.01 or higher were kept for the next round. The mean of 3.01 indicated that the modified Delphi process was starting to reach consensus by keeping only those indicators that had a rating at or above the statistical median of 3.01 for the rating scale of one to five. This assured the researcher that overall the indicators kept were appropriate for at least 51 percent of the visual-based learning materials in technology education for grades 7-12. Table 3 shows the indicators the expert panel members rated and the overall means and standard deviations for each category and indicators from round two of the modified Delphi method. The statistical tests included the non-parametric Kruskal-Wallis test to determine whether there was a significant difference between the middle school experts’ opinions and the high school experts’ opinions. The results showed no significant difference, which indicated well-written indicators, strong consensus, and agreement among experts. The Mann-Whitney U test (see Table 4) was employed to test a hypothesis of a design with two independent samples to determine if significant differences occurred between the medians of expert populations. The results showed few significant differences, which indicated strong consensus among experts.
Visual Based Learning Material for Technology 83
Table 3 Indicators Overall Means and Standard Deviations for Round II Indicators The effectiveness of Visual-based learning material in Technology Education for grades 7-12 depends upon: M SD N The amount of detail contained in the Visualization used.
3.35 1.23 20
The method by which the visualized instruction is presented since method varies on students.
4.15 .49 20
The students’ interests and engagement. 4.7 .73 20 How the objectives are presented to the students.
4.05 .83 20
The amount of information students acquire by means of visualized instruction).
3.55 .94 20
The instructor's ability to effectively and efficiently integrate visual-based learning material into the Technology Education classroom environment and curriculum.
4.15 .75 20
Time spent teaching background knowledge.
3.5 1.15 20
The quality of the Visualization used. 4 56 20 The relevance of the materials. The direct correlation between the materials and the learning objective.
4.25
.79 20
3.6 .75 20 The level of the technology available to the student.
3.6 1.05
20
The hardware being used by the student. 3.85 1.18 20
84 JOURNAL OF INDUSTRIAL TEACHER EDUCATION
The teacher's confidence in the area of visual teaching.
4.05 .76 20
The amount of equipment i.e. computers available.
3.4 1.10 20
The amount of training the instructor has with equipment i.e. software.
3.85 .75 20
Learning style of the students to which the visual material is presented.
4.4 .60 20
Table 4 Spearman’s Rho, Kruskal-Wallis and Mann-Whitney results for Visual-based learning material quality indicators
Ind#
The effectiveness of Visual-based learning material in Technology Education for grades 7-12 depends upon:
High r**
Middle r**
Mid. Mdn
High Mdn
Kruskal P-value
Mann P-value
1 The amount of detail contained in the Visualization used.
0.827 0.967 9 13 0.2083 0.1966
2 The method by which the visualized instruction is presented since method varies on students.
0.980 0.856 7 6.5 0.6147 0.9393
Note. p < .05, * Assumption not held true, ** r represents the
Visual Based Learning Material for Technology 85
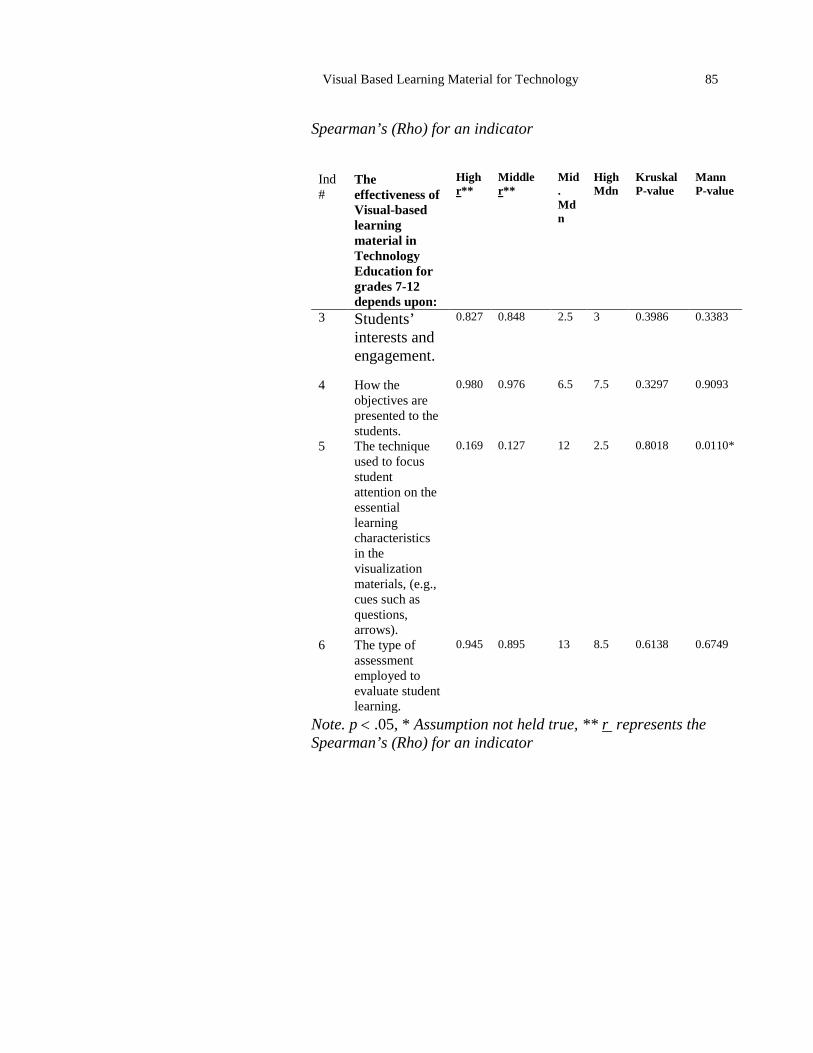
Spearman’s (Rho) for an indicator
Ind#
The effectiveness of Visual-based learning material in Technology Education for grades 7-12 depends upon:
High r**
Middle r**
Mid. Mdn
High Mdn
Kruskal P-value
Mann P-value
3 Students’ interests and engagement.
0.827 0.848 2.5 3 0.3986 0.3383
4 How the objectives are presented to the students.
0.980 0.976 6.5 7.5 0.3297 0.9093
5 The technique used to focus student attention on the essential learning characteristics in the visualization materials, (e.g., cues such as questions, arrows).
0.169
0.127
12 2.5 0.8018 0.0110*
6 The type of assessment employed to evaluate student learning.
0.945 0.895 13 8.5 0.6138 0.6749
Note. p < .05, * Assumption not held true, ** r represents the Spearman’s (Rho) for an indicator
86 JOURNAL OF INDUSTRIAL TEACHER EDUCATION
Ind#
The effectiveness of Visual-based learning material in Technology Education for grades 7-12 depends upon:
High r**
Middle r**
Mid. Mdn
High Mdn
Kruskal P-value
Mann P-value
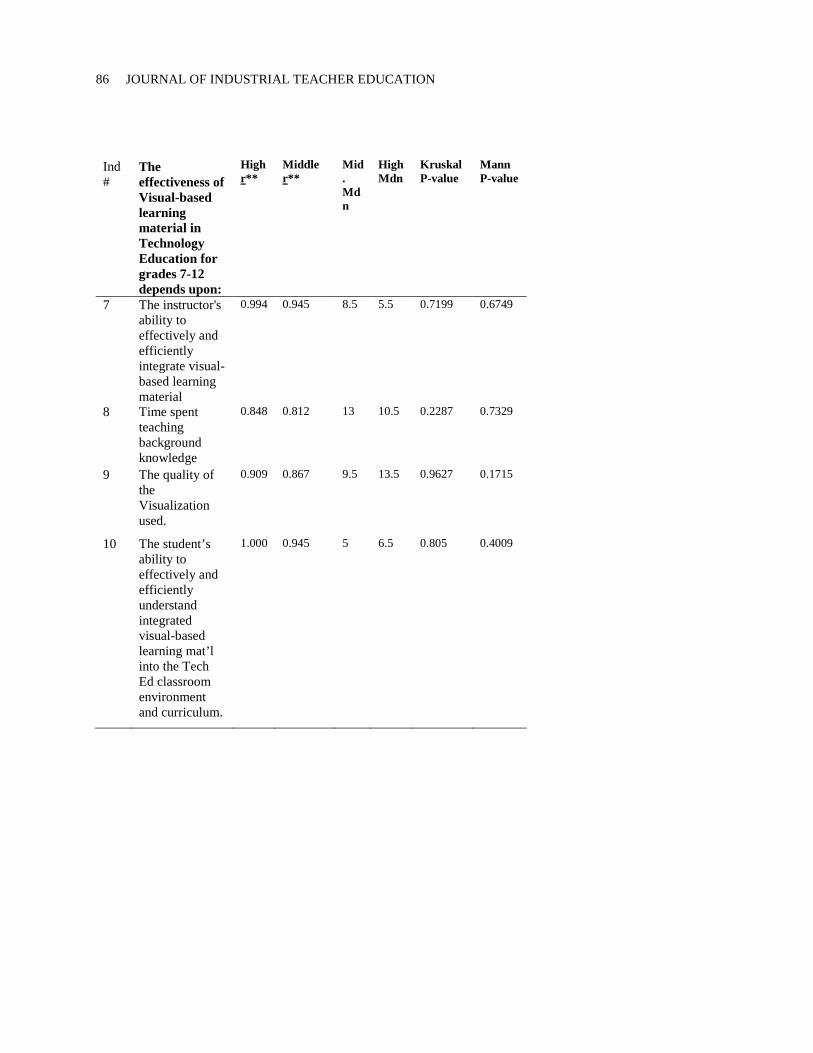
7 The instructor's ability to effectively and efficiently integrate visual-based learning material
0.994 0.945 8.5 5.5 0.7199 0.6749
8 Time spent teaching background knowledge
0.848 0.812 13 10.5 0.2287 0.7329
9 The quality of the Visualization used.
0.909 0.867 9.5 13.5 0.9627 0.1715
10 The student’s ability to effectively and efficiently understand integrated visual-based learning mat’l into the Tech Ed classroom environment and curriculum.
1.000 0.945 5 6.5 0.805 0.4009
Visual Based Learning Material for Technology 87
Note. p < .05, * Assumption not held true, ** r represents the Spearman’s (Rho) for an indicator
Ind#
The effectiveness of Visual-based learning material in Technology Education for grades 7-12 depends upon:
High r**
Middle r**
Mid. Mdn
High Mdn
Kruskal P-value
Mann P-value
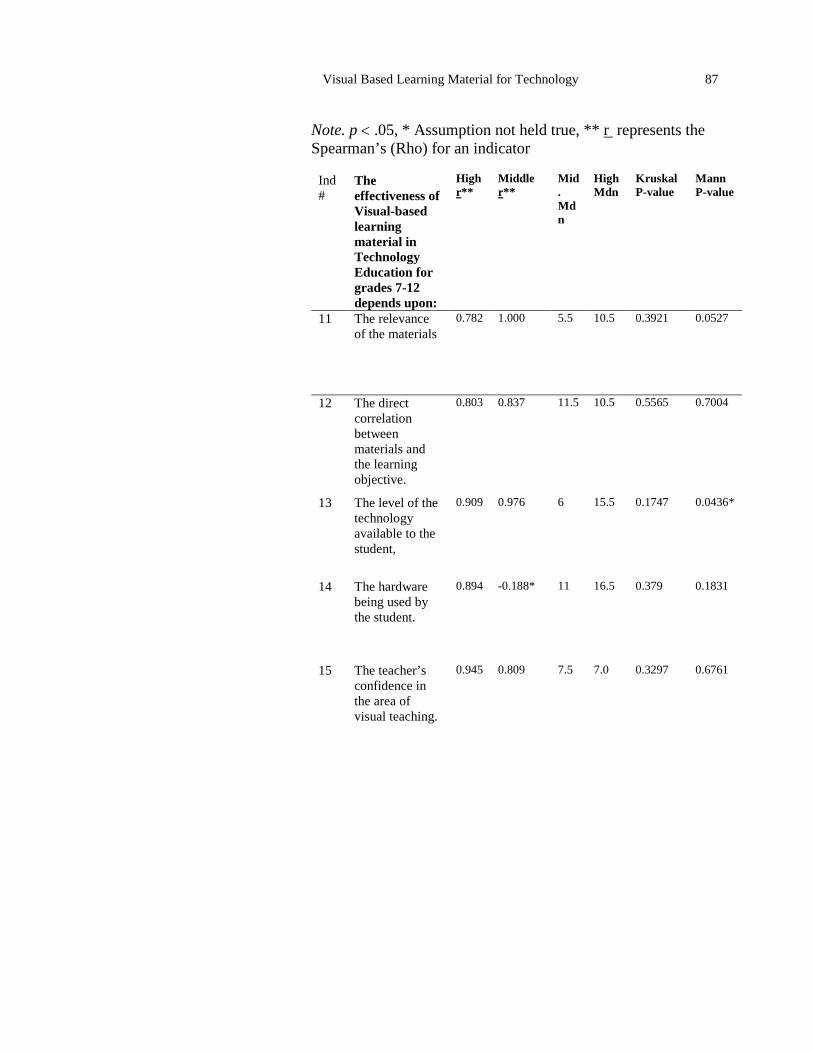
11 The relevance of the materials
0.782 1.000 5.5 10.5 0.3921 0.0527
12 The direct correlation between materials and the learning objective.
0.803 0.837 11.5 10.5 0.5565 0.7004
13 The level of the technology available to the student,
0.909 0.976 6 15.5 0.1747 0.0436*
14 The hardware being used by the student.
0.894 -0.188* 11 16.5 0.379 0.1831
15 The teacher’s confidence in the area of visual teaching.
0.945 0.809 7.5 7.0 0.3297 0.6761
88 JOURNAL OF INDUSTRIAL TEACHER EDUCATION
Note. p < .05, * Assumption not held true, ** r represents the Spearman’s (Rho) for an indicator
Ind#
The effectiveness of Visual-based learning material in Technology Education for grades 7-12 depends upon:
High r**
Middle r**
Mid. Mdn
High Mdn
Kruskal P-value
Mann P-value
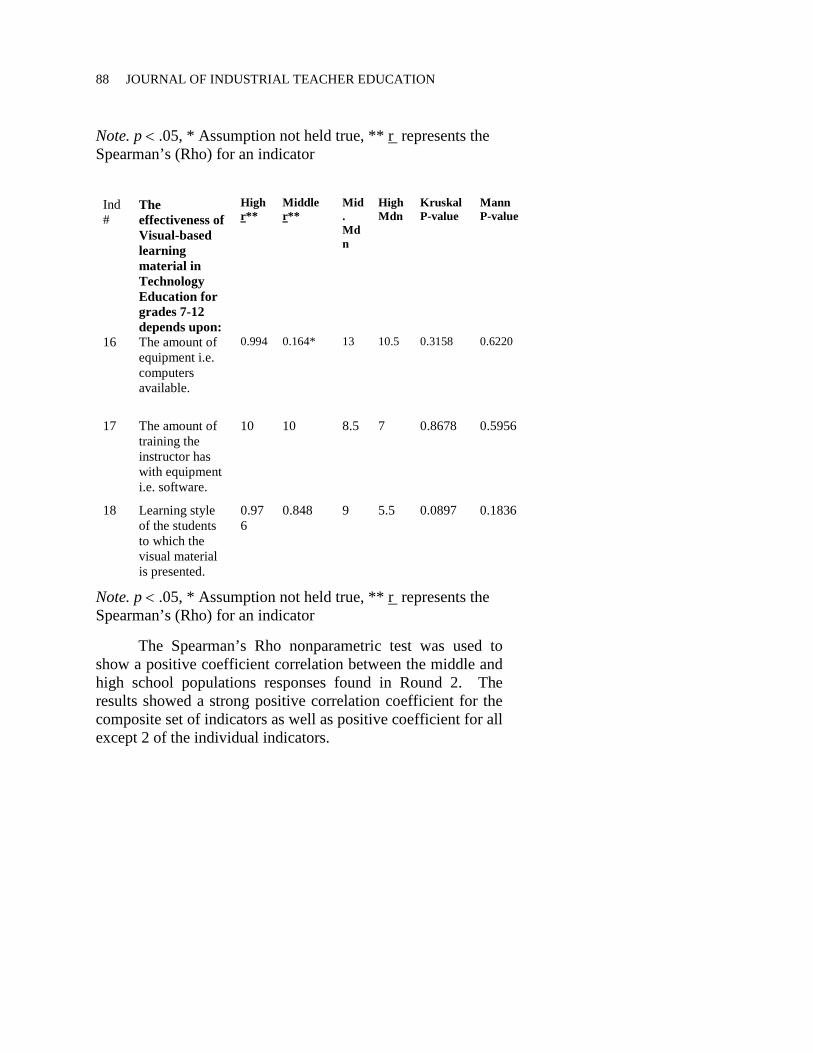
16 The amount of equipment i.e. computers available.
0.994 0.164* 13 10.5 0.3158 0.6220
17 The amount of training the instructor has with equipment i.e. software.
10 10 8.5 7 0.8678 0.5956
18 Learning style of the students to which the visual material is presented.
0.976
0.848 9 5.5 0.0897 0.1836
Note. p < .05, * Assumption not held true, ** r represents the Spearman’s (Rho) for an indicator The Spearman’s Rho nonparametric test was used to show a positive coefficient correlation between the middle and high school populations responses found in Round 2. The results showed a strong positive correlation coefficient for the composite set of indicators as well as positive coefficient for all except 2 of the individual indicators.
Visual Based Learning Material for Technology 89
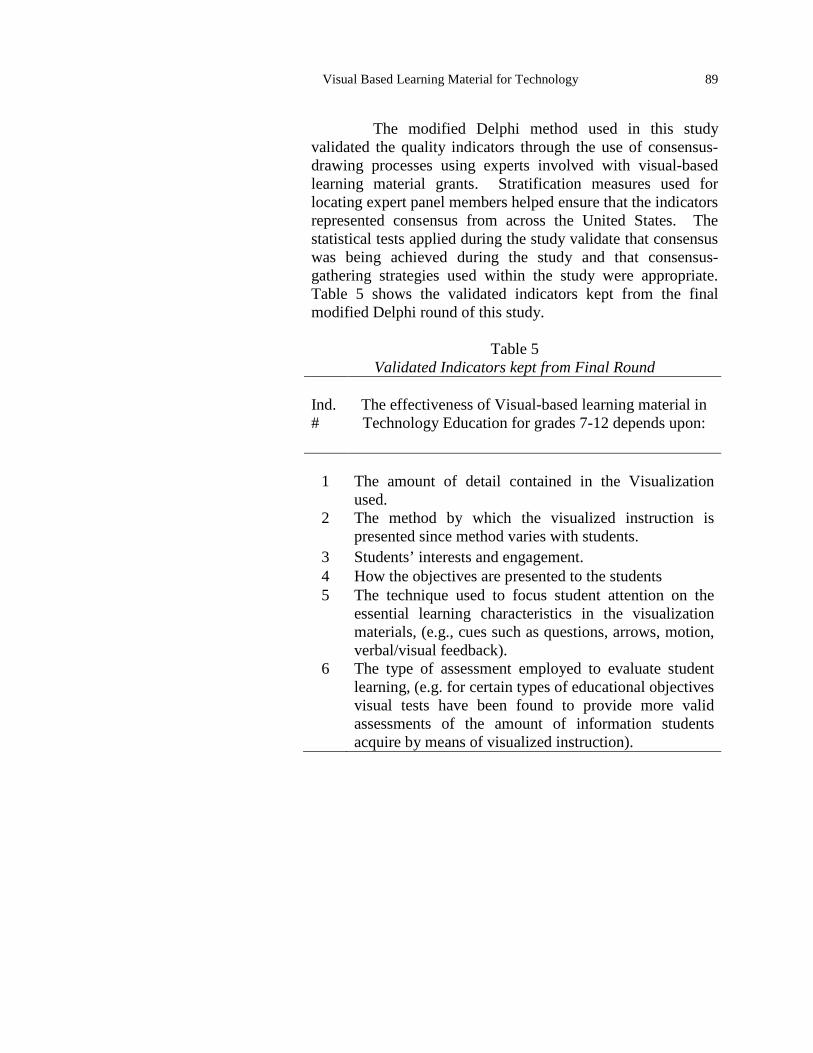
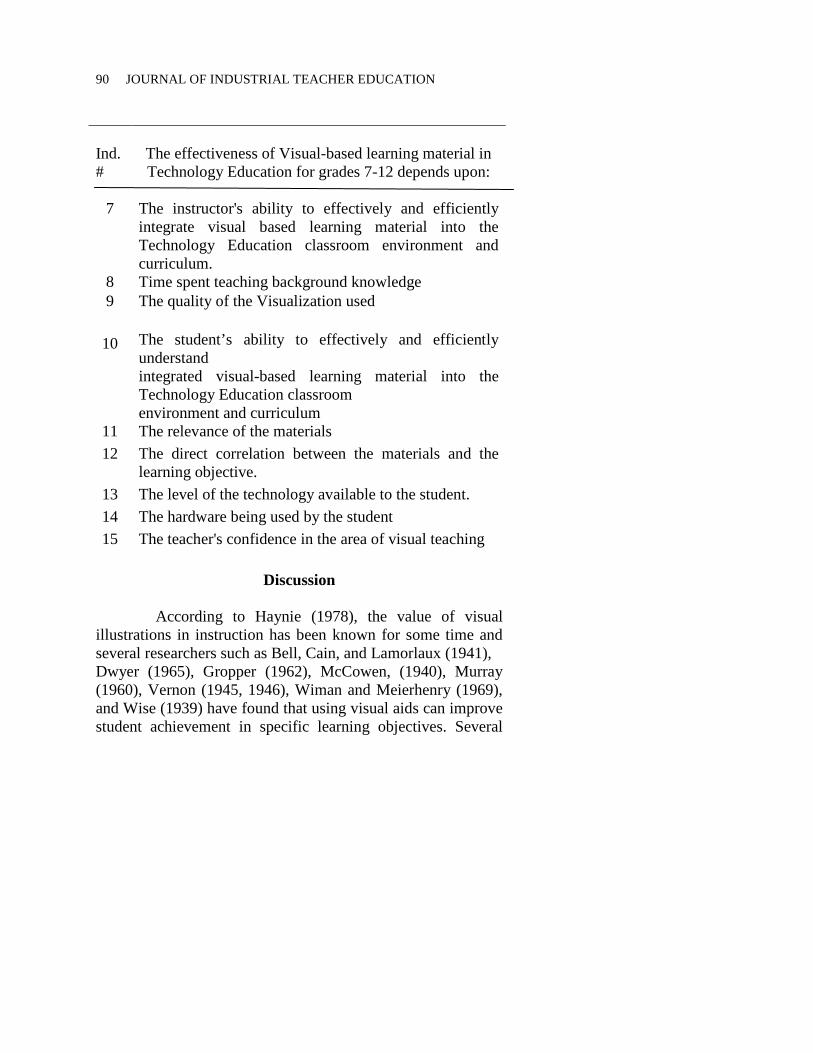
The modified Delphi method used in this study validated the quality indicators through the use of consensus-drawing processes using experts involved with visual-based learning material grants. Stratification measures used for locating expert panel members helped ensure that the indicators represented consensus from across the United States. The statistical tests applied during the study validate that consensus was being achieved during the study and that consensus-gathering strategies used within the study were appropriate. Table 5 shows the validated indicators kept from the final modified Delphi round of this study.
Table 5 Validated Indicators kept from Final Round
Ind. #
The effectiveness of Visual-based learning material in Technology Education for grades 7-12 depends upon:
1
The amount of detail contained in the Visualization used.
2 The method by which the visualized instruction is presented since method varies with students.
3 Students’ interests and engagement. 4 How the objectives are presented to the students 5 The technique used to focus student attention on the
essential learning characteristics in the visualization materials, (e.g., cues such as questions, arrows, motion, verbal/visual feedback).
6 The type of assessment employed to evaluate student learning, (e.g. for certain types of educational objectives visual tests have been found to provide more valid assessments of the amount of information students acquire by means of visualized instruction).
90 JOURNAL OF INDUSTRIAL TEACHER EDUCATION
Ind. #
The effectiveness of Visual-based learning material in Technology Education for grades 7-12 depends upon:
7 The instructor's ability to effectively and efficiently integrate visual based learning material into the Technology Education classroom environment and curriculum.
8 Time spent teaching background knowledge 9 The quality of the Visualization used
10 The student’s ability to effectively and efficiently understand integrated visual-based learning material into the Technology Education classroom environment and curriculum
11 The relevance of the materials 12 The direct correlation between the materials and the
learning objective. 13 The level of the technology available to the student. 14 The hardware being used by the student 15 The teacher's confidence in the area of visual teaching
Discussion
According to Haynie (1978), the value of visual illustrations in instruction has been known for some time and several researchers such as Bell, Cain, and Lamorlaux (1941), Dwyer (1965), Gropper (1962), McCowen, (1940), Murray (1960), Vernon (1945, 1946), Wiman and Meierhenry (1969), and Wise (1939) have found that using visual aids can improve student achievement in specific learning objectives. Several

Visual Based Learning Material for Technology 91
studies were conducted to compare the effectiveness of various media and methods. Haynie mentions that early studies of the type criticized by Lumsdaine and May (1965) include Brown (1928) which compared motion pictures to film slides and McCowen (1940), Murray (1960), and Vernon (1945) which compared the use of visuals to conventional methods of instruction.
Visualization has been identified as one of the most important skills related to engineering and technical graphics (Gillespie, 1995). “Spatial visualization skills are an important component of engineering because of their direct relationship to the graphical communication associated with design” (Devon et al., 1994, p. 4). Strong spatial visualization skills have been shown to correlate to success, achievement, and retention in engineering programs and success in mathematics (McGee, 1979). Vocational students have had difficulty translating 2-D schematics and blueprints into 3-D objects and converting 3-D objects into 2-D representations. This may be due to the lack of development of visualization skills (Rosenfeld, 1985). Visualization is particularly important to engineers because they must be able to solve problems involving abstract objects. They need to be able to communicate those solutions and understand the drawings or solutions of others (Mack, 1992).
The value of visualization and capabilities goes even beyond the ordinary. Having the list of the quality indicators (see Table 5), educators should be able to make informed decisions relating to the appropriateness of the material for specific classes. Knowing for example that the amount of detail in the visualization (Table 5, Indicator 1) has a significant impact toward learning; educators will choose material that includes those characteristics. Student learning styles vary, including aural, kinesthetic, visual, read and write; therefore, it will be expected that the method by which the
92 JOURNAL OF INDUSTRIAL TEACHER EDUCATION
visualized instruction is presented will make a significant difference. It was very interesting to see that one of the quality indicators (Table 5, Indicator 2) deals with that specific subject. It was also interesting to see that some of the indicators (Table 5, Indicators 5, 7 and 15) stressed the importance of the instructor’s background towards visual-based learning material teaching techniques, and how they contribute to better understanding. Factors such as background knowledge, technique used to focus student attention and ability to effectively and efficiently integrate the material are important. Despite recognition of the many benefits of visual-based learning material in grades 7-12 technology education, there are as of yet no rigorous, well tested, standards based-nationally distributed materials to support such instruction in American high schools (Wiebe, Clark, Ferzli and McBroom, 2003). Even as the nation’s high schools technology education classes have begun using sophisticated equipment and content that supports visual based material, many have remained narrowly focused on traditional applied technology areas. Having a set of indicators such as the ones identified in this study should enhance understanding and research related to visual-based learning. Teachers should now be able to make a better selection on what kind of visual-based material should be used. Now is the time for educators to step forward with the vision needed to strengthen visual-based material for technology education programs. The indicators presented in this study should be the starting point for discussions and change. Finally, the implications for future studies, recommendations, and suggestions are stated.
Visual Based Learning Material for Technology 93
Recommendations for Further Research
The findings of this research suggested many possible recommendations for further study in the areas of quality visual-based learning material in technology education programs for grades 7-12 and the use of the Delphi method as a research tool. The following recommendations are suggested for further study.
1. Additional research is needed to establish and assess quality indicators for visual-based learning material in technology education for all grades. This includes elementary, middle school, high school, and college level.
2. Additional studies should be conducted using other research methodologies to better understand the subject matter and aid in validating the information gathered.
3. This study should be replicated in five years to see if new quality indicators are identified for visual-based learning material in technology education programs for grades 7-12, and the information should be updated in the final quality indicators list for a more representative up-to-date assessment of visual-based learning materials.
4. Additional research is needed in developing an assessment strategy and model for assessing quality visual-based learning material in technology education programs for grades 7-12 at the national and international level.
5. Additional research to validate assessment tools that aid the selection process of quality visual-based learning material in technology education programs for grades 7-12 at both the national and international levels.
6. Additional research should be conducted to define the difference between visual data and information
94 JOURNAL OF INDUSTRIAL TEACHER EDUCATION
collected from studies such as this one could be beneficial to pre-engineering education and K-12 outreach through the expansion of research and knowledge in general. Visual-based learning courses have a great potential to become a significant part of K -12 pre-engineering education.
References Bell, R., Cain, L. F., & Lamorlaux, L. A. (1941). Motion
pictures in a modern curriculum -- a report on the use of films in the Santa Barbara Schools. Washington, D.C.: American Council of Education.
Branoff, T. (1998). Coordinate Axes and Mental Rotation Tasks: A Dual-Coding Approach. Paper presented at the meeting of The American Society for Engineering Education, Seattle, WA.
Chaomei, C. (2005). Top 10 unsolved information visualization problems. Philadelphia, PA: IEEE Computer Society.
Clark, C. A., & Mathews, B. (2000). Scientific and technical visualization: A new course offering that integrates mathematics, science and technology. Journal of Geometry and Graphics, 4(1), 89-98.
Clayton, M. J. (1997). Delphi: A technique to harness expert opinion for critical decision making tasks in
education. Educational Psychology, 17(4), 373-386. Delbecq, L., Van deVen, H, & Gustafson, H. (1975). Group
Techniques for ProgramxPlanning: A Guide to Nominal Group and Delphi Processes. New York: Scott-Foresman.
Visual Based Learning Material for Technology 95
Devon, R., Engel, R. S., Foster, R. J., Sathianathan, D., & Turner, G. F. (1994). The effects of solid modeling software on 3-D visualization skills. Engineering Design Graphics Journal, 58(2), 4-11.
Dwyer, F. M. (1965). An experimental evaluation of the relative effectiveness of selected visual illustrations in teaching science concepts to college freshmen. Unpublished doctoral dissertation, The Pennsylvania State University.
Dwyer, F. M. (1978). Strategies for improving visual learning. State College, PA.: Learning Services. Ernst, V. E., Clark, A. C. (2006). Supporting technological
literacy through the integration of engineering, mathematic, scientific, and technological concepts. Published proceedings of the American Society for Engineering Education Annual Conference and Exposition, Chicago, IL, Session 370.
Gropper, G. L. (1962). Studies in televised instruction: the role of visuals in verbal learning. Pittsburgh: Metropolitan Pittsburgh Educational Television Station and the American Institute for Research.
Gillespie, W. H. (1995). Using solid modeling tutorials to enhance visualization skills. Dissertation Abstracts International, 56, 11A. (UMI No. AAI9606359).
Haynie III, W. J. (1978). The instructional effectiveness of realism and enhancement of illustrations as related to visual continuum theories. The Pennsylvania State
University. Idowu, P., Brinton, G., Hartman, H., Neuhard, S., Abraham, R.,
& Boyer, E. (2006). Information visualization applied in presenting some fundamental power system topics. Published proceedings of the American Society for Engineering Education Annual Conference and Exposition, Chicago, IL, Session 1335.

96 JOURNAL OF INDUSTRIAL TEACHER EDUCATION
Lang, T. (1998). An overview of four futures methodologies. October 15, 2006, Retrieved from http://www.soc.hamaii.edu/~future/j7/LANG.html
Lantz, C. (2000). Visual Readability in Instructional Images. Visual Communications Journal, 8 (2), 19-27.
Mack, W. E. (1992). The Effect of Training in Computer- Aided Design on the Spatial Visualization Ability in Selected Gifted Adolescents. Dissertation Abstracts
International, 53, 03A. (UMI No. AAG9500831). McCowen, A. C. (1940). A controlled experiment in visual
education in general science. Educational Screen 19, 143-146.
Martino, J. (1993). Technological Forecasting for Decision Making. New York: Elsevier Science Publishing Company.
Mayer, M. A., & Booker, J.M. (1990). Eliciting and analyzing expert judgment: A practical guide. Washington, D.C.:
U. S. Nuclear Regulatory Commission. McCowen, A. C. (1940). A controlled experiment in visual
education in general science. Educational Screen, 19, 143-146.
McGee, M. G. (1979). Human spatial abilities: Psychometric studies and environmental, genetic, hormonal, and neurological influences. Psychological Bulletin, 86(5),
889-918. Murray, J. R. (1960). The comparative effectiveness of
condensed visualized methods in teaching operation of the VM tape recorder and Victor 16mm projector. Unpublished doctoral dissertation, The Pennsylvania State University.
Nesbary, Dale K. (2000). Survey Research and the World Wide Web. Boston: Allen and Bacon.
Visual Based Learning Material for Technology 97
Rosenfeld, D. W. (1985). Spatial relations ability skill training: The effect of a classroom exercise upon the skill level of spatial visualization of selected vocational education high school students. Dissertation Abstracts International, 46, 06A. (UMI No. AAG8518151).
TECH-know. (2004). TECH-know Project. September 16, 2006, Retrieved from http://www.ncsu.edu/techknow/aboutproject.html
U. S. Department of Education. (n.d.). The Carl D. Perkins Vocational and Technical Education Act, Public Law
105-332. Retrieved April 17, 2003, from http://www.ed.gov/offices/OVAE/CTE/perkins.html
Ulschak, F. L. (1983). Human resource development: the theory and practice of need assessment. Reston, Virginia: Reston Publishing Company, Inc.
Vernon, M. D. (1945). Learning from graphical material. British Journal of Psychology 16, 145-158.
VisTE. (2005). About Viste. Retrieved September 16, 2006, from http://www.ncsu.edu/viste//aboutus.html
Virtual Endoscopy in the Aorta; Comparison between wireframe and 3D drawing. “Online image”. 16 Feb. 2010. Thomas Deschamps Mathematics Department Computational Research Division Lawrence Berkeley Laboratory <http:// math.lbl.gov/~deschamp >.
Wiebe, N. E., Clark, A. C., Petlick, J., & Ferzli, M. (2004). VisTE: Visualization for Technology Education: An outreach program for engineering graphics education. Published proceedings of the American Society for Engineering Education Annual Conference and Exposition, Salt Lake City, UT, Session 3138.
Wileman, E. R. (1993). Visual communicating. Englewood Cliffs, NJ: Educational Technology Publications.

98 JOURNAL OF INDUSTRIAL TEACHER EDUCATION
Wiman, R., & Meierhenry, W. (1969). Educational media; theory into practice. Colombus, Ohio: Charles Merrill Publishing Co.
Wise, H. A. (1939). Motion pictures as an aid in teaching American History. New Haven, Connecticut: Yale University Press.