identification of hazardous road locations on the basis of ... · ictct hasselt 2012 niels...
TRANSCRIPT

Niels Agerholm, Traffic Research Group, Aalborg University Nr. 1 of 37ICTCT Hasselt 2012
Identification of Hazardous Road Locations on the basis of Floating Car Data
Niels AgerholmAssistant [email protected]

Niels Agerholm, Traffic Research Group, Aalborg University Nr. 2 of 37ICTCT Hasselt 2012
Agenda
• Brief intro to Hazardous Road Locations • The Method briefly• Floating Car Data• Scientific background• Data sources• First results• Next step

Niels Agerholm, Traffic Research Group, Aalborg University Nr. 3 of 37ICTCT Hasselt 2012
Hazardous Road Location: a definition
• Hazardous Road Location (HRL) is also known as Black Spot
A location which is more accident-prone than it it should be expected due to traffic level, road furniture and road design.

Niels Agerholm, Traffic Research Group, Aalborg University Nr. 4 of 37ICTCT Hasselt 2012
Hazardous Road Location: a definition
• Based on police-reported accidents• 3-5 years periods normally• Challenges:
• Few accidents are reported
• Biased reporting (soft road users under represented)• Significant black figure
• Black figure is growing (at least in Denmark)• <14% of the injury accidents are reported (2007)
• HRL identification is highly uncertain
Niels Agerholm, Traffic Research Group, Aalborg University Nr. 5 of 37ICTCT Hasselt 2012
Hazardous Road Location: a definition
• Hazardous Road Location (HRL) is also known as Black Spot
A location which is more accident-prone than it it should be expected due to traffic level, road furniture and road design.

Niels Agerholm, Traffic Research Group, Aalborg University Nr. 6 of 37ICTCT Hasselt 2012
The Method briefly
• In principle it is an area-based conflict study technique• Based on Floating Car Data (FCD)• The idea is that HRLs induce more abrupt hard decelerations
than else• Too many decelerations in one location indicates a HRL• Small scale studies indicate that the jerk gives a more clear
pattern (the derived of the deceleration)• A Forward-looking approach (don’t wait until the accidents
appear)• Hence required for Vision Zero

Niels Agerholm, Traffic Research Group, Aalborg University Nr. 7 of 37ICTCT Hasselt 2012
In principle it is an area-based conflict study technique
Accidents�Serious�Jerks�
Moderate�Jerks�
Normal�driving�
Fatal�accidents�
Injury�accidents�
Inspired by Svensson & Hydén 2006

Niels Agerholm, Traffic Research Group, Aalborg University Nr. 8 of 37ICTCT Hasselt 2012
Conflict indicator?
• Avoidance can be made in three ways:
• Decelerate• Accelerate• Sideways
• Decelerations (and jerks) are selected:
• Intuitively• Swerving data might be difficult to
distinguish from quick turns (in an analytic perspective)
• Support from literature: 72-98% of all accident avoidance activities (Horst 1984, Hydén 1987, Hantula 1994, Nygård 1999)

Niels Agerholm, Traffic Research Group, Aalborg University Nr. 9 of 37ICTCT Hasselt 2012
Floating Car Data
• Data from vehicles carrying out their ‘normal’ purpose on the road network
• Location can be detected by GPS or/and GPRS network (mobile phone network)
• Data can be collected by:• On board units (special developed for e.g. research)• Smartphones
• Navigation units• Units made for fleet management
• Etc.

Niels Agerholm, Traffic Research Group, Aalborg University Nr. 10 of 37ICTCT Hasselt 2012
Data example

Niels Agerholm, Traffic Research Group, Aalborg University Nr. 11 of 37ICTCT Hasselt 2012
Decelerations and jerks (theoretical connection)
Speed Acceleration Jerk
v1
v2 v2 v1
v3 v3 v2 (v3 v2) (v2 v1)
v4 v4 v3 (v4 v3) (v3 v2)
v5 v5 v4 (v5 v4) (v4 v3)
Speed Acceleration Jerk
m/s m/s^2 m/s^3
12
12 0
10 2 2
6 4 2
7 1 5

Niels Agerholm, Traffic Research Group, Aalborg University Nr. 12 of 37ICTCT Hasselt 2012
Speed, Decelerations, and Jerks

Niels Agerholm, Traffic Research Group, Aalborg University Nr. 13 of 37ICTCT Hasselt 2012
Speed, Decelerations, and Jerks

Niels Agerholm, Traffic Research Group, Aalborg University Nr. 14 of 37ICTCT Hasselt 2012
Scientific background
• (Salusjärvi 1981)• Nygård (1999)• Svendsen et al. (2008)• (Bagdadi & Várhelyi (2011))
Niels Agerholm, Traffic Research Group, Aalborg University Nr. 15 of 37ICTCT Hasselt 2012
Salusjärvi: on society level
• Finland 1981• Studied the association between speed variation and accident
risk• Based on a number of Finnish experiments with speed limits in
the period 1962 to 1978• When average speed increases the speed variation increases
significant• The higher speed variation the more serious accidents

Niels Agerholm, Traffic Research Group, Aalborg University Nr. 16 of 37ICTCT Hasselt 2012
Nygård
• Finland 1999• To find serious conflicts on the basis of FCD• 70 drivers• Each drove a trip of 50 km with GPS registration and a trained
conflict observer in the car• Compared the size of decelerations and jerks with the
observations of conflicts• Found that jerks gave more clear results than decelerations• Found that serious conflicts resulted in jerks that differed
significant from jerks in case of voluntary braking

Niels Agerholm, Traffic Research Group, Aalborg University Nr. 17 of 37ICTCT Hasselt 2012
Svendsen et al.
• Denmark 2008• Data from the Danish ISA trial Pay As You Speed• Tested the HRL identification on a small scale• Supported Nygård’s jerk-based approach• 94 drivers, 1,097 jerks, and found 12 locations with 4 jerks• Used (relatively) low frequency data (1 Hz)• He also found that the frequency of data affected the threshold
values markedly

Niels Agerholm, Traffic Research Group, Aalborg University Nr. 18 of 37ICTCT Hasselt 2012
(Bagdadi & Várhelyi)
• Sweden 2011• Based on FCD from the ISA trial in Lund (1999-2001)• Data from 166 cars included• Questionnaire data (among others about accident data)• Found a connection between the number and seriousness of
jerks and the the accident risk• Connections from jerks to risk, but no connection to locations!

Niels Agerholm, Traffic Research Group, Aalborg University Nr. 19 of 37ICTCT Hasselt 2012
Data sources (and results)
• Pay As You Speed (PAYS)• ITS Platform• TAC Safecar project (Melbourne)

Niels Agerholm, Traffic Research Group, Aalborg University Nr. 20 of 37ICTCT Hasselt 2012
Pay As You Speed (PAYS)
• North Jutland• Intelligent Speed Adaptation• Informative, warning and recording ISA +
incentives (up to 30% discount on insurance rate)
• Field trial April 2006 to January 2009• 153 18 – 70-years-old car owners• 12 to 32 months• To test if economic incentive in
combination with ISA can reduce the participating drivers’ speeding
Niels Agerholm, Traffic Research Group, Aalborg University Nr. 21 of 37ICTCT Hasselt 2012
Total FCD from PAYS
• 153 vehicles• Distance driven: 2.8 million km• 380 million records• 1 Hz• No acceleration data

Niels Agerholm, Traffic Research Group, Aalborg University Nr. 22 of 37ICTCT Hasselt 2012
Individual threshold
• Each driver had an individual threshold for jerks
• Jerks |>| the threshold were supposed to be included
• 93drivers included• 9,500 hours• 1,097 jerks included• 1 jerk/8:40 hours
One driver: distribution of jerks and threshold level

Niels Agerholm, Traffic Research Group, Aalborg University Nr. 23 of 37ICTCT Hasselt 2012 Potential HRL
Niels Agerholm, Traffic Research Group, Aalborg University Nr. 24 of 37ICTCT Hasselt 2012
ITS Platform
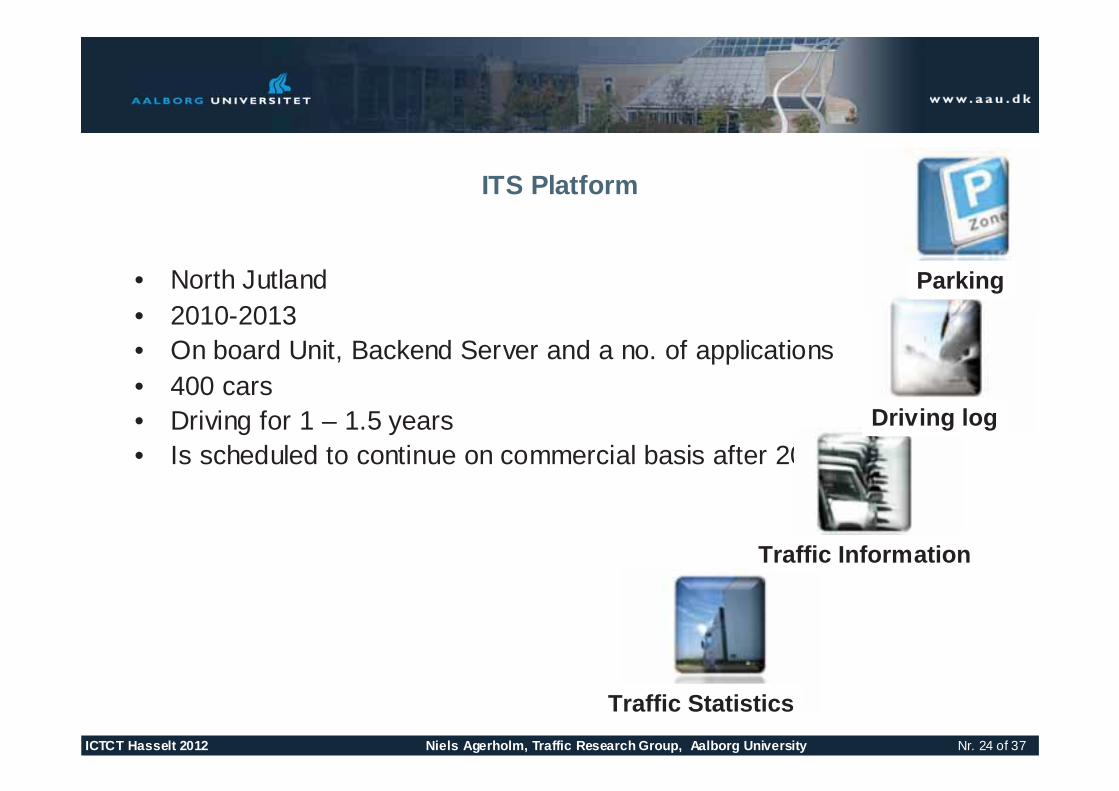
• North Jutland• 2010-2013• On board Unit, Backend Server and a no. of applications• 400 cars• Driving for 1 – 1.5 years• Is scheduled to continue on commercial basis after 2013
Parking
Driving log
Traffic Information
Traffic Statistics

Niels Agerholm, Traffic Research Group, Aalborg University Nr. 25 of 37ICTCT Hasselt 2012
FCD from ITS Platform
• 10 Hz• 500 cars• Acceleration data included• 8-12 billion records on
accelerations are expected• Simplification will be used
Accidents�Serious�Jerks�
Moderate�Jerks�
Normal�driving�
Fatal�accidents�
Injury�accidents�
Niels Agerholm, Traffic Research Group, Aalborg University Nr. 26 of 37ICTCT Hasselt 2012
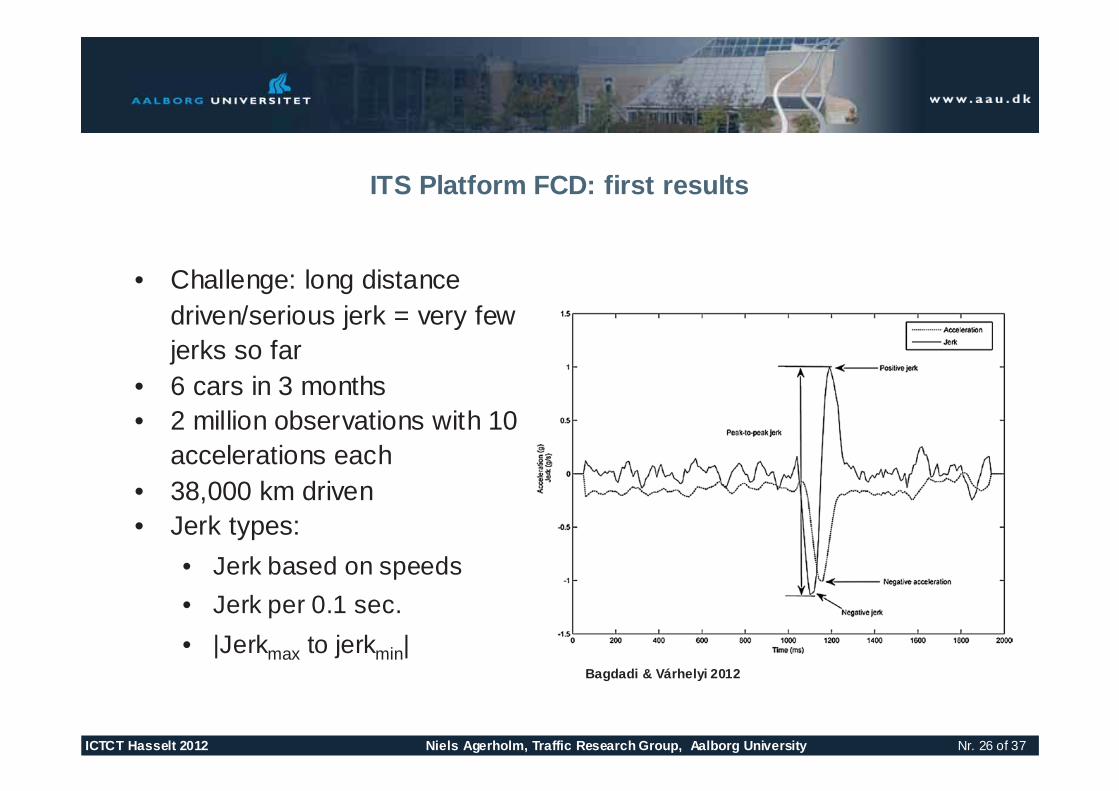
ITS Platform FCD: first results
• Challenge: long distance driven/serious jerk = very few jerks so far
• 6 cars in 3 months• 2 million observations with 10
accelerations each• 38,000 km driven• Jerk types:
• Jerk based on speeds• Jerk per 0.1 sec.• |Jerkmax to jerkmin|
Bagdadi & Várhelyi 2012

Niels Agerholm, Traffic Research Group, Aalborg University Nr. 27 of 37ICTCT Hasselt 2012
Eksamples of reliable jerks
• Significant jerk before AND after a deceleration• Delays compared to change in speed

Niels Agerholm, Traffic Research Group, Aalborg University Nr. 28 of 37ICTCT Hasselt 2012
Eksamples of reliable jerks
• Significant jerk before AND after a deceleration• Delays compared to change in speed

Niels Agerholm, Traffic Research Group, Aalborg University Nr. 29 of 37ICTCT Hasselt 2012
Eksamples of reliable jerks
• Significant jerk before AND after a deceleration• Delays compared to change in speed

Niels Agerholm, Traffic Research Group, Aalborg University Nr. 30 of 37ICTCT Hasselt 2012
Pitfalls with FCD
• Speed bump

Niels Agerholm, Traffic Research Group, Aalborg University Nr. 31 of 37ICTCT Hasselt 2012
Pitfalls with FCD
• Bad GPS data• City Canyons
Niels Agerholm, Traffic Research Group, Aalborg University Nr. 32 of 37ICTCT Hasselt 2012
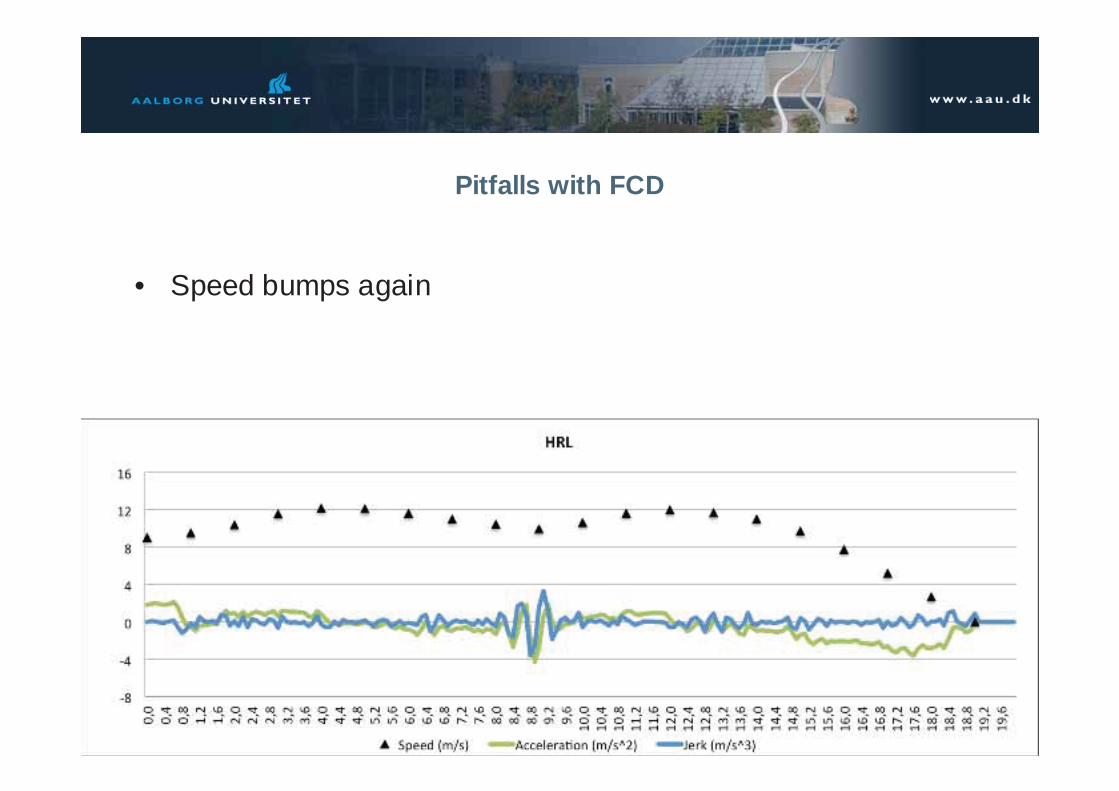
Pitfalls with FCD
• Speed bumps again
Niels Agerholm, Traffic Research Group, Aalborg University Nr. 33 of 37ICTCT Hasselt 2012
Identification procedure (November 2012)
• Significant differences |Jerkmax to jerkmin|• Unique size or individual size?
• Explicit reduction in speed• To avoid effects from vertical accelerations
• Bumps• Railway crossings• Bad road surface
• Speed before jerk > a threshold (4-5 m/s – has to be defined)• Start-up and stop activities can cause significant jerks

Niels Agerholm, Traffic Research Group, Aalborg University Nr. 34 of 37ICTCT Hasselt 2012
Next step
• Late 2012:• 6 months of driving from +50 cars
• Comparison of decelerations and jerks• Finding first HRL – hopefully
• Mid-2013:• Full-scale study
• Refind results• HRL identification
• Reporting

Niels Agerholm, Traffic Research Group, Aalborg University Nr. 35 of 37ICTCT Hasselt 2012
Summary
• Identification of HRL on the basis of FCD• Jerk seems to be the most reliable approach• Also info about the speed and change in speed is required• Few reliable jerks found so far• Large-scale data study will be initiated in late November 2012

Niels Agerholm, Traffic Research Group, Aalborg University Nr. 36 of 37ICTCT Hasselt 2012
Aalborg University and traffic safety research
Two research projects with different approaches to find HRLs:•Based on identification of jerks from FCD•Based on road characteristics
Accidents�Serious�Jerks�
Moderate�Jerks�
Normal�driving�
Fatal�accidents�
Injury�accidents�

Niels Agerholm, Traffic Research Group, Aalborg University Nr. 37 of 37ICTCT Hasselt 2012
Thank You
Niels AgerholmTraffic Research Group
Aalborg University+45 61 78 04 55