identification of animal movement patterns using tri-axial ... · 3wildlife conservation society,...
TRANSCRIPT
ENDANGERED SPECIES RESEARCHEndang Species Res
Vol. 10: 47–60doi: 10.3354/esr00084
Published online March 31, 2008
INTRODUCTION
An animal’s behaviour is a fundamental part of its bi-ology, being a manifestation of its response to the envi-ronment (which, if appropriate, will increase its fitness)as well as being connected to its physiological condition.This explains why the study of animal behaviour is sowidespread and complex. Although measures of behav-iour take many forms (e.g. Martin & Bateson 2007), be-haviour can be well documented by assessment of move-
ment, or the lack of it, which has been described by var-ious animal-attached sensors (see Cooke et al. 2004 forreview) including, recently, accelerometers (e.g. Yoda etal. 1999, Tanaka et al. 2001, Kato et al. 2006). Indeed,since accelerometers measure both animal orientationand the dynamics of movement (Yoda et al. 1999), ani-mal-attached accelerometers can provide data on the oc-currence of a wide range of behaviours in free-livingorganisms which cannot readily be observed (e.g. Watan-abe et al. 2005, Tsuda et al. 2006, Wilson et al. 2008).
© Inter-Research 2008 · www.int-res.com*Email: [email protected]
Identification of animal movement patterns usingtri-axial accelerometry
Emily L. C. Shepard1,*, Rory P. Wilson1, Flavio Quintana2, 3, Agustina Gómez Laich3,Nikolai Liebsch1, Diego A. Albareda4, Lewis G. Halsey5, Adrian Gleiss1,
David T. Morgan1, Andrew E. Myers6, Chris Newman7, David W. Macdonald7
1Biological Sciences, Institute of Environmental Sustainability, Swansea University, Swansea SA2 8PP, UK2Centro Nacional Patagónico (CENPAT)-CONICET, (9120) Puerto Madryn, Chubut, Argentina
3Wildlife Conservation Society, 2300 Southern Boulevard, New York, New York 10460, USA4Buenos Aires Zoo, Av. Sarmiento and Av. The Heras, Buenos Aires, Argentina
5School of Human and Life Sciences, Roehampton University, London SW15 4JD, UK6Large Pelagics Research Laboratory, University of New Hampshire, Durham, New Hampshire 03824, USA
7Wildlife Conservation Research Unit, University of Oxford, Tubney House, Abingdon OX13 5QL, UK
ABSTRACT: An animal’s behaviour is a response to its environment and physiological condition, andas such, gives vital clues as to its well-being, which is highly relevant in conservation issues. Behav-iour can generally be typified by body motion and body posture, parameters that are both measurableusing animal-attached accelerometers. Interpretation of acceleration data, however, can be complex,as the static (indicative of posture) and dynamic (motion) components are derived from the totalacceleration values, which should ideally be recorded in all 3-dimensional axes. The principles of tri-axial accelerometry are summarised and discussed in terms of the commonalities that arise in pat-terns of acceleration across species that vary in body pattern, life-history strategy, and the mediumthey inhabit. Using tri-axial acceleration data from deployments on captive and free-living animals(n = 12 species), behaviours were identified that varied in complexity, from the rhythmic patterns oflocomotion, to feeding, and more variable patterns including those relating to social interactions.These data can be combined with positional information to qualify patterns of area-use and map thedistribution of target behaviours. The range and distribution of behaviour may also provide insightinto the transmission of disease. In this way, the measurement of tri-axial acceleration can provideinsight into individual and population level processes, which may ultimately influence the effective-ness of conservation practice.
KEY WORDS: Acceleration · Archival tag · Satellite tracking · Biotelemetry · Time budget · Energy expenditure · Stroke frequency
Resale or republication not permitted without written consent of the publisher
OPENPEN ACCESSCCESS
Contribution to the Theme Section ‘Biologging technologies: new tools for conservation’
Endang Species Res 10: 47–60
As a consequence, accelerometry is a potentiallypowerful tool with which to address an array of conser-vation issues in higher vertebrates. For instance,behavioural data could be combined with informationon animal location (Tanaka et al. 2001) to producequalified maps of area-use, identified as a priority byAmlaner & Macdonald (1980). Ultimately this couldenable habitat to be delineated according to its im-portance for courtship, mating, the rearing of offspring,or any other behaviour identifiable in the species ofinterest. This approach could also be used to map theoccurrence of particular behaviours, including those,such as the depredation of livestock, which are often asource of human–wildlife conflict (e.g. Marker et al.2003). Accelerometry also has the potential to diag-nose aberrant behavioural patterns, such as thoseassociated with infection (Hart 1988). These patterns,whilst of interest per se, could also be combined withlocation information to provide insight into the sourceof the infection and the likelihood of transmissioneither within or between species (e.g. between theEurasian badger Meles meles and cattle, Carter et al.2007). The spread of disease is a central issue in theconservation of many higher vertebrates, particularlysmall populations, e.g. those of the Ethiopian wolfCanis simensis, which are susceptible to outbreaks ofrabies following interactions with infected domesticdogs (Randall et al. 2006).
Despite the potential power of this technology and itsuse in fields such as veterinary and sport science (e.g.Cavagna et al. 1963, Barrey & Desbrosse 1996), a rela-tively small number of people currently use accelerom-etry to investigate animal behaviour, and it has not yet,to our knowledge, been directly applied to animal con-servation issues. In addition, the majority of deploy-ments have been on aquatic organisms using mono- orbi-axial accelerometers (e.g. Watanuki et al. 2006, Satoet al. 2007). Acceleration can be measured in 3 axes(e.g. Wilson et al. 2008), which should be aspired to fora number of reasons: (1) This provides a measure ofanimal motion in all spatial dimensions, which gives amore accurate estimate of the animal’s complete bodyacceleration with corresponding power to identifytypes of behaviour. While movement patterns such aslocomotion are generally identifiable and quantifiablein 1 or 2 acceleration axes, other, rarer, movement pat-terns may only be identifiable by measuring accelera-tion in 3 axes. (2) Determination of the combineddynamic acceleration from 3 axes provides a proxy forenergy expenditure (Wilson et al. 2006). (3) Properquantification of the acceleration experienced by ananimal’s body in any axis necessitates that mono- andbi-axial accelerometers be aligned perfectly with thehorizontal plane; however, where acceleration is mea-sured in 3 axes, any reduction in measured accelera-
tion in one axis is compensated for in other dimensions,so that device orientation on the animal is less critical.Finally, advances in solid-state technology mean thatacceleration can now be measured in the third axiswithout increasing the size of the transducers orrecording device.
The interpretation of animal acceleration data iscomplex, however, as measured acceleration is theresult of both a static and a dynamic component (e.g.Sato et al. 2003) and animals can have a large reper-toire of movement patterns that vary in duration andcomplexity. The aim of this study is to provide a gen-eral framework whereby the identification of move-ment patterns, as recorded by tri-axial accelerometers,could be simplified across animals of different bodypatterns and life-histories. Specifically, we seek tosummarise the main principles of accelerometry, fromthe recorded data to initial transformations, and exam-ine the potential of these outputs to offer insight into arange of biological questions. To this end, a range ofanimals of varying size and body patterns wereequipped with tri-axial accelerometers. A subset ofthese animals was then observed in order to describethe accelerometric signals coding for the movementpatterns recorded.
MATERIALS AND METHODS
Acceleration was recorded in 3 axes correspondingto the dorso–ventral, anterior–posterior and lateralaxes (hereafter referred to as heave, surge and sway,which denotes the dynamic component in each respec-tive axis) using experimental ‘daily diary’ (DD) units(Wilson et al. 2008). The DD circuitry was potted inepoxy resin (Atlas Polymers) and given a hydro-dynamic shape. Units could record on up to 13 chan-nels and included transducers for magnetic fieldstrength in 3 axes, pressure, light and temperature;however, only the acceleration data are referred tohere. Acceleration values are given in g, where g rep-resents acceleration due to gravity (1 g = 9.81 m s–2).Tri-axial acceleration data were recorded with 22-bitresolution in a 128 Mb flash RA memory with an accu-racy of ±0.06 g. The units were programmed to recordat up to 32 Hz using Terminal Freeware, and data wereanalysed using Origin Pro (OriginLab) and MicrosoftExcel (Microsoft Corporation). A total of 12 animal spe-cies was instrumented with tri-axial accelerometers inboth wild and captive conditions (Table 1); details ofdeployment are given below.
Field deployments. The recording devices used infield deployments were potted in resin, weighed 42 gin air and a maximum of 12 g in water, and had maxi-mum dimensions of 55 × 30 × 15 mm unless otherwise
48
Shepard et al.: Behavioural categorisation using accelerometry
stated. Imperial cormorants Phalacrocorax atriceps,with a mean body mass of 2.1 kg (Svagelj & Quintana2007), were the smallest species equipped — as such,the device represented an average 2% of the animal’smass in air.
Thirty-three imperial cormorants were instrumentedin Punta León, Argentina (Table 1) in December 2005and 2006, using a custom-made crook to remove birdsfrom the nests where they were brooding chicks. Thedevices were attached to the lower back using Tesatape (Wilson et al. 1997) before birds were returned totheir nests, where they continued brooding. The wholeprocedure took <5 min. Twenty-one Magellanic pen-guins Spheniscus magellanicus were caught andequipped with a DD in Puerto Deseado, Argentina(Table 1), during December 2005 and 2006, using Tesatape to attach the units, and the handling method out-lined in Wilson et al. (1997). These birds were alsobrooding small chicks and were returned to the nestafter <5 min of handling time. Birds from both specieswere allowed to forage for a single trip before thedevices were retrieved.
Three Eurasian badgers Meles meles were equippedwith data loggers in Wytham Woods, UK (2004), afterbeing trapped and sedated following the methodsspecified by Macdonald & Newman (2002). The DDwas attached to a leather collar using duct tape andfastened round the animals’ necks. The procedure tookca. 5 min. The badger was released following recoveryfrom the sedative and recaptured after 2 to 95 d toretrieve the devices.
Four female leatherback turtles Dermochelys cori-acea were equipped with DDs at St Croix, Caribbean(Table 1), during the inter-nesting period in May 2007.Individuals were equipped and devices were retrievedwhen turtles exited the water to lay eggs. Loggers(dimensions 120 × 20 × 35 mm, mass 90 g) were
attached directly to the central dorsal ridge of the cara-pace (Fossette et al. 2008) by feeding 2 mm, coatedstainless steel wire through 2 holes in the ridge, ca.6 cm apart, and crimping them together into 2 loopsaround the device and its base. The base of the devicewas constructed from Platinum Silicone Putty (EquinoxTM Series; www.smooth-on.com) to form a stream-lined and snug fit to the top of the central ridge of theanimal. Deployment lasted from 4.5 h to 7.3 d.
Captive deployments. Deployments on captive ani-mals were mainly made in Buenos Aires Zoo, Argen-tina (Table 1), during May 2007, using resin-potteddevices measuring 65 × 36 × 15 mm, mass 21 g. Thesmallest animal to be instrumented was a hairyarmadillo Chaetophractus villosus, which had a bodymass of 2.98 kg and where the device represented0.7% of the animal’s mass. Animals were captured andrestrained by the zoo keepers, without sedative, witha handling time of less than ca. 6 min for any individ-ual. A vet was present during the capture of each ani-mal. Devices were attached for relatively short periodsof time (77 to 126 min, mean 110 min) during whichtime the animals were released into their pens, wherethey were observed, and patterns of movement andbehaviour were recorded.
Nominally, devices were attached using a collar con-structed from Silastic P1®. Silastic is a highly elastic,soft, hypoallergenic 2-part silicone-based rubber (DowCorning; UK supplier: W. P. Notcutt, Ripley), whichwas poured into a mould to create strips, ca. 3 mmthick at their widest point, which could be cut to appro-priate lengths and fastened around the animal’s neckwith a cable tie so that they were fitted flush againstthe skin. The device was attached to the collar usingTesa tape and was positioned on the ventral side of theanimal’s neck. The animals showed no signs of discom-fort due to the attachment of the device apart from the
49
Common name Latin binomial Location Co-ordinates Samplingfrequency (Hz)
Eurasian badger Meles meles Wytham Woods, UK 51° 46’ N, 1° 18’ W 9Imperial cormorant Phalacrocorax atriceps Punta León, Argentina 43° 04’ S, 64° 2’ W 8Leatherback turtle Dermochelys coriacea St Croix, Carribean 17° 42’ N, 64° 52’ W 8Lemon shark Negaprion brevirostris Bimini Island, Bahamas 25° 41’ N, 79° 17’ W 4Magellanic penguin Spheniscis magellanicus Puerto Deseado, Argentina 47° 47’ S, 65° 53’ W 9Cheetah Acinonyx jubatus Otjiwarongo, Namibia 20° 51’ S, 16° 38’’ E 32Cheetah Acinonyx jubatus Gobabis, Namibia 21° 43’ S, 19° 20’ E 32Coypu Myocastor coypus Buenos Aires Zoo, Argentina 34° 36’ S, 58° 22’ W 32Brazilian tapir Tapitus terrestris Buenos Aires Zoo, Argentina 34° 36’ S, 58° 22’ W 32Giant ant-eater Myrmecophaga tridactyla Buenos Aires Zoo, Argentina 34° 36’ S, 58° 22’ W 32Guanaco Lama guanicoe Buenos Aires Zoo, Argentina 34° 36’ S, 58° 22’ W 32Hairy armadillo Chaetophractus villosus Buenos Aires Zoo, Argentina 34° 36’ S, 58° 22’ W 32Mouflon Ovis musimon Buenos Aires Zoo, Argentina 34° 36’ S, 58° 22’ W 32Llama Lama glama Buenos Aires Zoo, Argentina 34° 36’ S, 58° 22’ W 32
Table 1. Summary of ‘daily diary’ deployments
Endang Species Res 10: 47–60
Brazilian tapir, which shook its head sporadically, pos-sibly in response to the position of the Silastic collar,which was wrapped over its head in an effort to keepthe device dry. Otherwise, a single device wasattached to a female hairy armadillo Chaetophractusvillosus using Tesa tape to secure it to the armour justbehind the back of the neck, and a single device wasalso attached to a male mouflon Ovis musimon using aleather collar.
Devices were also deployed in April 2007 on 5 semi-tame cheetahs Acinonyx jubatus in rehabilitation facil-ities at Africat, Otjiwarongo, Namibia, and at Harnas,Gobabis, Namibia. Four deployments were made atAfricat; 2 on habituated animals without the need forsedative, and 2 on unhabituated animals that werecaptured with a dart rifle with a combined dose of Zo-latil and Medetomidine, and recaptured using a doseof Ketamine. Devices were attached to leather collars,and instrumented animals were allowed to roam freelyin large enclosures (400 and 4000 ha at Africat) for theduration of the deployment (range 4 to 7 d).
Two lemon sharks Negaprion brevirostris, of totallengths 186 and 150 cm, were captured in April 2006off Bimini Island, Bahamas (Table 1). Animals werecaptured using sport-fishing gear with Mustad sharksize 10 circle hooks baited with live bait from a smallskiff, while the water was chummed. Once captured,the sharks were transported in large water containersonboard the boat, to an oval pen (ca. 20 × 5 m) situatedwithin an otherwise open lagoon, where the animalswere left to rest for a minimum of 2 d before trials com-menced. Each shark was instrumented by guiding itinto a polyurethane sling using a hand-held seine-netand large wooden boards, where the devices wereattached (dimensions 90 × 32 × 20 mm, mass 60 g in air)by passing 2 sections of monofilament line through thedevice and the dorsal fin. After periods of 2 and 4 d,respectively, subjects were recaptured using the samemethod as that preceding instrumentation and thedevice was removed by cutting the monofilament withwire cutters prior to the sharks being released.
Analysis. Dynamic acceleration was derived in theMagellanic penguin data by taking a running mean oftotal acceleration values over 2 s (Wilson et al. 2006).All other manipulations are described below.
Total acceleration values in one channel were foundto contain system noise for deployments on the guana-cos and leatherback turtles. Increases in accelerationthat did not accord with changes in acceleration due tobody motion were removed from these channels, iden-tified as data points >0.4 g different to the previousdata point in the channel measuring sway accelerationin the guanaco, and data points differing by >0.2 gfrom the previous data point in the channel measuringsurge acceleration in the leatherback turtle data.
RESULTS AND DISCUSSION
Total acceleration values, that is, the raw accelera-tion values recorded in each acceleration channel,include both a static and dynamic component that canbe used to determine animal posture and movement.The following sections describe how these data can beused separately and in tandem to recreate movementpatterns, either as a descriptive exercise (for instance,where the pattern has not been previously docu-mented), or to ascribe a possible function where themovements are consistent with a known behaviour.The biomechanical processes underlying movementssuch as locomotion are described extensively else-where (e.g. Alexander 1983, Schmidt-Nielsen 1997)and are alluded to here in the context of the associatedpatterns in acceleration and their relevance to theidentification and study of animal behaviour. Thepower to resolve such patterns may depend on boththe sampling frequency and the method used to attachthe device to the animal because loose attachments,such as some collar fittings, will generate noise as theanimal moves.
Static acceleration
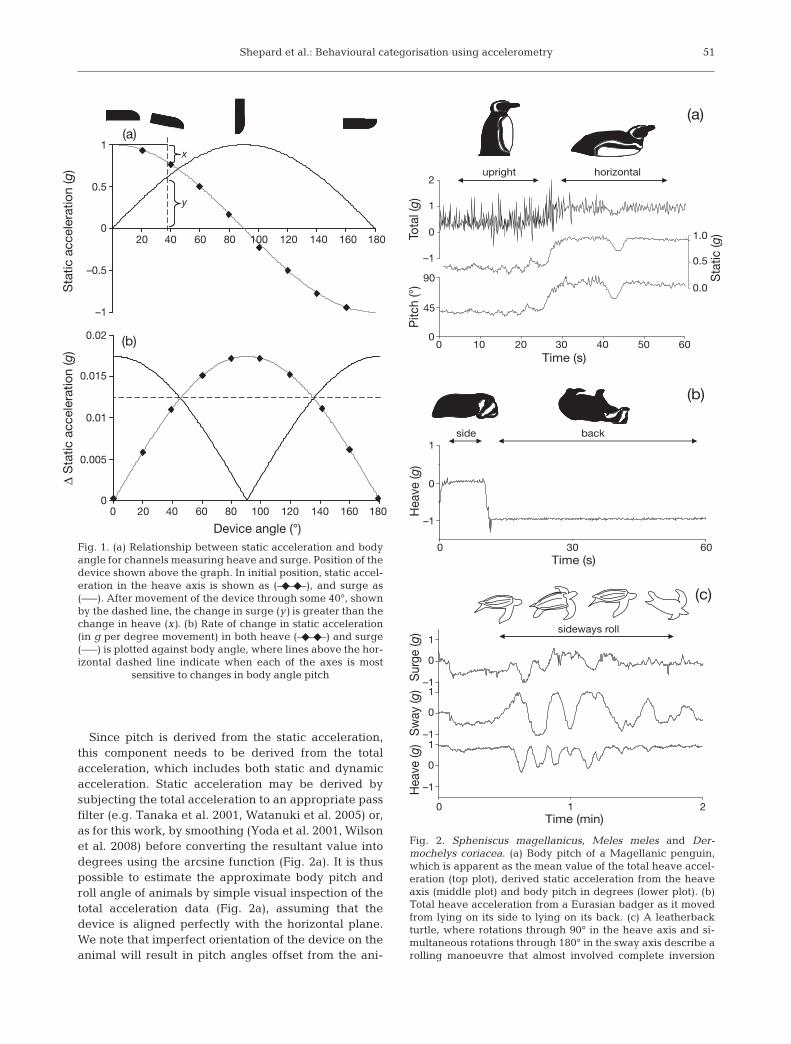
Static acceleration is a measure of the incline of theaccelerometer with respect to the earth’s gravitationalfield and therefore provides a measure of the bodyangle of the instrumented animal. Static accelerationmeasured in 3 axes enables the calculation of bodypitch and roll (Wilson et al. 2008, their Fig. 5b). Thepitch is calculated as the arcsine of g, where g is thestatic acceleration in the heave channel. The roll isderived in the same way from the static acceleration inthe sway axis. Static acceleration ranges from 1 to –1 gin each channel, each sensor recording its maximum of1 g when facing upwards, directly away from theearth’s gravitational field (e.g. Fig. 1a).
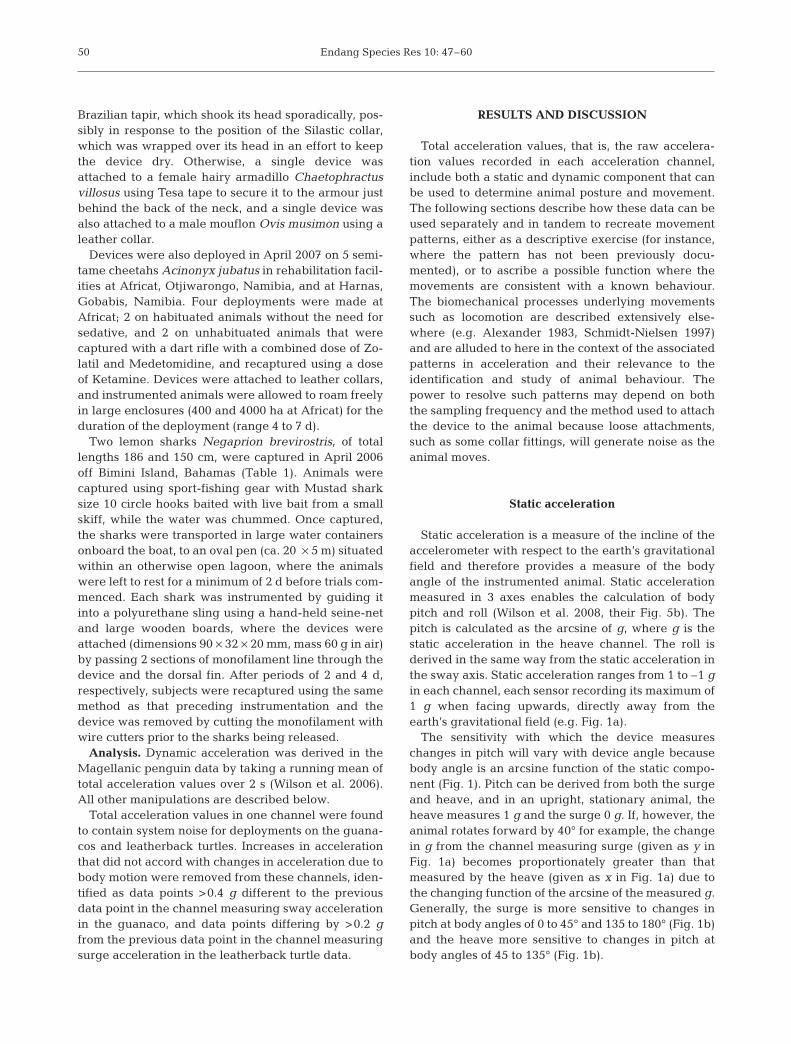
The sensitivity with which the device measureschanges in pitch will vary with device angle becausebody angle is an arcsine function of the static compo-nent (Fig. 1). Pitch can be derived from both the surgeand heave, and in an upright, stationary animal, theheave measures 1 g and the surge 0 g. If, however, theanimal rotates forward by 40° for example, the changein g from the channel measuring surge (given as y inFig. 1a) becomes proportionately greater than thatmeasured by the heave (given as x in Fig. 1a) due tothe changing function of the arcsine of the measured g.Generally, the surge is more sensitive to changes inpitch at body angles of 0 to 45° and 135 to 180° (Fig. 1b)and the heave more sensitive to changes in pitch atbody angles of 45 to 135° (Fig. 1b).
50
Shepard et al.: Behavioural categorisation using accelerometry
Since pitch is derived from the static acceleration,this component needs to be derived from the totalacceleration, which includes both static and dynamicacceleration. Static acceleration may be derived bysubjecting the total acceleration to an appropriate passfilter (e.g. Tanaka et al. 2001, Watanuki et al. 2005) or,as for this work, by smoothing (Yoda et al. 2001, Wilsonet al. 2008) before converting the resultant value intodegrees using the arcsine function (Fig. 2a). It is thuspossible to estimate the approximate body pitch androll angle of animals by simple visual inspection of thetotal acceleration data (Fig. 2a), assuming that thedevice is aligned perfectly with the horizontal plane.We note that imperfect orientation of the device on theanimal will result in pitch angles offset from the ani-
51
00
0.005
0.01
0.02
–1
–0.5
0.5
(a)
(b)
0
1
0.015
20 40 60 80 100 120
Device angle (°)
Δ S
tatic
acc
eler
atio
n (g
)S
tatic
acc
eler
atio
n (g
)
140 160 180
20 40
x
y
60 80 100 120 140 160 180
Fig. 1. (a) Relationship between static acceleration and bodyangle for channels measuring heave and surge. Position of thedevice shown above the graph. In initial position, static accel-eration in the heave axis is shown as (–f–f–), and surge as(–––). After movement of the device through some 40°, shownby the dashed line, the change in surge (y) is greater than thechange in heave (x). (b) Rate of change in static acceleration(in g per degree movement) in both heave (–f–f–) and surge(–––) is plotted against body angle, where lines above the hor-izontal dashed line indicate when each of the axes is most
sensitive to changes in body angle pitch
upright2
1
0
–1
–1
0
1
90
1.0
0.5
0.0
45
00 10 20
Time (s)
Pitc
h (°
)
Sta
tic (g
)Tota
l (g)
30
30 60
(a)
(b)
(c)
0
0
–1
0
1–1
0
1–1
0
1
1 2
40 50 60
horizontal
back
sideways roll
Time (s)
Hea
ve (g
)H
eave
(g)
Sw
ay (g
)S
urge
(g)
Time (min)
side
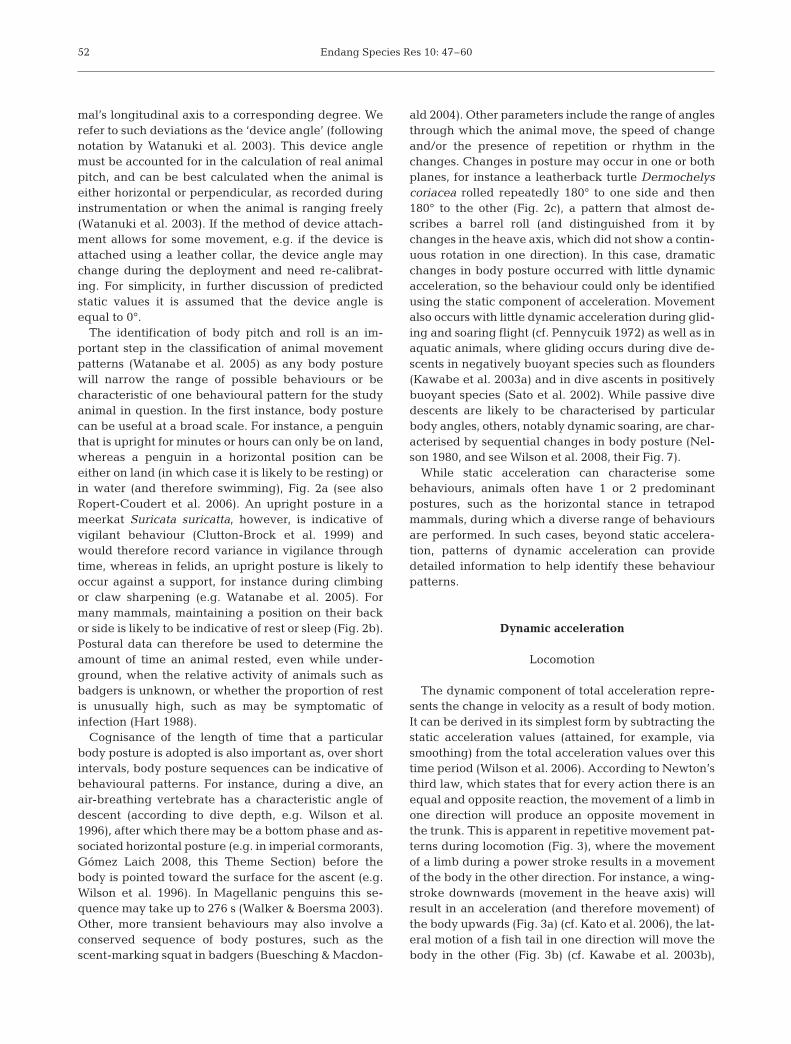
Fig. 2. Spheniscus magellanicus, Meles meles and Der-mochelys coriacea. (a) Body pitch of a Magellanic penguin,which is apparent as the mean value of the total heave accel-eration (top plot), derived static acceleration from the heaveaxis (middle plot) and body pitch in degrees (lower plot). (b)Total heave acceleration from a Eurasian badger as it movedfrom lying on its side to lying on its back. (c) A leatherbackturtle, where rotations through 90° in the heave axis and si-multaneous rotations through 180° in the sway axis describe arolling manoeuvre that almost involved complete inversion
Endang Species Res 10: 47–60
mal’s longitudinal axis to a corresponding degree. Werefer to such deviations as the ‘device angle’ (followingnotation by Watanuki et al. 2003). This device anglemust be accounted for in the calculation of real animalpitch, and can be best calculated when the animal iseither horizontal or perpendicular, as recorded duringinstrumentation or when the animal is ranging freely(Watanuki et al. 2003). If the method of device attach-ment allows for some movement, e.g. if the device isattached using a leather collar, the device angle maychange during the deployment and need re-calibrat-ing. For simplicity, in further discussion of predictedstatic values it is assumed that the device angle isequal to 0°.
The identification of body pitch and roll is an im-portant step in the classification of animal movementpatterns (Watanabe et al. 2005) as any body posturewill narrow the range of possible behaviours or becharacteristic of one behavioural pattern for the studyanimal in question. In the first instance, body posturecan be useful at a broad scale. For instance, a penguinthat is upright for minutes or hours can only be on land,whereas a penguin in a horizontal position can beeither on land (in which case it is likely to be resting) orin water (and therefore swimming), Fig. 2a (see alsoRopert-Coudert et al. 2006). An upright posture in ameerkat Suricata suricatta, however, is indicative ofvigilant behaviour (Clutton-Brock et al. 1999) andwould therefore record variance in vigilance throughtime, whereas in felids, an upright posture is likely tooccur against a support, for instance during climbingor claw sharpening (e.g. Watanabe et al. 2005). Formany mammals, maintaining a position on their backor side is likely to be indicative of rest or sleep (Fig. 2b).Postural data can therefore be used to determine theamount of time an animal rested, even while under-ground, when the relative activity of animals such asbadgers is unknown, or whether the proportion of restis unusually high, such as may be symptomatic ofinfection (Hart 1988).
Cognisance of the length of time that a particularbody posture is adopted is also important as, over shortintervals, body posture sequences can be indicative ofbehavioural patterns. For instance, during a dive, anair-breathing vertebrate has a characteristic angle ofdescent (according to dive depth, e.g. Wilson et al.1996), after which there may be a bottom phase and as-sociated horizontal posture (e.g. in imperial cormorants,Gómez Laich 2008, this Theme Section) before thebody is pointed toward the surface for the ascent (e.g.Wilson et al. 1996). In Magellanic penguins this se-quence may take up to 276 s (Walker & Boersma 2003).Other, more transient behaviours may also involve aconserved sequence of body postures, such as thescent-marking squat in badgers (Buesching & Macdon-
ald 2004). Other parameters include the range of anglesthrough which the animal move, the speed of changeand/or the presence of repetition or rhythm in thechanges. Changes in posture may occur in one or bothplanes, for instance a leatherback turtle Dermochelyscoriacea rolled repeatedly 180° to one side and then180° to the other (Fig. 2c), a pattern that almost de-scribes a barrel roll (and distinguished from it bychanges in the heave axis, which did not show a contin-uous rotation in one direction). In this case, dramaticchanges in body posture occurred with little dynamicacceleration, so the behaviour could only be identifiedusing the static component of acceleration. Movementalso occurs with little dynamic acceleration during glid-ing and soaring flight (cf. Pennycuik 1972) as well as inaquatic animals, where gliding occurs during dive de-scents in negatively buoyant species such as flounders(Kawabe et al. 2003a) and in dive ascents in positivelybuoyant species (Sato et al. 2002). While passive divedescents are likely to be characterised by particularbody angles, others, notably dynamic soaring, are char-acterised by sequential changes in body posture (Nel-son 1980, and see Wilson et al. 2008, their Fig. 7).
While static acceleration can characterise somebehaviours, animals often have 1 or 2 predominantpostures, such as the horizontal stance in tetrapodmammals, during which a diverse range of behavioursare performed. In such cases, beyond static accelera-tion, patterns of dynamic acceleration can providedetailed information to help identify these behaviourpatterns.
Dynamic acceleration
Locomotion
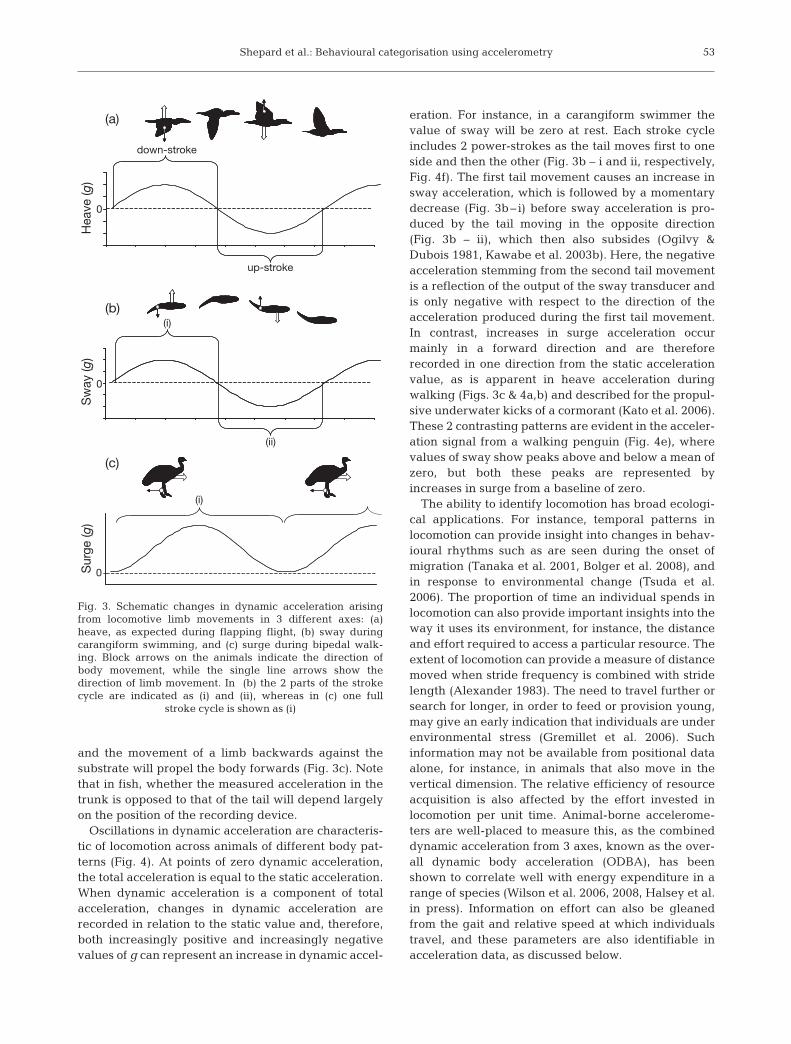
The dynamic component of total acceleration repre-sents the change in velocity as a result of body motion.It can be derived in its simplest form by subtracting thestatic acceleration values (attained, for example, viasmoothing) from the total acceleration values over thistime period (Wilson et al. 2006). According to Newton’sthird law, which states that for every action there is anequal and opposite reaction, the movement of a limb inone direction will produce an opposite movement inthe trunk. This is apparent in repetitive movement pat-terns during locomotion (Fig. 3), where the movementof a limb during a power stroke results in a movementof the body in the other direction. For instance, a wing-stroke downwards (movement in the heave axis) willresult in an acceleration (and therefore movement) ofthe body upwards (Fig. 3a) (cf. Kato et al. 2006), the lat-eral motion of a fish tail in one direction will move thebody in the other (Fig. 3b) (cf. Kawabe et al. 2003b),
52
Shepard et al.: Behavioural categorisation using accelerometry
and the movement of a limb backwards against thesubstrate will propel the body forwards (Fig. 3c). Notethat in fish, whether the measured acceleration in thetrunk is opposed to that of the tail will depend largelyon the position of the recording device.
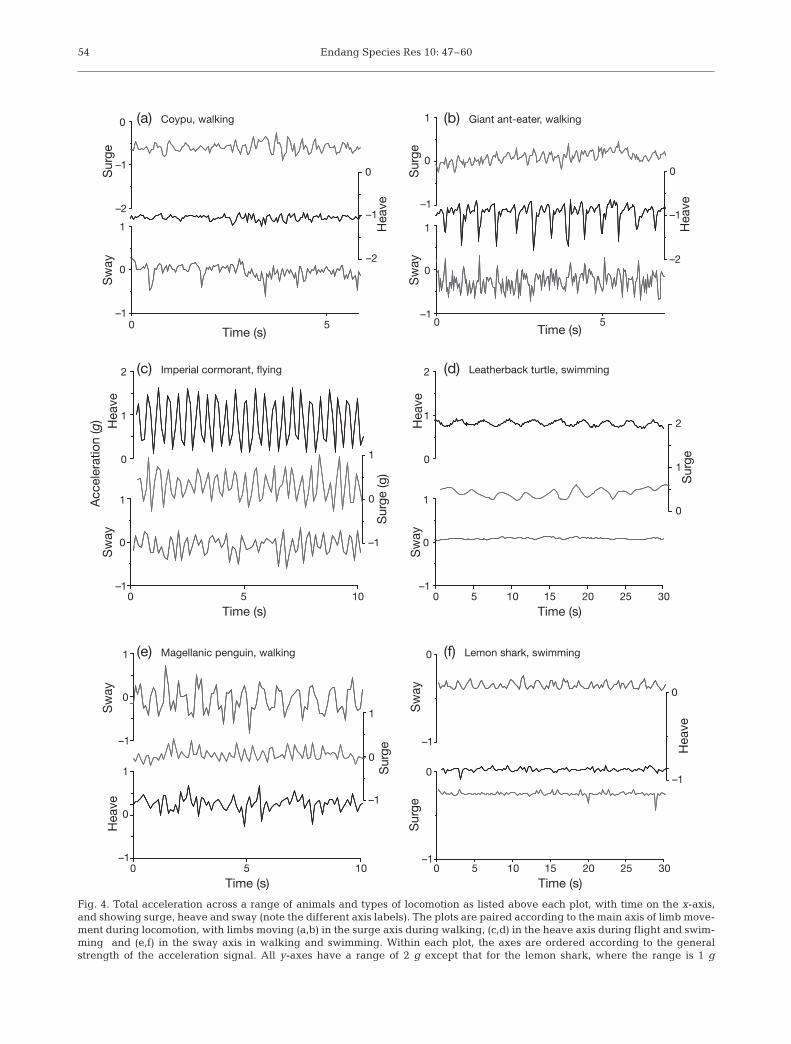
Oscillations in dynamic acceleration are characteris-tic of locomotion across animals of different body pat-terns (Fig. 4). At points of zero dynamic acceleration,the total acceleration is equal to the static acceleration.When dynamic acceleration is a component of totalacceleration, changes in dynamic acceleration arerecorded in relation to the static value and, therefore,both increasingly positive and increasingly negativevalues of g can represent an increase in dynamic accel-
eration. For instance, in a carangiform swimmer thevalue of sway will be zero at rest. Each stroke cycleincludes 2 power-strokes as the tail moves first to oneside and then the other (Fig. 3b – i and ii, respectively,Fig. 4f). The first tail movement causes an increase insway acceleration, which is followed by a momentarydecrease (Fig. 3b– i) before sway acceleration is pro-duced by the tail moving in the opposite direction(Fig. 3b – ii), which then also subsides (Ogilvy &Dubois 1981, Kawabe et al. 2003b). Here, the negativeacceleration stemming from the second tail movementis a reflection of the output of the sway transducer andis only negative with respect to the direction of theacceleration produced during the first tail movement.In contrast, increases in surge acceleration occurmainly in a forward direction and are thereforerecorded in one direction from the static accelerationvalue, as is apparent in heave acceleration duringwalking (Figs. 3c & 4a,b) and described for the propul-sive underwater kicks of a cormorant (Kato et al. 2006).These 2 contrasting patterns are evident in the acceler-ation signal from a walking penguin (Fig. 4e), wherevalues of sway show peaks above and below a mean ofzero, but both these peaks are represented byincreases in surge from a baseline of zero.
The ability to identify locomotion has broad ecologi-cal applications. For instance, temporal patterns inlocomotion can provide insight into changes in behav-ioural rhythms such as are seen during the onset ofmigration (Tanaka et al. 2001, Bolger et al. 2008), andin response to environmental change (Tsuda et al.2006). The proportion of time an individual spends inlocomotion can also provide important insights into theway it uses its environment, for instance, the distanceand effort required to access a particular resource. Theextent of locomotion can provide a measure of distancemoved when stride frequency is combined with stridelength (Alexander 1983). The need to travel further orsearch for longer, in order to feed or provision young,may give an early indication that individuals are underenvironmental stress (Gremillet et al. 2006). Suchinformation may not be available from positional dataalone, for instance, in animals that also move in thevertical dimension. The relative efficiency of resourceacquisition is also affected by the effort invested inlocomotion per unit time. Animal-borne accelerome-ters are well-placed to measure this, as the combineddynamic acceleration from 3 axes, known as the over-all dynamic body acceleration (ODBA), has beenshown to correlate well with energy expenditure in arange of species (Wilson et al. 2006, 2008, Halsey et al.in press). Information on effort can also be gleanedfrom the gait and relative speed at which individualstravel, and these parameters are also identifiable inacceleration data, as discussed below.
53
down-stroke
(a)
(b)
(c)
(i)
(i)
(ii)
up-stroke
0
0
0Sur
ge (g
)S
way
(g)
Hea
ve (g
)
Fig. 3. Schematic changes in dynamic acceleration arisingfrom locomotive limb movements in 3 different axes: (a)heave, as expected during flapping flight, (b) sway duringcarangiform swimming, and (c) surge during bipedal walk-ing. Block arrows on the animals indicate the direction ofbody movement, while the single line arrows show thedirection of limb movement. In (b) the 2 parts of the strokecycle are indicated as (i) and (ii), whereas in (c) one full
stroke cycle is shown as (i)
Endang Species Res 10: 47–6054
Time (s)
Acc
eler
atio
n (g
)
0 0–1–1
0
1
–1
0
1
–1
0
1
–1
0
1
–1
0
0
–1
–2
1
–1
0
1
–2
–1
0 (a) Coypu, walking (b) Giant ant-eater, walking
(c) Imperial cormorant, flying (d) Leatherback turtle, swimming
(e) Magellanic penguin, walking (f) Lemon shark, swimming
–2
–1
0
–1
0
1
0
1
2
0
1
2
0
1
2
–1
0
1
0
–1
–1
0
1
0
–1
0
5 10 15 20 25 305 10
Time (s)0
0 5 0 5
5 10
Time (s)
0 5 10 15 20 25 30
Time (s)
Time (s)
Sw
ayS
way
Sw
ay
Sw
ayS
way
Sur
ge
Sur
ge (g
) Sur
ge
Sw
ayS
urge
Sur
ge
Sur
geH
eave
Hea
veH
eave
Hea
ve
Hea
veH
eave
Time (s)
Fig. 4. Total acceleration across a range of animals and types of locomotion as listed above each plot, with time on the x-axis,and showing surge, heave and sway (note the different axis labels). The plots are paired according to the main axis of limb move-ment during locomotion, with limbs moving (a,b) in the surge axis during walking, (c,d) in the heave axis during flight and swim-ming and (e,f) in the sway axis in walking and swimming. Within each plot, the axes are ordered according to the generalstrength of the acceleration signal. All y-axes have a range of 2 g except that for the lemon shark, where the range is 1 g
Shepard et al.: Behavioural categorisation using accelerometry
Although relatively complex techniques such as thefast Fourier transform (e.g. Watanabe et al. 2005),band-pass filters and shape analysis (Schreer & Testa1995) can be applied to describe these patterns, simplerules define expected patterns across and within spe-cies (Table 2). Generally, the axis in which the limbsmove shows the largest variation in acceleration, thisequating predominantly to either heave or sway(Table 1). Acceleration in the surge axis will tend toshow smaller fluctuations even where limbs move inthis axis (e.g. during walking) as it is more efficient totravel at a relatively constant velocity, with minimaldeceleration between power strokes (Schmidt-Nielsen1997). A switch from one predominant axis to anothertypifies a change in the type of locomotion. Forinstance, walking in a cormorant is characterised byoscillations around 0 g in the sway (similar to the pat-tern shown by walking penguins; Fig. 4e), whereasflight is typified by oscillations in the heave around amean of 1 g (Fig. 4c, see also Gómez Laich 2008). Dur-ing terrestrial tetrapod locomotion, the heave axis mayshow regular acceleration ‘spikes’ caused by the ani-mal pushing against a hard substrate, as can be seenduring a giant ant-eater walking (Fig. 4b).
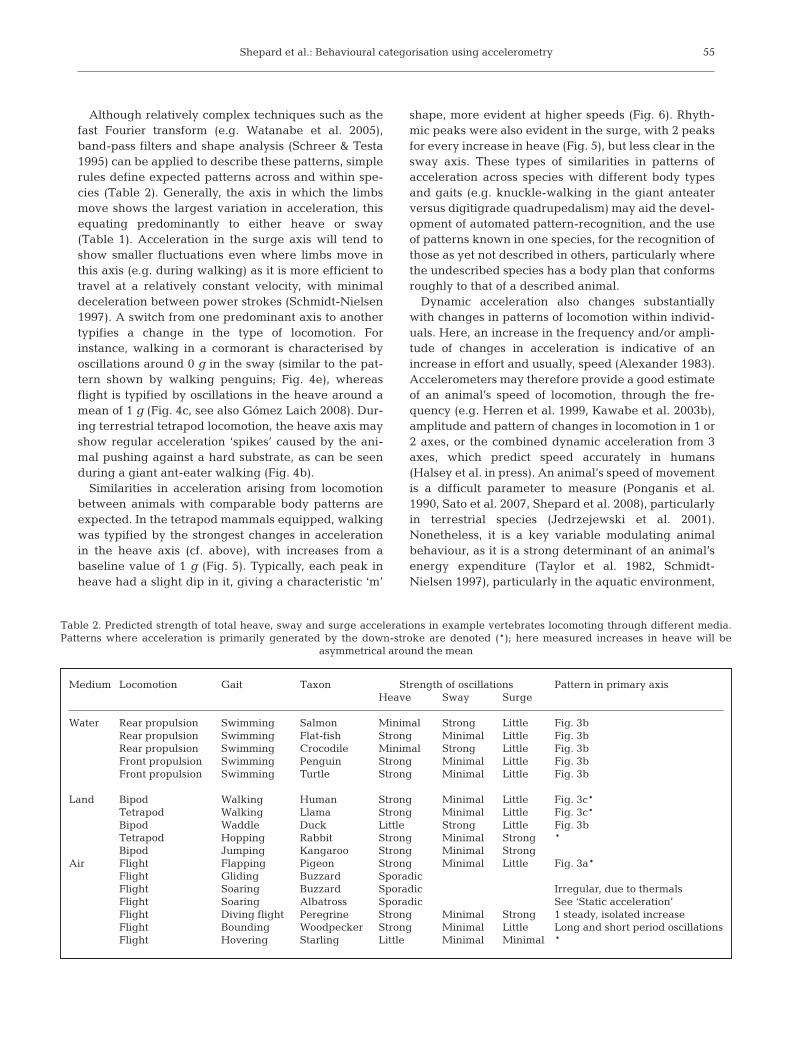
Similarities in acceleration arising from locomotionbetween animals with comparable body patterns areexpected. In the tetrapod mammals equipped, walkingwas typified by the strongest changes in accelerationin the heave axis (cf. above), with increases from abaseline value of 1 g (Fig. 5). Typically, each peak inheave had a slight dip in it, giving a characteristic ‘m’
shape, more evident at higher speeds (Fig. 6). Rhyth-mic peaks were also evident in the surge, with 2 peaksfor every increase in heave (Fig. 5), but less clear in thesway axis. These types of similarities in patterns ofacceleration across species with different body typesand gaits (e.g. knuckle-walking in the giant anteaterversus digitigrade quadrupedalism) may aid the devel-opment of automated pattern-recognition, and the useof patterns known in one species, for the recognition ofthose as yet not described in others, particularly wherethe undescribed species has a body plan that conformsroughly to that of a described animal.
Dynamic acceleration also changes substantiallywith changes in patterns of locomotion within individ-uals. Here, an increase in the frequency and/or ampli-tude of changes in acceleration is indicative of anincrease in effort and usually, speed (Alexander 1983).Accelerometers may therefore provide a good estimateof an animal’s speed of locomotion, through the fre-quency (e.g. Herren et al. 1999, Kawabe et al. 2003b),amplitude and pattern of changes in locomotion in 1 or2 axes, or the combined dynamic acceleration from 3axes, which predict speed accurately in humans(Halsey et al. in press). An animal’s speed of movementis a difficult parameter to measure (Ponganis et al.1990, Sato et al. 2007, Shepard et al. 2008), particularlyin terrestrial species (Jedrzejewski et al. 2001).Nonetheless, it is a key variable modulating animalbehaviour, as it is a strong determinant of an animal’senergy expenditure (Taylor et al. 1982, Schmidt-Nielsen 1997), particularly in the aquatic environment,
55
Medium Locomotion Gait Taxon Strength of oscillations Pattern in primary axisHeave Sway Surge
Water Rear propulsion Swimming Salmon Minimal Strong Little Fig. 3bRear propulsion Swimming Flat-fish Strong Minimal Little Fig. 3bRear propulsion Swimming Crocodile Minimal Strong Little Fig. 3bFront propulsion Swimming Penguin Strong Minimal Little Fig. 3bFront propulsion Swimming Turtle Strong Minimal Little Fig. 3b
Land Bipod Walking Human Strong Minimal Little Fig. 3c*Tetrapod Walking Llama Strong Minimal Little Fig. 3c*Bipod Waddle Duck Little Strong Little Fig. 3bTetrapod Hopping Rabbit Strong Minimal Strong *Bipod Jumping Kangaroo Strong Minimal Strong
Air Flight Flapping Pigeon Strong Minimal Little Fig. 3a*Flight Gliding Buzzard SporadicFlight Soaring Buzzard Sporadic Irregular, due to thermalsFlight Soaring Albatross Sporadic See ‘Static acceleration’Flight Diving flight Peregrine Strong Minimal Strong 1 steady, isolated increaseFlight Bounding Woodpecker Strong Minimal Little Long and short period oscillationsFlight Hovering Starling Little Minimal Minimal *
Table 2. Predicted strength of total heave, sway and surge accelerations in example vertebrates locomoting through different media.Patterns where acceleration is primarily generated by the down-stroke are denoted (*); here measured increases in heave will be
asymmetrical around the mean
Endang Species Res 10: 47–60
where energy expenditure increases as an exponentialfunction of speed (e.g. Culik et al. 1994).
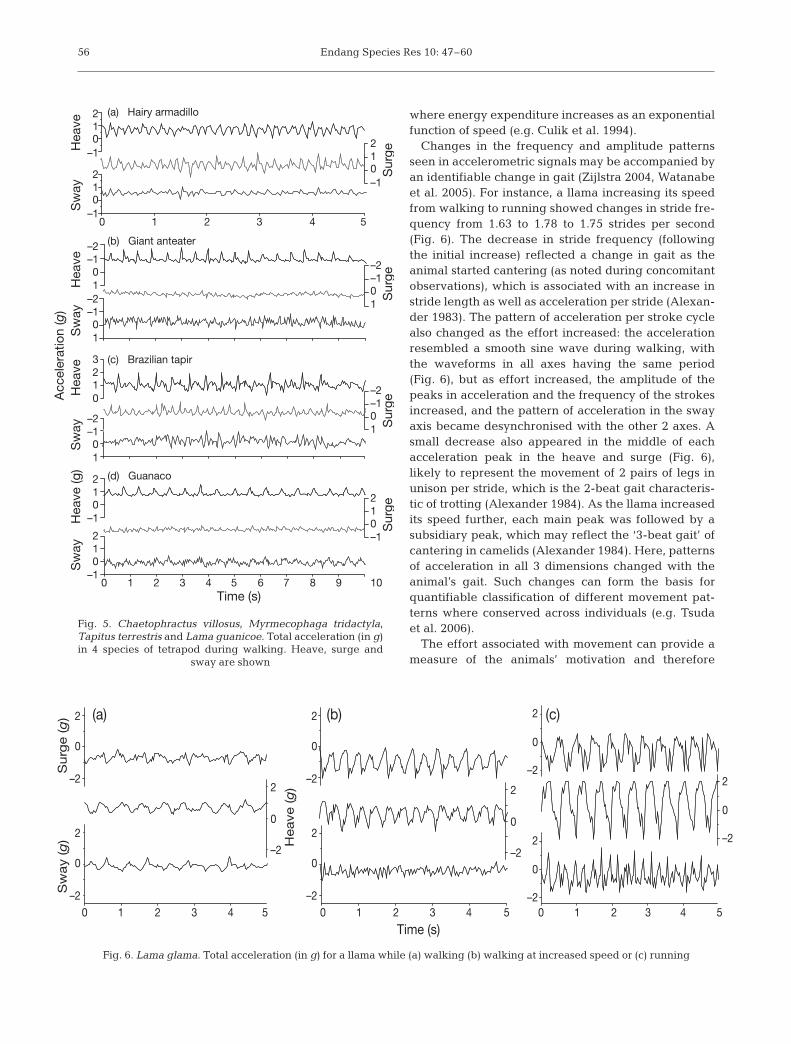
Changes in the frequency and amplitude patternsseen in accelerometric signals may be accompanied byan identifiable change in gait (Zijlstra 2004, Watanabeet al. 2005). For instance, a llama increasing its speedfrom walking to running showed changes in stride fre-quency from 1.63 to 1.78 to 1.75 strides per second(Fig. 6). The decrease in stride frequency (followingthe initial increase) reflected a change in gait as theanimal started cantering (as noted during concomitantobservations), which is associated with an increase instride length as well as acceleration per stride (Alexan-der 1983). The pattern of acceleration per stroke cyclealso changed as the effort increased: the accelerationresembled a smooth sine wave during walking, withthe waveforms in all axes having the same period(Fig. 6), but as effort increased, the amplitude of thepeaks in acceleration and the frequency of the strokesincreased, and the pattern of acceleration in the swayaxis became desynchronised with the other 2 axes. Asmall decrease also appeared in the middle of eachacceleration peak in the heave and surge (Fig. 6),likely to represent the movement of 2 pairs of legs inunison per stride, which is the 2-beat gait characteris-tic of trotting (Alexander 1984). As the llama increasedits speed further, each main peak was followed by asubsidiary peak, which may reflect the ‘3-beat gait’ ofcantering in camelids (Alexander 1984). Here, patternsof acceleration in all 3 dimensions changed with theanimal’s gait. Such changes can form the basis forquantifiable classification of different movement pat-terns where conserved across individuals (e.g. Tsudaet al. 2006).
The effort associated with movement can provide ameasure of the animals’ motivation and therefore
56
0
012
–1
012
–1
0–1–2
1
0–1–2
1
0
0
012
–1
012 (a) Hairy armadillo
(b) Giant anteater
(c) Brazilian tapir
Acc
eler
atio
n (g
)
(d) Guanaco
–1
012
–1
1 2 3 4 5
–1–2
1 0–1–2
1
123
0
0–1–2
1
012
–1
1 2 3 4Time (s)
Sur
ge
Sur
ge
Sur
ge
Sur
geH
eave
Hea
veH
eave
Hea
ve (g
)S
way
Sw
ayS
way
Sw
ay
5 6 7 8 9 10
Fig. 5. Chaetophractus villosus, Myrmecophaga tridactyla,Tapitus terrestris and Lama guanicoe. Total acceleration (in g)in 4 species of tetrapod during walking. Heave, surge and
sway are shown
0–2
0
2
–2
0
2
–2
0
2
–2
0
2
–2
0
2
–2
0
2
–2
0
2–2
0
2
–2
0
2
1 2 3 4
Time (s)
Sw
ay
(g)
Su
rge (g
)
Heave
(g
)
(a) (b) (c)
5 0 1 2 3 4 5 0 1 2 3 4 5
Fig. 6. Lama glama. Total acceleration (in g) for a llama while (a) walking (b) walking at increased speed or (c) running
Shepard et al.: Behavioural categorisation using accelerometry
insight into the function of a movement pattern. Forinstance, animals are expected to travel at a speed thatminimizes the cost of transport (e.g. Culik et al. 1994),which is likely to correspond to the predominant fre-quency in acceleration data through time (Sato et al.2007). Lower frequencies will arise when the purposeof locomotion is not to minimize net energy used perunit distance travelled, e.g. optimizing food intakewhile grazing. Higher frequencies and amplitudesoccur when an animal is being pursued or in pursuit ofanother (Wilson et al. 2002). Behaviours with motiva-tion more complex than the minimization of the cost oftransport are likely to be identifiable by further charac-teristics in acceleration data.
Movement other than locomotion
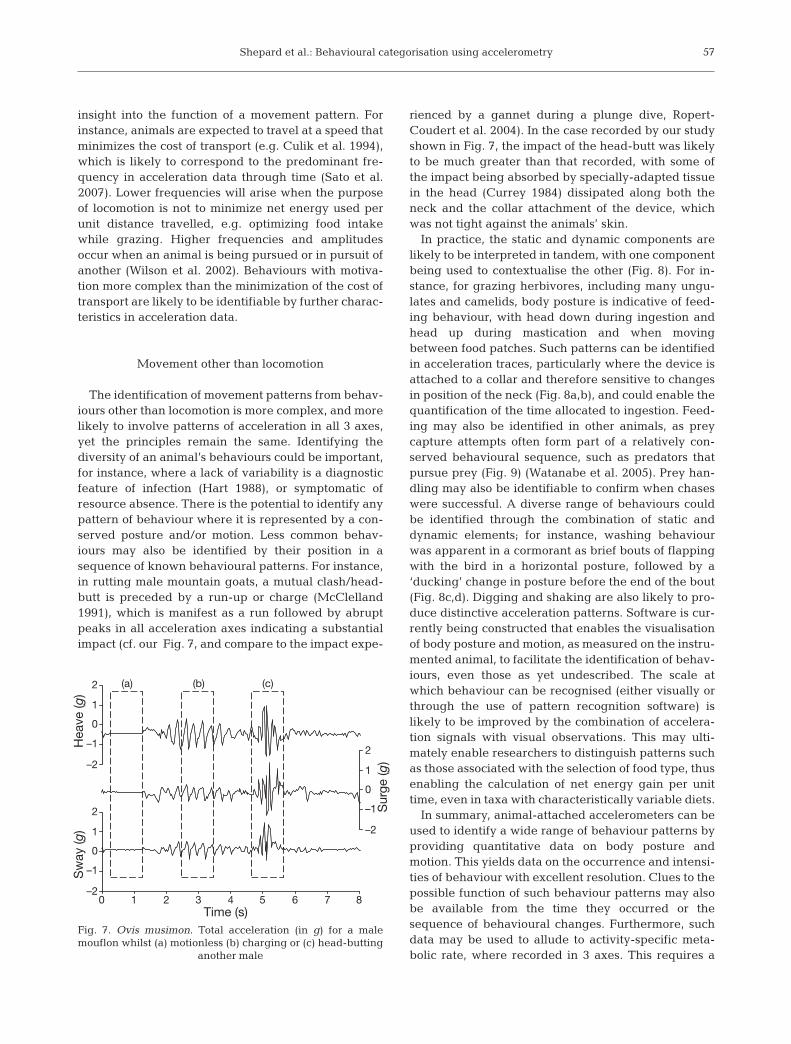
The identification of movement patterns from behav-iours other than locomotion is more complex, and morelikely to involve patterns of acceleration in all 3 axes,yet the principles remain the same. Identifying thediversity of an animal’s behaviours could be important,for instance, where a lack of variability is a diagnosticfeature of infection (Hart 1988), or symptomatic ofresource absence. There is the potential to identify anypattern of behaviour where it is represented by a con-served posture and/or motion. Less common behav-iours may also be identified by their position in asequence of known behavioural patterns. For instance,in rutting male mountain goats, a mutual clash/head-butt is preceded by a run-up or charge (McClelland1991), which is manifest as a run followed by abruptpeaks in all acceleration axes indicating a substantialimpact (cf. our Fig. 7, and compare to the impact expe-
rienced by a gannet during a plunge dive, Ropert-Coudert et al. 2004). In the case recorded by our studyshown in Fig. 7, the impact of the head-butt was likelyto be much greater than that recorded, with some ofthe impact being absorbed by specially-adapted tissuein the head (Currey 1984) dissipated along both theneck and the collar attachment of the device, whichwas not tight against the animals’ skin.
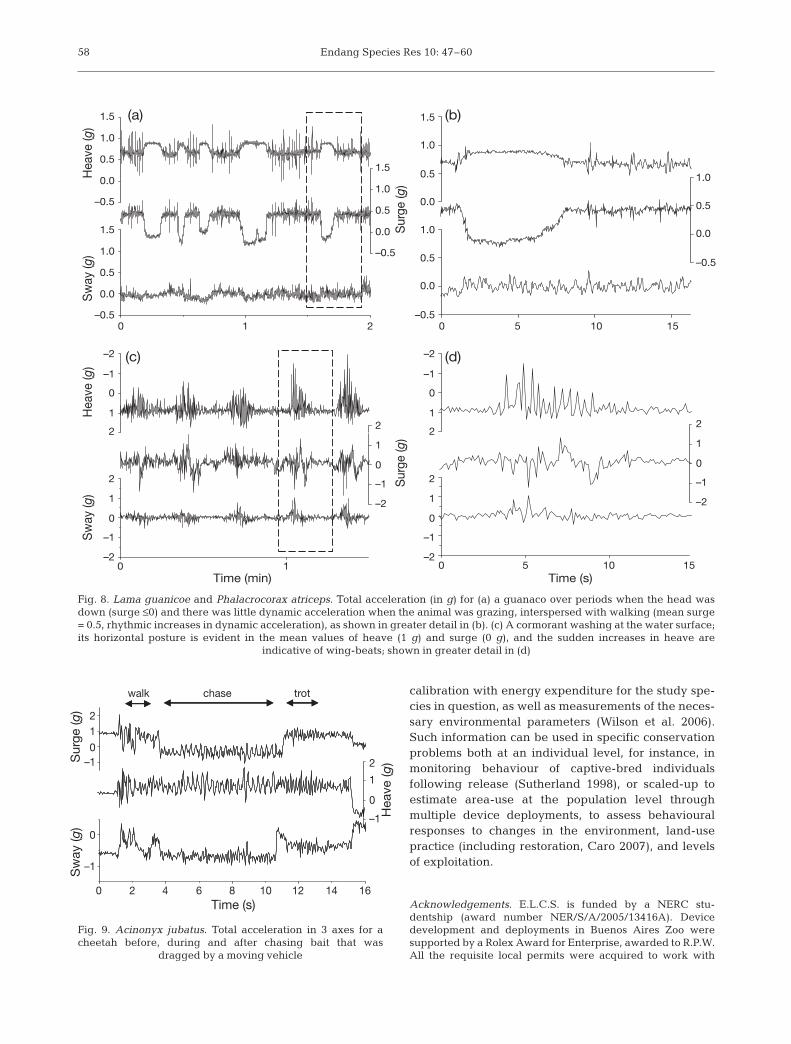
In practice, the static and dynamic components arelikely to be interpreted in tandem, with one componentbeing used to contextualise the other (Fig. 8). For in-stance, for grazing herbivores, including many ungu-lates and camelids, body posture is indicative of feed-ing behaviour, with head down during ingestion andhead up during mastication and when movingbetween food patches. Such patterns can be identifiedin acceleration traces, particularly where the device isattached to a collar and therefore sensitive to changesin position of the neck (Fig. 8a,b), and could enable thequantification of the time allocated to ingestion. Feed-ing may also be identified in other animals, as preycapture attempts often form part of a relatively con-served behavioural sequence, such as predators thatpursue prey (Fig. 9) (Watanabe et al. 2005). Prey han-dling may also be identifiable to confirm when chaseswere successful. A diverse range of behaviours couldbe identified through the combination of static anddynamic elements; for instance, washing behaviourwas apparent in a cormorant as brief bouts of flappingwith the bird in a horizontal posture, followed by a‘ducking’ change in posture before the end of the bout(Fig. 8c,d). Digging and shaking are also likely to pro-duce distinctive acceleration patterns. Software is cur-rently being constructed that enables the visualisationof body posture and motion, as measured on the instru-mented animal, to facilitate the identification of behav-iours, even those as yet undescribed. The scale atwhich behaviour can be recognised (either visually orthrough the use of pattern recognition software) islikely to be improved by the combination of accelera-tion signals with visual observations. This may ulti-mately enable researchers to distinguish patterns suchas those associated with the selection of food type, thusenabling the calculation of net energy gain per unittime, even in taxa with characteristically variable diets.
In summary, animal-attached accelerometers can beused to identify a wide range of behaviour patterns byproviding quantitative data on body posture andmotion. This yields data on the occurrence and intensi-ties of behaviour with excellent resolution. Clues to thepossible function of such behaviour patterns may alsobe available from the time they occurred or thesequence of behavioural changes. Furthermore, suchdata may be used to allude to activity-specific meta-bolic rate, where recorded in 3 axes. This requires a
57
0 1 2 3 4Time (s)
5 6 7 8
–2
–1
0
1
2
–2
–1
–2
–1
0
1
2
0
1
2
Hea
ve (g
)
Sur
ge (g
)
Sw
ay (g
)
(a) (b) (c)
Fig. 7. Ovis musimon. Total acceleration (in g) for a malemouflon whilst (a) motionless (b) charging or (c) head-butting
another male
Endang Species Res 10: 47–60
calibration with energy expenditure for the study spe-cies in question, as well as measurements of the neces-sary environmental parameters (Wilson et al. 2006).Such information can be used in specific conservationproblems both at an individual level, for instance, inmonitoring behaviour of captive-bred individualsfollowing release (Sutherland 1998), or scaled-up toestimate area-use at the population level throughmultiple device deployments, to assess behaviouralresponses to changes in the environment, land-usepractice (including restoration, Caro 2007), and levelsof exploitation.
Acknowledgements. E.L.C.S. is funded by a NERC stu-dentship (award number NER/S/A/2005/13416A). Devicedevelopment and deployments in Buenos Aires Zoo weresupported by a Rolex Award for Enterprise, awarded to R.P.W.All the requisite local permits were acquired to work with
58
?
0
0–0.5
0.0
0.5
1.0
1.5
–0.5
0.0
0.5
1.0
1.5
0.0
0.5
1.0
1.0
0.5
0.0
–0.5
1.0
0.5
0.0
–0.5
1.5
–0.5
0.0
0.5
1.0
1.5
1 2 0 5 10 15
–2
–2
–1
–1
0
0
1
1
2
–2
–1
0
1
2
–2
–1
0
1
22
–2
–1
0
1
2
–2
–1
0
1
2
1Time (min)
(a) (b)
(d)(c)
Sw
ay (g
)H
eave
(g)
Sur
ge (g
)
Sw
ay (g
)H
eave
(g)
Sur
ge (g
)
Time (s)0 5 10 15
Fig. 8. Lama guanicoe and Phalacrocorax atriceps. Total acceleration (in g) for (a) a guanaco over periods when the head wasdown (surge ≤0) and there was little dynamic acceleration when the animal was grazing, interspersed with walking (mean surge= 0.5, rhythmic increases in dynamic acceleration), as shown in greater detail in (b). (c) A cormorant washing at the water surface;its horizontal posture is evident in the mean values of heave (1 g) and surge (0 g), and the sudden increases in heave are
indicative of wing-beats; shown in greater detail in (d)
0
–1
–1
walk chase trot
0
0
12
–1
0
1
2
2 4 6 8 10Time (s)
Sw
ay (g
)S
urg
e (g
)
Hea
ve (g
)
12 14 16
Fig. 9. Acinonyx jubatus. Total acceleration in 3 axes for acheetah before, during and after chasing bait that was
dragged by a moving vehicle
Shepard et al.: Behavioural categorisation using accelerometry
wild and captive individuals. We are indebted to Dr. MiguelRivolta, the veterinary staff and animal keepers at BuenosAires Zoo for all their help with the captive deployments. Wealso thank the Organismo Provincial de Turismo for the per-mits to work in Punta León, and the Centro Patagónico (Con-icet) for institutional support. Badger data were supplied bythe Wildlife Conservation Research Unit, with thanks also toChristina Buesching, the Peoples Trust for Endangered Spe-cies and the Earthwatch Institute for their generous support.We are also grateful to Dr. Samuel Gruber and Bimini Biolog-ical Field Station for logistical support with work on lemonsharks, Steve Garner and WIMARCS for help with deploy-ments on leatherback turtles, and Prof. Molly Lutcavage forthe use of the leatherback turtle data. Deployments on chee-tahs would not have been possible without the help of Dr.Mark Jago, Dave Houghton and Carla Conradie at Africat,and Dr. Emma Lee, Schalk van der Merwe and MarliceJansen van Vuuren at the Harnas Wildlife Foundation. Weare grateful for the comments of 3 anonymous referees, whichgreatly improved the manuscript.
LITERATURE CITED
Alexander RM (1983) Animal mechanics. Blackwell ScientificPublications, Oxford
Alexander RM (1984) The gaits of bipedal and quadrupedalanimals. Int J Robot Res 3:49–59
Amlaner CJ, Macdonald DW (1980) (eds) A handbook onbiotelemetry and radio tracking. Pergamon Press, Oxford
Barrey E, Desbrosse F (1996) Lameness detection using anaccelerometric device. Pferdeheilkd 12:617–622
Bolger DT, Newmark WD, Morrison TA, Doak DF (2008) Theneed for integrative approaches to understand and con-serve migratory ungulates. Ecol Lett 11:63–77
Buesching CD, Macdonald DW (2004) Variations in object-marking activity and over-marking behaviour of Europeanbadgers (Meles meles) in the vicinity of their setts. ActaTher 49:239–246
Caro T (2007) Behavior and conservation: a bridge too far?Trends Ecol Evol 22:394–400
Carter SP, Delahay RJ, Smith GC, Macdonald DW and others(2007) Culling-induced social perturbation in Eurasianbadgers Meles meles and the management of TB in cattle:an analysis of a critical problem in applied ecology. Proc RSoc Lond B Biol Sci 274:2769–2777
Cavagna GA, Saibene F, Margaria R (1963) External work inwalking. J Appl Physiol 18:1–9
Clutton-Brock TH, O’Riain MJ, Borotherton PNM, Gaynor D,Kansky R, Griffin AS, Manser M (1999) Selfish sentinels incooperative mammals. Science 284:1640–1644
Cooke SJ, Hinch SG, Wikelski M, Andrews RD, Kuchel LJ,Wolcott TG, Butler PJ (2004) Biotelemetry: a mechanisticapproach to ecology. Trends Ecol Evol 19:334–348
Culik B, Wilson RP, Bannasch R (1994) Underwater swimmingat low energetic cost by pygoscelid penguins. J Exp Biol197:65–78
Currey JD (1984) The mechanical adaptations of bones.Princeton University Press, Princeton
Fossette S, Corbel H, Gaspar P, Le Maho Y, Georges JY (2008)An alternative technique for the long-term satellite track-ing of leatherback turtles. Endang Species Res 4:33–41
Gómez Laich A, Wilson RP, Quintana F, Shephard ELC (2008)Identification of imperial cormorant Phalacrocorax atriceps be-haviour using accelerometers. Endang Species Res 10:29–37
Gremillet D, Pichegru L, Siorat F, Georges JY (2006) Conserva-tion implications of the apparent mismatch between popu-
lation dynamics and foraging effort in French northern gan-nets from the English Channel. Mar Ecol Prog Ser 319:15–25
Halsey LG, Shepard ELC, Hulson CJ, Venables MC, WhiteCR, Jeukendrup AE, Wilson RP (in press) Accelerationversus heart rate for estimating energy expenditure andspeed during locomotion in animals: tests with an easymodel species, Homo sapiens. Zoology
Hart BL (1988) Biological basis of the behavior of sick animals.Neurosci Biobehav Rev 12:123–137
Herren R, Sparti A, Aminian K, Schutz Y (1999) The predic-tion of speed and incline in outdoor running in humansusing accelerometry. Med Sci Sports Exerc 31:1053–1059
Jedrzejewski W, Schmidt K, Theuerkauf J, Jedrzejewska B,Okarma H (2001) Daily movements and territory use byradio-collared wolves (Canis lupus) in BialowiezaPrimeval Forest in Poland. Can J Zool 79:1993–2004
Kato A, Ropert-Coudert Y, Gremillet D, Cannell B (2006)Locomotion and foraging strategy in foot-propelled andwing-propelled shallow-diving seabirds. Mar Ecol ProgSer 308:293–301
Kawabe R, Nashimoto K, Hiraishi T, Naito Y, Sato K (2003a)A new device for monitoring the activity of freely swim-ming flatfish, Japanese flounder Paralichthys olivaceus.Fish Sci 69:3–10
Kawabe R, Kawano T, Nakano N, Yamashita N, Hiraishi T,Naito Y (2003b) Simultaneous measurement of swimmingspeed and tail beat activity of free-swimming rainbowtrout Oncorhynchus mykiss using an acceleration data-logger. Fish Sci 69:959–965
Macdonald DW, Newman C (2002) Badger (Meles meles)population dynamics in Oxfordshire, UK. Numbers, den-sity and cohort life histories, and possible role of climatechange in population growth. J Zool (Lond) 256:121–138
Marker LL, Muntifering JR, Dickman AJ, Mills MGL, Mac-donald DW (2003) Quantifying prey preferences of free-ranging Namibian cheetahs. S Afr J Wildl Res 33:43–53
Martin P, Bateson G (2007) Measuring behaviour: an intro-ductory guide. Cambridge University Press, Cambridge
McClelland BE (1991) Courtship and agonistic behavior inmouflon sheep. Appl Anim Behav Sci 29:67–85
Nelson B (1980) Seabirds. Their biology and ecology. Hamlyn,London
Ogilvy CS, Dubois AB (1981) The hydrodynamic drag ofswimming bluefish (Pomatomus saltatrix) in differentintensities of turbulence variation with changes of buoy-ancy. J Exp Biol 92:67–85
Pennycuik CJ (1972) Animal flight, Vol 33. Hodder, LondonPonganis PJ, Ponganis EP, Ponganis KV, Kooyman GL, Gen-
try RL, Trillmich F (1990) Swimming velocities in otariids.Can J Zool 68:2105–2112
Randall DA, Marino J, Haydon DT, Sillero-Zuburi C and oth-ers (2006) An integrated disease management strategy forthe control of rabies in Ethiopian wolves. Biol Conserv131:151–162
Ropert-Coudert Y, Grémillet D, Ryan PG, Kato A, Naito Y, LeMaho Y (2004) Between air and water: the plunge dive ofthe Cape gannet Morus capensis. Ibis 146:281–290
Ropert-Coudert Y, Kato A, Wilson RP, Cannell B (2006) Forag-ing strategies and prey encounter rate of free-ranging lit-tle penguins. Mar Biol 149:139–148
Sato K, Naito Y, Kato A, Niizuma Y and others (2002) Buoy-ancy and maximal diving depth in penguins: Do they con-trol inhaling air volume? J Exp Biol 205:1189–1197
Sato K, Mitani Y, Cameron MF, Siniff DB, Naito Y (2003) Fac-tors affecting stroking patterns and body angle in divingWeddell seals under natural conditions. J Exp Biol 206:1461–1470
59
Endang Species Res 10: 47–60
Sato K, Watanuki Y, Takahashi A, Miller PJO and others(2007) Stroke frequency, but not swimming speed, isrelated to body size in free-ranging seabirds, pinnipedsand cetaceans. Proc R Soc Lond B Biol Sci 274:471–477
Schmidt-Nielsen K (1997) Animal physiology: adaptation andenvironment. Cambridge University Press, Cambridge
Schreer JF, Testa JW (1995) Statistical classification of divingbehaviour. Mar Mamm Sci 11:85–93
Shepard ELC, Wilson RP, Liebsch N, Quintana F, Gómez LaichA, Lucke K (2008) Flexible paddle sheds new light on speed:a novel method for the remote measurement of swim speedin aquatic animals. Endang Spec Res 4:157–164
Sutherland WJ (1998) The importance of behavioural studiesin conservation biology. Anim Behav 56:801–809
Svagelj W, Quintana F (2007) Sexual size dimorphism and sexdetermination by morphometric measurements in breed-ing imperial shags (Phalacrocorax atriceps). Waterbirds30:97–102
Tanaka H, Tagaki Y, Naito Y (2001) Swimming speeds andbuoyancy compensation of migrating adult chum salmonOncorhynchus keta revealed by speed/depth/accelerationdata logger. J Exp Biol 204:3895–3904
Taylor CR, Heglund NC, Maloiy GMO (1982) Energetics andmechanics of terrestrial locomotion. 1. Metabolic energy-consumption as a function of speed and body size in birdsand mammals. J Exp Biol 97:1–21
Tsuda Y, Kawabe R, Tanaka H, Mitsunaga Y, Hiraishi T,Yamamoto K, Nashimoto K (2006) Monitoring the spawn-ing behaviour of chum salmon with an acceleration datalogger. Ecol Freshw Fish 15:264–274
Walker BG, Boersma PD (2003) Diving behavior of Magel-lanic penguins (Spheniscus magellanicus) at PuntaTombo, Argentina. Can J Zool 81:1471–1483
Watanabe Y, Izawa M, Kato A, Ropert-Coudert Y, Naito Y(2005) A new technique for monitoring the detailedbehaviour of terrestrial animals: a case study with thedomestic cat. Appl Anim Behav Sci 94:117–131
Watanuki Y, Niizuma Y, Gabrielsen GW, Sato K, Naito Y(2003) Stroke and glide of wing-propelled divers: deep
diving seabirds adjust surge frequency to buoyancychange with depth. Proc R Soc Lond B Biol Sci 270:483–488
Watanuki Y, Takahashi A, Daunt F, Wanless S, Harris M, SatoK, Naito Y (2005) Regulation of stroke and glide in a foot-propelled avian diver. J Exp Biol 208:2207–2216
Watanuki Y, Wanless S, Harris M, Lovvorn JR, Miyazaki M,Tanaka H, Sato K (2006) Swim speeds and stroke patternsin wing-propelled divers: a comparison among alcids anda penguin. J Exp Biol 209:1217–1230
Wilson RP, Culik BM, Peters G, Bannasch R (1996) Divingbehaviour of gentoo penguins, Pygoscelis papua; factorskeeping dive profiles in shape. Mar Biol 126:153–162
Wilson RP, Putz K, Peters G, Culik B, Scolaro JA, CharrassinJB, Ropert-Coudert Y (1997) Long-term attachment oftransmitting and recording devices to penguins and otherseabirds. Wildl Soc Bull 25:101–106
Wilson RP, Ropert-Coudert Y, Kato A (2002) Rush and grabstrategies in foraging marine endotherms: the case forhaste in penguins. Anim Behav 63:85–95
Wilson RP, White CR, Quintana F, Halsey LG, Liebsch N, Mar-tin GR, Butler PJ (2006) Moving towards acceleration forestimates of activity-specific metabolic rate in free-livinganimals: the case of the cormorant. J Anim Ecol 75:1081–1090
Wilson RP, Shepard ELC, Liebsch N (2008) Prying into theintimate details of animal lives: use of a daily diary on ani-mals. Endang Species Res 4:123–137
Yoda K, Sato K, Niizuma Y, Kurita M, Bost CA, Le Maho Y,Naito Y (1999) Precise monitoring of porpoising behaviourof Adélie penguins determined using acceleration dataloggers. J Exp Biol 202:3121–3126
Yoda K, Naito Y, Sato K, Takahashi A, Nishikawa J, Ropert-Coudert Y, Kurita M, Le Maho Y (2001) A new techniquefor monitoring the behaviour of free-ranging Adélie pen-guins. J Exp Biol 204:685–690
Zijlstra W (2004) Assessment of spatio-temporal parametersduring unconstrained walking. Eur J Appl Physiol 92:39–44
60
Editorial responsibility: Brendan Godley,University of Exeter, Cornwall Campus, UK
Submitted: October 22, 2007; Accepted: February 8, 2008Proofs received from author(s): March 17, 2008