identification and correction of power quality …
TRANSCRIPT

DSpace Institution
DSpace Repository http://dspace.org
Power Systems Engineering Thesis
2020
IDENTIFICATION AND CORRECTION
OF POWER QUALITY PROBLEMS
USING DYNAMIC VOLTAGE
RESTORER CASE STUDY:
AMHARA-PLASTIC PIPE FACTORY
ALEMU, GETNET
http://hdl.handle.net/123456789/11696
Downloaded from DSpace Repository, DSpace Institution's institutional repository

Identification and Correction of Power Quality Problems/ July, 2020
BAHIR DAR UNIVERSITY
BAHIR DAR INSTITUTE OF TECHNOLOGY
SCHOOL OF RESEARCH AND POSTGRADUATE STUDIES
FACULTY OF ELECTRICAL AND COMPUTER ENGINEERING
IDENTIFICATION AND CORRECTION OF POWER QUALITY
PROBLEMS USING DYNAMIC VOLTAGE RESTORER
CASE STUDY: AMHARA-PLASTIC PIPE FACTORY
BY
GETNET ALEMU EWUNETIE
ADVISOR: - DR. TASSEW TADIWOSE
BAHIR DAR, ETHIOPIA
July 2020

Identification and Correction of Power Quality Problems/ July, 2020
Electrical Power Engineering Msc. Thesis I
IDENTIFICATION AND CORRECTION OF POWER QUALITY
PROBLEMS USING DYNAMIC VOLTAGE RESTORER (DVR)
BY
GETNET ALEMU EWUNETIE
A thesis submitted to the school of Research and Graduate Studies of Bahir
Dar Institute of Technology, BDU in partial fulfillment of the requirements
for the degree of master in the Power System Engineering in the Faculty of
Electrical and Computer Engineering.
ADVISOR: DR. TASSEW TADIWOSE
BAHIR DAR, ETHIOPIA
July 2020
Identification and Correction of Power Quality Problems/ July, 2020
Electrical Power Engineering Msc. Thesis II

Identification and Correction of Power Quality Problems/ July, 2020
Electrical Power Engineering Msc. Thesis III
©July, 2020
GETNET ALEMU EWUNETIE
IDENTIFICATION AND CORRECTION OF POWER QUALITY
PROBLEMS USING DYNAMIC VOLTAGE RESTORER (DVR)
ALL IGHTS RESERVED

Identification and Correction of Power Quality Problems/ July, 2020
Electrical Power Engineering Msc. Thesis IV

Identification and Correction of Power Quality Problems/ July, 2020
Electrical Power Engineering Msc. Thesis V
Acknowledgments
First, I would like to thank the almighty God for his mercy and grace, which enabled me
to begin and complete successfully this research work.
Secondly, I would like to express my sincere and deepest appreciation to my advisor Dr.
Tassew Tadiwose for his advice, comments, guidance, suggestions and encouragement at
the start of the study up to the final work of this research. He read all the drafts of my thesis
and taught me to be thorough in analyzing problems. His patience and support have enabled
me to achieve my highest potential in both academic and professional work. This has been
an opportunity of a lifetime for which I am truly thankful.
I would like to extend my greatest gratitude to Amhara Plastic Pipe factory workers,
especially electrical department members who gave valuable data and information
throughout the study period.
I am very grateful to my loving and caring parents for their encouragement and everything
they have done for me throughout my academic career as well as their perpetual support
and blessing prayers, specially my father and mother.
Finally, I would also like to thank my classmates, especially Bahir Dar institute of
technology, electrical and computer engineering staffs for their support, Woldia university
for giving this opportunity, to Bahir Dar Institute of Technology (Electrical and computer
engineering faculty), and my friends to all those who have contributed, directly or
indirectly, in accomplishing this research work. throughout the entire time.

Identification and Correction of Power Quality Problems/ July, 2020
Electrical Power Engineering Msc. Thesis VI
Abstract
Electrical energy is one of the simplest used forms of energy and with the betterment of
technology, the dependency on the electrical energy has been increased rapidly. But, the
quality of power is affected by different internal and external factors. Power quality
problem is any power problems manifested in voltage, current, or frequency deviations that
result in failure or missed operation of utility or end user equipment, due to increasing
quantities of non-linear loads in the industries. Nowadays power quality problem is an issue
to the industrial customers. As a result, many of the industries in our country faced with
the problem of power quality, having various causes.
In This research work, power quality problem identifications and mitigation techniques
have been studied in Amhara pipe factory. The study focuses on investigating and
identifying the power quality problems of the industry. The data required for the study is
collected from the industry using power quality analyzer and from recorded data. Based on
the measurement the following data have been recorded, voltage sags which is less than
90% of the rms voltage, voltage unbalance of 3.214% and current distortions of THD value
that reach 44.63%.
The collected data have been analyzed and computer simulations are done using Mat
lab/Simulink model to show the effectiveness of mitigation techniques.
In this thesis dynamic voltage restorer is used to mitigate the problem of voltage unbalance
and the results shows that the device restores the decreased phase voltages to balanced
value. For voltage sag also dynamic voltage restorer is identified as a solution and the
results shows that the device restores the three phases from 190.5V, 195.2V, and 201.2 V,
respectively to 230 V. Single-tuned multi-branch filters that are 5th and 7th harmonic filters
are designed and simulated for the mitigation of harmonic distortion and the filters are
filtered out the harmonics and reduces the THD value from 44.63% to 0.14%.
Key Words: Power quality, power quality problem, APPF, Identification, correction,
MATLAB/Simulink, DVR. IEEE standards.

Identification and Correction of Power Quality Problems/ July, 2020
Electrical Power Engineering Msc. Thesis VII
Table of Content
Declaration .......................................................................................................................... ii
Acknowledgments.............................................................................................................. iv
Abstract .............................................................................................................................. vi
LIST OF FIGURES ............................................................................................................ x
LIST OF TABLES ............................................................................................................. xi
LIST OF ABBREVIATIONS ........................................................................................... xii
CHAPTER ONE ................................................................................................................. 1
1 INTRODUCTION ......................................................................................................... 1
1.1 Background ............................................................................................................. 1
1.2 Statement of The Problem ....................................................................................... 2
1.3 Objectives of The Thesis ......................................................................................... 3
1.3.1 General Objective ............................................................................................. 3
1.3.2 Specific Objectives ........................................................................................... 3
1.4 Significance of The Thesis ...................................................................................... 4
1.5 Scope and Limitations of the Study ........................................................................ 4
1.6 Methodology Used in This Thesis .......................................................................... 5
1.7 Organizations of The Thesis ................................................................................... 8
CHAPTER TWO ................................................................................................................ 9
2 POWER QUALITY PROBLEMS ASSESSMENT ...................................................... 9
2.1 REVIEW OF LITERATURE.................................................................................. 9
2.2 Site Description ..................................................................................................... 13
2.3 Power Quality Problems........................................................................................ 14
2.3.1 Transients........................................................................................................ 15
2.3.1.1 Impulsive Transients ............................................................................... 16
2.3.1.2 Oscillatory Transient ............................................................................... 16
2.3.2 Long-Duration Voltage Variations ................................................................. 17
2.3.2.1 Overvoltage .............................................................................................. 18
2.3.2.2 Under voltage ........................................................................................... 18
2.3.2.3 Sustained Interruptions ............................................................................ 19
Identification and Correction of Power Quality Problems/ July, 2020
Electrical Power Engineering Msc. Thesis VIII
2.3.3 Short-Duration Voltage Variations ................................................................. 19
2.3.3.1 Voltage Sags ............................................................................................ 20
2.3.3.2 Voltage Swells......................................................................................... 20
2.3.3.3 Interruption .............................................................................................. 21
2.3.4 Waveform Distortion ...................................................................................... 22
2.3.5 Flicker ............................................................................................................. 26
2.3.6 Power Frequency Variations .......................................................................... 27
2.3.7 Voltage Unbalance ......................................................................................... 27
2.4 Assessments of Power Quality Problems .............................................................. 28
2.4.1 Measuring Point .............................................................................................. 28
2.4.2 Measurement Results ...................................................................................... 30
2.4.2.1 Transients ................................................................................................. 30
2.4.2.2 Long Duration Voltage Variation ........................................................... 30
2.4.2.2.1 Overvoltage ......................................................................................... 30
2.4.2.2.2 Under voltage ...................................................................................... 31
2.4.2.2.3 Sustained Interruptions ....................................................................... 31
2.4.2.3 Short Duration Voltage Variations .......................................................... 32
2.4.2.3.1 Voltage Sag ......................................................................................... 32
2.4.2.3.2 Voltage Swell ...................................................................................... 33
2.4.2.3.3 Interruptions ........................................................................................ 33
2.4.2.4 Harmonics ............................................................................................... 34
2.4.2.4.1 Sources and Effect of Harmonics ....................................................... 36
2.4.2.5 Power Frequency Variation ..................................................................... 37
2.4.2.6 Voltage Unbalance .................................................................................. 39
2.4.2.6.1 Causes and Effects of Voltage Unbalance in the Industry.................. 41
2.4.2.7 Flicker...................................................................................................... 42
CHAPTER THREE .......................................................................................................... 44
3 THE EXISTING POWER QUALITY PROBLEMS AND MITIGATION
TECHNIQUES ................................................................................................................. 44
3.1 Voltage Sag Mitigation using Dynamic Voltage Restorer .................................... 44
3.1.1 Basic Configuration of DVR .......................................................................... 45
3.1.2 DVR Capacity, Specifications and Measured Values at The Factory. ........... 48
3.1.3 Cost and Payback Period of DVR .................................................................. 49
3.2 Harmonic Mitigations Using Harmonic Filters ..................................................... 50
CHAPTER FOUR ............................................................................................................. 62

Identification and Correction of Power Quality Problems/ July, 2020
Electrical Power Engineering Msc. Thesis IX
4 SIMULATION RESULTS AND DISCUSSIONS ...................................................... 62
4.1 Mitigation of Voltage Unbalance Problem ........................................................... 62
4.2 Mitigation of Voltage Sag ..................................................................................... 65
4.3 Mitigation of Harmonic Distortion ....................................................................... 68
CHAPTER FIVE .............................................................................................................. 71
5 CONCLUSIONS, RECOMMENDATIONS AND SUGGESTIONS ......................... 71
5.1 Conclusions ........................................................................................................... 71
5.2 Recommendations ................................................................................................. 72
5.3 Suggestions for Future Work ................................................................................ 72
Appendixes ....................................................................................................................... 73
Appendix A. Loads and sample interruptions .............................................................. 73
Appendix B. Power quality analyzer and Sample measurement data. .......................... 76
Appendix C. Electrical Simulink models for simulation .......................................... 79
Reference .......................................................................................................................... 82

Identification and Correction of Power Quality Problems/ July, 2020
Electrical Power Engineering Msc. Thesis X
LIST OF FIGURES
Figure 1.1. Basic steps involved in a power quality evaluation ....................................................... 7
Figure 2.1 Two 800KVA & one 1250KVA T/R ........................................................................... 14
Figure 2.2 single line diagram of Amhara plastic pipe factory with respective values ................. 14
Figure 2.3 Impulsive transient ....................................................................................................... 16
Figure 2.4 Oscillatory transient due to back-to-back capacitor switching ..................................... 17
Figure 2.5 Illustration of voltage sag ............................................................................................. 20
Figure 2.6 voltage sag and swell .................................................................................................... 21
Figure 2.7 DC Offset...................................................................................................................... 22
Figure 2.8 Notching ....................................................................................................................... 23
Figure 2.9 Noise ............................................................................................................................. 23
Figure 2.10 Voltage fluctuation ..................................................................................................... 26
Figure 2.11 Frequency Variations .................................................................................................. 27
Figure 2.12 Voltage unbalance ...................................................................................................... 28
Figure 2.13 Single line diagram of distribution center and measuring points ............................... 30
Figure 2.14 Power Frequency Variation ........................................................................................ 39
Figure 2.15 Percentage of Temperature Rise Due to Voltage Unbalance ..................................... 42
Figure 3.1 Location of DVR .......................................................................................................... 45
Figure 3.2 Single-line diagram of DVR connected in series with the feeder................................. 48
Figure 3.3. Insertion of DVR for voltage sag mitigation. .............................................................. 48
Figure 4.1.Voltage wave form when double-line to ground fault is created .................................. 63
Figure 4.2.Injected two-phase voltage by DVR ............................................................................. 63
Figure 4.3. Voltage with DVR when double-line to ground fault created ..................................... 64
Figure 4.4. Voltage wave form when single-line to ground fault is created .................................. 64
Figure 4.5. Voltage with DVR when single-line to ground fault created ...................................... 65
Figure 4.6. Voltage sag without DVR............................................................................................ 66

Identification and Correction of Power Quality Problems/ July, 2020
Electrical Power Engineering Msc. Thesis XI
LIST OF TABLES
Table 2.1 Sample Events for Short and Long Duration Voltage Variations .................................. 31
Table 2.2 Current distortion limits for distribution systems .......................................................... 34
Table 2.3 Voltage distortion limits ................................................................................................ 35
Table 2.4 Total current and voltage harmonic values of each phase ............................................. 36
Table 2.5 Frequency variation measurement results. ..................................................................... 37
Table 2.6 Measurement results of maximum voltage unbalances. ................................................ 39
Table 3.1 measured data of the APPF ............................................................................................ 52
Table 3.2 Evaluating Filter limit as compared with IEEE standard of 5th harmonic values ......... 57
Table 3.3 Evaluating Filter duty limit as compared with IEEE standard of 7th harmonics. .......... 60
Table 3.4 Design parameters of multi-branch harmonic filter ....................................................... 61

Identification and Correction of Power Quality Problems/ July, 2020
Electrical Power Engineering Msc. Thesis XII
LIST OF ABBREVIATIONS
ACDL Alternative Current Drive Load
ANSI American National Standards Institute
APPF Amhara Plastic Pipe Factory
ASD Adjustable speed drives
ATS Automatic Transfer Switch
CFP Compressor Fans and Pups Load
DVR Dynamic Voltage Restorer
EEP Ethiopian Electric Power
EEU Ethiopian Electric Utility
FACTS Flexible Alternative Current transmission systems
FFT Fast Fourier Transform
GTO Gate Turn-off Thyristor
HDPE High Density Poly Ethylene
IEC International Electro Technical Commission
IEEE Institute of Electrical and Electronics Engineers
IGBT Insulated gate Bipolar Transistor
IGCT Integrated Gate Commutated Thyristors

Identification and Correction of Power Quality Problems/ July, 2020
Electrical Power Engineering Msc. Thesis XIII
MATLAB Matrix Laboratory
MOSFET Metal Oxide Semiconductor Field Effect Transistors
NEMA National Electrical Manufacturers Association, USA
PCC Points of Common Coupling
PF Power Factor
PLCs programmable logic controllers
PQ power quality
PSL Pups for Spraying Load
PU per unit
PWM Pulse Width Modulation
RMS Root Mean Square
SCR Silicon-Controlled Rectifiers
SVCS static var compensators
TDD Total Demand Distortion
THD Total Harmonic Distortion
THDI Total Current Harmonic Distortion
THDU Total Voltage Harmonic Distortion
UPVC Unplasticized Poly Vinyl Chloride
VSC Voltage source convertor

Identification and Correction of Power Quality Problems/ July, 2020
Electrical Power Engineering Msc. Thesis XIV
VSD Variable Speed Drives
VSI voltage source invertor
KHz Kilo Hertz
CDVR Cost of dynamic voltage restorer
CVS Cost of voltage sag
NVS Number of voltage sag per year
VPCC Voltage at point of common coupling
T Fundamental Period Time
S Apparent power
MVA Mega Volt Ampere
MS Milliseconds
T(Year) Payback time
KJ Kilo Jules
KV Kilo Volt
KVA Kilo Volt Ampere
KVAR Kilo Volt Ampere Reactive
KW Kilo Watt

Identification and Correction of Power Quality Problems/ July, 2020
Electrical Power Engineering Msc. Thesis 1
CHAPTER ONE
1 INTRODUCTION
1.1 Background
Electrical energy is the most efficient and popular form of energy and the modern society
is highly dependent on the electric power. The quality of power is affected if there is any
deviation in the voltage, current or frequency values at which the power is being supplied.
Typical power quality problems are, especially in industries include harmonics, transients,
short-duration voltage variations, long duration voltage variations, voltage imbalance,
voltage fluctuations, and power frequency variations.[1]
Poor power quality can result in less productivity, lost and corrupt data, damaged
equipment and poor power efficiency. Power Quality is a broad term used to describe the
electrical power Performance.
Power quality problems and solutions of these problems are site dependent, so the power
quality assessment and mitigation techniques must have focused on industry areas that uses
sensitive loads. Non-linear loads like: switch mode power supplies used in both industrial
and commercial computers / microprocessors; variable speed drives (VSD) used in process
control; arcing device like welders and arc furnaces; silicon-controlled rectifiers (SCR)
used in air-conditioners; and basically, any electronic device which draws current in pulses
are termed to be non-linear loads. Now as per the new restructuring of Ethiopian Electric
Power Corporation, the corporation is split in to two companies namely Ethiopian Electric
Utility (EEU) and Ethiopian Electric Power (EEP) to supply sufficient and quality electric
power for the end-user [2].
Now a day, electric utilities, academic and research centers, and other end users of electric
power have been interested to concern about the quality of electric power. This is because
of mainly to high sensitivity of newer-generation load equipment to power quality
variations, the increasing application of harmonic-generating devices in power systems,

Identification and Correction of Power Quality Problems/ July, 2020
Electrical Power Engineering Msc. Thesis 2
increased awareness of end users about power quality issues, sever consequence of a single
fault in interconnected power systems, and given high attention on maximizing efficiency
and system performance. Electricity customers are exposed to power quality disturbances
and hence could suffer from critical financial losses because of these problems. Large
penetration of sensitive loads in industrial and commercial facilities has substantially
increased their susceptibility to power quality disturbances.
In Industries, especially at Amhara plastic pipe factory electric power interruption is
becoming a day to day circumstance. The drop of the voltage at the loads is causing early
failure of equipment, blackening of light bulbs, and decreased efficiency and performance
of machines. This study focused on identification and correction of power quality problems
of Amhara plastic pipe factory [3].
The power distribution system is made up of sub-transmission lines, power transformers,
distribution transformers, low voltage (LV) Lines, etc. Once the voltage has been lowered
at the distribution substation, the electricity flows to industrial, commercial, and residential
centers through the distribution system.
In industries, power quality is a growing concern that requires higher quality service due
to more sensitive electrical and electronic equipment. The effectiveness of a power system
is measured in terms of efficiency, service continuity or reliability, service quality in terms
of voltage profile and stability and power delivery system performance.
This research work is mainly concerned on power quality problems and solutions to the
identified problems in Amhara plastic pipe factory [4].
1.2 Statement of The Problem
The basic function of the power system is to provide an adequate electrical supply to its
customers as economically as possible at optimized level of quality. Electric power
interruption is highly frequent that industrial plants, governmental and non-governmental
organizations, business centers, commercial centers, residences and other electric power
users are facing challenges for the achievement of their goals.

Identification and Correction of Power Quality Problems/ July, 2020
Electrical Power Engineering Msc. Thesis 3
A small power outage has a great economic impact on the industrial consumers. A longer
interruption may harm practically all operations of the factory. Even though utilization of
harmonic generating devices is increasing from day to day, no emphasis is given to the
issue of harmonic distortions.
The motivating factor to work on this thesis is the occurrence of different power quality
problems in the industry. Voltage sags caused by short circuit faults occurred in the
industry power system resulting in failure of the breaker to trip in case of a fault detected
by the protective relays due to prolonged exposure of short circuit currents, the tripping of
controls to the dc drives, programmable logic controllers (PLCs) and the remote I/O units,
for instance, have been found to trip which leads to a partly shut down of production for
hours or even days leading to significant financial losses and reduction of efficiency and
life span of electrical equipments, particularly motors. Voltage unbalance due to the
presence of single-line to ground and double-line to ground faults. Because of increasing
non-linear loads and these non-linear loads injects current harmonics to the power system,
and these injected harmonics are dangerous for the utility and end users.
Different power quality problems with their causes and consequences have been analyzed
and evaluated. The study focused on appropriate mitigation techniques and found solutions
to the identified power quality problems, improving the power quality and profitability of
the industry.
1.3 Objectives of The Thesis
1.3.1 General Objective
The main objective of this research focuses on identifying or assessing electrical power
quality problems in Amhara plastic pipe factory and setting appropriate solutions.
1.3.2 Specific Objectives
The specific objectives of this study are:
Identify the major power quality problems that exists in the factory.

Identification and Correction of Power Quality Problems/ July, 2020
Electrical Power Engineering Msc. Thesis 4
Identify the causes and major impacts of the identified PQ problems,
Compare the level of those disturbances with acceptable values set by IEEE standards,
Designed and simulated voltage sag, voltage unbalance using DVR and harmonic
distortions mitigation techniques by single-tuned filter and made comprising with
IEEE standards.
Draw relevant conclusions and recommendation to the industry for practical
implementation and further work.
1.4 Significance of The Thesis
In this research work, power quality problems are identified and their mitigation techniques
are simulated, so that the significant is clearly observed, advantages and effectiveness of
DVR and single-tuned passive harmonic filter in power quality improvement for voltage
sag, voltage unbalance and current harmonics are studied respectively. If the industry
implements the solutions provided, it protects their equipment from the effect of different
power quality problems that result from system faults, and injection of harmonic currents
which arises from nonlinear loads and increases the efficiency and performance of the
equipment and it saves the money they lost which causes production loss, damage to
sensitive electronic devices and reduction of equipment efficiency. The study may also be
used as a reference for further researchers on similar areas.
1.5 Scope and Limitations of the Study
It is unlikely to go through all the industries that face poor power quality, due to finance,
capacity and time constraint, the study is limited on Amhara plastic pipe factory by
focusing identifying and correcting power quality problems because the factory is more
convenient for this study. It starts with study and investigates the power quality problems
and their impact to the power quality in electrical system.
The research work after identified the problems, only focuses on the major problem parts
to put the solutions. This research is done in modeling of DVR for voltage sag and voltage
unbalance problems and single-tuned passive harmonic filters for harmonic minimization
by MATLAB/Simulink on personal computer simulation only.

Identification and Correction of Power Quality Problems/ July, 2020
Electrical Power Engineering Msc. Thesis 5
1.6 Methodology Used in This Thesis
To achieve the aforementioned objectives, various tasks were performed as stated below:
First for gating brief and reliable information about power quality problems and mitigation
techniques, many published and unpublished works related to this study, are deeply
reviewed and analyzed. As sources of information books, conference papers, articles,
journals, lecture notes and other reading materials were employed.
Due to the nature of the study, it is started by reviewing literatures related to the
identification of power quality problems, causes of those problems, improvement
techniques, and economic impacts of power systems. Recent and important information
and data have been collected from the factory. The total task of data collection is
accomplished through direct measurement, from recorded data, equipment/wiring
specifications, and by asking the personnel who works on the specific area of concern.
The methodological approach of this study is quantitative that described in: -
Number
Percentage,
Graphs and charts etc.
Data have been collected from the load side of service transformer with respective ratings
of 4.45MVA, 15/0.4KV and 5% impedance.
The factory has two sections:
Old distribution system
New distribution system
Generally, the following methodology have been followed to conduct this research work:
Literature review: A number of published ideas about power quality problems,
identifications and mitigation techniques in books, papers, articles, journals and
lecture note materials have been reviewed.
Interview: Made an interview with electrical personnel to obtain detailed information
about power quality problems.

Identification and Correction of Power Quality Problems/ July, 2020
Electrical Power Engineering Msc. Thesis 6
Data collection: The power quality measurement is taken from the secondary of
service transformers of the industry using Power Quality Analyzer/Fluke 43B Which
is a portable device in which it fabricated for measurement. The device can measure
sags/swells, transients, phase-to-neutral true rms voltage on all three phases, single
phase current, total three phase power and single-phase power per, total three phase
power factor and single-phase power factor, reactive and apparent three phase system
power, frequency, voltage and current total harmonic distortions.
Data analysis: The collected data have been analyzed and compared to the IEEE
Standard 1159-1995.
Propose solutions: Appropriate solutions for power quality problems are established
accordingly.
Modeling and Simulation: Using MATLAB/Simulink software modeling and
simulation of power quality problems have been carried out for the modeled networks.
Analysis of the result: Analyzed the results of the simulation obtained from the
simulating software.
Conclusion, recommendation and suggestions for future work: Significant
approaches have made for generalization of the work, recommend for implementation
and suggest the limitations for future work.

Identification and Correction of Power Quality Problems/ July, 2020
Electrical Power Engineering Msc. Thesis 7
Figure 1.1. Basic steps involved in a power quality evaluation

Identification and Correction of Power Quality Problems/ July, 2020
Electrical Power Engineering Msc. Thesis 8
1.7 Organizations of The Thesis
This thesis is organized in five chapters. Those chapters are summarized as follows:
Chapter 1: Discusses the introduction part in which the background, problem statement,
objective, significance of the study, scope of the study and methodology are included.
Chapter 2: Power quality problems assessment:- Presents a literature survey on the work
accomplished on the area of several issues such as power quality problems, modeling
approaches for mitigations, smart approaches among different papers which are done
related research works, site description, the power quality evaluation procedures and
different types of power quality problems categorized by IEEE Standard 519-1995 in
conjunction with their causes and adverse effects on the power system, quality
measurement, and the measurement results are described along with the standard values.
Chapter 3: presents about existing power quality problems and mitigation techniques.
Chapter 4: Presents about simulation results and discussions
Chapter 5: -Presents conclusions, recommendations and suggest for future work.

Identification and Correction of Power Quality Problems/ July, 2020
Electrical Power Engineering Msc. Thesis 9
CHAPTER TWO
2 POWER QUALITY PROBLEMS ASSESSMENT
2.1 REVIEW OF LITERATURE
Power quality is defined as provision of voltages and system design so that user of electric
power can have utilized electric energy from the distribution system successfully, without
interference on interruption. The quality of power is affected if there is any deviation in the
voltage, current or frequency values at which the power is being supplied. IEEE Standard
1159 defines power quality as the concept of powering and grounding sensitive equipment
in a manner that is suitable for the operation of that equipment.
Power quality problems and its solutions are very important to electricity consumers at all
levels of usage. Sensitive equipment and non-linear loads are more common area in both
the industrial, commercial sectors and the domestic environment, voltage sag, voltage
unbalance and current harmonics are big problems in the case study power system. There
are many different methods to mitigate voltage sags and voltage unbalance, but the use of
a custom power device (DVR) is considered to be the most efficient method. DVR is a
Custom Power Device used to eliminate voltage disturbances. The voltage sag and swell
detection are the primary concerns to improve the power quality by dynamic voltage
restorer (DVR), is used to improve power quality more than other FACTS devices due to,
having the ability to control active power flow, having higher energy capacitive and
Smaller in size, it is cost effective [4] [5].
The following researches are some of the works that have done previously on power quality
problems and mitigation techniques.
S. Khalid et.al [2011] [6] Defines about power quality according to IEEE Standard 1159,
power quality is the concept of powering and grounding electronic equipment in a manner
that is suitable to the operation of the equipment and compatible with the premise wiring
system and other connected equipment.

Identification and Correction of Power Quality Problems/ July, 2020
Electrical Power Engineering Msc. Thesis 10
The paper critically discusses about the power quality problems, issues and related
standards, assessment of power quality issues and methods for its correction with giving a
thorough knowledge of harmonics, power quality indices, parameters effecting electric
power. This paper presented an innovative technology management by critical analyzing
about power quality problems, issues, related international standards, and their effect in
life and the corrective measures using different means. The corrective measures are also
discussed which can be remedy for power quality problems generated in different
equipment.
Saurabh Sahu et.al [2018] [7] Explained about power quality problem is an occurrence
manifested as a nonstandard voltage, current or frequency that results in a failure or a miss-
operation of end use equipment. Utility distribution networks, sensitive industrial loads,
and critical commercial operations all suffer from various types of outages and service
interruptions which can cost significant financial 1oss per incident based on process down-
time, lost production, idle work forces, and other factors. Using the two approaches to the
mitigation of power quality problems from customer or from utility side. First approach is
called load conditioning, which ensures that the equipment is less sensitive to power
disturbances, allowing the operation even under significant voltage distortion and the
second is utility conditioning to maintained the supply power. Custom power devices could
be the effective means to overcome some of the major power quality problems by the way
of injecting active or reactive power into the system by modeling of DVR devices.
Dharmendra Gour et.al [2015] [8] Deals that, the origin of events which affect quality of
power is mainly harmonic distortion in addition to voltage sag, swell, and other power
quality disturbances. Different types of filters are studied and used for power quality
improvement by concentrated on eliminating or reducing harmonics. Active power filter
and passive power filter are considered to improve power quality by reducing harmonics.
The high impedance imposed by the series active power filter is created by generating a
voltage of the same frequency that the current harmonic component that needs to be
eliminated. In addition to harmonic current compensation, Passive power filter provides

Identification and Correction of Power Quality Problems/ July, 2020
Electrical Power Engineering Msc. Thesis 11
reactive power compensation, dc bus voltage regulation and enhancing system
performance at large.
Zia Hameed et.al [2016] [9] Harmonic distortion is one of the major issues to maintain
the power quality. From the results shown that harmonics are removed by using active
shunt filters. Harmonics not only effects the power quality but also cut down the useful life
of the power apparatus. Harmonics is all time concern present in the fundamental signal.
Harmonics analysis is also very important to study all the effects. Innovative technology
management by critical analyzing about power quality problems, issues, related
international standards, and their effect in life and the corrective measures using different
means are presented.
Sandesh Jain et.al [2012] [10] Power quality is improved by power factor correction and
harmonic reduction in which voltage source inverter (VSI) is used that injects current in to
the system, which compensates the undesired load current. The filter circuit is incorporated
in to the system design to filter out the harmonics and supply the reactive power without
any interruptions. IEEE 519-1992, Recommended Practices and Requirements for
Harmonic Control in Electric Power Systems, established limits on harmonic currents and
voltages at the point of common coupling (PCC), or point of metering.
Manila Garg et.al [2015] [11] Power quality issues have become important to electricity
consumers at all levels of usage. Sensitive equipment and non-linear loads are now more
commonplace in both the industrial commercial sectors and the domestic environment. The
interest in Power Quality (PQ) is related to all three parties concerned with the power i.e.
utility companies, equipment manufacturers and electric power consumers. The power
quality survey is the first, and perhaps most important step in identifying and solving power
problems cited previously. In other words, it is thus designed to locate, identify and
eliminate the electrical disturbances which disrupt data collection networks. Different
mitigation equipment’s are used to improve power quality problems.

Identification and Correction of Power Quality Problems/ July, 2020
Electrical Power Engineering Msc. Thesis 12
Shweta Gupta et.al [2015] [12] Power Quality related issues are of most concern
nowadays. The widespread use of electronic equipment, such as information technology
equipment, power electronics such as adjustable speed drives (ASD), programmable logic
controllers (PLC), energy-efficient lighting, led to a complete change of electric loads
nature. Due to their non-linearity, all these loads cause disturbances in the voltage
waveform. Several studies have been made to evaluate the costs of PQ problems for
consumers. The assessment of an accurate value is nearly impossible; so, all these studies
are based on estimates. The mitigation of PQ problems may take place at different levels:
transmission, distribution and the end-use equipment.
Ogunboyo Patrick et.al [2018] [13] Describes investigations of poor voltages, causes and
large economic losses are analyzed. provides an investigative study on the typical 11/0.4
kV, low voltage electric power distribution network. The network was modelled with
standard network parameters for low voltage typical electric power distribution network
using MATLAB/Simulink Sim Power System tool box. The summary of the paper gives
recommendations on effective methods for enhancing voltage profile and correcting the
unbalanced voltage to an allowable standard.
Muhammad Rusli et.al [2015] [14] Deals the rise of harmonics in the 20 kV distribution
systems because of non-linear loads supplied by the distribution system. Two types of
harmonics are stated current harmonic distortion and voltage harmonics distortion. The
study discovered current total harmonic distortion that are injected into the 20 kV
distribution system reduced by using a harmonic filter. There are an active filter and passive
filter, with economic considerations passive filter is the best option to reduce the level of
harmonics in the 20 kV distribution system. By changing the power factor of 0.86 to 0.95,
individual harmonic distortion current 5th order can be reduced. Filter capacity needed to
compensate harmonic 5th order of electricity supplier (20 kV).
T.Thomas et.at [2019] [15] Explains about power quality problems and future works, thus
power system or main grid capacity to provide a clean and steady supply of electricity is

Identification and Correction of Power Quality Problems/ July, 2020
Electrical Power Engineering Msc. Thesis 13
known as power quality. Due to strong demand of electronic equipment, the progress of
electric power utilization and rising non- linear loads on electrical system network may
leads to many power quality related issues.
This paper summarizes the various power quality problems such as variation of voltage,
transient, harmonics, sags and swells, interruptions and harmonics. To solve these
problems, the better way is to restore the technology, selection of equipments with less
sensitivity and also the use of the interfacing devices. The considerable power quality
problems are voltage sag, voltage swell, fluctuations of voltage, voltage unbalance,
flickering, harmonic distortions, voltage dips, variations in frequency, very short
interruptions, electrical noise, under voltages, very long interruptions, etc. Harmonics is
one of the major power quality issue and is termed as the integer multiple of fundamental
frequency.
2.2 Site Description
Amhara plastic pipe factory is one of the plastic multifunction manufacturing industry,
which is found in the south west of Bahir Dar town. The factory is established in 2003 to
become one of the top five leading plastic industries in east Africa. To produce and sale
high quality products of Unplasticized Poly Vinyl Chloride (UPVC), High Density Poly
Ethylene (HDPE), and Geo membrane and constantly strive to meet customer needs and
expectations, enhancing its market share all over the region and to be preferred company
in domestic and export markets.
To produce the above products, the factory receives power via 15KV power lines from
Ethiopian electric power (North West region) and stepped down by service transformer to
400V. The power consumption of the factory is 2.85 MVA from two 800KVA & one
1250KVA step down transformers for UPVC, HDPE and Geo membrane sheet machines
and 1.6 MVA from two 800KVA step down transformers for green sheet and recycles
machines. Totally 4.45 MVA power is delivered by north west district EEU from the high
voltage side 15KV main air force distribution line.

Identification and Correction of Power Quality Problems/ July, 2020
Electrical Power Engineering Msc. Thesis 14
Figure 2.1 Two 800KVA & one 1250KVA T/R
15KV
15KV
400V
15/0.4KV
`
T4 T515/0.4KV
15/0.4KV15/0.4KV15/0.4KV
Load-1
Load-2 Load-3
Load-4
Load-5
Load-6
Load-7
Load-8
Load-9
Load-10 Load-11 Load-12
em em
em
New expansion line
Old distribution line
KVAR
400V
T1T2 T3
ATS
Automatic
transfer
switch
DB1
Distribution board 1
DB2
Distribution board
2
Figure 2.2 single line diagram of Amhara plastic pipe factory with respective values
2.3 Power Quality Problems
Power quality problem is any power problems manifested in voltage, current, or frequency
deviations that result in failure or missed operation of utility or end user equipment.

Identification and Correction of Power Quality Problems/ July, 2020
Electrical Power Engineering Msc. Thesis 15
The specific power quality problems that need to be evaluated will be different from
customer to customer. The types of equipment used by the end-user, process requirements
and economic impacts of problems will lead to a list of problems that need to be studied
[1] [4] [6].
According to IEEE Standard 1159-1995, power quality problems classified into seven
major categories described as follows [15] [6].
2.3.1 Transients
The term transient in the analysis of power system is to denote an event that is undesirable
and momentary in nature. This phenomenon is an aperiodic function of time and has a short
duration, is voltage or current surges [16].
Transients can be classified into two categories, impulsive and oscillatory. These terms
reflect the wave shape of a current or voltage transient and there are many causes that
transients can be produced in the power system. Such as:
Arcing between the contacts of the switches
Sudden switching of loads
Poor or loose connections
Lightening strokes
The following listed consequences are there because of Transients [17]:
Electronics devices are affected and show wrong results
Motors run with higher temperature
Failure of ballasts in the fluorescent lights
Reduce the efficiency and lifetime of equipment

Identification and Correction of Power Quality Problems/ July, 2020
Electrical Power Engineering Msc. Thesis 16
2.3.1.1 Impulsive Transients
An impulsive transient is a sudden, non-power frequency change in the steady state
condition of voltage, current or both, that includes unidirectional in polarity.
Impulsive transients are caused by lightning strikes and lightning strokes can occur due to
direct strike to a power line or from magnetic induction or capacitive coupling from strikes
on adjacent lines. Impulsive transients can excite the natural frequency of power system
circuits and produce oscillatory transients.[18]
2.3.1.2 Oscillatory Transient
An oscillatory transient is a sudden, non-power frequency change in the steady-state
condition of voltage, current or both, that includes both positive and negative polarity
values. An oscillatory transient consists of a voltage or current whose instantaneous value
changes polarity rapidly. It is described by its spectral content (predominate frequency),
duration, and magnitude. The spectral content subclasses in to high, medium, and low
frequency and the frequency ranges for these classifications are chosen to coincide with
common types of power system oscillatory transient phenomena.
Figure 2.3 Impulsive transient

Identification and Correction of Power Quality Problems/ July, 2020
Electrical Power Engineering Msc. Thesis 17
Oscillatory transients with a primary frequency component greater than 500 kHz and a
typical duration measured in microseconds (or several cycles of the principal frequency)
are considered high-frequency transients. These transients are often the result of a local
system response to an impulsive transient. A transient with a primary frequency component
between 5 and 500 kHz with duration measured in the tens of microseconds (or several
cycles of the principal frequency) is termed a medium frequency transient. Medium-
frequency transients can also be the result of a system response to an impulsive transient
[19].
A transient with a primary frequency component less than 5 kHz, and a duration from 0.3
to 50 ms, is considered a low frequency transient. This category of phenomena is frequently
encountered on utility sub transmission and distribution systems and is caused by many
types of events; the most frequent is capacitor bank energization [20].
2.3.2 Long-Duration Voltage Variations
Long-duration variations encompass root-mean-square (rms) deviations at power
frequencies for longer than 1 min. ANSI specifies the steady-state voltage tolerances
expected on a power system. A voltage variation is considered long duration when the
ANSI limits are exceeded for greater than 1 min [5].
Figure 2.4 Oscillatory transient due to back-to-back capacitor switching

Identification and Correction of Power Quality Problems/ July, 2020
Electrical Power Engineering Msc. Thesis 18
Long-duration variations can be either overvoltage or under voltages. The causes of these
variations are not the result of system faults, but
Human error
Improper functioning of protective equipment
Load variations in the system
System switching operations
Such variations are typically displayed as plots of rms voltage versus time.
This type of voltage variation leads to the stoppage of power completely for a period of
time until the fault is cleared. The long duration voltage variation may be either of an under
voltage, over voltage or sustained interruption as discussed below [6].
2.3.2.1 Overvoltage
An overvoltage is an increase in the rms ac voltage greater than 110 percent at the power
frequency for duration longer than 1 min. Overvoltage are usually the result of [11]:-
Switching off large load
Energizing a capacitor bank.
The consequences of overvoltage are:
The system is too weak for the desired voltage regulation
Voltage controls are inadequate.
Incorrect tap settings on transformers
2.3.2.2 Under voltage
An under voltage is a decrease in the rms ac voltage to less than 90 percent at the power
frequency for the duration of longer than 1 min [21].
Under voltages is the result of:
Switching on large loads
De-energizing (switching off) a capacitor bank
A cause of under voltage is availability of too much impedance in the power system.
Therefore, the terminal voltage drops too low under heavy load.

Identification and Correction of Power Quality Problems/ July, 2020
Electrical Power Engineering Msc. Thesis 19
Possible effects include
system shutdown
malfunctioning of certain equipment
equipment operation at reduced efficiency
2.3.2.3 Sustained Interruptions
When the supply voltage has been zero for a period of time in excess of 1 min, the long-
duration voltage variation is considered as sustained interruption.
Sustained interruptions can result from control [11] malfunction, faults, or improper
breaker tripping.
2.3.3 Short-Duration Voltage Variations
Short duration voltage variations include root mean square (rms) voltage variations at
power frequencies for a period of less than 1 minute.
The causes of these short duration voltage variations are-
Opening of an Automatic Re-closure
Lightening stroke or Insulation Flash over
Energization of large loads which require high starting currents
Intermittent loose connections in the power wiring.
Consequences:
The data storage system gets affected
There may be malfunction of sensitive devices like- PLC’s, ASD’s.
Based on the type of fault, the short duration voltage variation may be classified into
voltage sag (dip), voltage rise (swell), or interruption [22].

Identification and Correction of Power Quality Problems/ July, 2020
Electrical Power Engineering Msc. Thesis 20
2.3.3.1 Voltage Sags
It is a reduction in voltage outside the normal tolerance for a short time less than few
seconds, that is a decrease to between 0.1 and 0.9 p. u in rms voltage or current at the power
frequency for durations from 0.5 cycle to 1 min [23].
The magnitude of the reduction is between 10 percent and 90 percent of the normal (rms)
voltage [21].
Voltage sags are usually associated with: -
Starting of an electric motor, which draws more current
Faults in the power system
Sudden increase in the load connected to the system
Starting of large motors.
It reduces the energy being delivered to the end user, causes computers to fail, adjustable
speed drive to shut down, and motors to stall and over heat [22].
2.3.3.2 Voltage Swells
A swell is defined as an increase in voltage between 1.1 and 1.8 pu in rms voltage or
current at the power frequency for durations from 0.5 cycle to 1 min [7].
Causes:
De-energization of large load
Figure 2.5 Illustration of voltage sag

Identification and Correction of Power Quality Problems/ July, 2020
Electrical Power Engineering Msc. Thesis 21
Energization of a capacitor bank
Abrupt interruption of current
Change in ground reference on ungrounded phases
Consequences:
Electronic parts get damaged due to over voltage
Insulation breakdown
Overheating
2.3.3.3 Interruption
An interruption occurs when there is a reduction of the supply voltage or load current to
less than 0.1 PU for a duration not exceeding 1 minute. Interruptions are the result of
equipment failures, power system faults and control malfunctions.
The interruptions are measured by their duration since the voltage magnitude is always less
than 10 percent of nominal. The duration of an interruption due to a fault on the utility
system is determined by the operating time of utility protective devices. Delayed reclosing
of the protective device may cause a momentary or temporary interruption. The duration
of an interruption can be irregular when it is due to equipment malfunctions or loose
connections [24].
Figure 2.6 voltage sag and swell

Identification and Correction of Power Quality Problems/ July, 2020
Electrical Power Engineering Msc. Thesis 22
2.3.4 Waveform Distortion
Waveform distortion is a condition whereby a steady-state deviation of the voltage and/or
current waveform from an ideal sine wave of power frequency. There are generally five
types of waveform distortion, namely, dc offset, harmonics, interharmonics [8] notching
and noise.
i. DC Offset
DC offset is the presence of a dc current or voltage in an ac power system. This can occur
due to the effect of half-wave rectification. Direct current (DC) found in alternating current
networks can have a harmful effect. This can cause additional heating and destroy the
transformer.
ii. Interharmonics
Interharmonics are defined as voltages or currents having frequency components that are
not integer multiples of the frequency at which the supply system is designed to operate.
Interharmonics can be found in networks of all voltage classes [25]. The main sources of
interharmonic are cycloconverters, static frequency converters and arcing devices. It is
generally the result of frequency conversion activities and is often not constant; it varies
with load. Such interharmonics currents can excite quite severe resonances on the power
system as the varying interharmonics frequency becomes coincident with natural
frequencies of the system [26].
Figure 2.7 DC Offset

Identification and Correction of Power Quality Problems/ July, 2020
Electrical Power Engineering Msc. Thesis 23
iii. Notching
A periodic voltage disturbance caused by normal operation of power electronic devices
when current is commutated from one phase to another is notching. It tends to occur
continuously and can be characterized through the harmonic spectrum of the affected
voltage.
iv. Noise
Noise is defined as unwanted electrical signals with spectral content lower than 200 kHz
superimposed upon the power system voltage or current in phase conductors. Noise in
power systems can be caused by power electronic devices, control circuits, arcing
equipment, loads with solid-state rectifiers, and switching power supplies. Noise problems
are often exacerbated by improper grounding that fails to conduct noise away from the
power system.
Figure 2.8 Notching
Figure 2.9 Noise

Identification and Correction of Power Quality Problems/ July, 2020
Electrical Power Engineering Msc. Thesis 24
Basically, noise consists of any unwanted distortion of the power signal that cannot be
classified as harmonic distortion or transients. The problem can be mitigated by using
filters, isolation transformers, and line conditioners.
v. Harmonics
Harmonics is a growing problem for both electricity suppliers and users. Harmonic is
defined as a sinusoidal component of a periodic wave or quantity having a frequency that
is an integral multiple of the fundamental frequency usually 50Hz or 60Hz. Distorted
waveforms can be decomposed into a sum of the fundamental frequency and the
harmonics. Harmonic distortion originates in the nonlinear characteristics of devices and
loads on the power system [9].
Harmonics refers to both current and voltage harmonics. Harmonic voltages occur as a
result of current harmonics, which are created by nonlinear electronic loads. These
nonlinear loads will draw a distorted current waveform from the supply system [27]. Loads
like: -
Electric arc furnaces
Discharge lighting (such as fluorescent lamps)
Magnetic cores, such as transformer and rotating machines that require third
harmonic current to excite the iron
Adjustable speed drives used in fans
Blowers, pumps, and process drives can cause harmonic distortion.
The effect of harmonics in the power system includes: -
Corruption and loss of data
Overheating or damage to sensitive equipment
Overloading of capacitor banks.
Using the Fourier series expansion, we can represent a distorted periodic wave shape by its
fundamental and harmonics [28].

Identification and Correction of Power Quality Problems/ July, 2020
Electrical Power Engineering Msc. Thesis 25
( ) ( )
1
( ) sin( ) cos( ) (2.1)DC n s n c
n
U t U U nwt U nwt
The coefficients are obtained as follows:
2
( )0
1( )sin( ) (2.2)n sU u t n t d t
2
( )0
1( )cos( ) (2.3)n cU u t n t d t
2int ,Where nis an eger and T is fundamental period time
T
It is also common to use a single quantity, the total harmonic distortion (THD), as a
measure of the effective value of harmonic distortion. Mathematically, THD values of
voltage and current, THDU and THDI, respectively, are given as follows.
2
( )2
(1)
100 (2.4)nn
u
UTHD x
U
2
( )2
(1)
100 (2.5)nn
I
ITHD x
I
Effective value
2 2
(1)0
1( ) 1 (2.6)
T
RMS UU u t dt U THDT
2 2
(1)0
1( ) 1 (2.7)
T
RMS IU i t dt I THDT
For characterizing harmonic currents in a consistent fashion, [29] IEEE Standard 519-1992
defines another term, the total demand distortion (TDD). This term is the same as the total
harmonic distortion except that the distortion is expressed as a percent of some rated load

Identification and Correction of Power Quality Problems/ July, 2020
Electrical Power Engineering Msc. Thesis 26
current rather than as a percent of the fundamental current magnitude at the instant of
measurement [8].
2
2100 (2.8)
h
h
L
I
TDD xI
Where, 𝐼ℎ is the harmonic currents, 𝐼𝐿 is the rated load-current.
The development of current distortion limit is to:
Reduce the harmonic injection from each single load so that they will not cause
unacceptable voltage distortion levels for normal system characteristics.
Restrict the overall harmonic distortion of the system voltage supplied by the utility.
2.3.5 Flicker
The term flicker is derived from the impact of the voltage fluctuation on lamps such that
they are perceived by the human eye to flicker.
The flicker signal is measured by its rms magnitude expressed as a percent of the
fundamental whereas voltage flicker is measured with respect to the sensitivity of human
eye. It is possible for lamp to flicker if the magnitudes are as low as 0.5% and the
frequencies are in the range of 6 to 8 Hz. One common cause of voltage fluctuations on
utility transmission and distribution system is the arc furnace [30].
Figure 2.10 Voltage fluctuation

Identification and Correction of Power Quality Problems/ July, 2020
Electrical Power Engineering Msc. Thesis 27
2.3.6 Power Frequency Variations
Any deviation of the power system fundamental frequency from its nominal value (usually
50 or 60 Hz) is defined as power frequency variations.
The power system frequency is associated with the rotational speed of the generators
supplying the system. Frequency variations occur as the dynamic balance between load
and generation changes. Frequency variations can be the cause of faults on power
transmission system, large load being disconnected or a large source of generation going
off-line. Frequency variations usually occur for loads that are supplied by a generator
isolated from the utility system. The response to sudden load changes may not be sufficient
to adjust within the narrow bandwidth required by frequency sensitive equipment. Possible
effect could result in data loss, system crashes and equipment [31].
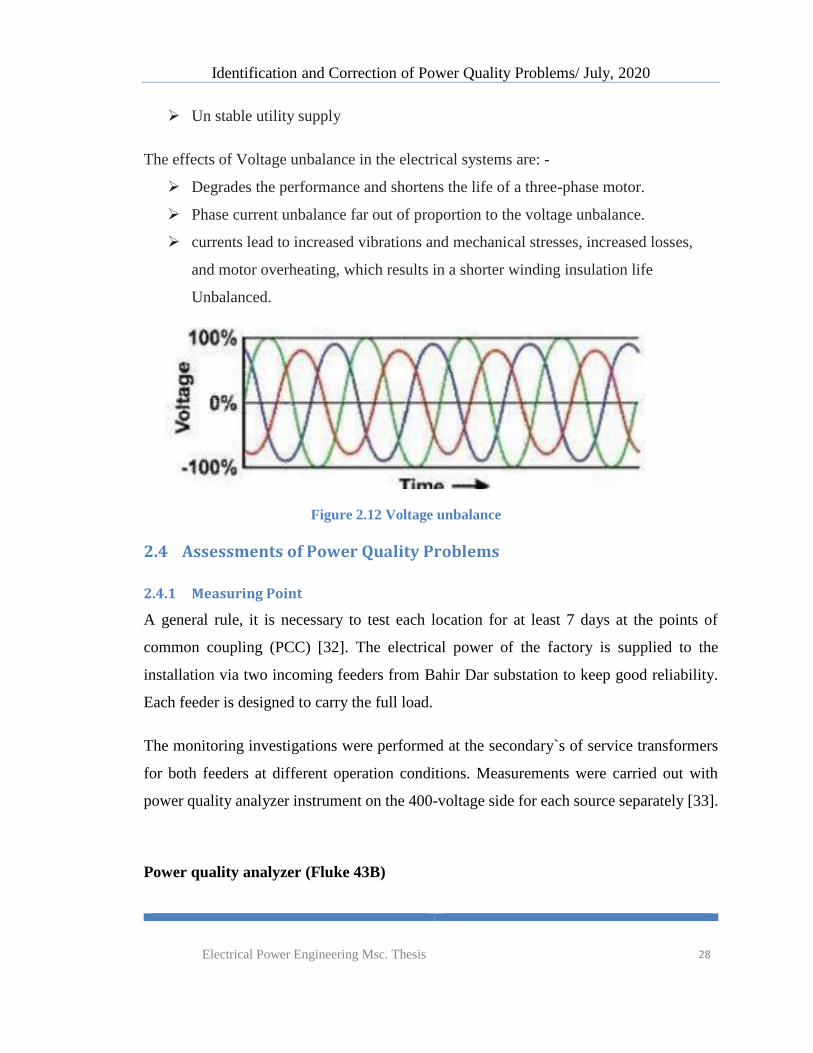
2.3.7 Voltage Unbalance
Voltage unbalance is non-equalization of the three phase voltages. It is a condition in which
the maximum deviation from the average of the three-phase voltages or currents, divided
by the average of the three-phase voltages or currents, expressed in percentage.
The primary source of voltage unbalances of less than 2 percent are: -
Single-phase loads on a three-phase circuit.
Blown fuses in one phase of a three-phase capacitor bank.
Single phasing conditions.
Unidentified single-phase to ground faults
Open circuit on the distribution system primary
Figure 2.11 Frequency Variations
Identification and Correction of Power Quality Problems/ July, 2020
Electrical Power Engineering Msc. Thesis 28
Un stable utility supply
The effects of Voltage unbalance in the electrical systems are: -
Degrades the performance and shortens the life of a three-phase motor.
Phase current unbalance far out of proportion to the voltage unbalance.
currents lead to increased vibrations and mechanical stresses, increased losses,
and motor overheating, which results in a shorter winding insulation life
Unbalanced.
2.4 Assessments of Power Quality Problems
2.4.1 Measuring Point
A general rule, it is necessary to test each location for at least 7 days at the points of
common coupling (PCC) [32]. The electrical power of the factory is supplied to the
installation via two incoming feeders from Bahir Dar substation to keep good reliability.
Each feeder is designed to carry the full load.
The monitoring investigations were performed at the secondary`s of service transformers
for both feeders at different operation conditions. Measurements were carried out with
power quality analyzer instrument on the 400-voltage side for each source separately [33].
Power quality analyzer (Fluke 43B)
Figure 2.12 Voltage unbalance

Identification and Correction of Power Quality Problems/ July, 2020
Electrical Power Engineering Msc. Thesis 29
The power quality measurement is taken from the secondary of service transformers of the
industry using Fluke 43B Power Quality Analyzer.
A “Fluke 43B Power Quality Analyzer” is a portable device utilized for measurement. The
device can measure true rms current per phase, power per phase, power factor per phase,
reactive and apparent three-phase system power, frequency, voltage and current total
harmonic distortion per phase.
Measured Quantities are: -
Transients
Voltage sag (dips) and swell.
Harmonics
Voltage unbalance
Apparent, active and reactive power
Power factor
Frequency deviations
Temperature
Measurements were carried out on the 400-voltage side of the secondary parts of service
transformer for one week and measurements were carried out under different operation
conditions at points of common coupling.

Identification and Correction of Power Quality Problems/ July, 2020
Electrical Power Engineering Msc. Thesis 30
Service Transformers
15,000/400V
400V Bus Bar
Monitoring Location
R S T NR S T
15KV Feeder
pcc
Figure 2.13 Single line diagram of distribution center and measuring points
2.4.2 Measurement Results
The equipment used for power quality measurement is Fluke 430/Fluke 43B Power Quality
Analyzer [3], the detail of the instrument is described in the Appendix. The equipment
measures the following power quality problems:
2.4.2.1 Transients
During the period of monitoring, impulsive transients are not seen because lightning
protection systems are installed at the substation and inside the industry and there is no
oscillatory transient detected by the measurements.
2.4.2.2 Long Duration Voltage Variation
2.4.2.2.1 Overvoltage
During the monitoring period, there is no significant overvoltage in the system.
Identification and Correction of Power Quality Problems/ July, 2020
Electrical Power Engineering Msc. Thesis 31
2.4.2.2.2 Under voltage
Throughout the measurement process, under voltage is not shown even if there is switching
off capacitor bank and switching on off large loads.
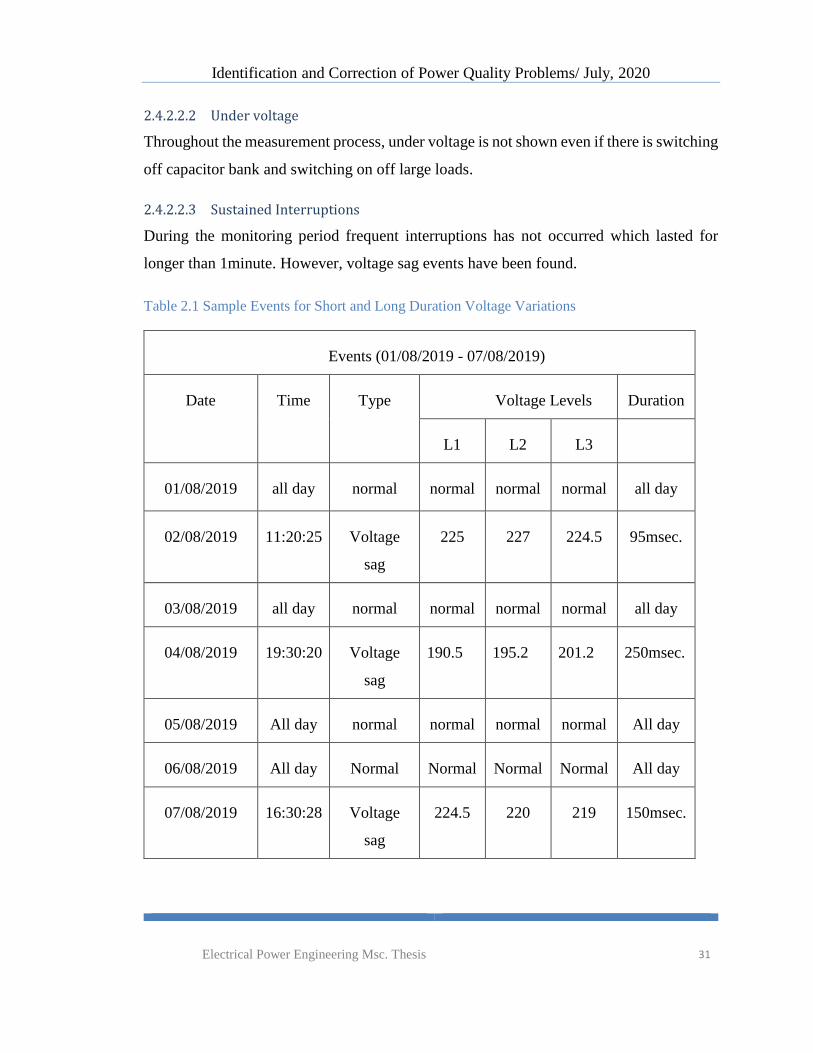
2.4.2.2.3 Sustained Interruptions
During the monitoring period frequent interruptions has not occurred which lasted for
longer than 1minute. However, voltage sag events have been found.
Table 2.1 Sample Events for Short and Long Duration Voltage Variations
Events (01/08/2019 - 07/08/2019)
Date Time Type Voltage Levels Duration
L1 L2 L3
01/08/2019 all day normal normal normal normal all day
02/08/2019 11:20:25 Voltage
sag
225 227 224.5 95msec.
03/08/2019 all day normal normal normal normal all day
04/08/2019 19:30:20 Voltage
sag
190.5 195.2 201.2 250msec.
05/08/2019 All day normal normal normal normal All day
06/08/2019 All day Normal Normal Normal Normal All day
07/08/2019 16:30:28 Voltage
sag
224.5 220 219 150msec.

Identification and Correction of Power Quality Problems/ July, 2020
Electrical Power Engineering Msc. Thesis 32
2.4.2.3 Short Duration Voltage Variations
Short-duration voltage variations cover root-mean-square (rms) deviations at power
frequencies for less than 1minute. In order to obtain good measuring data of short duration
voltage variations the measurements are taken at the secondary of the service transformer
for the duration of one week. The voltage variations under this category are mentioned as
follows.
2.4.2.3.1 Voltage Sag
During the measuring process in seven days duration for voltage dips & swells events as
showed in table 3.1, the voltage sag is detected on phase 1,2 and 3 and the voltage decreased
to 225V, 227V and 224.5V for duration of 95msec, 190.5V, 195.2V and 201.2V for
duration of 250msec and 224.5V, 220V, 219V for duration of 150msec and occurred on
the 2nd day at (11:20:25), 4th day at (19:30:20) and 7th day at (16:30:28) respectively. The
problem is caused by three-phase short circuit fault at the electrical system of the industry
and the occurrence of short circuit is recognized when the circuit breakers connected to the
machines trip to clear the fault. The complete data for the voltage sag is obtained from
annually recorded data and interview with the section head.
Therefore, it is necessary to find appropriate mitigation technique.
Effect of Voltage Sag on the Industry: Voltage sags are most occurrence event of all
other power quality disturbances. However, not as costly as interruptions, voltage sags are
much more dominant and, in some cases, may have the same impact as a supply
interruption. Relatively shallow voltage sags can lead to the disruption of manufacturing
processes due to equipment being unable to operate correctly at the reduced voltage levels.
Industrial equipment such as variable speed drives (VSD), PLCs and some control systems
are particularly sensitive to voltage sags. In many manufacturing processes, loss of only a
few vital pieces of equipment may lead to a full shut down of production; leading to
significant financial losses as well as the time taken to clean up and restart the process must
also be considered.

Identification and Correction of Power Quality Problems/ July, 2020
Electrical Power Engineering Msc. Thesis 33
Based on this recorded data when we discuss with the electrical department head of the
industry about the problem, he told me that short circuit faults are frequently occurred in
the industry due to insulation failure of windings, mechanical damage of wires and
improper wiring by technicians resulting in reduction of voltage profile, the problem of
voltage sag measured is an indicator for this event.
Electronic process controls, sensors, computer controls, PLC’s and variable speed drives,
even conventional electrical relays are all to some degree susceptible to voltage sags. In
many cases one or more of these devices may trip if there is a voltage sag to less than 90%
of nominal voltage even if the duration is only for one or two cycles i.e. less than 100
milliseconds. The time to restart production after such an unplanned stoppage can typically
be measured in minutes, hours or even days. Costs per event can be many tens of thousands
of dollars or birr. The resulting effect of voltage sag in the industry is failure of the breaker
to trip in case of a fault detected by the protective relays due to prolonged exposure of short
circuit currents, failure of sensors which check the single strip, the tripping of controls to
the dc drives, and programmable logic controllers (PLCs). It also reduces efficiency and
life span of electrical equipment, particularly motors.
2.4.2.3.2 Voltage Swell
It is an increase in rms voltage or current at the power frequency to between 1.1 and 1.8p.
u for durations from 0.5cycles to 1minute. During the measurement event, the problem of
voltage swell has not detected in any of the three phases.
2.4.2.3.3 Interruptions
An interruption occurs when there is a reduction of the supply voltage or load current to
less than 0.1 p. u for a duration not exceeding 1minute. In APPF, throughout the whole
survey, there has not been short-period interruption detected which lasted for a time
duration of less than one minute. Therefore, in the industry the occurrence of temporary
interruption is rare; as a result, no need to install equipment for mitigation of temporary
interruption.

Identification and Correction of Power Quality Problems/ July, 2020
Electrical Power Engineering Msc. Thesis 34
2.4.2.4 Harmonics
The main industry standard used for harmonics in power systems is IEEE Standard. 519-
1995. This standard has been developed through the IEEE Industry Applications Society
and the IEEE Power Engineering Society. Through the joint effort of these two societies,
IEEE Standards. 519-1995 suggests limits on the harmonic currents that a user can induce
back into the utility power system and also specifies the quality of the voltage that the
utility should supply the user. The table below lists the harmonic current limits based on
the size of the load with respect to the size of the power system to which the load is
connected. The ratio 𝐼𝑆𝐶
𝐼𝐿⁄ is the ratio of the short circuit current available at the PCC
[14] to the maximum fundamental load current. The standard suggests that the amount of
current taken by a facility would have bearing on the number of harmonics; it could
interrupt into the utility’s distribution system. The requirement of the utility to provide a
good quality of voltage is listed in table 2.2 from 120V to 69kV [6].
Table 2.2 Current distortion limits for distribution systems
Maximum harmonic current distortion (% of IL)
Individual harmonic order (Odd harmonics)
ISC/IL h<11 11≤h<17 17≤h<23 23≤h<35 35≤h TDD
<20* 4.0 2.0 1.5 0.6 0.3 5.0
20<50 7.0 3.5 2.5 1.0 0.5 8.0
50<100 10.0 4.5 4.0 1.5 0.7 12.0
100<1000 12.0 5.5 5.0 2.0 1.0 15.0
>1000 15.0 7.0 6.0 2.5 1.4 20.0
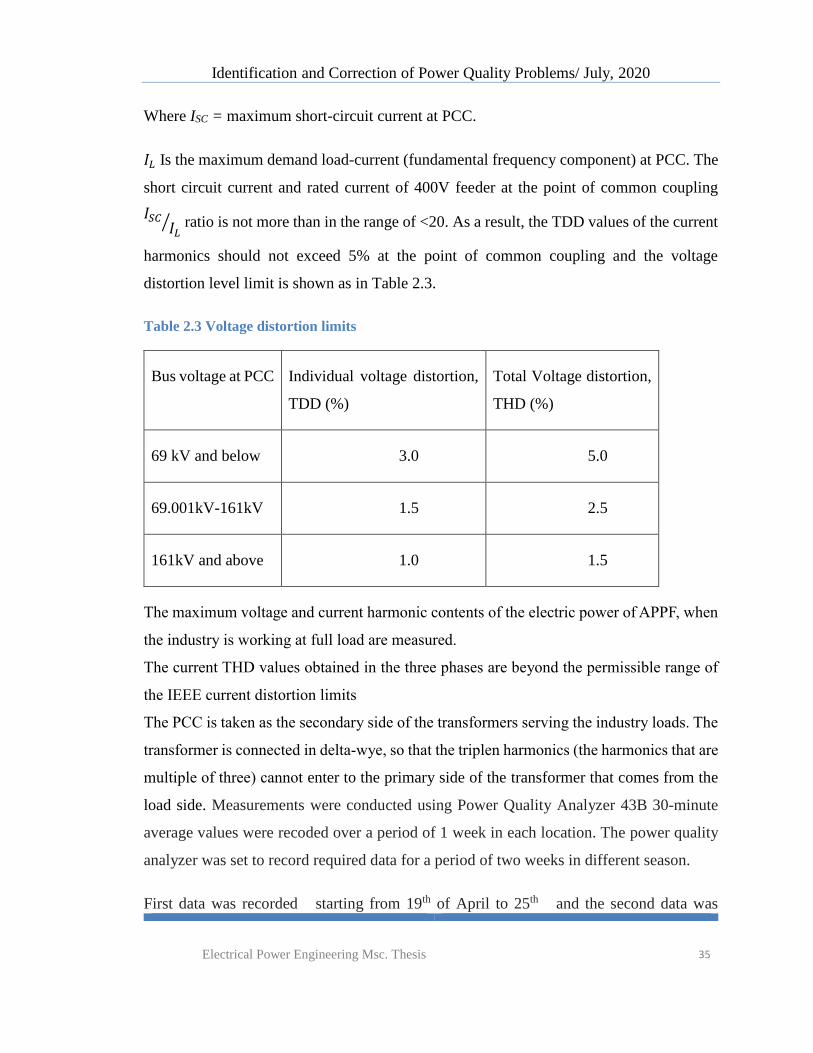
Identification and Correction of Power Quality Problems/ July, 2020
Electrical Power Engineering Msc. Thesis 35
Where ISC = maximum short-circuit current at PCC.
𝐼𝐿 Is the maximum demand load-current (fundamental frequency component) at PCC. The
short circuit current and rated current of 400V feeder at the point of common coupling
𝐼𝑆𝐶𝐼𝐿
⁄ ratio is not more than in the range of <20. As a result, the TDD values of the current
harmonics should not exceed 5% at the point of common coupling and the voltage
distortion level limit is shown as in Table 2.3.
Table 2.3 Voltage distortion limits
Bus voltage at PCC
Individual voltage distortion,
TDD (%)
Total Voltage distortion,
THD (%)
69 kV and below 3.0 5.0
69.001kV-161kV 1.5 2.5
161kV and above 1.0 1.5
The maximum voltage and current harmonic contents of the electric power of APPF, when
the industry is working at full load are measured.
The current THD values obtained in the three phases are beyond the permissible range of
the IEEE current distortion limits
The PCC is taken as the secondary side of the transformers serving the industry loads. The
transformer is connected in delta-wye, so that the triplen harmonics (the harmonics that are
multiple of three) cannot enter to the primary side of the transformer that comes from the
load side. Measurements were conducted using Power Quality Analyzer 43B 30-minute
average values were recoded over a period of 1 week in each location. The power quality
analyzer was set to record required data for a period of two weeks in different season.
First data was recorded starting from 19th of April to 25th and the second data was
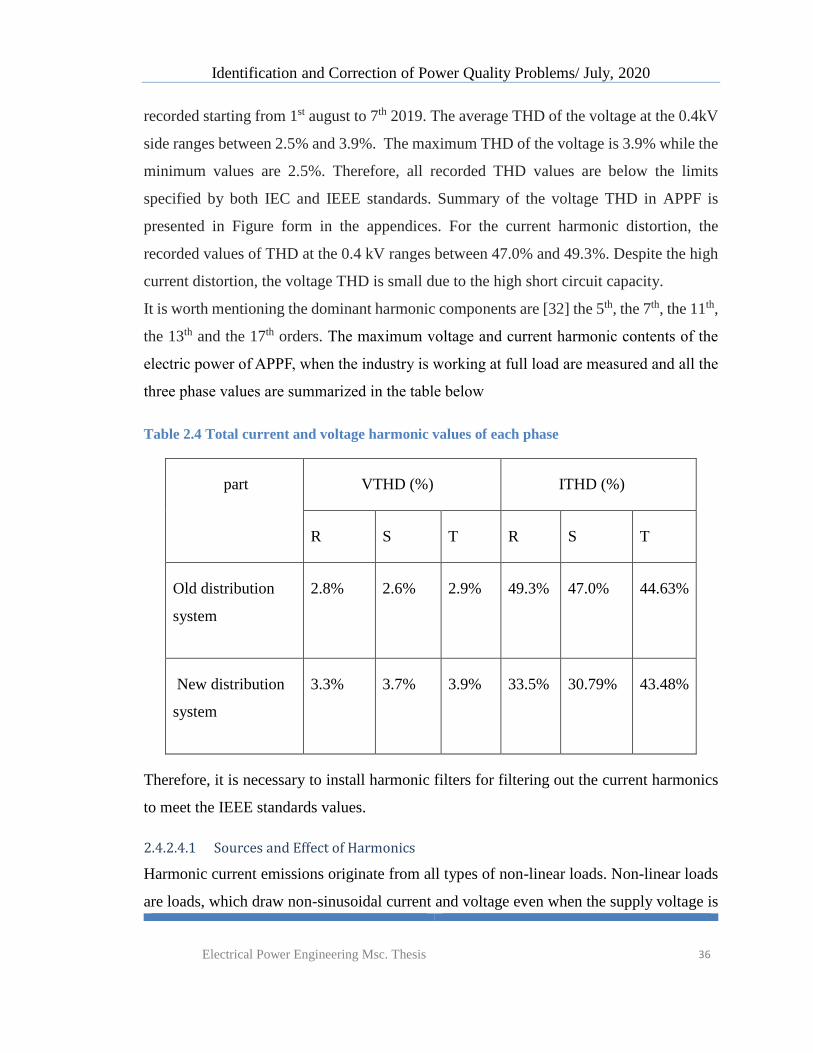
Identification and Correction of Power Quality Problems/ July, 2020
Electrical Power Engineering Msc. Thesis 36
recorded starting from 1st august to 7th 2019. The average THD of the voltage at the 0.4kV
side ranges between 2.5% and 3.9%. The maximum THD of the voltage is 3.9% while the
minimum values are 2.5%. Therefore, all recorded THD values are below the limits
specified by both IEC and IEEE standards. Summary of the voltage THD in APPF is
presented in Figure form in the appendices. For the current harmonic distortion, the
recorded values of THD at the 0.4 kV ranges between 47.0% and 49.3%. Despite the high
current distortion, the voltage THD is small due to the high short circuit capacity.
It is worth mentioning the dominant harmonic components are [32] the 5th, the 7th, the 11th,
the 13th and the 17th orders. The maximum voltage and current harmonic contents of the
electric power of APPF, when the industry is working at full load are measured and all the
three phase values are summarized in the table below
Table 2.4 Total current and voltage harmonic values of each phase
part VTHD (%) ITHD (%)
R S T R S T
Old distribution
system
2.8% 2.6% 2.9% 49.3%
47.0%
44.63%
New distribution
system
3.3%
3.7%
3.9% 33.5%
30.79%
43.48%
Therefore, it is necessary to install harmonic filters for filtering out the current harmonics
to meet the IEEE standards values.
2.4.2.4.1 Sources and Effect of Harmonics
Harmonic current emissions originate from all types of non-linear loads. Non-linear loads
are loads, which draw non-sinusoidal current and voltage even when the supply voltage is

Identification and Correction of Power Quality Problems/ July, 2020
Electrical Power Engineering Msc. Thesis 37
perfectly sinusoidal. Non-linear loads include saturated magnetic circuits, such as those in
power system transformers and rotating machines, arc furnaces, fluorescent lighting and of
course power electronic loads. Power electronic loads by far are the most significant
harmonic contributors relative to the amount of energy they draw. Specifically, fifth and
seventh harmonics are caused by static power converters used in adjustable speed drives
for motor control, switched mode power supplies and six-pulse static drives. Fifth and
seventh harmonics creates a negative and positive torque, respectively on motors running
from three-phase supply.
Current distortion resulted from non-linear loads have significant adverse effects on both
power system components and customer devices. These effects may result into permanent
damage of the devices. The effects of harmonics in the industry range from false or spurious
operations and trips of fuses and circuit breakers, overheating of transformers due to
increased copper and core losses. The harmful effects of harmonics on transformers often
unnoticed until an actual failure occurs and increased heating in motors due to additional
copper losses and iron losses in the stator winding, rotor circuit and rotor laminations.
2.4.2.5 Power Frequency Variation
The electric power network is designed to operate at a specified value of frequency that is
50Hz for our country. The frequency variations are caused if there is any imbalance in the
supply and demand. Large variations in the frequency are caused due to the failure of a
generator or sudden switching of loads.
Table 2.5 Frequency variation measurement results.

Identification and Correction of Power Quality Problems/ July, 2020
Electrical Power Engineering Msc. Thesis 38
S/No Time (24 Hr. format) Frequency (Hz) Frequency
Variation (Hz)
1 15:05:32 49.98 -0.02
2 05:37:05 50.00 +0.00
3 16:12:14 49.92 -0.08
4 03:55:15 50.1 +0.1
5 10:43:20 50.08 +0.08
6 13:37:26 50.09 +0.09
7 14:10:29 50.13 +0.13
8 16:46:53 49.87 -0.13
9 15:44:18 50.18 +0.18
10 10:31:04 49.94 -0.06
The permissible value of power frequency variations according to the IEEE standard for
normal operation is ±0.5 (49.5Hz to 50.5Hz at 50Hz nominal frequency), which is ±1%.
Based on this standard the measurement result shown above table 2.5 indicates that the
power frequency doesn’t vary much from the permissible limits.
Hence, the power frequency variation is not an issue for the industry and graphical
variations are shown in Figure 2.14.

Identification and Correction of Power Quality Problems/ July, 2020
Electrical Power Engineering Msc. Thesis 39
2.4.2.6 Voltage Unbalance
The unbalance in the voltage is defined as the situation where the magnitudes and phase
angles between the voltage signals of different phases are not equal [13]. The measured
values of maximum voltage unbalances at the industry to compute the percentage of
voltage unbalance at APPF has shown in Table 2.6 below.
Table 2.6 Measurement results of maximum voltage unbalances.
49.7
49.75
49.8
49.85
49.9
49.95
50
50.05
50.1
50.15
50.2
50.25
Freq
uen
cy c
han
ge(H
Z)
Time (hours)
Figure 2.14 Power Frequency Variation

Identification and Correction of Power Quality Problems/ July, 2020
Electrical Power Engineering Msc. Thesis 40
Voltage Measured values in (V)
Phase to neutral voltage V₁ 215.29
V₂ 224.7
Vᴈ 220.25
Phase to phase voltage V₁₋₂ 380
V₁₋ᴈ 396
V₂₋ᴈ 375
According to the NEMA (National Electrical Manufacturers Association of USA) standard
voltage unbalance is defined as the maximum deviation from the average of the three-phase
voltages or currents, divided by the average of the three-phase voltages or currents,
expressed in percentage, which is given by the following equation.
First calculate average value of phase to phase voltages,
1 2 1 3 2 3 (2.9)3
average
V V VV
380 396 375383.67
3averageV
Second, calculate the maximum deviation from the mean
1 2 380 383.67 3.67meanV V
1 3 396 383.67 12.33meanV V

Identification and Correction of Power Quality Problems/ July, 2020
Electrical Power Engineering Msc. Thesis 41
2 3 375 383.67 8.67meanV V
From the above deviations 12.33 is the largest deviation.
arg% *100 (2.10)
mean
L est deviationVoltage unbalance
V
12.33% *100 3.214
383.67Voltage unbalance %
As can be seen from the result the percentage of voltage unbalance is beyond the acceptable
limit imposed by the IEEE limit of 2%, therefore applicable mitigation method should be
implemented.
2.4.2.6.1 Causes and Effects of Voltage Unbalance in the Industry
Causes: Presence of large single-phase loads, faults arising in the system, such as single-
line or double-line to ground fault and the power supplied by the utility.
Consequences:
Presence of harmonics
Reduced efficiency of the system
Increased power losses
Reduce the life time of the equipment
Power loss will increase (𝐼2𝑅 losses) in the rotor and stator, which means more of the
supplied power will be converted to heat in the motor windings due to this, the motor will
run hotter and it breaks down winding insulation, consequently, the motor becomes less
efficient and damaged permanently. The main effects of voltage unbalance are decreased
motor efficiency and performance resulting in motor damage from excessive heat that
affects the company's profitability. Voltage unbalance can create a current unbalance 6 to
10 times the magnitude of voltage unbalance [35].
Here it is clear that the current unbalance can show the existence of current harmonics. The
percent of winding heat increase, expressed in degree Celsius, due to a voltage unbalance

Identification and Correction of Power Quality Problems/ July, 2020
Electrical Power Engineering Msc. Thesis 42
is exponential, and approximately increases by twice the square of the percent of voltage
unbalance. Mathematically,
2% 2*( ) (2.11)of temprature rise voltage unbalance
The percentage of voltage unbalance obtained in the industry using the measured data is
3.214%.
Therefore, the percentage of temperature rise will be:-
2 0% 2 (3.214 ) 20.67of tempraturerise x c
The result of the voltage unbalance of 3.214% is a motor winding running 20.67 hotter
than normal temperature. As percentage of voltage un balance increased then motor
temperature is also increased.
Figure 2.15 Percentage of Temperature Rise Due to Voltage Unbalance
Resistive loads are relatively unaffected by voltage unbalance, but it causes additional
heating/losses with three-phase motors. Variable speed drives (VSD) trip off due to an
increase in AC line currents caused by a compensation for the voltage unbalance [36].
2.4.2.7 Flicker
Voltage fluctuations can cause light intensity fluctuations that can be perceived by our
brains. This effect, popularly known as flicker, can cause great physiological discomfort.

Identification and Correction of Power Quality Problems/ July, 2020
Electrical Power Engineering Msc. Thesis 43
More precisely, flicker is the impression of unevenness of visual sensation induced by a
light motivation whose luminance or spectral distribution properly fluctuates with time.
Through the one-week investigation, the flicker has not occurred and seen in necked eye.
Thus, it is not measured, because it is not an issue for the industry.

Identification and Correction of Power Quality Problems/ July, 2020
Electrical Power Engineering Msc. Thesis 44
CHAPTER THREE
3 THE EXISTING POWER QUALITY PROBLEMS AND MITIGATION
TECHNIQUES
3.1 Voltage Sag Mitigation using Dynamic Voltage Restorer
Among the power quality problems (sags, swells, harmonics…) voltage sags are the most
severe disturbances. In order to overcome these problems, the concept of custom power
devices is introduced recently. One of those devices is the [34] Dynamic Voltage Restorer
(DVR), which is the most efficient and effective modern custom power device. The
function of the DVR will inject the missing voltage in order to regulate the load voltage
from any disturbance due to immediate distortion of source voltage.
A dynamic voltage restorer (DVR) is a solid-state inverter based on injection of voltage in
series with a power distribution system. The DC side of DVR is connected to an energy
source or an energy storage device, while its ac side is connected to the distribution feeder
by a three-phase inter facing injection transformer. A single line diagram of a DVR
connected power distribution system is shown in the figure (1). Since DVR is a series,
connected device, the source current, is same as load current. DVR injected voltage in
series with line such that the load voltage is maintained at sinusoidal nominal value. It is
normally installed in a distribution system between the supply and the critical load feeder
at the point of common coupling (PCC). Other than voltage, sags and swells compensation,
DVR can add other features like line voltage harmonics compensation, reduction of
transients in voltage and fault current limitations [35].
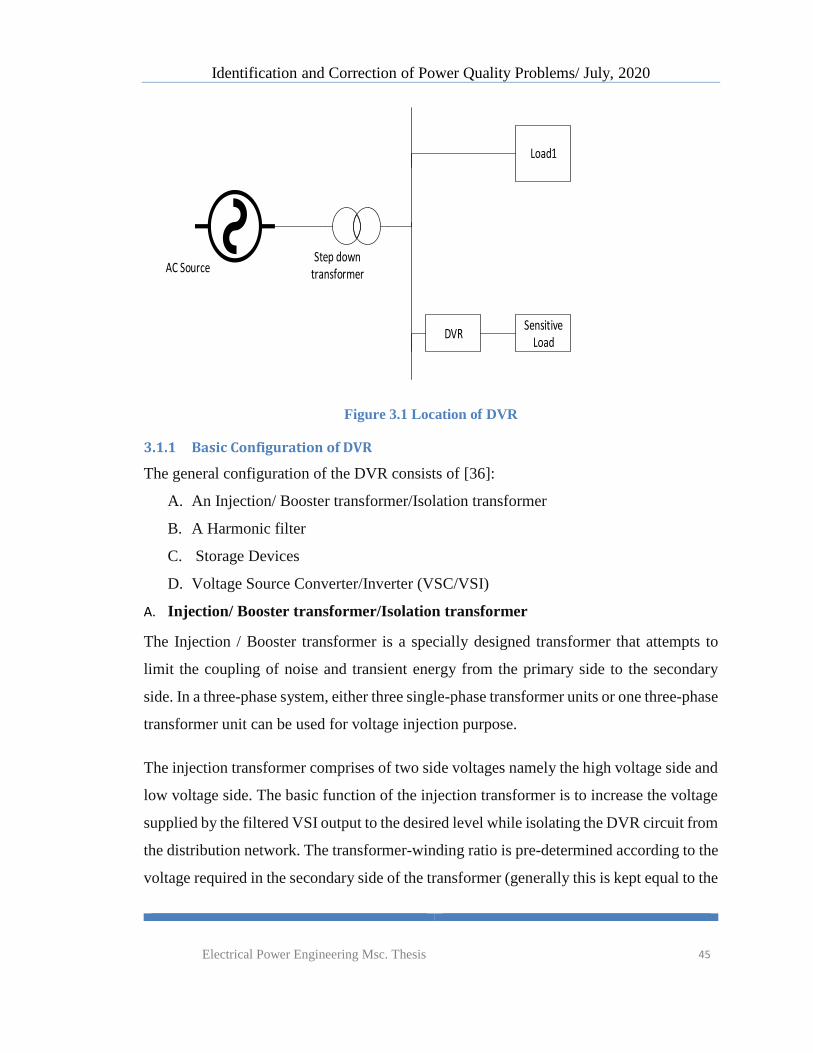
Identification and Correction of Power Quality Problems/ July, 2020
Electrical Power Engineering Msc. Thesis 45
Load1
DVRSensitive
Load
Step down transformerAC Source
Figure 3.1 Location of DVR
3.1.1 Basic Configuration of DVR
The general configuration of the DVR consists of [36]:
A. An Injection/ Booster transformer/Isolation transformer
B. A Harmonic filter
C. Storage Devices
D. Voltage Source Converter/Inverter (VSC/VSI)
A. Injection/ Booster transformer/Isolation transformer
The Injection / Booster transformer is a specially designed transformer that attempts to
limit the coupling of noise and transient energy from the primary side to the secondary
side. In a three-phase system, either three single-phase transformer units or one three-phase
transformer unit can be used for voltage injection purpose.
The injection transformer comprises of two side voltages namely the high voltage side and
low voltage side. The basic function of the injection transformer is to increase the voltage
supplied by the filtered VSI output to the desired level while isolating the DVR circuit from
the distribution network. The transformer-winding ratio is pre-determined according to the
voltage required in the secondary side of the transformer (generally this is kept equal to the

Identification and Correction of Power Quality Problems/ July, 2020
Electrical Power Engineering Msc. Thesis 46
supply voltage to allow the DVR to compensate for full voltage sag. A higher transformer-
winding ratio will increase the primary side current, which will adversely affect the
performance of the power electronic devices connected in the VSI. To evaluate the
performance of the DVR the rating of the injection transformer is an important factor that
need to be considered due to the compensation ability of the DVR is totally depend on its
rating. The DVR performance is totally depending on the rating of the injection
transformer, since it limits the maximum compensation ability of the DVR [8].
B. Harmonic filter [10].
The harmonic filters can be placed either on the high voltage side or the converter side of
the injection transformers. Filter unit consists of inductor (L) and capacitor (C). In DVR,
filters are used to convert the inverted PWM waveform into a sinusoidal waveform. This
can be achieved by eliminating the unwanted harmonic components generated by the VSI
action. Higher orders harmonic components distort the compensated output voltage. The
unnecessary switching harmonics generated by the VSI must be removed from the injected
voltage waveform in order to maintain an acceptable Total Harmonics Distortion (THD)
level.
C. Storage Devices
This is required to provide active power to the load during deep voltage sags. Lead-acid
batteries, flywheel or SMES can be used for energy storage. It is also possible to provide
the required power on the DC side of the VSI by an auxiliary bridge converter that is fed
from an auxiliary AC supply. The DVR need real power for compensation purpose during
voltage disturbance in the distribution system. In this case, the real power of the DVR must
be supplied by energy storage when the voltage disturbance occurs. The energy storage
such as battery is responsible to supply an energy source in D.C form.
D. Voltage Source Converter (VSC)/VSI
A VSC is a power electronic system consists of a storage device and switching devices,
which can generate a sinusoidal voltage at any required frequency, magnitude, and phase
angle. In the DVR application, the VSC is used to temporarily replace the supply voltage
or to generate the part of the supply voltage, which is missing. This could be a 3 phase - 3

Identification and Correction of Power Quality Problems/ July, 2020
Electrical Power Engineering Msc. Thesis 47
wires VSC or 3 phases - 4 wires VSC. The latter permits the injection of zero-sequence
voltages. Either a conventional two-level converter (Graetz Bridge) or a three-level
converter is used. There are four main types of switching devices: Metal Oxide
Semiconductor Field Effect Transistors (MOSFET), Gate Turn-Off thyristors (GTO),
Insulated Gate Bipolar Transistors (IGBT), and Integrated Gate Commutated Thyristors
(IGCT).
E. control and Protection system
The aim of the control system is to maintain voltage magnitude at the point where a
sensitive load is connected, under system disturbances. The harmonics is generated in the
load terminals using six pulse converters with fixed firing angle are connected to the main
drive nonlinear load which is parallel to the sensitive load. Voltage sag is created at load
terminals via a three-phase fault. The above voltage problems are sensed separately and
passed through the sequence analyzer. The control system of the general configuration
typically consists of a voltage correction method which determines the reference voltage
that should be injected by DVR.
The basic functions of a controller in a DVR are the following
a) Detection of voltage sag/swell events in the system
b) Computation of the correcting voltage
c) Generating of trigger pulses to the sinusoidal PWM based DC-AC inverter.
d) Correction of any anomalous (abnormality) in the series voltage injection.
e) Termination of the trigger pulses when the system has passed

Identification and Correction of Power Quality Problems/ July, 2020
Electrical Power Engineering Msc. Thesis 48
AC Voltage SourceSupply
Load1
Load2
Energy Storage Filter
Inverter
Sensitive Load
Injection Transformer
Source Impedance
Line Impedance
Step Down Transformer
DV
R
Figure 3.2 Single-line diagram of DVR connected in series with the feeder
DVRSensitive
Load
PCC (0.4KV)
Figure 3.3. Insertion of DVR for voltage sag mitigation.
3.1.2 DVR Capacity, Specifications and Measured Values at The Factory.
Referring to the electrical system of Amhara plastic pipe factory and measured values,
0.4ppcV kv
1250 , 0.98S KVA PF
75%.Maximumthree phase voltage sag response

Identification and Correction of Power Quality Problems/ July, 2020
Electrical Power Engineering Msc. Thesis 49
250 .Duration sag to protect ms
?KVACapacity of DVR
Re ( ) ?quired energy for DVR KJ
It is recommended to adopt DVR technology to compensate the [21] bus voltage sag and
restore to 100 % of the rated value. When the sag depth is lower than 75 %, therefore, the
compensating voltage of DVR should be 80 % or 0.8 PU.
By taking into consideration of peak load 1250 KVA with power factor of 0.98
0.8 1250 1000Thecompensation power x KVA KVA
Energy Power xTime
The duration of sag to protect is 250 msec. so,
( )The required energy KVA x PF xTime
3(1000 0.98) 250 10E x x x
245E KJ
For more reliability and availability DVR with (1100 KVA, 300 kJ) is selected. And it
should be installed in the 15-kV side of the system.
3.1.3 Cost and Payback Period of DVR
This section describes the cost and benefit analysis of installing DVR to mitigate voltage
sag.
cos DVRAssume t of DVR C
os sin VSC t of gle voltage sag C
VSNumber of sags per year N
( )payback period T year
Then,
DVR VS VSC C x N xT
$300 $300Cos 5%( )t of DVR
KVA KVA [operation and maintenance annual cost]
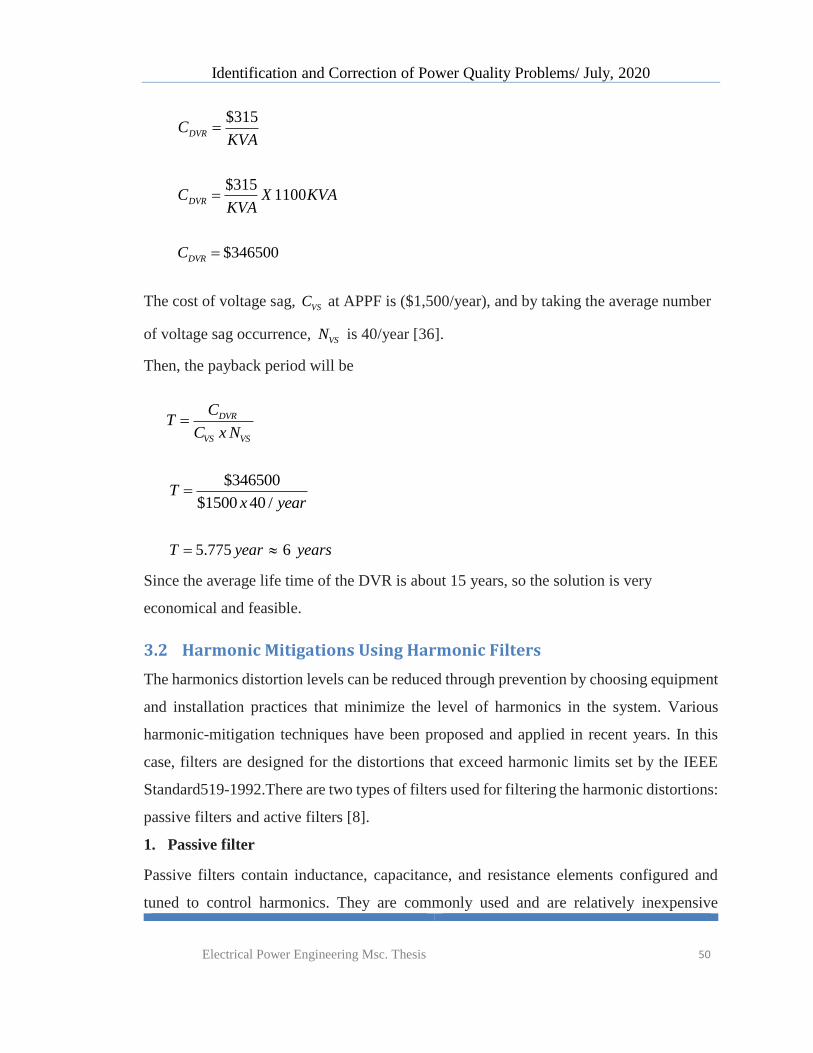
Identification and Correction of Power Quality Problems/ July, 2020
Electrical Power Engineering Msc. Thesis 50
$315
DVRCKVA
$315
1100DVRC X KVAKVA
$346500DVRC
The cost of voltage sag, VSC at APPF is ($1,500/year), and by taking the average number
of voltage sag occurrence, VSN is 40/year [36].
Then, the payback period will be
DVR
VS VS
CT
C x N
$346500
$1500 40 /T
x year
5.775 6T year years
Since the average life time of the DVR is about 15 years, so the solution is very
economical and feasible.
3.2 Harmonic Mitigations Using Harmonic Filters
The harmonics distortion levels can be reduced through prevention by choosing equipment
and installation practices that minimize the level of harmonics in the system. Various
harmonic-mitigation techniques have been proposed and applied in recent years. In this
case, filters are designed for the distortions that exceed harmonic limits set by the IEEE
Standard519-1992.There are two types of filters used for filtering the harmonic distortions:
passive filters and active filters [8].
1. Passive filter
Passive filters contain inductance, capacitance, and resistance elements configured and
tuned to control harmonics. They are commonly used and are relatively inexpensive

Identification and Correction of Power Quality Problems/ July, 2020
Electrical Power Engineering Msc. Thesis 51
compared with other means for eliminating harmonic distortion. They are employed either
to shunt the harmonic currents off the line or to block their flow between parts of the system
by tuning the elements to create a resonance at a selected frequency [28].
The most common type of passive filter is single-tuned notch filter which is the most
economical and frequently used. In the single-tuned filter circuit, a capacitor and inductor
are connected in series. This filter is also known as low pass filter. The filter is single-tuned
to present low impedance to a particular harmonic current. It is connected in shunt with the
power system there by diverting the harmonic currents from their normal flow path on the
line into the filter.
Notch filter can provide power factor correction in addition to harmonic suppression. The
first order high-pass filter, is not normally used, as it requires a large capacitor and has
excessive loss at fundamental frequency. The second order high-pass filter provides the
best filtering performance, but has higher fundamental frequency losses as compared with
the third order. The third order high-pass filter's [23] main advantage over second order is
a substantial reduction in fundamental frequency loss, owing to increased impedance at
that frequency caused by the presence of additional capacitor.
2. Active Filters
Active filters are relatively new types of devices for eliminating harmonics. They are based
on sophisticated power electronics and are much more expensive than passive filters. They
are designed to inject harmonic currents to counterbalance existing harmonic components
as they show up in the distribution system [37]. However, they have distinct advantage that
they do not resonate with the system. They can address more than one harmonic at a time
and combat other power quality problems such as flicker. They are particularly useful for
large, distorting loads from relatively weak points on the power system. Most of the time
active filters are used in very difficult situations when passive filters can`t operate
successfully because of the parallel resonance lies. Passive filters are more effective for
power system harmonic mitigation than active filters because it is less expensive [38].
3. Design of Multi-Branch Single-Tuned Filter

Identification and Correction of Power Quality Problems/ July, 2020
Electrical Power Engineering Msc. Thesis 52
This section illustrates a procedure for designing harmonic filters for industrial
applications. Passive filters always provide reactive compensation to a degree dictated by
the volt-ampere size and voltage of the capacitor bank used, they can in fact be designed
for the dual purpose of providing the filtering action and compensating power factor to the
desired level. These passive filters present very low impedance, with respect to line
impedance, at the tuning frequency, through which all current of that particular frequency
will be diverted.
Despite its reactive power compensation advantage, a single tuned shunt filter can only
eliminate a single current harmonic component. Therefore, a wide range generated
harmonic a single tuned filter is to be designed for each current harmonic to be suppressed
individually. This means multiple single-tuned filters are designed to eliminate multiple
harmonics [14]. The filter will be designed for 5th and 7th harmonics because these are the
dominant harmonic frequencies in the plant. Therefore, multiple-branch single tuned
harmonic filter is going to be designed. The harmonic filter designed according to the
appropriate equations.
A single tune filter will be designed to mitigate the fifth and seventh harmonic components.
The filter will be tuned slightly below 5th to allow for tolerances in the filter components
and variation in system impedance for fifth harmonic and the filter will be tuned below 7th
to allow for tolerance the filter components and variation in system impedance for seventh
harmonic. Furthermore, it minimizes the possibility of dangerous harmonic resonance in
case the parameters of system change and cause the tuning frequency to shift.
The recorded data of the power and power factor are given in table 3.1.
Table 3.1 measured data of the APPF

Identification and Correction of Power Quality Problems/ July, 2020
Electrical Power Engineering Msc. Thesis 53
Measured Data
S, KVA 709.73
P, KW 580.56
Q, KVAR 408.24
PF 0.86
As can be seen from the above table, the current power factor obtained is 0.86 and it is
required to improve this value around 0.98. The harmonic level of 5th and 7th are high and
should be eliminated.
Steps to determine the capacity of harmonic filters with single-tuned filters at 0.4 kV
bar.
Determine effective power capacity of filter reactive power.
The filter will provide reactive power to the system as a result the capacitor size should be
selected such that it will not cause overvoltage during the light load condition. The power
factor of the system should be improved from 0.86 to 0.98 lagging.
1 1
1 2Re (sin(cos ( ) sin(cos ( ))) 3.1quried Compensation fromthe filter S
1 1709.73(sin(cos (0.86)) sin(cos (0.98))) 220.936effQ KVAR
Where Qeff = reactive power to be compensated
Determination of harmonic duty requirements
The harmonic current that flow through the filter has two components: harmonic current
from utility and harmonic current produced by the nonlinear load.
The nonlinear load produces 18% of fifth harmonic and 13% of seventh harmonics of the
fundamental current [37],

Identification and Correction of Power Quality Problems/ July, 2020
Electrical Power Engineering Msc. Thesis 54
thus
( )( ) (3.2)
3 ( )h h
Rating KVAI I pu
x systemvoltage KV
5 5
( )( ) (3.3)
3 ( )
Rating KVAI I pu
x systemvoltage KV
7 7
( )( ) (3.4)
3 ( )
Rating MVAI I pu
x systemvoltage KV
5
709.730.18 184.393
3 0.4
KVAI A
x KV
7
709.730.13 133.173
3 0.4
KVAI A
x KV
The reactive power is distributed among 5th and 7th harmonic filters as follows:
2 3
, 2,3,... (3.5)...
hfh eff
IQ Q h
I I
5
5
5 7
(3.6)f eff
IQ Q
I I
5
184.393220.936 128.285
184.393 133.173f
AQ KVAR KVAR
A A
7
7
7 5
(3.7)f eff
IQ Q
I I
7
133.173220.936 92.651
133.173 184.393f
AQ KVAR KVAR
A A
Determine the frequency tuning filters
In accordance with IEEE 1531-1993, harmonic single tuned filter frequency is
determined in amount of 3%- 15% [37] below the determined frequency as safety factor.

Identification and Correction of Power Quality Problems/ July, 2020
Electrical Power Engineering Msc. Thesis 55
A. For 5th Harmonics
In this case, use tuning filter frequency of 6% (4.7)
Voltage across the capacitor
2
2( ) (3.8)
1
sc system
s
hV V
h
2
2
4.7( ) 400 418.9664.7 1
cV v v
The rate or standard voltage near this value is 480v.
The reactive power to be supplied by the capacitor is calculated as
5
2
2( ) (3.9)
1
sc f
s
hQ Q
h
2
2
4.7( )128.285 134.3144.7 1
cQ KVAR KVAR
The rated value near to this calculated value is 150kvar
Then,
2
(3.10)c ratedc
c rated
VX
Q
2(480)1.536
150 varcX
k
Reactors

Identification and Correction of Power Quality Problems/ July, 2020
Electrical Power Engineering Msc. Thesis 56
2( ) (3.11)c
L
s
XX
h
2
1.536( ) 0.069
4.7LX
RMS and peak value calculations
Let
1 1.536c cX X
1 0.069L LX X
then
5
1 1.5360.327
4.7
cc
s
XX
h
5 14.7 0.069 0.324L s LX h x X x
Determine RMS current value
2 2
1 (3.12)rms C chI I I
1
1 1
3( ) (3.13)
L L
c
c L
V
IX X
1
400
3( ) 157.4231.536 0.069
c
v
I A
2 2157.423 184.393 242.452RMSI A
Determine peak and RMS voltage
12( ) (3.14)c peak c chV V V
1 1 1 (3.15)c c cV X x I

Identification and Correction of Power Quality Problems/ July, 2020
Electrical Power Engineering Msc. Thesis 57
5(3.16)
hc ch cV X x I
50.327 184.393 60.295cV x v
2(241.802 60.297 ) 427.233peakcV v v v
2 2
1 (3.17)RMSc c chV V V
2 2241.802 60.297 249.207RMScV v
, ,var 3 3 , , ( ) (3.18)cap total RMS total Lk x I x kv cap RMS total
,var 3 242.452 3 0.249207 181.262 varcap totalk x x x k
Rated current
var 150 var180.422
3 0.480
ratedrated
L Lrated
k kI
kv x
Checking either the designed values are within the IEEE 18 recommended limits or not
for the 5th harmonics
,var 181.2620 varvar [ ] 121%
var 150 var
cap total
rated
k kk
k k
, 3 427.233[ ] [ ] 109%
2 480
L cap peak
rated peak
v x vpeak voltage
v x v
242.452[ ] [ ] 134%
180.422
RMS total
rated
IRMS current
I
( ) 3 249.207[ ] [ ] 90%
480
Lcap RMS total
rated
V xRMS Voltage
V
Table 3.2 Evaluating Filter limit as compared with IEEE standard of 5th harmonic values
Duties Definition Limits, % Actual values, %

Identification and Correction of Power Quality Problems/ July, 2020
Electrical Power Engineering Msc. Thesis 58
Peak voltage ( )L cap peak
rated
V
kv
120 109
RMS voltage ( , )L cap total rms
rated
V
kv
110 90
RMS Current ,
,
rms total
cap rated
I
I
135 134
kvar
,
var
var
cap total
cap rated
k
k
135 121
Therefore, all the designed values are within the IEEE 18 recommended limits for the 5th
harmonics.
Now calculate the capacitance and inductance values for the 5th harmonics
Capacitance and inductance values
1 10.0021
2 2 50 1.536c
C FfX x Hz x
0.0690.00022
2 2 50
LXL H
f x Hz
B. For 7th Harmonics
Voltage across the capacitor
In this case, use tuning filter frequency of 6% (6.58)
2 2
2 2
6.58( ) ( ) 480 409.457
1 6.58 1
sc system
s
hV V x v v
h
The rated value near to this calculated value is 480v.
The reactive power is given by
7
2 2
2 2
6.58( ) ( ) 92.651 var 94.875 var
1 6.58 1
sc f
s
hQ Q x k k
h

Identification and Correction of Power Quality Problems/ July, 2020
Electrical Power Engineering Msc. Thesis 59
The standard near value is 100 vark , then cX is determined by
2 20.482.304
100 var
C ratedc
c rated
VX
Q k
The reactor sizes
1
2 2
2.3040.0532
6.58
cL
s
XX
h
RMS current calculations
Let
1 2.304c cX X
1 0.0532L LX X
Then,
7
1 2.3040.35
6.58
cc
s
XX
h
And
7 1 6.58 0.0532 0.350L s LX h x X x
2 2
1RMS c chI I I
1
1 1
400
3 3102.604
2.304 0.0532
L L
c
c L
V V
IX X
2 2102.604 133.173 168.115rmsI

Identification and Correction of Power Quality Problems/ July, 2020
Electrical Power Engineering Msc. Thesis 60
RMS and peak voltage
12( )c peak c chV V V
1 1 1 2.304 102.604 236.399c c cV X x I x v
7 7 70.35 133.173 46.611c c cV X x I x v
2(236.399 46.611 ) 400.237peakcV v v v
2 2
1rms c chV V V
2 2(236.399 ) (46.611 ) 240.950rmsV v v v
, , ( , )var 3cap total rms total L Lcap rms totalk x I x KV
,var 3 168.115 3 0.240950 121.522 varcap totalk x x x k
The near rated value is 105 vark ,then
var 105 var126.295
3 0.48
ratedcap rated
cap rated
k kI
kv x v
Checking either the designed values are within the IEEE standard limits or not for the 7th
harmonics
,var 121.522 var
var [ ] 116%var 105 var
cap total
rated
k kk
k k
, 3 400.237[ ] [ ] 102%
2 480
L cap peak
rated peak
v x vpeak voltage
v x v
168.115
[ ] [ ] 133%126.295
RMS total
rated
IRMS current
I
( ) 3 240.950[ ] 87%
480
Lcap RMS total
rated
V x vRMS Voltage
V v
Table 3.3 Evaluating Filter duty limit as compared with IEEE standard of 7th harmonics.

Identification and Correction of Power Quality Problems/ July, 2020
Electrical Power Engineering Msc. Thesis 61
Therefore, all the designed values are within the IEEE 18 recommended limits.
Now calculate the capacitance and inductance values for the 7th harmonics
Capacitance and inductance values
2.304cX and 0.0532LX ,then
1 10.0014
2 2 50 2.304c
C FfX x Hz x
0.05320.0001693
2 2 50
LXL H
f x Hz
Table 3.4 Design parameters of multi-branch harmonic filter
Branch , varcQ k ,cV V ,cX ,C F ,LX ,L mH
5th 150 480 1.536 0.0021 0.069 0.22
7th 105 480 2.304 0.0014 0.0532 0.169
The cost of fully automatic system is 640 birr/ vark , in the case study, the ratings are 150
and 105 vark for 5th and 7th harmonic filter respectively.
Then, the cost of filter can be calculated as,
Duties Definition Limits, % Actual values, %
Peak voltage ( )L cap peak
rated
V
kv
120 102
RMS voltage ( , )L cap total rms
rated
V
kv
110 87
RMS Current ,
,
rms total
cap rated
I
I
135 133
kvar ,
var
var
cap total
cap rated
k
k
135 116
Identification and Correction of Power Quality Problems/ July, 2020
Electrical Power Engineering Msc. Thesis 62
Cost of filter 640
[150 105] var 163200var
birrk x birr
k
Due to the effect of harmonics on the factory cause miss operations and trips of fuses and
circuit breakers which leads to the damage of equipment and stops production process and
also overheating of transformers and motors resulting in minimizing efficiency and failure
of winding insulation causing short circuit and damage the machines permanently.
Therefore, the solution is very economical as compared to the effect of harmonics on
electrical equipments and it improves the productivity of the factory.
CHAPTER FOUR
4 SIMULATION RESULTS AND DISCUSSIONS
4.1 Mitigation of Voltage Unbalance Problem
As the investigation discovered the presence of voltage unbalance due to the occurrence of
single-line to ground or double-line to ground fault, then the solution for voltage unbalance
problem is modeled and simulated using Mat lab/Simulink software. Voltage wave forms
when double-line to ground fault happened as it has been shown from the figure 4.1

Identification and Correction of Power Quality Problems/ July, 2020
Electrical Power Engineering Msc. Thesis 63
simulation result, the voltage has been decreased from the normal value in the two phases,
so the voltage became unbalanced.
This voltage unbalance is needed to be compensated to get the desired voltage level at the
load side as explained before.
Figure 4.1.Voltage wave form when double-line to ground fault is created
Figure 4.2.Injected two-phase voltage by DVR

Identification and Correction of Power Quality Problems/ July, 2020
Electrical Power Engineering Msc. Thesis 64
When the proposed dynamic voltage restorer (DVR) is in operation, it injects the
appropriate amount of voltage that compensates the missed voltages during double-line to
ground fault. Therefore, the wave form is improved to the normal value and the system is
balanced.
Voltage wave forms when single-line to ground fault happened as it has been shown from
the figure 4.4 simulation result, the voltage has been decreased from the normal value in
one phase, so the voltage became unbalanced. This voltage unbalance is needed to be
compensated to get the desired voltage level at the load side.
Figure 4.3. Voltage with DVR when double-line to ground fault created
Figure 4.4. Voltage wave form when single-line to ground fault is created

Identification and Correction of Power Quality Problems/ July, 2020
Electrical Power Engineering Msc. Thesis 65
During single-line to ground fault the voltage becomes unbalanced, so during this period
the DVR injects the voltage in order to compensate the voltage unbalance problem of on
the faulted phase. When the proposed dynamic voltage restorer (DVR) is in operation, it
injects the appropriate amount of voltage that compensates the missed voltages during
single-line to ground fault. Therefore, the wave forms are improved to the normal value
and the system is balanced.
4.2 Mitigation of Voltage Sag
The appropriate solution for the existing voltage sag problem is modeled and simulated
using MATLAB/Simulink software. The first simulation shows voltage sag problem
without DVR when there is a three-phase short circuit fault in the system at a point with
fault resistance of 1.5 Ω for time duration of 250ms.
This voltage sag is needed to be compensated to get the desired voltage level at the load
side.
Figure 4.5. Voltage with DVR when single-line to ground fault created

Identification and Correction of Power Quality Problems/ July, 2020
Electrical Power Engineering Msc. Thesis 66
To mitigate voltage sag, the simulation is carried out by inserting DVR in the power system
on the load side to compensate the voltage sag occurred due to the three-phase short circuit
fault. The proposed dynamic voltage restorer responds to this sag and injects the
appropriate amount of missed voltage during the sag event for compensation. When the
DVR is in operation the voltage sag is compensated and the rms voltage at the load point
is maintained to the standard voltage level.
Figure 4.6. Voltage sag without DVR

Identification and Correction of Power Quality Problems/ July, 2020
Electrical Power Engineering Msc. Thesis 67
It is clearly observed that the voltage waveform that is obtained after connection of DVR,
the voltage restores for the three phases from the decreased voltage value to 230V. This
shows that the installed DVR is working efficiently
Figure 4.7 Inserted voltage by DVR
Figure 4.8 Voltage sag with DVR

Identification and Correction of Power Quality Problems/ July, 2020
Electrical Power Engineering Msc. Thesis 68
4.3 Mitigation of Harmonic Distortion
The solutions for current harmonic distortion have been simulated using
MATLAB/Simulink software. The designed two branch harmonic filters (5th and 7th) are
simulated effectively that reduced the distortion levels to acceptable values. The current
waveforms presented with and without filtering for comparison.
Figure 4.9 Current waveform without filter
Figure 4.10 FFT analysis of the harmonic currents without filter

Identification and Correction of Power Quality Problems/ July, 2020
Electrical Power Engineering Msc. Thesis 69
The distorted waveform in figure 4.9 and in figure 4.10 from the Fast Fourier Transform
(FFT) analysis the THD value is 44.63%, which is above the IEEE acceptable limit.
Therefore, to compensate the problem, harmonic filters are used; consequently, the
resulting waveform will be purely sinusoidal.
Figure 4.11. Current waveform with filter

Identification and Correction of Power Quality Problems/ July, 2020
Electrical Power Engineering Msc. Thesis 70
The results indicated that single tuned filter has significantly reduced the harmonic currents
that appear at the secondary terminal of the transformer. The current THD level is reduced
from 44.63 % to 0.14 %, and signal is purely sinusoidal due to the compensation provided
by the multi-branch harmonic filter. It is clear that the filters effectively reduce the
distortion level to the acceptable magnitude, i.e. less than 5 %.
Figure 4.12. FFT analysis of the harmonic currents with filter

Identification and Correction of Power Quality Problems/ July, 2020
Electrical Power Engineering Msc. Thesis 71
CHAPTER FIVE
5 CONCLUSIONS, RECOMMENDATIONS AND SUGGESTIONS
5.1 Conclusions
This work presents the assessment of power quality problems and mitigation techniques at
Amhara plastic pipe factory. The assessments have done from recorded data and by fluke
43B direct measurement and the analysis of the recorded data at the point of common
coupling has done based on IEEE standards. The analysis of the recorded data yields,
voltage unbalance, voltage sags and current harmonic distortions are the most severe
events, appropriate mitigation techniques are taken accordingly, and the main conclusions
are drawn as follows.
During the analyses from the collected data that the voltage unbalance percentage has
become 3.214%, so according to institute of electrical and electronics engineering (IEEE)
the standard of voltage unbalance range should not be more than 2%. The voltage
unbalance is caused by single-phase to ground fault or double-line to ground fault
occurrence inside the factory. The effect of voltage unbalance is decreased motor efficiency
and performance resulting in motor damage from excessive heat which affects the
company's profitability. So, this problem had been mitigated by using dynamic voltage
restorer (DVR) facts device effectively.
During the analyses from the collected data, voltage sag, was occurred on the three phases
and the percentage voltage reduction are 17.2% and the voltage decreases to 190.5V, 15.1%
and the voltage decreases to 195.2V, 12.3% and the voltage decreases to 201.2V for
duration of 250 msec. caused by three phase short circuit fault resulting in tripping of
protective device. It has also caused equipment malfunctions and ultimately equipment
damage, particularly motors. So, in order to overcome this problem dynamic voltage
restorer is installed in a distribution system between the supply and the critical load feeder
at the PCC, to restore the voltage to the normal standard voltage level, i.e. 230 V.

Identification and Correction of Power Quality Problems/ July, 2020
Electrical Power Engineering Msc. Thesis 72
In the factory during the assessment period, a distorted current of up to 44.% THD at its
full load is recorded, which is beyond the IEEE current distortion limits. Harmonic current
is originated from non-linear loads, loads which draw non-sinusoidal current, 5th and 7th
harmonics are the dominant harmonic frequencies caused by static power converters used
in adjustable speed drives for motor control, switched mode power supplies and six-pulse
static drives and the negative effects was studied. As a result, passive (multi -branch single-
tuned) filters were designed for the 5th and 7th harmonic current mitigation and the
distortion levels were reduced from 44.63 % to 0.14 %. This reduction in distortion level
shows how important a filter is to get rid of the ill effects, additional heating, false tripping
and equipment malfunction associated with harmonics.
5.2 Recommendations
The identified power quality problems must be given serious attention and the designed
appropriate solutions should be implemented and installed by the industry to avoid the loss
of money, improve productivity, profitability and early failure of equipment. Based on the
studies and results found, in this thesis, it is strongly recommended that, for the industry to
have the power quality analyzer measuring instrument, Fluke 434/435 three phase.
5.3 Suggestions for Future Work
Power quality assessment should be done regularly, especially on sensitive loads to keep
good performance of the factory and also a complete assessment of power quality problems
should be done. The time allocated for monitoring should be longer, it should be more than
seven days, and this to ensure that, more detailed and complete data could be obtained.
More monitoring points to be allocated in the site, so that more data could be gathered on
the factory.

Identification and Correction of Power Quality Problems/ July, 2020
Electrical Power Engineering Msc. Thesis 73
Appendixes
Appendix A. Loads and sample interruptions
Table A.1 Total electrical load of the factory
Production Line Resistive
Load
ACDL Motor DCL CFPL PSL Idel
Load
UPVC line 1 81 9.9 97.1 110 35.7 37 14
UPVC line 2 45 9.9 92.2 110 24.2 33 13
UPVC line 3 28 6.25 94.1 55 15.9 33 7.2
UPVC line 4 12 46.1 92.1 0 11.1 17 13
HDPE line 5 8.9 35.8 9.23 75 9.65 33 12
HDPE line 6 27 1.1 11.6 160 12.4 33 12
HDPE line 7 27 23.4 11.2 110 19.2 33 12
HDPE line 8 15 60.4 89.3 55.1 15.4 33 12
Geomembrane9 74 70 32.9 352 27.9 33 221
Green sheet10 117 780 41.1 15.4 5.75 0 6
Flat hose 11 4 56.4 5.33 0 0 1 3
Accessories12 16 33.3 639 0 7.5 5.5 326
Total 454 1133 1089 1027 332 286 431

Identification and Correction of Power Quality Problems/ July, 2020
Electrical Power Engineering Msc. Thesis 74
Table A.2 Squeezed Load and transformer data of factory
Load category Power (kw) Transformer category KVA
Load-1 357 T/R-1 1250
Load-2 300
Load-3 225
Load-4 165 T/R-2 709.73
Load-5 160
Load-6 234
Load-7 212 T/R-3 710
Load-8 256 T/R-4 795
Load-9 569
Load-10 954
Load-11 64 T/R-5 789
Load-12 376
Total Load 3872 T/R- (total) 4681.5

Identification and Correction of Power Quality Problems/ July, 2020
Electrical Power Engineering Msc. Thesis 75
Table A.3 Sample recorded data power interruptions in six months
S/N Months Time[minutes] Repetitions External
interruptions
Internal
interruptions
1 July 5580 32 26 6
2 August 1230 35 30 5
3 September 2561 34 30 4
4 October 709 28 25 3
5 November 450 12 10 2
6 December 500 15 14 1
Total 11030 156 151 21

Identification and Correction of Power Quality Problems/ July, 2020
Electrical Power Engineering Msc. Thesis 76
Appendix B. Power quality analyzer and Sample measurement data.
Figure B.1.power quality analyzer and its accessories
Figure B. 2. Power quality analyzer menu display

Identification and Correction of Power Quality Problems/ July, 2020
Electrical Power Engineering Msc. Thesis 77
Figure B.3.Measurement steps on three-phase power
Figure B.4.Sample single and three-phase voltage measured values

Identification and Correction of Power Quality Problems/ July, 2020
Electrical Power Engineering Msc. Thesis 78
Figure B.5. Current harmonic measurement

Identification and Correction of Power Quality Problems/ July, 2020
Electrical Power Engineering Msc. Thesis 79
Appendix C. Electrical Simulink models for simulation
Figure C. 1. Simulink model of voltage unbalance without DVR
Figure C.2. Simulink model of DVR

Identification and Correction of Power Quality Problems/ July, 2020
Electrical Power Engineering Msc. Thesis 80
Figure C.3. Simulink model of voltage unbalance with DVR
Figure 6C. Harmonic Simulink model without filter
Figure 7C. Harmonic Simulink model with filter
Figure C.4. Harmonic Simulink model without filter

Identification and Correction of Power Quality Problems/ July, 2020
Electrical Power Engineering Msc. Thesis 81
Figure C.5. Simulink model of harmonic distortion with filter

Identification and Correction of Power Quality Problems/ July, 2020
Electrical Power Engineering Msc. Thesis 82
Reference
[1] N. Patel, K. Gandhi, D. Mahida, and P. Chudasama, “A Review On Power Quality Issues
and Standards,” Int. Res. J. Eng. Technol., vol. 4, no. 2, pp. 247–250, 2017.
[2] S. G. Bankar, “Impact of Non Linear Load on Power Quality,” no. January, pp. 223–226,
2017.
[3] A. Agarwal, S. Kumar, and S. Ali, “A Research Review of Power Quality Problems in
Electrical Power System,” MIT Int. J. Electr. Instrum. Eng., vol. 2, no. 2, pp. 88–93, 2012.
[4] D. Mueller and J. Lamoree, “Detecting, Identifying, and Correcting Power Quality
Problems,” Power Qual. Value’98,1998.
[5] A. de Almeida, L. Moreira, and J. Delgado, “Power quality problems and new solutions,”
Renew. Energy Power Qual. J., vol. 1, no. 1, pp. 25–33, 2003.
[6] S. Khalid and B. Dwivedi, “Power quality issues, problems, standards and their effects in
industry with corrective means,” Int. J. Adv. Eng. Technol., vol. 1, no. 2, pp. 1–11, 2011.
[7] D. O. F. Philosophy, “Mitigation of Power Quality Problems Using Interline Dynamic
Voltage Restorer,” vol. 6, no. 8, pp. 86–98, 2018.
[8] D. Gour, D. Dohare, and A. Saxena, “A Study of Various Filters for Power Quality
Improvement,” Int. J. Adv. Res. Electr. Electron. Instrum. Eng., vol. 04, no. 01, pp. 138–
143, 2015.
[9] Z. Hameed, A. Yousaf, M. Rafay, and K. Sial, “Harmonics in Electrical Power Systems
and how to remove them by using filters in ETAP,” no. January 2020, 2016.
[10] S. Jain, P. Shivendra, S. Thakur, and P. S. P. Phulambrikar, “Improve Power Quality And
Reduce The Harmonics Distortion Of Sensitive Load,” vol. 2, no. 6, pp. 806–815, 2012.
[11] M. Garg and P. Nijhawan, “Mitigation of Power Quality Problems Using DVR in

Identification and Correction of Power Quality Problems/ July, 2020
Electrical Power Engineering Msc. Thesis 83
Distribution Network for Welding Load,” IOSR J. Electr. Electron. Eng., vol. 10, no. 4, pp.
2278–1676, 2015.
[12] S. Gupta and A. K. Sharma, “Power Quality Identification Using Wavelet Transform : A
Review,” vol. 2, no. 3, pp. 42–48, 2015.
[13] O. P. Taiwo, R. Tiako, and I. E. Davidson, “Investigation of voltage unbalance in low
voltage electric power distribution network under steady state mode,” 2017 IEEE 3rd Int.
Conf. Electro-Technology Natl. Dev. NIGERCON 2017, vol. 2018–Janua, no. November,
pp. 932–939, 2018.
[14] T. H. D. Compensator, M. Rusli, and M. Ihsan, “23 rd International Conference on
Electricity Distribution single tuned harmonic filter design as total harmonic distortion 23
rd International Conference on Electricity Distribution,” no. June, pp. 15–18, 2015.
[15] T. Thomas and P. A. Michael, “Future power quality issues,” Int. J. Eng. Adv. Technol.,
vol. 8, no. 4, pp. 1075–1080, 2019.
[16] L. van der Sluis, “Transients in Power Systems,” Transients Power Syst., 2001.
[17] F. Jurado, N. Acero, J. Carpio, and M. Castro, “Using various computer tools in electrical
transients studies,” Proc. - Front. Educ. Conf., vol. 2, no. February, 2000.
[18] M. Au, S. Member, B. L. Agba, and S. Member, “An analysis of transient impulsive noise
in a Poisson field of interferers for wireless channel in substation environments,” pp. 1–13,
2011.
[19] P. Hariramakrishnan and S. Sendil Kumar, “Detection of oscillatory transients using
Morphological Transform,” ARPN J. Eng. Appl. Sci., vol. 13, no. 19, pp. 8150–8153,
2018.
[20] H. Guo, “Frequency Measurement of Transient Oscillatory on LABVIEW,” J. Power
Energy Eng., vol. 02, no. 04, pp. 673–679, 2014.

Identification and Correction of Power Quality Problems/ July, 2020
Electrical Power Engineering Msc. Thesis 84
[21] El-Shennawy, “A Dynamic Voltage Restorer for Voltage Sag Mitigation in a Refinery with
Induction Motors Loads,” Am. J. Eng. Appl. Sci., vol. 3, no. 1, pp. 144–151, 2010.
[22] N. Gupta and M. Awasthi, “Design of DVR against Voltage Sags & Swell Using Matrix
Converter,” vol. IV, no. Vi, pp. 64–69, 2017.
[23] N. VASA, “Series Compensation Technique for Voltage Sag Mitigation,” IOSR J. Eng.,
vol. 02, no. 08, pp. 14–24, 2012.
[24] J. Van Casteren, Assessment of Interruption Costs in Electric Power Systems using the
Weibull-Markov Model, no. 1984. 2003.
[25] P. Koponen, H. Hansen, and M. Bollen, “Interharmonics and Light Flicker,” no. June, pp.
15–18, 2015.
[26] H. C. Lin, “Sources, effects, and modelling of interharmonics,” Math. Probl. Eng., vol.
2014, no. 1, 2014.
[27] N. A. Azeez, S. Pramanick, K. Gopakumar, and C. Cecati, “A 5th and 7th order harmonic
suppression scheme using capacitive filtering for 2-level VSI fed im drive,” 2014 Int.
Symp. Power Electron. Electr. Drives, Autom. Motion, SPEEDAM 2014, no. June, pp.
780–783, 2014.
[28] E. Fernández, A. Paredes, V. Sala, and L. Romeral, “A simple method for reducing THD
and improving the efficiency in CSI topology based on SiC power devices,” Energies, vol.
11, no. 10, 2018.
[29] M. Scheidiger, “Power System Harmonics Analysis of High Power Variable Speed Drives
Power System Harmonics Analysis of High Power Variable Speed Drives,” p. 130, 2013.
[30] J. N. Bharothu, “Compensation of Voltage Flicker by Using Facts Devices,” Am. J. Electr.
Power Energy Syst., vol. 2, no. 3, p. 66, 2013.

Identification and Correction of Power Quality Problems/ July, 2020
Electrical Power Engineering Msc. Thesis 85
[31] W. L. Fuchs and E. F. Fuchs, “Frequency Variations of Power System Due to Switching
of Renewable Energy Sources,” Renew. Energy Power Qual., vol. 1, no. 10, pp. 125–130,
2012.
[32] P. E. Sutherland, “Harmonic measurements in industrial power systems,” IEEE Trans. Ind.
Appl., vol. 31, no. 1, pp. 175–183, 1995.
[33] M. A. Kabir and M. M. Rahman, “A Technical Investigation of Voltage Sag,” Am. J. Eng.
Res., vol. 4, no. 10, pp. 1–9, 2017.
[34] A. Pakharia, “DVR Based Compensation of Voltage Sag due to Variations of Load: A
Study on Analysis of Active Power,” IOSR J. Electr. Electron. Eng., vol. 1, no. 1, pp. 38–
48, 2012.
[35] S. B. Ibrahim, “Voltage quality enhancement in distribution system using artificial neural
network (ANN) based dynamic voltage restorer,” Niger. J. Technol., vol. 37, no. 1, p. 184,
2018.
[36] D. Patil and D. Chavan, “Modelling of Dynamic Voltage Restorer for Mitigation of
Voltage Sag and Swell Using Phase Locked Loop,” vol. 3, no. 6, pp. 2137–2143, 2014.
[37] A. H. Al-Badi, M. H. Albadi, and A. S. Al-Hinai, “Designing of filter to reduce harmonic
in industrial power networks,” ENERGYCON 2014 - IEEE Int. Energy Conf., pp. 177–
181, 2014.
[38] M. Y. Lada, I. Bugis, and M. H. N. Talib, “Simulation a shunt active power filter using
MATLAB/Simulink,” PEOCO 2010 - 4th Int. Power Eng. Optim. Conf. Progr. Abstr., no.
June, pp. 371–375, 2010.