identification and characterisation of two optical water types in the irish sea from in situ...
TRANSCRIPT
Estuarine, Coastal and Shelf Science 68 (2006) 305e316www.elsevier.com/locate/ecss
Identification and characterisation of two optical water typesin the Irish Sea from in situ inherent optical properties and
seawater constituents
David McKee*, Alex Cunningham
SUPA, Physics Department, University of Strathclyde, 107 Rottenrow, Glasgow G4 0NG, Scotland
Received 20 December 2005; accepted 21 February 2006
Available online 18 April 2006
Abstract
This paper examines relationships between the inherent optical properties (IOPs) of the Irish Sea and concentrations of optically significantconstituents, measured as chlorophyll (Chl), mineral suspended solids (MSS) and coloured dissolved organic material (CDOM). In situ measure-ments of IOPs at 98 stations fell into two groups with distinct characteristics. Instances include the ratio of particulate backscattering to non-water absorption at 676 nm (bbp676/an676), the ratio of the non-water absorption coefficients at 440 nm and 676 nm (an440/an676) and the ratioof particulate scattering to non-water absorption (bp/an) at 676 nm. The two groups showed corresponding differences in the proportions of theirconstituent concentrations with Chl/MSS values typically above 0.4 mg g�1 for stations with bbp676/an676< 0.33 and below 0.4 mg g�1 forstations with bbp676/an676> 0.33. CDOM concentrations showed no significant differences between groups. The occurrence of correlatedgroups in the IOP and constituent concentration data indicates the existence of identifiable sub-types of coastal water within the conventionalCase 2 classification whose optical characteristics were dominated either by phytoplankton or suspended minerals. By applying linear regressionanalysis to the two groups we derived effective material-specific IOPs for these natural particle assemblages. The coefficients obtained enabledthe successful reconstruction of total absorption, scattering and backscattering coefficients for a given water body from measurements of Chl,MSS and CDOM. This procedure may be useful for assimilating measurements of seawater composition into bio-optical models in shelf seas.� 2006 Elsevier Ltd. All rights reserved.
Keywords: optical properties; light absorption; light scattering; shelf seas; Irish Sea
1. Introduction
Radiative transfer modelling provides a systematic meansof determining the effect of changes in the optical propertiesof seawater on underwater light fields and remote sensing re-flectance signals (Kirk, 1981; Sathe and Sathyendranath, 1992;Mobley, 1994). In recent years, the combination of commer-cially available software such as Hydrolight (Sequoia) andnew in situ sensors for measuring inherent optical propertieshas enabled greatly improved radiative transfer models to be
* Corresponding author.
E-mail addresses: [email protected] (D. McKee), a.cunningham@
strath.ac.uk (A. Cunningham).
0272-7714/$ - see front matter � 2006 Elsevier Ltd. All rights reserved.
doi:10.1016/j.ecss.2006.02.010
constructed (Chang et al., 2003; McKee et al., 2003; Bulgarelliet al., 2003). These models are valuable tools for developingalgorithms for interpreting ocean colour signals and formulat-ing spectrally resolved models of primary productivity (Sa-thyendranath et al., 1989; Smith et al., 1989). However,systematic studies of the optical effects of phytoplankton, min-erals and coloured dissolved organic material require material-specific IOPs that can be multiplied by concentrations of theseconstituents to generate absolute IOP values. In practice, theability of radiative transfer models to achieve optical closureis often limited by the accuracy of the specific inherent opticalproperties (IOPs) that are supplied as inputs.
It is not currently possible to measure the separate contribu-tions of phytoplankton and minerals to total particulate IOPsin situ. One method of obtaining material-specific IOPs is to
306 D. McKee, A. Cunningham / Estuarine, Coastal and Shelf Science 68 (2006) 305e316
examine individual algal cultures (Bricaud et al., 1983;Stramski and Morel, 1990; Ahn et al., 1992) and suspensionsof purified minerals (Babin and Stramski, 2002, 2004). Thequestion remains, however, of the extent to which these mate-rials in isolation are representative of the natural particle as-semblages found in shelf seas. Efforts to derive specificIOPs from natural mixtures of materials are usually basedon the quantitative filter pad absorption method (Yentsch,1962; Mitchell, 1990; Babin et al., 2003a) combined withbleaching of phytoplankton pigments (Kishino et al., 1985;Neumuller et al., 2002) or the removal of organic materialby combustion (Bowers et al., 1996). Filter pad measurementsmay be subject to artefacts due to sample handling (Stramski,1990; Allali et al., 1995) and there is some uncertaintysurrounding optical pathlength amplification at low opticaldensities (Kiefer and SooHoo, 1982; Mitchell and Kiefer,1984; Maske and Haardt, 1987; Bricaud and Stramski, 1990;Cleveland and Weidemann, 1993; Roesler, 1998). Laboratoryanalyses are also time consuming and therefore measurementsare temporally and spatially limited compared to in situmethods. Total IOPs have been partitioned into partial compo-nents through numerical decomposition (Morrow et al., 1989;Roesler et al., 1989; Bricaud and Stramski, 1990; Clevelandand Perry, 1994; Chang and Dickey, 1999) but this method re-quires a more accurate knowledge of the spectral characteris-tics of natural materials than is usually available.
The approach to the problem considered in this paper wasto derive useful approximations to material-specific IOPsfrom a statistical examination of in situ measurements of thetotal coefficients of absorption, attenuation and backscattering,together with measured concentrations of the most opticallysignificant seawater constituents. The material-specific IOPsobtained by this method were designated effective IOPs be-cause they represented the optical characteristics of naturalparticle assemblages in the region of interest, dominated byphytoplankton or suspended minerals but containing propor-tions of other associated materials. A key element of this ap-proach was the identification of optical water types usinginter-relationships between IOPs. This sub-classification ofCase 2 waters permitted successful regression of particulateIOPs against a single constituent for each optical water type.The resulting effective material-specific IOPs can be used togenerate apparent optical properties using established relation-ships from the literature (Morel and Gentili, 1993), or to pa-rameterise radiative transfer simulations for ecosystemmodelling or remote sensing applications.
Coastal waters such as the Irish Sea are optically complexdue to variability in constituent concentration and composi-tion. Our methodology for classification of sub-Case 2 opticalwater types was developed as a means of reducing this com-plexity by identifying stations where the composition of mate-rials was similar. Attempts to use other classification schemesbased on season or geographic location were attempted butwere found to be inadequate. Coastal waters such as the IrishSea exhibit complexity than can be attributed to seasonal, ep-isodic, tidal, geographic and other factors. We believe that ourapproach may be usefully adapted in other geographical
regions and in other areas of optical oceanography, particu-larly in the interpretation of remote sensing data from coastalwaters. In this paper, our purpose was to use this classificationscheme to derive material-specific IOPs that could be used forradiative transfer modelling. Whilst the effective mass-specificIOPs we obtained may only be relevant for the Irish Sea (thishas yet to be determined), we believe that the methodology wehave developed could be successfully exported to other areas.
2. Methods
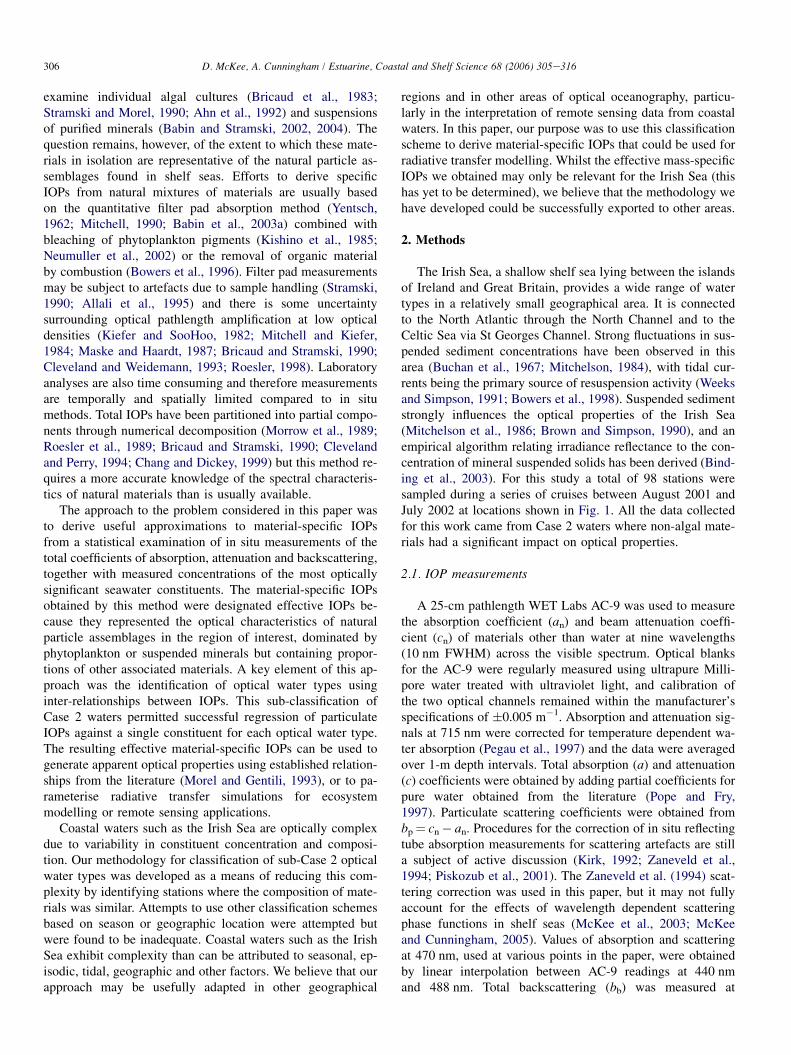
The Irish Sea, a shallow shelf sea lying between the islandsof Ireland and Great Britain, provides a wide range of watertypes in a relatively small geographical area. It is connectedto the North Atlantic through the North Channel and to theCeltic Sea via St Georges Channel. Strong fluctuations in sus-pended sediment concentrations have been observed in thisarea (Buchan et al., 1967; Mitchelson, 1984), with tidal cur-rents being the primary source of resuspension activity (Weeksand Simpson, 1991; Bowers et al., 1998). Suspended sedimentstrongly influences the optical properties of the Irish Sea(Mitchelson et al., 1986; Brown and Simpson, 1990), and anempirical algorithm relating irradiance reflectance to the con-centration of mineral suspended solids has been derived (Bind-ing et al., 2003). For this study a total of 98 stations weresampled during a series of cruises between August 2001 andJuly 2002 at locations shown in Fig. 1. All the data collectedfor this work came from Case 2 waters where non-algal mate-rials had a significant impact on optical properties.
2.1. IOP measurements
A 25-cm pathlength WET Labs AC-9 was used to measurethe absorption coefficient (an) and beam attenuation coeffi-cient (cn) of materials other than water at nine wavelengths(10 nm FWHM) across the visible spectrum. Optical blanksfor the AC-9 were regularly measured using ultrapure Milli-pore water treated with ultraviolet light, and calibration ofthe two optical channels remained within the manufacturer’sspecifications of �0.005 m�1. Absorption and attenuation sig-nals at 715 nm were corrected for temperature dependent wa-ter absorption (Pegau et al., 1997) and the data were averagedover 1-m depth intervals. Total absorption (a) and attenuation(c) coefficients were obtained by adding partial coefficients forpure water obtained from the literature (Pope and Fry,1997). Particulate scattering coefficients were obtained frombp¼ cn� an. Procedures for the correction of in situ reflectingtube absorption measurements for scattering artefacts are stilla subject of active discussion (Kirk, 1992; Zaneveld et al.,1994; Piskozub et al., 2001). The Zaneveld et al. (1994) scat-tering correction was used in this paper, but it may not fullyaccount for the effects of wavelength dependent scatteringphase functions in shelf seas (McKee et al., 2003; McKeeand Cunningham, 2005). Values of absorption and scatteringat 470 nm, used at various points in the paper, were obtainedby linear interpolation between AC-9 readings at 440 nmand 488 nm. Total backscattering (bb) was measured at
307D. McKee, A. Cunningham / Estuarine, Coastal and Shelf Science 68 (2006) 305e316
470 nm and 676 nm using a Hydroscat-2 (HOBI Labs). Back-scattering signals were corrected for pathlength attenuation ef-fects using the manufacturer’s sigma correction procedure.The sigma correction parameter was calculated with a three-term polynomial expansion (coefficients for the polynomialsupplied by the manufacturer) on Kbb, which in turn was givenby Kbb¼ aþ 0.75b (see McKee and Cunningham, 2005 forfurther details). Particulate backscattering (bbp) was obtainedby subtracting values for pure water backscattering derivedfrom the measurements of Smith and Baker (1981). It is pos-sible that the 676-nm backscattering channel (with a 20-nmFWHM bandwidth) may be contaminated by fluorescence inwaters with high chlorophyll concentrations. Given the limitedrange of chlorophyll concentration encountered in this IrishSea data set, and the fact that we could find no obvious featurein the data, we suggest that our backscattering signals at676 nm may be slightly overestimated for some stations, butit is currently impossible to give an accurate figure for theproblem.
2.2. Sample analyses
Chlorophyll samples were filtered through 25-mm GF/F fil-ters and immediately frozen. Once in the laboratory, the filterpapers were soaked for 24 h in neutralised 90% acetone and
Fig. 1. Map of the Irish Sea indicating the location of 98 stations.
the absorbance of the extract measured in a custom-built spec-trophotometer using 1-cm pathlength cuvettes before and afteracidification with dilute hydrochloric acid. The trichromaticequations of Jeffrey and Humphrey (1975) were used to con-vert absorbance spectra to concentrations of chlorophylla (Chl). All samples were measured in triplicate.
Total suspended solids’ (TSS) samples were obtained by fil-tering 5 l of seawater through pre-weighed 90-mm GF/F filtersand rinsing with 50 ml of distilled water. Samples were storedfrozen until returned to the laboratory where they were dried inan oven at 100 �C for 3 h and reweighed. The concentration ofmineral suspended solids (MSS) was obtained by re-weighingsamples after they had been placed in a furnace at 500 �C for3 h, at which point it was assumed that all organic materialshad been combusted.
Coloured dissolved organic material (CDOM) sampleswere filtered through 0.2-mm membrane filters, with the filtratebeing collected in acid-rinsed glass bottles with nalgene capsand stored under refrigeration. Absorption by CDOM wasmeasured in a custom-built spectrophotometer using 10-cmcuvettes and UV treated ultrapure water as a reference. Giventhe unknown and probably complex chemical composition ofCDOM, the absorption coefficient of the filtrate material at440 nm, aCDOM(440), was used as a proxy for concentrationof CDOM. Absorption by CDOM samples was subtractedfrom in situ AC-9 non-water absorption signals, an(l), to pro-vide values of particulate absorption, ap(l).
3. Results
As this paper is primarily concerned with understanding therelationships between IOPs and constituents for radiativetransfer modelling of reflectance and euphotic depth, onlydata from the upper mixed layer were considered. This layerwas sampled at a depth of 1 m at all stations. In situ opticalmeasurements are increasingly common, but it is currently dif-ficult to incorporate such data into radiative transfer simula-tions that extend beyond the limits of the actual data set.Relationships between IOPs and constituents were examinedwith a view towards determining material-specific IOPs fromin situ measurements. Material-specific IOPs derived in thisway could be used to model light fields over a much broaderrange of constituent concentrations than are likely to be ob-tained even in an extensive sampling campaign such as thatundertaken for this study.
3.1. Distributions of seawater constituents
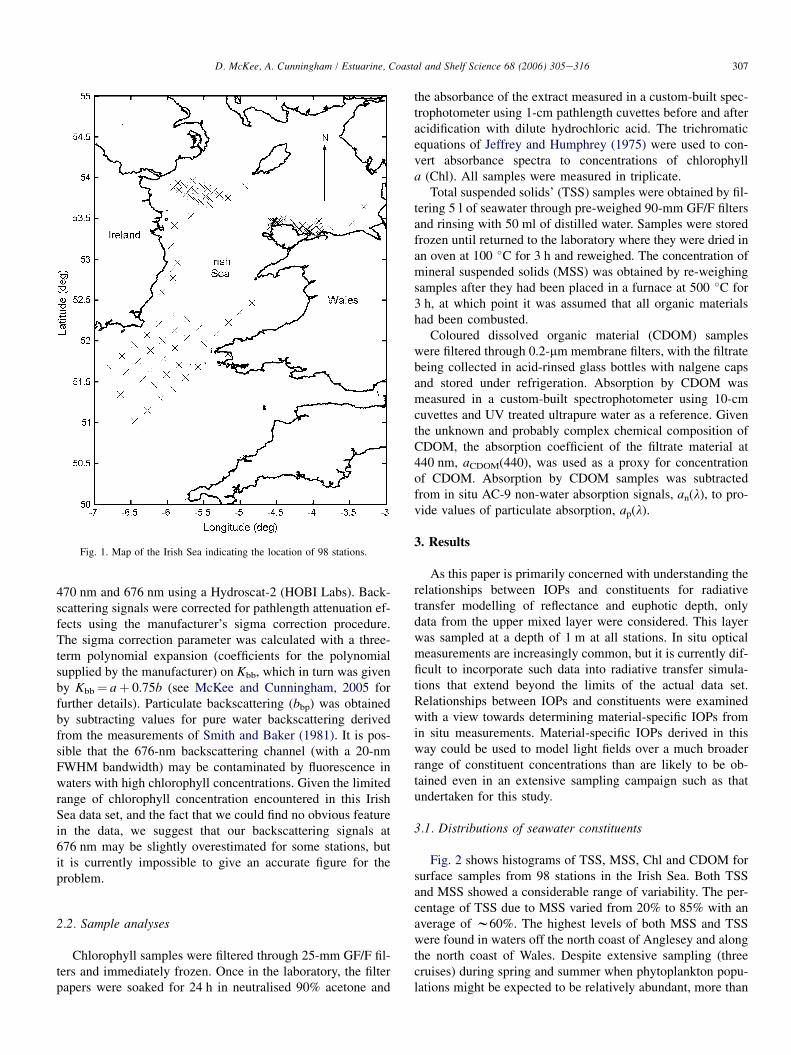
Fig. 2 shows histograms of TSS, MSS, Chl and CDOM forsurface samples from 98 stations in the Irish Sea. Both TSSand MSS showed a considerable range of variability. The per-centage of TSS due to MSS varied from 20% to 85% with anaverage of w60%. The highest levels of both MSS and TSSwere found in waters off the north coast of Anglesey and alongthe north coast of Wales. Despite extensive sampling (threecruises) during spring and summer when phytoplankton popu-lations might be expected to be relatively abundant, more than
308 D. McKee, A. Cunningham / Estuarine, Coastal and Shelf Science 68 (2006) 305e316
Fig. 2. Histograms of the concentrations of seawater constituents (TSS, MSS, Chl and CDOM) for surface samples from the locations indicated in Fig. 1.
90% of our chlorophyll samples were below 2 mg m�3, andnone were greater than 4 mg m�3. High chlorophyll watersmay have been inadvertently under-sampled, but it is possiblethat phytoplankton productivity in these waters is not as highas in other European shelf seas (e.g., Babin et al., 2003a). Chlestimates from satellite imagery are available for the Irish Seabut are unreliable due to the poor performance of standard al-gorithms in turbid waters. Absorption by CDOM at 440 nmwas always less than 0.25 m�1 for this data set, even thougha number of samples were taken close to outflows of rivers(e.g., in Conwy Bay). These values were low compared tosome other UK coastal waters, particularly the fjord systemsof the Scottish west coast (McKee et al., 2002), but theywere sufficient to ensure that all of these stations could beclassed as Case 2.
3.2. IOP distributions
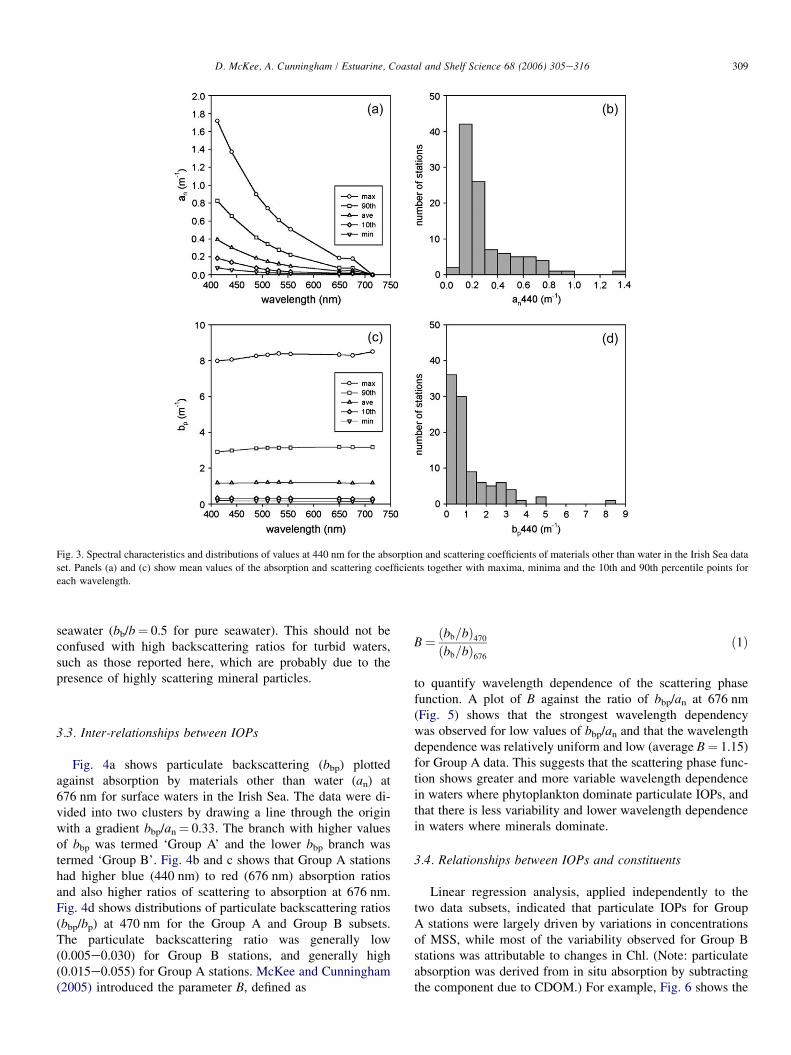
Fig. 3 shows the average spectral dependency of the absorp-tion and scattering coefficients (by all materials other than wa-ter) for the entire data set, together with statistical boundariesand histograms of the values observed at 440 nm. The range ofvariability in the spectral plots was considerable, though thehistograms show that w70% of an440 values were below
0.3 m�1, and w65% of bp440 values were below 1 m�1. Ab-sorption generally increased exponentially towards the blueend of the spectrum (best-fit exponents were approximately0.010 nm�1 for these spectra) due to the presence of bothCDOM and suspended non-algal particles, and there was evi-dence of a chlorophyll absorption peak at 676 nm. Scatteringspectra did not show strong wavelength dependence.
Particulate backscattering distributions (not shown) werevery similar to the scattering distribution shown in Fig. 3,with a broad range of variability (<0.001 to w0.430 m�1)but with 80% of the values below 0.050 m�1. The averageparticulate backscattering at 440 nm was 0.039 m�1. Thewavelength dependency of bbp varied, but was often slightlygreater in the blue than in the red (e.g., averagebbp676¼ 0.035 m�1). Backscattering ratios (bb/b) variedover an order of magnitude from w0.005 to w0.050, with av-erage values of 0.025 at 470 nm and 0.020 at 676 nm. Thisrange of values was consistent with those of Petzold (1972)who found backscattering ratios of 0.019 for turbid waters inSan Diego harbour, and 0.013 for coastal ocean waters. Pet-zold also found a backscattering ratio of 0.044 for clearopen ocean waters. In those waters a high backscattering ratioprobably arose as a result of the diminishing importance ofparticulate scattering relative to molecular scattering by
309D. McKee, A. Cunningham / Estuarine, Coastal and Shelf Science 68 (2006) 305e316
Fig. 3. Spectral characteristics and distributions of values at 440 nm for the absorption and scattering coefficients of materials other than water in the Irish Sea data
set. Panels (a) and (c) show mean values of the absorption and scattering coefficients together with maxima, minima and the 10th and 90th percentile points for
each wavelength.
seawater (bb/b¼ 0.5 for pure seawater). This should not beconfused with high backscattering ratios for turbid waters,such as those reported here, which are probably due to thepresence of highly scattering mineral particles.
3.3. Inter-relationships between IOPs
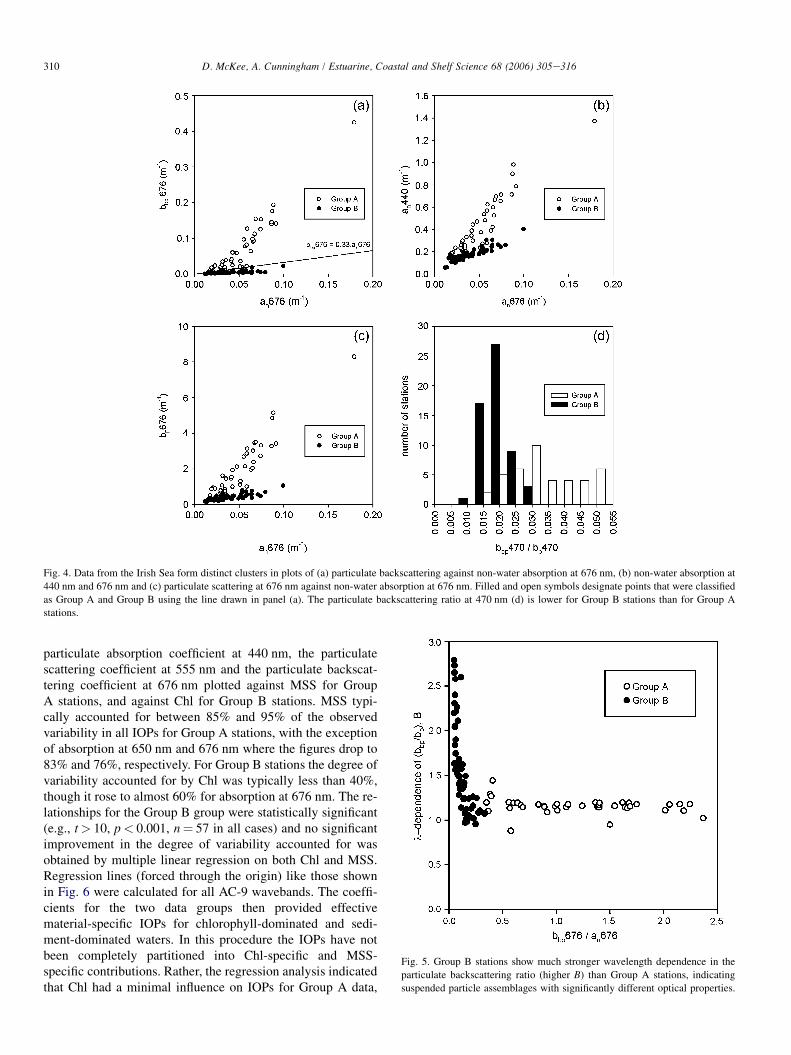
Fig. 4a shows particulate backscattering (bbp) plottedagainst absorption by materials other than water (an) at676 nm for surface waters in the Irish Sea. The data were di-vided into two clusters by drawing a line through the originwith a gradient bbp/an¼ 0.33. The branch with higher valuesof bbp was termed ‘Group A’ and the lower bbp branch wastermed ‘Group B’. Fig. 4b and c shows that Group A stationshad higher blue (440 nm) to red (676 nm) absorption ratiosand also higher ratios of scattering to absorption at 676 nm.Fig. 4d shows distributions of particulate backscattering ratios(bbp/bp) at 470 nm for the Group A and Group B subsets.The particulate backscattering ratio was generally low(0.005e0.030) for Group B stations, and generally high(0.015e0.055) for Group A stations. McKee and Cunningham(2005) introduced the parameter B, defined as
B¼ ðbb=bÞ470
ðbb=bÞ676
ð1Þ
to quantify wavelength dependence of the scattering phasefunction. A plot of B against the ratio of bbp/an at 676 nm(Fig. 5) shows that the strongest wavelength dependencywas observed for low values of bbp/an and that the wavelengthdependence was relatively uniform and low (average B¼ 1.15)for Group A data. This suggests that the scattering phase func-tion shows greater and more variable wavelength dependencein waters where phytoplankton dominate particulate IOPs, andthat there is less variability and lower wavelength dependencein waters where minerals dominate.
3.4. Relationships between IOPs and constituents
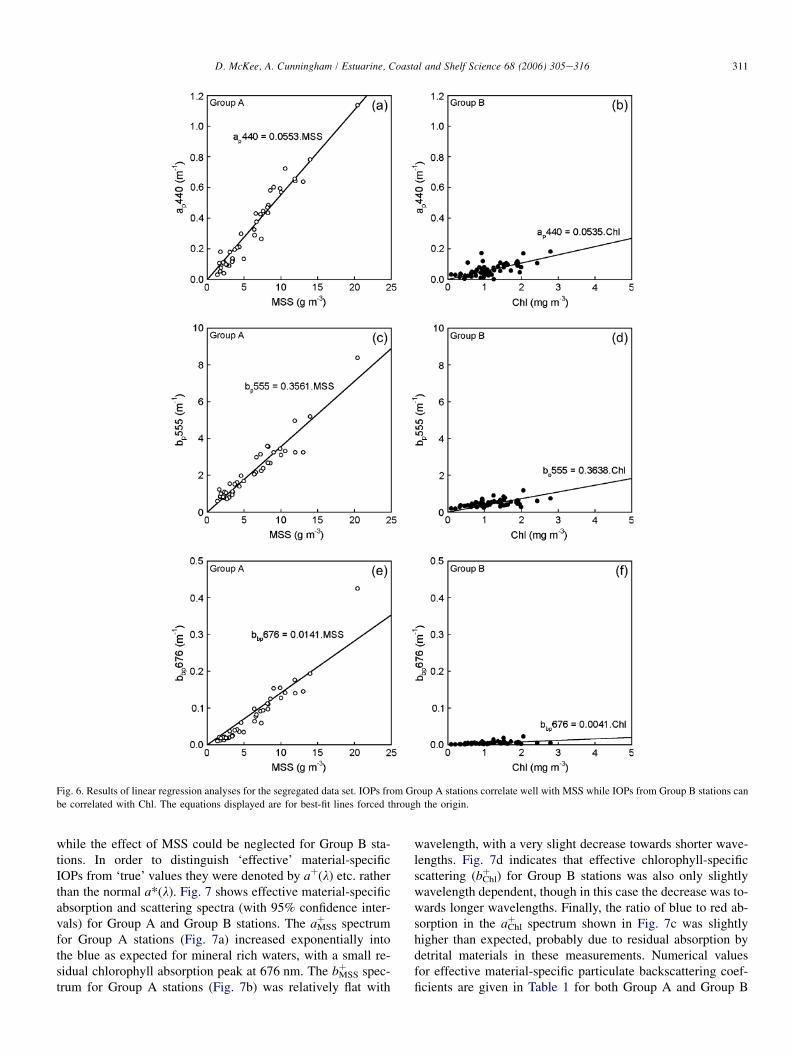
Linear regression analysis, applied independently to thetwo data subsets, indicated that particulate IOPs for GroupA stations were largely driven by variations in concentrationsof MSS, while most of the variability observed for Group Bstations was attributable to changes in Chl. (Note: particulateabsorption was derived from in situ absorption by subtractingthe component due to CDOM.) For example, Fig. 6 shows the
310 D. McKee, A. Cunningham / Estuarine, Coastal and Shelf Science 68 (2006) 305e316
Fig. 4. Data from the Irish Sea form distinct clusters in plots of (a) particulate backscattering against non-water absorption at 676 nm, (b) non-water absorption at
440 nm and 676 nm and (c) particulate scattering at 676 nm against non-water absorption at 676 nm. Filled and open symbols designate points that were classified
as Group A and Group B using the line drawn in panel (a). The particulate backscattering ratio at 470 nm (d) is lower for Group B stations than for Group A
stations.
particulate absorption coefficient at 440 nm, the particulatescattering coefficient at 555 nm and the particulate backscat-tering coefficient at 676 nm plotted against MSS for GroupA stations, and against Chl for Group B stations. MSS typi-cally accounted for between 85% and 95% of the observedvariability in all IOPs for Group A stations, with the exceptionof absorption at 650 nm and 676 nm where the figures drop to83% and 76%, respectively. For Group B stations the degree ofvariability accounted for by Chl was typically less than 40%,though it rose to almost 60% for absorption at 676 nm. The re-lationships for the Group B group were statistically significant(e.g., t> 10, p< 0.001, n¼ 57 in all cases) and no significantimprovement in the degree of variability accounted for wasobtained by multiple linear regression on both Chl and MSS.Regression lines (forced through the origin) like those shownin Fig. 6 were calculated for all AC-9 wavebands. The coeffi-cients for the two data groups then provided effectivematerial-specific IOPs for chlorophyll-dominated and sedi-ment-dominated waters. In this procedure the IOPs have notbeen completely partitioned into Chl-specific and MSS-specific contributions. Rather, the regression analysis indicatedthat Chl had a minimal influence on IOPs for Group A data,
Fig. 5. Group B stations show much stronger wavelength dependence in the
particulate backscattering ratio (higher B) than Group A stations, indicating
suspended particle assemblages with significantly different optical properties.
311D. McKee, A. Cunningham / Estuarine, Coastal and Shelf Science 68 (2006) 305e316
Fig. 6. Results of linear regression analyses for the segregated data set. IOPs from Group A stations correlate well with MSS while IOPs from Group B stations can
be correlated with Chl. The equations displayed are for best-fit lines forced through the origin.
while the effect of MSS could be neglected for Group B sta-tions. In order to distinguish ‘effective’ material-specificIOPs from ‘true’ values they were denoted by aþ(l) etc. ratherthan the normal a*(l). Fig. 7 shows effective material-specificabsorption and scattering spectra (with 95% confidence inter-vals) for Group A and Group B stations. The aþMSS spectrumfor Group A stations (Fig. 7a) increased exponentially intothe blue as expected for mineral rich waters, with a small re-sidual chlorophyll absorption peak at 676 nm. The bþMSS spec-trum for Group A stations (Fig. 7b) was relatively flat with
wavelength, with a very slight decrease towards shorter wave-lengths. Fig. 7d indicates that effective chlorophyll-specificscattering (bþChl) for Group B stations was also only slightlywavelength dependent, though in this case the decrease was to-wards longer wavelengths. Finally, the ratio of blue to red ab-sorption in the aþChl spectrum shown in Fig. 7c was slightlyhigher than expected, probably due to residual absorption bydetrital materials in these measurements. Numerical valuesfor effective material-specific particulate backscattering coef-ficients are given in Table 1 for both Group A and Group B

312 D. McKee, A. Cunningham / Estuarine, Coastal and Shelf Science 68 (2006) 305e316
Fig. 7. Spectral values of effective material-specific absorption and scattering coefficients for Group A and Group B subsets derived using linear regression
coefficients. The bars indicate 95% confidence intervals.
subsets. In both cases the effective specific particulate back-scattering was slightly higher in the blue than in the red. Nu-merical values of the effective material-specific absorption andscattering coefficients are given in Table 2.
3.5. A method for estimating Irish Sea IOPs fromconstituents
One application for the effective material-specific IOPs de-rived above would be for the estimation of total IOPs fromdata sets containing only constituent information (Chl, MSSand CDOM). Before this can be done, however, we need to de-termine the quality of the material-specific IOPs and a meansof identifying water types from constituents. The merit ofthese effective material-specific IOPs can be partially assessed
Table 1
Effective material-specific particulate backscattering coefficients (with 95%
confidence intervals) for Group A and Group B subsets derived from linear
regressions
Group A Group B
bbpþ
MSS
(m2 g�1)
bbpþ
Chl
(m2 mg�1)
470 nm 0.0152� 0.0011 0.0050� 0.0009
676 nm 0.0141� 0.0013 0.0041� 0.0007
in terms of their self-consistency when used in a model for es-timating total IOPs from the analysis of seawater constituents.In the absence of backscattering and absorption measure-ments, the water has to be categorised as Group A or GroupB (or equivalents) using the constituent concentrations them-selves. Since the ratio of Chl/MSS was lower than 0.4 mg g�1
for 93% of the Group A stations and above 0.4 mg g�1 for86% of the Group B stations, Chl/MSS¼ 0.4 mg g�1 wasfound to be an optimal threshold for discriminating betweenGroup A and Group B waters for this data set. ParticulateIOPs were calculated using the material-specific IOPs derivedpreviously together with measured values of either MSS orChl depending on whether a station had been classed as groupA or B using the Chl/MSS threshold. The absorption byCDOM was calculated using
aCDOMðlÞ ¼ a0CDOMð440ÞPeð�0:014ðl�440ÞÞ � eð�0:014ð715�440ÞÞR;
ð2Þ
where a0CDOM was the measured absorption by CDOM at440 nm and the second term inside the square brackets ensuredthat absorption by CDOM at 715 nm was zero. This wasnecessary for compatibility with AC-9 measurements. Theexponent of 0.014 nm�1 is widely used and reasonably typicalof these waters: our observed values lie in the range of
313D. McKee, A. Cunningham / Estuarine, Coastal and Shelf Science 68 (2006) 305e316
Table 2
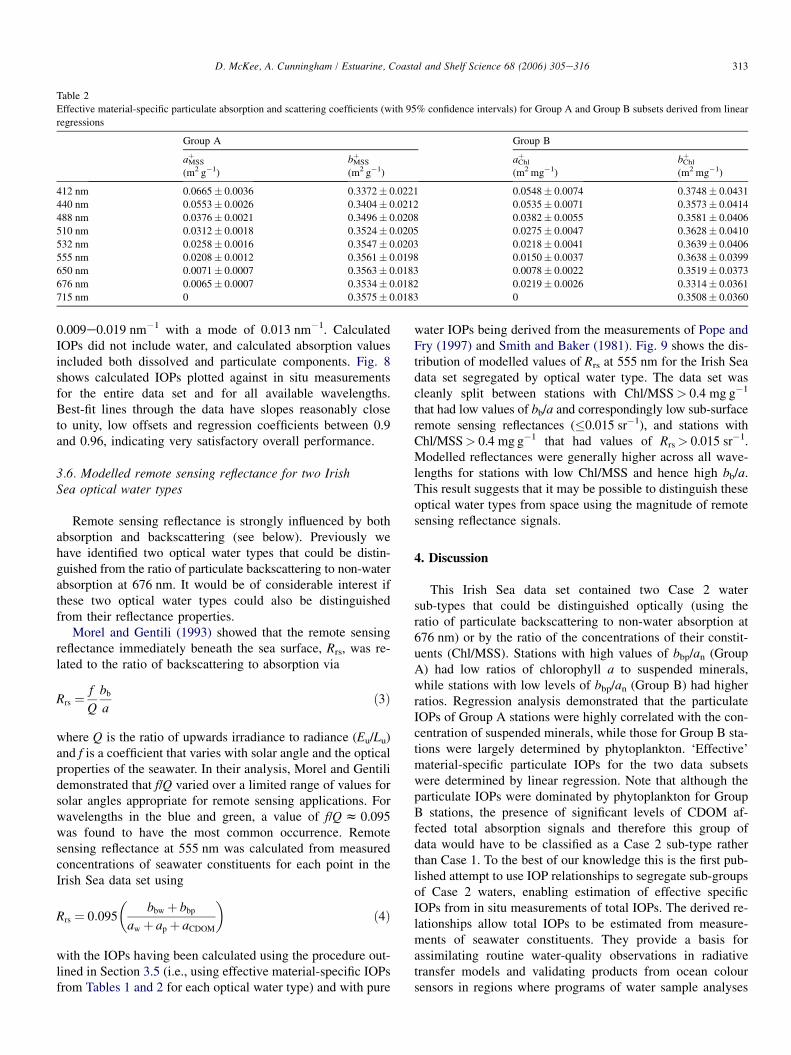
Effective material-specific particulate absorption and scattering coefficients (with 95% confidence intervals) for Group A and Group B subsets derived from linear
regressions
Group A Group B
aþMSS
(m2 g�1)
bþMSS
(m2 g�1)
aþChl
(m2 mg�1)
bþChl
(m2 mg�1)
412 nm 0.0665� 0.0036 0.3372� 0.0221 0.0548� 0.0074 0.3748� 0.0431
440 nm 0.0553� 0.0026 0.3404� 0.0212 0.0535� 0.0071 0.3573� 0.0414
488 nm 0.0376� 0.0021 0.3496� 0.0208 0.0382� 0.0055 0.3581� 0.0406
510 nm 0.0312� 0.0018 0.3524� 0.0205 0.0275� 0.0047 0.3628� 0.0410
532 nm 0.0258� 0.0016 0.3547� 0.0203 0.0218� 0.0041 0.3639� 0.0406
555 nm 0.0208� 0.0012 0.3561� 0.0198 0.0150� 0.0037 0.3638� 0.0399
650 nm 0.0071� 0.0007 0.3563� 0.0183 0.0078� 0.0022 0.3519� 0.0373
676 nm 0.0065� 0.0007 0.3534� 0.0182 0.0219� 0.0026 0.3314� 0.0361
715 nm 0 0.3575� 0.0183 0 0.3508� 0.0360
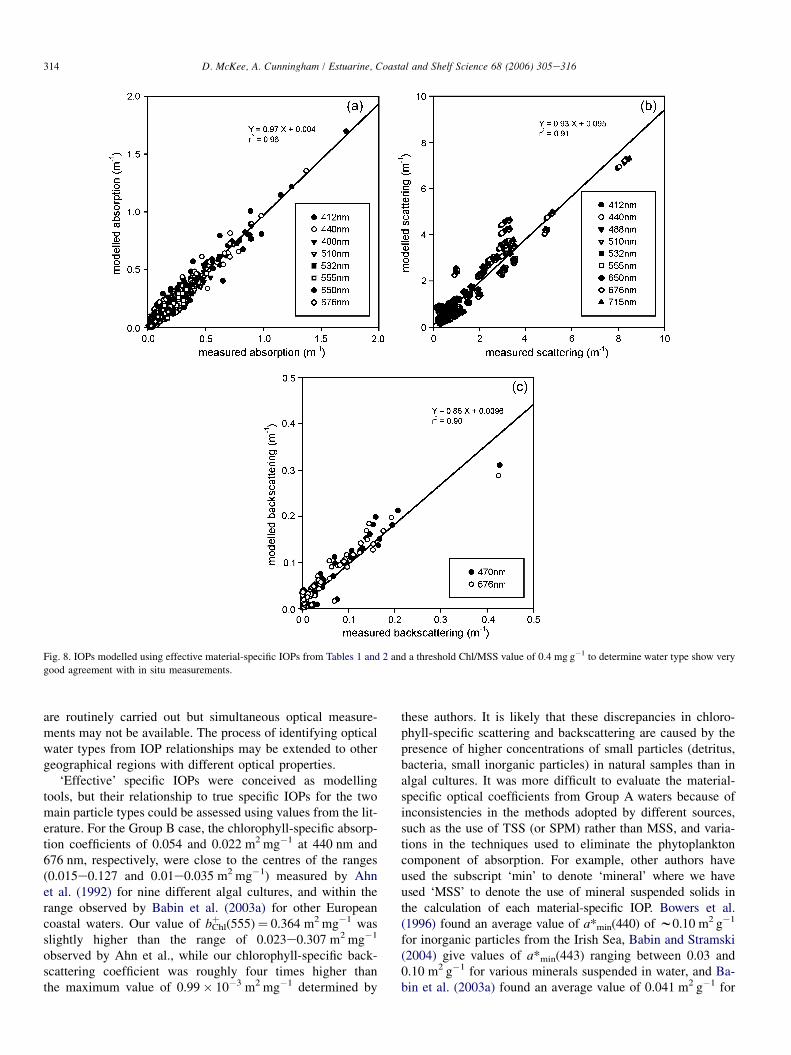
0.009e0.019 nm�1 with a mode of 0.013 nm�1. CalculatedIOPs did not include water, and calculated absorption valuesincluded both dissolved and particulate components. Fig. 8shows calculated IOPs plotted against in situ measurementsfor the entire data set and for all available wavelengths.Best-fit lines through the data have slopes reasonably closeto unity, low offsets and regression coefficients between 0.9and 0.96, indicating very satisfactory overall performance.
3.6. Modelled remote sensing reflectance for two IrishSea optical water types
Remote sensing reflectance is strongly influenced by bothabsorption and backscattering (see below). Previously wehave identified two optical water types that could be distin-guished from the ratio of particulate backscattering to non-waterabsorption at 676 nm. It would be of considerable interest ifthese two optical water types could also be distinguishedfrom their reflectance properties.
Morel and Gentili (1993) showed that the remote sensingreflectance immediately beneath the sea surface, Rrs, was re-lated to the ratio of backscattering to absorption via
Rrs ¼f
Q
bb
að3Þ
where Q is the ratio of upwards irradiance to radiance (Eu/Lu)and f is a coefficient that varies with solar angle and the opticalproperties of the seawater. In their analysis, Morel and Gentilidemonstrated that f/Q varied over a limited range of values forsolar angles appropriate for remote sensing applications. Forwavelengths in the blue and green, a value of f/Q z 0.095was found to have the most common occurrence. Remotesensing reflectance at 555 nm was calculated from measuredconcentrations of seawater constituents for each point in theIrish Sea data set using
Rrs ¼ 0:095
�bbwþ bbp
aw þ apþ aCDOM
�ð4Þ
with the IOPs having been calculated using the procedure out-lined in Section 3.5 (i.e., using effective material-specific IOPsfrom Tables 1 and 2 for each optical water type) and with pure
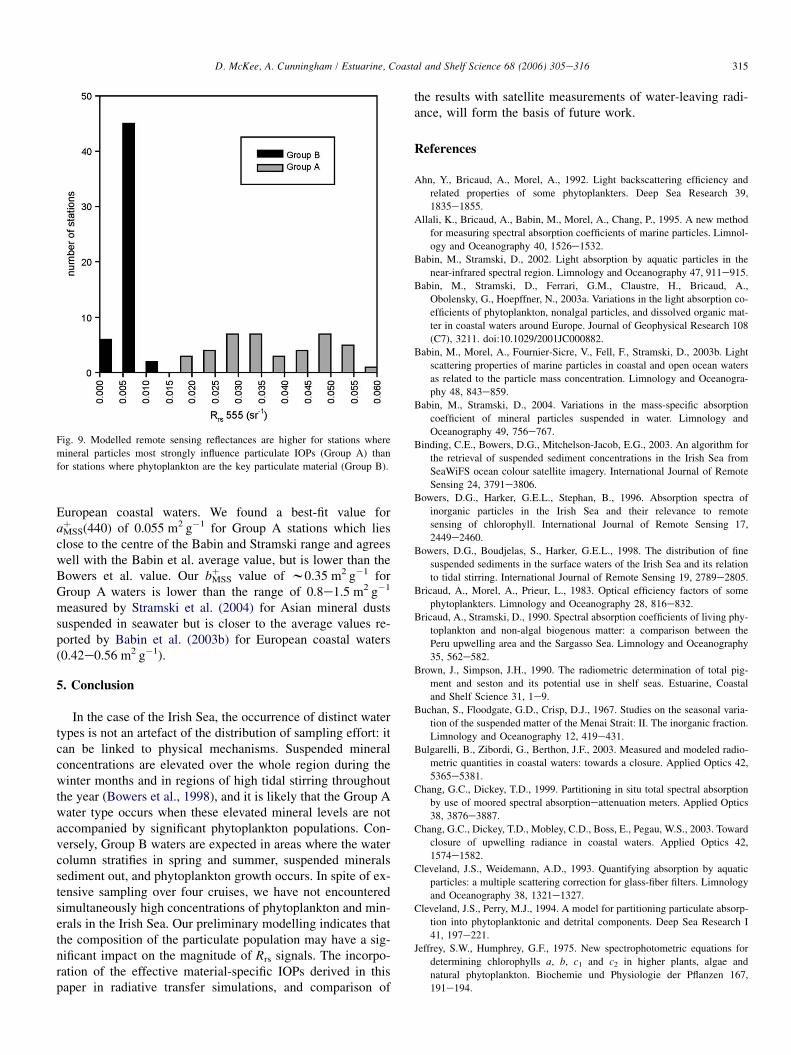
water IOPs being derived from the measurements of Pope andFry (1997) and Smith and Baker (1981). Fig. 9 shows the dis-tribution of modelled values of Rrs at 555 nm for the Irish Seadata set segregated by optical water type. The data set wascleanly split between stations with Chl/MSS> 0.4 mg g�1
that had low values of bb/a and correspondingly low sub-surfaceremote sensing reflectances (�0.015 sr�1), and stations withChl/MSS> 0.4 mg g�1 that had values of Rrs> 0.015 sr�1.Modelled reflectances were generally higher across all wave-lengths for stations with low Chl/MSS and hence high bb/a.This result suggests that it may be possible to distinguish theseoptical water types from space using the magnitude of remotesensing reflectance signals.
4. Discussion
This Irish Sea data set contained two Case 2 watersub-types that could be distinguished optically (using theratio of particulate backscattering to non-water absorption at676 nm) or by the ratio of the concentrations of their constit-uents (Chl/MSS). Stations with high values of bbp/an (GroupA) had low ratios of chlorophyll a to suspended minerals,while stations with low levels of bbp/an (Group B) had higherratios. Regression analysis demonstrated that the particulateIOPs of Group A stations were highly correlated with the con-centration of suspended minerals, while those for Group B sta-tions were largely determined by phytoplankton. ‘Effective’material-specific particulate IOPs for the two data subsetswere determined by linear regression. Note that although theparticulate IOPs were dominated by phytoplankton for GroupB stations, the presence of significant levels of CDOM af-fected total absorption signals and therefore this group ofdata would have to be classified as a Case 2 sub-type ratherthan Case 1. To the best of our knowledge this is the first pub-lished attempt to use IOP relationships to segregate sub-groupsof Case 2 waters, enabling estimation of effective specificIOPs from in situ measurements of total IOPs. The derived re-lationships allow total IOPs to be estimated from measure-ments of seawater constituents. They provide a basis forassimilating routine water-quality observations in radiativetransfer models and validating products from ocean coloursensors in regions where programs of water sample analyses
314 D. McKee, A. Cunningham / Estuarine, Coastal and Shelf Science 68 (2006) 305e316
Fig. 8. IOPs modelled using effective material-specific IOPs from Tables 1 and 2 and a threshold Chl/MSS value of 0.4 mg g�1 to determine water type show very
good agreement with in situ measurements.
are routinely carried out but simultaneous optical measure-ments may not be available. The process of identifying opticalwater types from IOP relationships may be extended to othergeographical regions with different optical properties.
‘Effective’ specific IOPs were conceived as modellingtools, but their relationship to true specific IOPs for the twomain particle types could be assessed using values from the lit-erature. For the Group B case, the chlorophyll-specific absorp-tion coefficients of 0.054 and 0.022 m2 mg�1 at 440 nm and676 nm, respectively, were close to the centres of the ranges(0.015e0.127 and 0.01e0.035 m2 mg�1) measured by Ahnet al. (1992) for nine different algal cultures, and within therange observed by Babin et al. (2003a) for other Europeancoastal waters. Our value of bþChl(555)¼ 0.364 m2 mg�1 wasslightly higher than the range of 0.023e0.307 m2 mg�1
observed by Ahn et al., while our chlorophyll-specific back-scattering coefficient was roughly four times higher thanthe maximum value of 0.99� 10�3 m2 mg�1 determined by
these authors. It is likely that these discrepancies in chloro-phyll-specific scattering and backscattering are caused by thepresence of higher concentrations of small particles (detritus,bacteria, small inorganic particles) in natural samples than inalgal cultures. It was more difficult to evaluate the material-specific optical coefficients from Group A waters because ofinconsistencies in the methods adopted by different sources,such as the use of TSS (or SPM) rather than MSS, and varia-tions in the techniques used to eliminate the phytoplanktoncomponent of absorption. For example, other authors haveused the subscript ‘min’ to denote ‘mineral’ where we haveused ‘MSS’ to denote the use of mineral suspended solids inthe calculation of each material-specific IOP. Bowers et al.(1996) found an average value of a*min(440) of w0.10 m2 g�1
for inorganic particles from the Irish Sea, Babin and Stramski(2004) give values of a*min(443) ranging between 0.03 and0.10 m2 g�1 for various minerals suspended in water, and Ba-bin et al. (2003a) found an average value of 0.041 m2 g�1 for
315D. McKee, A. Cunningham / Estuarine, Coastal and Shelf Science 68 (2006) 305e316
European coastal waters. We found a best-fit value foraþMSS(440) of 0.055 m2 g�1 for Group A stations which liesclose to the centre of the Babin and Stramski range and agreeswell with the Babin et al. average value, but is lower than theBowers et al. value. Our bþMSS value of w0.35 m2 g�1 forGroup A waters is lower than the range of 0.8e1.5 m2 g�1
measured by Stramski et al. (2004) for Asian mineral dustssuspended in seawater but is closer to the average values re-ported by Babin et al. (2003b) for European coastal waters(0.42e0.56 m2 g�1).
5. Conclusion
In the case of the Irish Sea, the occurrence of distinct watertypes is not an artefact of the distribution of sampling effort: itcan be linked to physical mechanisms. Suspended mineralconcentrations are elevated over the whole region during thewinter months and in regions of high tidal stirring throughoutthe year (Bowers et al., 1998), and it is likely that the Group Awater type occurs when these elevated mineral levels are notaccompanied by significant phytoplankton populations. Con-versely, Group B waters are expected in areas where the watercolumn stratifies in spring and summer, suspended mineralssediment out, and phytoplankton growth occurs. In spite of ex-tensive sampling over four cruises, we have not encounteredsimultaneously high concentrations of phytoplankton and min-erals in the Irish Sea. Our preliminary modelling indicates thatthe composition of the particulate population may have a sig-nificant impact on the magnitude of Rrs signals. The incorpo-ration of the effective material-specific IOPs derived in thispaper in radiative transfer simulations, and comparison of
Fig. 9. Modelled remote sensing reflectances are higher for stations where
mineral particles most strongly influence particulate IOPs (Group A) than
for stations where phytoplankton are the key particulate material (Group B).
the results with satellite measurements of water-leaving radi-ance, will form the basis of future work.
References
Ahn, Y., Bricaud, A., Morel, A., 1992. Light backscattering efficiency and
related properties of some phytoplankters. Deep Sea Research 39,
1835e1855.
Allali, K., Bricaud, A., Babin, M., Morel, A., Chang, P., 1995. A new method
for measuring spectral absorption coefficients of marine particles. Limnol-
ogy and Oceanography 40, 1526e1532.
Babin, M., Stramski, D., 2002. Light absorption by aquatic particles in the
near-infrared spectral region. Limnology and Oceanography 47, 911e915.
Babin, M., Stramski, D., Ferrari, G.M., Claustre, H., Bricaud, A.,
Obolensky, G., Hoepffner, N., 2003a. Variations in the light absorption co-
efficients of phytoplankton, nonalgal particles, and dissolved organic mat-
ter in coastal waters around Europe. Journal of Geophysical Research 108
(C7), 3211. doi:10.1029/2001JC000882.
Babin, M., Morel, A., Fournier-Sicre, V., Fell, F., Stramski, D., 2003b. Light
scattering properties of marine particles in coastal and open ocean waters
as related to the particle mass concentration. Limnology and Oceanogra-
phy 48, 843e859.
Babin, M., Stramski, D., 2004. Variations in the mass-specific absorption
coefficient of mineral particles suspended in water. Limnology and
Oceanography 49, 756e767.
Binding, C.E., Bowers, D.G., Mitchelson-Jacob, E.G., 2003. An algorithm for
the retrieval of suspended sediment concentrations in the Irish Sea from
SeaWiFS ocean colour satellite imagery. International Journal of Remote
Sensing 24, 3791e3806.
Bowers, D.G., Harker, G.E.L., Stephan, B., 1996. Absorption spectra of
inorganic particles in the Irish Sea and their relevance to remote
sensing of chlorophyll. International Journal of Remote Sensing 17,
2449e2460.
Bowers, D.G., Boudjelas, S., Harker, G.E.L., 1998. The distribution of fine
suspended sediments in the surface waters of the Irish Sea and its relation
to tidal stirring. International Journal of Remote Sensing 19, 2789e2805.
Bricaud, A., Morel, A., Prieur, L., 1983. Optical efficiency factors of some
phytoplankters. Limnology and Oceanography 28, 816e832.
Bricaud, A., Stramski, D., 1990. Spectral absorption coefficients of living phy-
toplankton and non-algal biogenous matter: a comparison between the
Peru upwelling area and the Sargasso Sea. Limnology and Oceanography
35, 562e582.
Brown, J., Simpson, J.H., 1990. The radiometric determination of total pig-
ment and seston and its potential use in shelf seas. Estuarine, Coastal
and Shelf Science 31, 1e9.
Buchan, S., Floodgate, G.D., Crisp, D.J., 1967. Studies on the seasonal varia-
tion of the suspended matter of the Menai Strait: II. The inorganic fraction.
Limnology and Oceanography 12, 419e431.
Bulgarelli, B., Zibordi, G., Berthon, J.F., 2003. Measured and modeled radio-
metric quantities in coastal waters: towards a closure. Applied Optics 42,
5365e5381.
Chang, G.C., Dickey, T.D., 1999. Partitioning in situ total spectral absorption
by use of moored spectral absorptioneattenuation meters. Applied Optics
38, 3876e3887.
Chang, G.C., Dickey, T.D., Mobley, C.D., Boss, E., Pegau, W.S., 2003. Toward
closure of upwelling radiance in coastal waters. Applied Optics 42,
1574e1582.
Cleveland, J.S., Weidemann, A.D., 1993. Quantifying absorption by aquatic
particles: a multiple scattering correction for glass-fiber filters. Limnology
and Oceanography 38, 1321e1327.
Cleveland, J.S., Perry, M.J., 1994. A model for partitioning particulate absorp-
tion into phytoplanktonic and detrital components. Deep Sea Research I
41, 197e221.
Jeffrey, S.W., Humphrey, G.F., 1975. New spectrophotometric equations for
determining chlorophylls a, b, c1 and c2 in higher plants, algae and
natural phytoplankton. Biochemie und Physiologie der Pflanzen 167,
191e194.

316 D. McKee, A. Cunningham / Estuarine, Coastal and Shelf Science 68 (2006) 305e316
Kiefer, D.A., SooHoo, J.B., 1982. Spectral absorption by marine particles of
coastal waters of Baja California. Limnology and Oceanography 27,
492e499.
Kirk, J.T.O., 1981. Monte Carlo procedure for simulating the penetration of
light into natural waters. CSIRO Australian Division of Plant Industry
Technical Paper No. 36, 1e16.
Kirk, J.T.O., 1992. Monte Carlo modelling of the performance of a reflective
tube absorption meter. Applied Optics 31, 6463e6468.
Kishino, M., Takahashi, M., Okami, N., Ichimura, S., 1985. Estimation of the
spectral absorption coefficients of phytoplankton in the sea. Limnology
and Oceanography 27, 492e499.
Maske, H., Haardt, H., 1987. Quantitative in vivo absorption spectra of phyto-
plankton; detrital absorption and comparison with fluorescence excitation
spectra. Limnology and Oceanography 32, 620e633.
McKee, D., Cunningham, A., Jones, K.J., 2002. Optical and hydrographic con-
sequences of freshwater run-off during spring phytoplankton growth in
a Scottish fjord. Journal of Plankton Research 24, 1163e1171.
McKee, D., Cunningham, A., Craig, S., 2003. Semi-empirical correction algo-
rithm for AC-9 measurements in a coccolithophore bloom. Applied Optics
42, 4369e4373.
McKee, D., Cunningham, A., 2005. Evidence for wavelength dependence of
the scattering phase function and its implication for modelling radiance
transfer in shelf seas. Applied Optics 44, 126e135.
Mitchell, B.G., 1990. Algorithms for determining the absorption coefficient of
aquatic particulates using the quantitative filter technique (QFT). In: Ocean
Optics X. Proceedings of SPIE, vol. 1302, pp. 137e148.
Mitchell, B.G., Kiefer, D.A., 1984. Determination of absorption and fluores-
cence excitation spectra for phytoplankton. In: Holm-Hansen, O.,
Bolis, L., Gilles, R. (Eds.), Marine Phytoplankton and Productivity.
Springer-Verlag, Berlin, New York.
Mitchelson, E.G., 1984. Phytoplankton and suspended sediment distributions
in relation to physical structure and water-leaving signals. PhD thesis, Uni-
versity of Wales, Bangor, U.K., unpublished.
Mitchelson, E.G., Jacob, N.J., Simpson, J.H., 1986. Ocean colour algorithms
from the case 2 waters of the Irish Sea in comparison to algorithms
from case 1 waters. Continental Shelf Research 5, 403e415.
Mobley, C.D., 1994. Light and Water; Radiative Transfer in Natural Waters.
Academic, San Diego.
Morel, A., Gentili, B., 1993. Diffuse reflectance of oceanic waters. II. Bidirec-
tional aspects. Applied Optics 32, 6864e6879.
Morrow, J.H., Chamberlin, W.S., Kiefer, D.A., 1989. A two-component de-
scription of spectral absorption by marine particles. Limnology and Ocean-
ography 34, 1500e1509.
Neumuller, M., Cunningham, A., McKee, D., 2002. Assessment of a micro-
scopic photobleaching technique for measuring the spectral absorption ef-
ficiency of individual phytoplankton cells. Journal of Plankton Research
24, 741e746.
Pegau, W.S., Gray, D., Zaneveld, J.R.V., 1997. Absorption and attenuation of
visible and near-infrared light in water: dependence on temperature and sa-
linity. Applied Optics 36, 6035e6046.
Petzold, T.J., 1972. Volume scattering functions for selected ocean waters. SIO
Reference Series. Scripps Institution of Oceanography Ref. 72e78. In:
Tyler, J.E. (Ed.), Light in the Sea. Dowden, Hutchinson & Ross, Strouds-
berg, 1977, pp. 150e174, 79 pp. (Chapter 12).
Piskozub, J., Flatau, P.J., Zaneveld, J.R.V., 2001. Monte Carlo study of the
scattering error of a quartz reflective absorption tube. Journal of Atmo-
spheric and Oceanic Technology 18, 438e445.
Pope, R.M., Fry, E.S., 1997. Absorption spectrum (380e700 nm) of pure
water. II. Integrating cavity measurements. Applied Optics 36,
8710e8723.
Roesler, C.S., 1998. Theoretical and experimental approaches to improve the
accuracy of particulate absorption coefficients derived from the quantita-
tive filter technique. Limnology and Oceanography 43, 1649e1660.
Roesler, C.S., Perry, M.J., Carder, K.L., 1989. Modelling in situ phytoplankton
absorption from total absorption spectra in productive inland waters. Lim-
nology and Oceanography 34, 1510e1523.
Sathe, P.V., Sathyendranath, S., 1992. A fortran-77 program for Monte Carlo
simulation of upwelling light from the sea. Computers and Geosciences 18,
487e507.
Sathyendranath, S., Prieur, L., Morel, A., 1989. A three-component model of
ocean colour and its application to remote sensing of phytoplankton pig-
ments in coastal waters. International Journal of Remote Sensing 10,
1373e1394.
Smith, R.C., Baker, K., 1981. Optical properties of the clearest natural waters
(200e800 nm). Applied Optics 20, 177e184.
Smith, R.C., Prezelin, B.B., Bidigare, R.R., Baker, K.S., 1989. Bio-optical
modelling of photosynthetic production in coastal waters. Limnology
and Oceanography 34, 1524e1544.
Stramski, D., 1990. Artifacts in measuring absorption spectra of phytoplankton
collected on a filter. Limnology and Oceanography 35, 1804e1809.
Stramski, D., Morel, A., 1990. Optical properties of photosynthetic picoplank-
ton in different physiological states as affected by growth irradiance. Deep
Sea Research 37, 245e266.
Stramski, D., Wozniak, S.B., Flatau, P.J., 2004. Optical properties of Asian
mineral dust suspended in seawater. Limnology and Oceanography 49,
749e755.
Weeks, A.R., Simpson, J.H., 1991. The measurement of suspended particulate
concentrations from remotely-sensed data. International Journal of Remote
Sensing 12, 725e737.
Yentsch, C.S., 1962. Measurement of visible light absorption by particulate
matter in the ocean. Limnology and Oceanography 7, 207e217.
Zaneveld, J.R.V., Kitchen, J.C., Moore, C., 1994. The scattering error correc-
tion of reflecting-tube absorption meters. In: Jaffe, J.S. (Ed.), Proceedings
of Ocean Optics XII, vol. 2258. SPIE, pp. 44e55.