iddle rio grande new mexico may draft prepared forpierre/ce_old... · (b) and was collected between...
TRANSCRIPT

DRAFT
LOW FLOW CONVEYANCE CHANNEL
BORAMEP TOTAL LOAD ANALYSIS
2001
MIDDLE RIO GRANDE, NEW MEXICO
MAY 2005
PREPARED FOR: US BUREAU OF RECLAMATION ALBUQUERQUE, NEW MEXICO
PREPARED BY: FORREST JAY
JASON ALBERT DR. PIERRE Y. JULIEN
COLORADO STATE UNIVERSITY ENGINEERING RESEARCH CENTER
DEPARTMENT OF CIVIL ENGINEERING FORT COLLINS, COLORADO 80523

DRAFT

i
DRAFT
Abstract
The Low Flow Conveyance Channel begins where water from the Middle Rio
Grande is diverted at the San Acacia Diversion Dam. It was built to increase the water
delivery to Elephant Butte Reservoir and to provide more effective sediment transport.
The total load and sand load at three cross sections of the Low Flow Conveyance
Channel were calculated using three different methods. The suspended sediment load
was also calculated.
BORAMEP, a computer program that utilizes the Modified Einstein Procedure,
was used to estimate the total load and sand load. BORAMEP was found to be
moderately effective when estimating the sand load and total load of a sand bed
channel such as the Low Flow Conveyance Channel.
The BORAMEP results suggest that the total load is between 100 and 1300 tons
per day and the sand load is between 10 and 150 tons per day at flow rates near 300
cfs. At flow rates near 600 cfs, the total load range is between 350 and 1150 tons per
day and the sand load range is between 50 and 450 tons per day.
BORAMEP total load results appear to be consistent with the total load
measurements from the sampling sills at flow rates near 300 cfs but tend to
underestimate the total load at flow rates near 600 cfs by at least a factor of two when
compared to the total load measurements from the sampling sills. Sand load estimates
from BORAMEP appear to be consistent with sand load estimates from the sampling sills
at flow rates near 300 and 600 cfs

ii
DRAFT
Table of Contents Abstract ........................................................................................................................................... i Table of Contents ......................................................................................................................... ii List of Tables ................................................................................................................................ iii List of Figures............................................................................................................................... iv 1. Introduction ........................................................................................................................... 1 2. Methods.................................................................................................................................. 2
2.1. Method A........................................................................................................................ 2 2.2. Method B........................................................................................................................ 4 2.3. Method C........................................................................................................................ 5 2.4. Method D ....................................................................................................................... 5
3. Results and Discussion ........................................................................................................ 7 3.1. Method D ....................................................................................................................... 7 3.2. Method A........................................................................................................................ 8 3.3. Method B........................................................................................................................ 9 3.4. Method C...................................................................................................................... 11
4. Comparisons of Methods ................................................................................................... 12 5. Comparison to LFCC Results from Rating Curves.......................................................... 21 6. Comparison to Total Load Sampling Sills........................................................................ 32 7. Conclusions .......................................................................................................................... 36 Appendix A: BORAMEP Input Sheets ..................................................................................... 39 Appendix B: BORAMEP Error Messages for Methods A and B............................................ 45 Appendix C: BORAMEP Error Messages for Method D ........................................................ 48 Appendix D: BORAMEP Method A Output ............................................................................. 50 Appendix E: BORAMEP Method D Output ............................................................................. 56 Appendix F: BORAMEP Method B Output .............................................................................. 58 Appendix G: Method C Results................................................................................................ 63 Appendix H: Ratio of Sand Load to Wash Load ................................................................... 68 Appendix I: LFCC Maps ............................................................................................................ 71

iii
DRAFT
List of Tables Table 2-1. Left and Right Endpoints of Mobile Bed Section ................................................. 5 Table 3-1. Total Load Results from Method D........................................................................ 7 Table 3-2. Total Load Results from Method A ........................................................................ 9 Table 3-3. Total Load Results from Method B at 300 cfs ................................................... 10 Table 3-4. Total Load Results from Method B at 600 cfs ................................................... 10 Table 3-5. Suspended Sediment Load from Method C........................................................ 11 Table 4-1. Comparison to Method A at 300 cfs .................................................................... 12 Table 4-2. Comparison to Method A at 600 cfs .................................................................... 13 Table 4-3. Comparison to Method D at 300 cfs.................................................................... 14 Table 4-4. Comparison to Method D at 600 cfs.................................................................... 14 Table 4-5. Comparison to Suspended Sediment Load at 300 cfs ...................................... 20 Table 4-6. Comparison to Suspended Sediment Load at 600 cfs ...................................... 20

iv
DRAFT
List of Figures Figure 4-1. Total Sediment Load Method Comparison 300 cfs Run.................................. 15 Figure 4-2. Total Sediment Load Method Comparison 600 cfs Run.................................. 16 Figure 4-3. Sand Load and Wash Load as Part of Total Load for Method D at 300 and 600 cfs.......................................................................................................................................... 17 Figure 4-4. Sand Load and Wash Load as Part of Total Load for Method A at 300 and 600 cfs.......................................................................................................................................... 18 Figure 4-5. Sand Load and Wash Load as Part of Total Load for Method B at 300 and 600 cfs.......................................................................................................................................... 19 Figure 5-1. LFCC Total Load vs. River Discharge Rating Curve ......................................... 22 Figure 5-2. LFCC Total Load vs. Suspended Sediment Load Rating Curve...................... 22 Figure 5-3. LFCC Total Load vs. Suspended Sediment Conc. Rating Curve .................... 23 Figure 5-4. LFCC Sand Load vs. River Discharge Rating Curve ......................................... 24 Figure 5-5. LFCC Sand Load vs. Suspended Sediment Load Rating Curve ...................... 24 Figure 5-6. LFCC Sand Load vs. Suspended Sediment Conc. Rating Curve..................... 25 Figure 5-7. Total Load Comparison of Method A to the Rating Curve Results at Flow Rates Near 300 cfs ..................................................................................................................... 27 Figure 5-8. Total Load Comparison of Method A to the Rating Curve Results at Flow Rates Near 600 cfs ..................................................................................................................... 27 Figure 5-9. Sand Load Comparison of Method A to the Rating Curve Results at Flow Rates Near 300 cfs ..................................................................................................................... 29 Figure 5-10. Sand Load Comparison of Method A to the Rating Curve Results at Flow Rates Near 600 cfs ..................................................................................................................... 29 Figure 5-11. BORAMEP Total Load Variability....................................................................... 30 Figure 5-12. BORAMEP Sand Load Variability....................................................................... 31 Figure 6-1. Sampling Sill and BORAMEP Total Load vs. Date at 300 cfs.......................... 33 Figure 6-2. Sampling Sill and BORAMEP Total Load vs. Date at 600 cfs.......................... 33 Figure 6-3. Sampling Sill and BORAMEP Total Load vs. Flow Rate ................................... 34 Figure 6-4. Sampling Sill and BORAMEP Sand Load vs. Flow Rate ................................... 35 Figure 7-1. Total Load vs. Discharge ..................................................................................... 36 Figure 7-2. Sand Load vs. Discharge ..................................................................................... 37

1
DRAFT
1. Introduction
The Low Flow Conveyance Channel (LFCC) on the Middle Rio Grande was
designed to increase the volume of water delivered to Elephant Butte Reservoir and to
provide more effective sediment transport in the channel. The start of the LFCC is at
the San Acacia Diversion Dam where water is diverted from the Rio Grande into the
LFCC. When evaluating hydraulic systems such as the LFCC, it is important to quantify
the amount of sediment transport. This is usually done by calculating the total load in
the LFCC. The total load comes from two parts: the measured and unmeasured load.
Because only part of the total load is measured in the field, it is important to get an
accurate estimate of the total load from the field measurements. The Bureau of
Reclamation Automated Modified Einstein Procedure (BORAMEP) is a computer program
that uses the Modified Einstein Procedure to estimate the total sediment load. The
purpose of this project was to use BORAMEP for calculating the total load in the LFCC
for flow rates near 300 and 600 cfs in order to evaluate the effectiveness of BORAMEP
for sand bed channels like the LFCC.

2
DRAFT
2. Methods
The bed material and suspended sediment data for the LFCC for the flow rates of
300 and 600 cfs were acquired from the United States Bureau of Reclamation. The
percentage of the sample within each corresponding bin or size class for the suspended
and bed material samples was calculated for later use. This data consisted of three
trials (A, B, and C) for each cross section LF-11, LF-25, and LF-39. For a map
containing the relative locations of these cross sections and the sampling sills see
Appendix I. For each trial at each corresponding cross section, the samples were taken
at 7 sections within each cross section. Each sample was labeled appropriately on the
BORAMEP input sheet. An example of a label appears like this: LF-25B-25-30. This
label means that this sample came from the LF-25 cross section, was the second trial
(B) and was collected between stations 25 and 30 ft on the cross section. This
sediment data was then organized with the flow rate data recorded at each cross
section on the same day the sediment samples were collected. (See Appendix A:
BORAMEP Input Sheets).
2.1. Method A
Method A involved summing up the total load results from BORAMEP outputs for
each of the seven samples (verticals) within each cross section. Each cross section
consisted of BORAMEP total load estimates for the seven verticals within each cross
section. The results from each run for every cross section were incomplete because

3
DRAFT
two types of errors occurred when using BORAMEP. The first error encountered was
“FITTED Z-VALUES GENERATED NEGATIVE EXPONENT, NOT CONTINUING….” This
meant that the relationship between the Z-value and the fall velocity generated a
negative exponent when the power curve was fitted in the Modified Einstein Procedure
(MEP). This Z-value is a theoretical exponent of the equation that describes the vertical
distribution of suspended sediment of a certain size range. Turbulence caused by bed
forms such as dunes could cause higher sediment concentrations higher up in the water
column than at the bottom of the water column; this would cause this error message to
occur. The other error encountered was “NOT ENOUGH OVERLAPPING BINS FOR
MEP”. This message occurred often because the sediment size distribution in both the
suspended sediment and bed material samples were relatively uniform for many of the
parts of each cross section and because the suspended sediment was usually much
finer than the bed material samples. In order for BORAMEP to run, there must be at
least two overlapping bins between the suspended sediment samples and the bed
material samples. Particles smaller than sand (0.0625 mm) are not used when
BORAMEP is using the overlapping bins in Z-value calculations, these particles are
considered wash load. Due to these two error messages occurring so frequently, the
results for every cross section were incomplete. (See Appendix B: BORAMEP error
messages for methods A and B).
Different values of the minimum percentage in bins to be considered during
calculation of the Z-values in the MEP were used in BORAMEP. When values of 1% and
higher were used, the error message indicating that there weren’t enough overlapping

4
DRAFT
bins for the MEP dominated. When 0% was used, there were less errors overall but the
error message indicating that a negative Z-value exponent had been calculated
occurred more often than when a higher percentage was used. Minimum percentage
values between 0% and 1% were tried as an attempt to minimize the total amount of
errors. Using 0% for the minimum percentage in bins to be considered during Z-
calculations resulted in the least amount of errors in the BORAMEP output; this value
was used thereafter every time BORAMEP was run. The missing total load calculations
were calculated by multiplying the average suspended sediment concentration by the
flow rate and multiplied by a conversion factor.
Qs (tons/day) = 0.0027 Q (cfs) C (mg/L)
This gave the suspended sediment load in tons per day. The total sand load was
automatically calculated in BORAMEP when no errors were encountered. When error
messages were encountered, the total sand load for the samples that had error
messages were calculated by multiplying the percent sand (sum of total % in bins with
size greater than 0.0625 mm in suspended sediment samples) by the suspended
sediment load. The wash load was calculated by subtracting the sand load from the
total load.
2.2. Method B
Method B uses all of the BORAMEP output from Method A for the mobile bed
sections and uses the suspended sediment load for the rip rap sections of the cross
sections. Similar to Method A, the suspended sediment total load was calculated when

5
DRAFT
errors were encountered in BORAMEP. Below is a detailed table describing how the
cross section was divided into the mobile bed and rip rap sections (see Table 2-1. Left
and Right Endpoints of Mobile Bed Section).
Table 2-1. Left and Right Endpoints of Mobile Bed Section
Left/Right endpoints of mobile bed section
(ft) Cross Section From Survey Data 300 cfs 600 cfs
LF-11 32 - 50 32 - 48 34 - 50 LF-25 20 - 56 25 - 54 21 - 57 LF-39 24 - 64 29 - 56 20 - 62
2.3. Method C This method consisted of calculating the suspended sediment load for each part
of the cross section by multiplying the suspended sediment concentration by the flow
rate and the appropriate conversion factor giving the suspended sediment load in
tons/day. The total load for the cross section was the sum of the suspended sediment
load for the seven parts of the particular cross section.
2.4. Method D
Since the results were incomplete for Method A, the data for each of the three
runs for each cross section was averaged over the width of each cross section. For the
nine runs, only two error messages were encountered for the 300 cfs flow and one
error message was encountered for the 600 cfs flow. The only type of error message
that occurred was associated with the fitted Z-values generating a negative exponent
(see Appendix C: BORAMEP error messages for Method D). The benefit of this method

6
DRAFT
over methods A, B, and C was that the total load was calculated for at least one run on
each cross section without supplementing the MEP results with suspended sediment
load calculations. The sand load and wash load was calculated in the same manner as
they were in Method A

7
DRAFT
3. Results and Discussion
BORAMEP was run for all methods at the 300 and 600 cfs flow rates. All the
suspended sediment load calculations were made when error messages were
encountered in BORAMEP.
3.1. Method D
The BORAMEP Method D was completed (see Appendix D: BORAMEP Method D
Output). Below are the results from the Method D for the 300 and 600 cfs runs. See
Table 3-1. Total Load Results from Method D.
Table 3-1. Total Load Results from Method D Method D--300 cfs Method D--600 cfs
CR-Sec Q (cfs)
Total Load
(Ton/day)
Sand Load
(Ton/day)
Wash Load
(Ton/Day)
Q (cfs)
Total Load
(Ton/day)
Sand Load
(Ton/day)
Wash Load
(Ton/Day)
LF-11A 280 351 147 204 621 1424 578 846LF-11B 273 212 80 133 595 926 323 602LF-11C 262 179 57 122 579 1228 512 715LF-25A 281 1238 18 1220 587 509 73 435LF-25B 272 907 84 823 566 474 65 409LF-25C 287 1254 15 1239 573 528 86 443LF-39A 287 189 30 159 603 431 54 377LF-39B 277 154 29 125 571 398 41 357LF-39C 290 179 38 142 570 377 34 343
The data sets that have the sand load highlighted in light green were the runs
that had an error message from the BORAMEP program. All three of these errors dealt
with the negative Z-value being generated in the MEP. One result that stands out is the
output from the 300 cfs runs for the LF-25 cross section. The total loads for all three

8
DRAFT
runs are much higher at this cross section than at the other cross sections at 300 cfs.
These are also higher than the total load calculations at the same cross section at a
higher flow rate, 600 cfs. The sediment samples for LF-11, LF-25, and LF-39 were
collected on 6/8/01, 6/11/01, and 6/9/01 respectively. External factors could have
increased the wash load on 6/11/01. This high wash load could be due to the channel
not reaching equilibrium after flow rates were changed, error in data collection (perhaps
recording the wrong suspended sediment concentration), or high wash load in the Rio
Grande on that day. Flow records of the Rio Grande and Rio Puerco (a tributary of the
Rio Grande that enters just above San Acacia and usually contains high sediment loads)
on 6/11/01 were investigated and there is no indication of a significant increase in flow
or suspended sediment concentration. An error in data collection is the likely cause of
the abnormally high total load. The above table indicates that whenever the suspended
sediment load was used instead of the total load from the MEP, the results are lower.
3.2. Method A
The BORAMEP Method A was completed (see Appendix E: BORAMEP Method A
Output). Below are the results from Method A (see Table 3-2. Total Load Results From
Method A).

9
DRAFT
Table 3-2. Total Load Results from Method A Method A--300 cfs Method A--600 cfs
CR-Sec Q (cfs) Total Load
(Ton/day)
Sand Load
(Ton/day)
Wash Load
(Ton/Day)Q (cfs)
Total Load
(Ton/day)
Sand Load
(Ton/day)
Wash Load
(Ton/Day)
LF-11A 280 352 152 199 621 1123 465 658LF-11B 273 220 84 136 595 1036 419 617LF-11C 262 229 85 144 579 1012 450 562LF-25A 281 1284 58 1226 587 514 84 431LF-25B 272 1312 134 1177 566 498 82 416LF-25C 287 1232 92 1140 573 481 87 394LF-39A 287 154 15 139 603 411 57 354LF-39B 277 138 16 123 571 400 45 355LF-39C 290 163 15 148 570 456 49 408
Since there weren’t two sizes of overlapping bins between the suspended sediment and
bed material samples and the fitted Z-values generated a negative exponent up to five
times for each cross section, the BORAMEP results were incomplete for all cross
sections in Method A. The parts of each cross section that were incomplete were
completed by calculating the suspended sediment total load. Given that every trial had
this problem, the total load results were lower than expected.
3.3. Method B
The BORAMEP Method B was completed (see Appendix F: BORAMEP Method B
Output). Shown below are the results from Method B at flow rates of 300 and 600 cfs
(see Table 3-3. Total Load Results from Method B at 300 cfs and Table 3-4. Total Load
Results from Method B at 600 cfs).

10
DRAFT
Table 3-3. Total Load Results from Method B at 300 cfs Method B--300 cfs
Mobile Bed Section
CR-Sec Total
Q (cfs)
Q (cfs)
Total Load (Ton/day)
Sand Load (Ton/day)
Wash Load (Ton/day)
Susp Sed Total Load (Ton/day)
Susp Sed Side
Slopes (Ton/day)
Total Load (Ton/day)
LF-11A 280 181 240 114 126 209 93 333LF-11B 273 173 146 56 90 136 69 216LF-11C 262 184 157 61 96 128 65 222LF-25A 281 220 1128 34 1094 1002 156 1284LF-25B 272 217 1081 55 1026 955 231 1312LF-25C 287 214 949 54 895 894 283 1232LF-39A 287 201 117 7 110 92 37 154LF-39B 277 191 98 15 83 83 40 138LF-39C 290 199 123 14 109 89 40 163
Table 3-4. Total Load Results from Method B at 600 cfs Method B--600 cfs
Mobile Bed Section
CR-Sec Total
Q (cfs)
Q (cfs)
Total Load (Ton/day)
Sand Load (Ton/day)
Wash Load (Ton/day)
Susp Sed Total Load (Ton/day)
Susp Sed Side
Slopes (Ton/day)
Total Load (Ton/day)
LF-11A 621 363 722 327 396 633 394 1117LF-11B 595 349 617 280 337 615 362 979LF-11C 579 345 667 323 343 592 337 1003LF-25A 587 474 432 76 356 413 82 514LF-25B 566 460 416 73 343 392 82 498LF-25C 573 459 397 76 321 376 84 481LF-39A 603 522 360 52 308 339 52 411LF-39B 571 499 357 41 316 317 43 400LF-39C 570 495 414 46 368 312 42 456
The above results show that the suspended sediment total load in the rip rap side slope
areas were always lower than the total load from the mobile bed section. All of the
above results had to be modified because of the occurrence of error messages
indicating that there weren’t enough overlapping bins and the fitted Z-values generated
a negative exponent. The suspended sediment load was calculated for these cases; as

11
DRAFT
a result the total load figures are lower than what they would have been if the MEP was
complete from BORAMEP.
3.4. Method C
Method C was completed (see Appendix G: Method C Results). Shown below
are the results from Method C, which is the sum of the suspended sediment load from
each part of the cross section (see Table 3-5. Suspended Sediment Load from Method
C).
Table 3-5. Suspended Sediment Load from Method C Method C--300 cfs Method C--600 cfs
CR-Sec Date Q (cfs)
Susp Sed Total Load
(Ton/day)
Date Q (cfs) Susp Sed Total Load (Ton/day)
LF-11A 6/8/2001 280 302 5/27/2001 621 1027 LF-11B 6/8/2001 273 206 5/27/2001 595 978 LF-11C 6/8/2001 262 193 5/27/2001 579 929 LF-25A 6/11/2001 281 1158 5/28/2001 587 495 LF-25B 6/11/2001 272 1186 5/28/2001 566 474 LF-25C 6/11/2001 287 1176 5/29/2001 573 460 LF-39A 6/9/2001 287 129 5/29/2001 603 390 LF-39B 6/9/2001 277 123 5/30/2001 571 360 LF-39C 6/9/2001 290 129 5/30/2001 570 354

12
DRAFT
4. Comparisons of Methods
The four methods described above have similar and different results. The total
load results for each method at a flow rate of 300 cfs were first compared to the results
from Method A by dividing the results from the other methods by the total load result
from Method A. See Table 4-1. Comparison to Method A at 300 cfs.
Table 4-1. Comparison to Method A at 300 cfs Method A Method D Method B Method C
CR-Sec Q (cfs)
Total Load (Ton/day)
Total Load (Ton/day)
% of Method
Al
Total Load
(Ton/day)
% of Method
A
Susp Sed Total Load (Ton/day)
% of Method
A
LF-11A 280 352 351 100% 333 95% 302 86%LF-11B 273 220 212 96% 216 98% 206 93%LF-11C 262 229 179 78% 222 97% 193 84%LF-25A 281 1284 1238 96% 1284 100% 1158 90%LF-25B 272 1312 907 69% 1312 100% 1186 90%LF-25C 287 1232 1254 102% 1232 100% 1176 96%LF-39A 287 154 189 122% 154 100% 129 83%LF-39B 277 138 154 111% 138 100% 123 89%LF-39C 290 163 179 110% 163 100% 129 79%
The total load results for each method at a flow rate of 600 cfs were compared
to the results from Method A by dividing the results from the other methods by the total
load result from Method A (see Table 4-2. Comparison to Method A at 600 cfs).

13
DRAFT
Table 4-2. Comparison to Method A at 600 cfs Method A Method D Method B Method C
CR-Sec Q (cfs)
Total Load (Ton/day)
Total Load
(Ton/day)
% of Method
A
Total Load (Ton/day)
% of Method
A
Susp Sed Total Load (Ton/day)
% of Method
A
LF-11A 621 1123 1424 127% 1117 99% 1027 91%LF-11B 595 1036 926 89% 979 95% 978 94%LF-11C 579 1012 1228 121% 1003 99% 929 92%LF-25A 587 514 509 99% 514 100% 495 96%LF-25B 566 498 474 95% 498 100% 474 95%LF-25C 573 481 528 110% 481 100% 460 96%LF-39A 603 411 431 105% 411 100% 390 95%LF-39B 571 400 398 99% 400 100% 360 90%LF-39C 570 456 377 82% 456 100% 354 78%
By closely observing the percent of the total of Method A for Method B at both
flow rates, it is evident that the total loads for method B at cross sections LF-25 and LF-
39 are exactly the same as the total loads for Method A. This is due to the error
messages. The error messages seemed to occur at the stations that were part of the
rip rap side slope areas. The error that seemed to occur most frequently indicated that
there weren’t enough overlapping bins in the suspended sediment and bed material
samples for the MEP to run in BORAMEP. This error message makes sense since the
bed material in the rip rap sections of the channel is coarser than the bed material in
the mobile bed section and the suspended sediment samples. The Modified Einstein
Procedure doesn’t apply over the rip rap side slopes. The results were the same
calculated total load values for the LF-25 and LF-39 cross sections for both Method A
and Method B. The results from the LF-11 cross sections for Method B were within 5%
of Method A.

14
DRAFT
Since Method D was the only one that had complete BORAMEP output for each
cross section, the total load for Methods A, B, and C were compared to the total load
from Method D at 300 cfs. (see Table 4-3. Comparison to Method D at 300 cfs).
Table 4-3. Comparison to Method D at 300 cfs Method D Method A Method B Method C
CR-Sec Q (cfs)
Total Load
(Ton/day)
Total Load
(Ton/day)
% of Method
D
Total Load
(Ton/day)
% of Method
D
Susp Sed Total Load (Ton/day)
% of Method
D
LF-11A 280 351 352 100% 333 95% 302 86%LF-11B 273 212 220 104% 216 102% 206 97%LF-11C 262 179 229 128% 222 124% 193 108%LF-25A 281 1238 1284 104% 1284 104% 1158 93%LF-25B 272 907 1312 145% 1312 145% 1186 131%LF-25C 287 1254 1232 98% 1232 98% 1176 94%LF-39A 287 189 154 82% 154 82% 129 68%LF-39B 277 154 138 90% 138 90% 123 80%LF-39C 290 179 163 91% 163 91% 129 72%
In a similar manner, the total load for Methods A, B, and C were compared to
the total load from Method D at 600 cfs (see Table 4-4. Comparison to Method D at
600 cfs).
Table 4-4. Comparison to Method D at 600 cfs Method D Method A Method B Method C
CR-Sec Q (cfs)
Total Load
(Ton/day)
Total Load
(Ton/day)
% of Method D
Total Load
(Ton/day)
% of Method
D
Susp Sed Total Load
(Ton/day)
% of Method
D
LF-11A 621 1424 1123 79% 1117 78% 1027 72%LF-11B 595 926 1036 112% 979 106% 978 106%LF-11C 579 1228 1012 82% 1003 82% 929 76%LF-25A 587 509 514 101% 514 101% 495 97%LF-25B 566 474 498 105% 498 105% 474 100%LF-25C 573 528 481 91% 481 91% 460 87%LF-39A 603 431 411 96% 411 96% 390 91%LF-39B 571 398 400 101% 400 101% 360 90%LF-39C 570 377 456 121% 456 121% 354 94%

15
DRAFT
These tables indicate that the total load results from these four methods have more
similarities at 600 cfs than at 300 cfs.
The total load results from each of the four methods at 300 cfs were plotted for
all three runs at each cross section (see Figure 4-1. Total Sediment Load Method
Comparison 300 cfs Run).
Total Sediment Load Method Comparison 2001 300 cfs Run
0
200
400
600
800
1000
1200
1400
1600
6/8/
2001
6/8/
2001
6/8/
2001
6/11
/200
1
6/11
/200
1
6/11
/200
1
6/9/
2001
6/9/
2001
6/9/
2001
LF-11A LF-11B LF-11C LF-25A LF-25B LF-25C LF-39A LF-39B LF-39C
Cross Section
Tota
l Loa
d (T
ons/
day)
0
50
100
150
200
250
300
Dis
char
ge (c
fs)
Method DMethod AMethod BMethod CDischarge
Figure 4-1. Total Sediment Load Method Comparison 300 cfs Run
In order to compare the results for each method at 600 cfs for all three runs at
each cross section, the total load results were plotted (see Figure 4-2. Total Sediment
Load Method Comparison 2001 600 cfs Run).

16
DRAFT
Total Sediment Load Method Comparison 2001 600 cfs Run
0
200
400
600
800
1000
1200
1400
1600
5/27
/200
1
5/27
/200
1
5/27
/200
1
5/28
/200
1
5/28
/200
1
5/29
/200
1
5/29
/200
1
5/30
/200
1
5/30
/200
1
LF-11A LF-11B LF-11C LF-25A LF-25B LF-25C LF-39A LF-39B LF-39C
Cross Section
Tota
l Loa
d (T
ons/
day)
0
100
200
300
400
500
600
700
Dis
char
ge (c
fs)
Method DMethod AMethod BMethod CDischarge
Figure 4-2. Total Sediment Load Method Comparison 600 cfs Run
From the above figures and tables, only four instances occurred where the suspended
sediment load (Method C) exceeded or equaled the total load from Method D. This
occurred at cross sections LF-11C and LF-25B at flows near 300 cfs and at cross
sections LF-11B and LF-25B at flow rates near 600 cfs. Error messages indicating that
the fitted Z-values generated a negative exponent occurred at LF-11C (at flows near
300 cfs) and LF-11B (at flows near 300 and 600 cfs) so the suspended sediment load
was calculated from the suspended sediment concentrations that were averaged over
the width of the cross section. Method D estimate for trial LF-11B at 300 cfs was less
than the suspended sediment load (Method C) due to averaging the suspended
sediment concentrations over the entire width of the cross section. BORAMEP total
results for LF-25B (at flows near 300 cfs and 600 cfs) were the lowest of the three trials
at this cross section at both flow rates. This most likely occurred because averaging the

17
DRAFT
bed material and suspended sediment samples over the width of the entire cross
section in Method D resulted in lower suspended sediment concentrations.
To investigate how much of the total load is the sand load or wash load, a graph
was constructed to display the contribution of sand and wash load to the total load for
Method D at 300 and 600 cfs (see Figure 4-3. Sand Load and Wash Load as Part of
Total Load for Method D at 300 and 600 cfs).
Sand Load and Wash Load as Part of Total Load for Method D at 300 and 600 cfs
0200400600800
1000120014001600
280 273 262 281 272 287 287 277 290 621 595 579 587 566 573 603 571 570
LF-11A
LF-11B
LF-11C
LF-25A
LF-25B
LF-25C
LF-39A
LF-39B
LF-39C
LF-11A
LF-11B
LF-11C
LF-25A
LF-25B
LF-25C
LF-39A
LF-39B
LF-39C
Cross Section and Q (cfs)
Tota
l Loa
d (T
on/d
ay)
Sand Load Wash Load
Figure 4-3. Sand Load and Wash Load as Part of Total Load for Method D at 300 and 600 cfs
Above the cross section label on the x-axis is the discharge of the LFCC in cfs. The
ratio of sand load to wash load was calculated for all three methods and all three cross
sections (see Appendix H: Ratio of Sand Load to Wash Load). The sand load for LF-11
at both flow rates is higher than the sand load at the other two cross sections. It could
be possible that the slope of the bed at LF-11 is larger than the bed slope of the other
two cross sections.

18
DRAFT
In order to compare the sand load to the wash load ratio from method A,
another graph was created (see Figure 4-4. Sand Load and Wash Load as Part of Total
Load for Method A).
Sand Load and Wash Load as Part of Total Load for Method Aat 300 and 600 cfs
0
200
400
600
800
1000
1200
1400
280 273 262 281 272 287 287 277 290 621 595 579 587 566 573 603 571 570
LF-11A
LF-11B
LF-11C
LF-25A
LF-25B
LF-25C
LF-39A
LF-39B
LF-39C
LF-11A
LF-11B
LF-11C
LF-25A
LF-25B
LF-25C
LF-39A
LF-39B
LF-39C
Cross Section and Q (cfs)
Tota
l Loa
d (T
on/d
ay)
Sand Load Wash Load
Figure 4-4. Sand Load and Wash Load as Part of Total Load for Method A at 300 and 600 cfs The same process was completed for Method B, however, the graph only shows the
sand and wash load for the mobile bed section (see Figure 4-5. Sand Load and Wash
Load as Part of Total Load for Method B at 300 and 600 cfs).

19
DRAFT
Sand Load and Wash Load as Part of Total Load for Method B--Mobile Bed Section at 300 and 600 cfs
0
200
400
600
800
1000
1200
181 173 184 220 217 214 201 191 199 363 349 345 474 460 459 522 499 495
LF-11A
LF-11B
LF-11C
LF-25A
LF-25B
LF-25C
LF-39A
LF-39B
LF-39C
LF-11A
LF-11B
LF-11C
LF-25A
LF-25B
LF-25C
LF-39A
LF-39B
LF-39C
Cross Section and Q (cfs)
Tota
l Loa
d (T
on/d
ay)
Sand Load Wash Load
Figure 4-5. Sand Load and Wash Load as Part of Total Load for Method B at 300 and 600 cfs The above graph indicates that most of the total load from cross sections LF-25 and LF-
39 comes from the wash load and the total load for cross section LF-11 is evenly split
between sand and wash load. At both flow rates, the LF-11 cross section has the
highest sand load of all the cross sections. Upon closer inspection of cross section LF-
25 at the 300 cfs flow rate, it is evident that most of the total load is due to the wash
load and the sand load is much less than what was indicated at 600 cfs.
To see how the BORAMEP total load estimates from Method D, Method A, and
Method B compared to the suspended sediment load (Method C) two tables were
constructed by dividing the total load estimates from Method D, Method A, and Method
B by the suspended sediment load. (See Table 4-5. Comparison to Suspended
Sediment Load at 300 cfs and Table 4-6. Comparison to Suspended Sediment Load at
600 cfs).
20
DRAFT
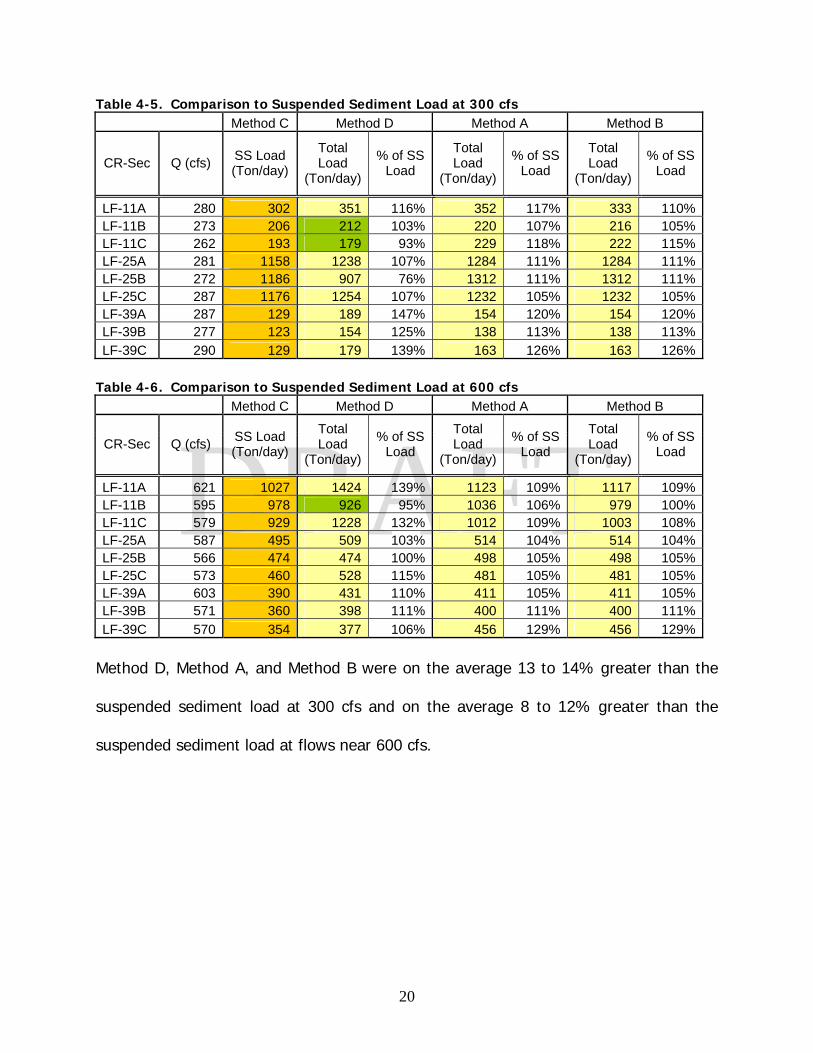
Table 4-5. Comparison to Suspended Sediment Load at 300 cfs Method C Method D Method A Method B
CR-Sec Q (cfs) SS Load (Ton/day)
Total Load
(Ton/day)
% of SS Load
Total Load
(Ton/day)
% of SS Load
Total Load
(Ton/day)
% of SS Load
LF-11A 280 302 351 116% 352 117% 333 110%LF-11B 273 206 212 103% 220 107% 216 105%LF-11C 262 193 179 93% 229 118% 222 115%LF-25A 281 1158 1238 107% 1284 111% 1284 111%LF-25B 272 1186 907 76% 1312 111% 1312 111%LF-25C 287 1176 1254 107% 1232 105% 1232 105%LF-39A 287 129 189 147% 154 120% 154 120%LF-39B 277 123 154 125% 138 113% 138 113%LF-39C 290 129 179 139% 163 126% 163 126%
Table 4-6. Comparison to Suspended Sediment Load at 600 cfs
Method C Method D Method A Method B
CR-Sec Q (cfs) SS Load (Ton/day)
Total Load
(Ton/day)
% of SS Load
Total Load
(Ton/day)
% of SS Load
Total Load
(Ton/day)
% of SS Load
LF-11A 621 1027 1424 139% 1123 109% 1117 109%LF-11B 595 978 926 95% 1036 106% 979 100%LF-11C 579 929 1228 132% 1012 109% 1003 108%LF-25A 587 495 509 103% 514 104% 514 104%LF-25B 566 474 474 100% 498 105% 498 105%LF-25C 573 460 528 115% 481 105% 481 105%LF-39A 603 390 431 110% 411 105% 411 105%LF-39B 571 360 398 111% 400 111% 400 111%LF-39C 570 354 377 106% 456 129% 456 129%
Method D, Method A, and Method B were on the average 13 to 14% greater than the
suspended sediment load at 300 cfs and on the average 8 to 12% greater than the
suspended sediment load at flows near 600 cfs.

21
DRAFT
5. Comparison to LFCC Results from Rating Curves
Three types of total load and sand load rating curves for the LFCC near San
Marcial were created using the same BORAMEP results used in Jason Albert’s M.S.
Thesis (2004). Albert had used suspended sediment and bed material samples along
with flow data from the USGS gage on the LFCC near San Marcial (#08358300) from
1968 to 1994 to run in BORAMEP. Even though the cross sections used in the
BORAMEP analysis are approximately 50 miles upstream from San Marcial, a
comparison was still wanted between BORAMEP results and total load rating curves
constructed from the San Marcial gage data. Three types of total load rating curves
were created using this BORAMEP output. The first type was the total load (QT in
tons/day) vs. discharge (Q in cfs), the second type was total load (QT in tons/day) vs.
suspended sediment load (Qss in tons/day), and the third type was total load (QT in
tons/day) vs. suspended sediment concentration (Css in mg/L). Below are these rating
curves and the corresponding coefficient of determination in the same order.
QT = 0.0003 Q 2.5202 R2 = 0.8275
QT = 2.5576 Qss 0.9338 R2 = 0.9897
QT = 0.3053 Css 1.3109 R2 = 0.959
Below are these three rating curves in the same order.

22
DRAFT
San Marcial CC Total Load Rating Curve 1968-1994y = 0.0003x2.5202
R2 = 0.8275
1
10
100
1000
10000
100000
10 100 1000 10000
River Discharge (cfs)
Tota
l Loa
d (to
ns/d
ay)
Figure 5-1. LFCC Total Load vs. River Discharge Rating Curve
San Marcial CC Total Load Rating Curve 1968-1994y = 2.5576x0.9338
R2 = 0.9897
0
10000
20000
30000
40000
50000
60000
70000
0 10000 20000 30000 40000 50000
Suspended Sediment Load (tons/day)
Tota
l Loa
d (to
ns/d
ay)
Figure 5-2. LFCC Total Load vs. Suspended Sediment Load Rating Curve

23
DRAFT
San Marcial CC Total Load Rating Curve 1968-1994y = 0.3053x1.3109
R2 = 0.959
10
100
1000
10000
100000
10 100 1000 10000 100000
Suspended Sediment Conc. (ppm)
Tota
l Loa
d (to
ns/d
ay)
Figure 5-3. LFCC Total Load vs. Suspended Sediment Conc. Rating Curve
The same procedure as above was followed but the BORAMEP sand load was used.
Three types of sand load rating curves were created. The first type was the sand load
(QTS in tons/day) vs. discharge (Q in cfs), the second type was total load (QTS in
tons/day) vs. suspended sediment load (Qss in tons/day), and the third type was total
load (QTS in tons/day) vs. suspended sediment concentration (Css in mg/L). Below are
these sand load rating curves and the corresponding coefficient of determination in the
same order.
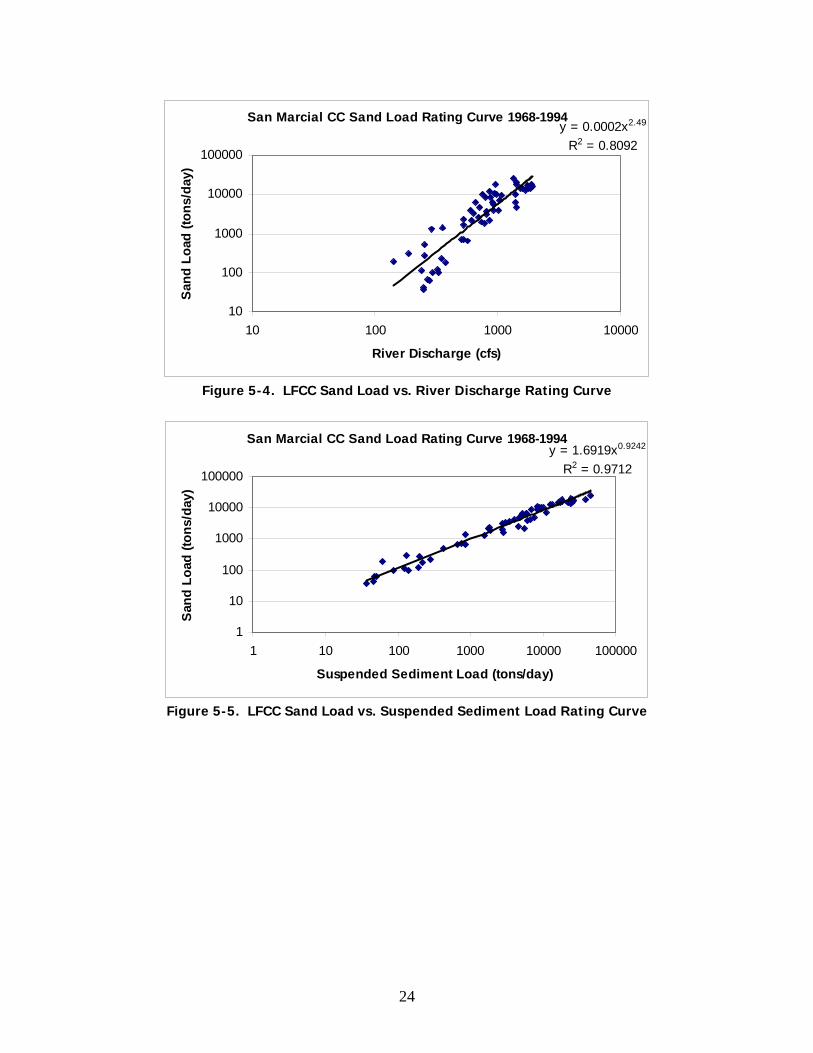
QTS = 0.0002 Q 2.49 R2 = 0.8092
QTS = 1.6919 Qss 0.9242 R2 = 0.9712
QTS = 0.2050 Css 1.2984 R2 = 0.9425
Below are the Sand Load rating curves in the same order.
24
DRAFT
San Marcial CC Sand Load Rating Curve 1968-1994y = 0.0002x2.49
R2 = 0.8092
10
100
1000
10000
100000
10 100 1000 10000
River Discharge (cfs)
Sand
Loa
d (to
ns/d
ay)
Figure 5-4. LFCC Sand Load vs. River Discharge Rating Curve
San Marcial CC Sand Load Rating Curve 1968-1994y = 1.6919x0.9242
R2 = 0.9712
1
10
100
1000
10000
100000
1 10 100 1000 10000 100000
Suspended Sediment Load (tons/day)
San
d Lo
ad (t
ons/
day)
Figure 5-5. LFCC Sand Load vs. Suspended Sediment Load Rating Curve

25
DRAFT
San Marcial CC Sand Load Rating Curve 1968-1994y = 0.205x1.2984
R2 = 0.9425
10
100
1000
10000
100000
10 100 1000 10000 100000
Suspended Sediment Conc. (ppm)
Sand
Loa
d (to
ns/d
ay)
Figure 5-6. LFCC Sand Load vs. Suspended Sediment Conc. Rating Curve
The river flow rate, suspended sediment concentration, and suspended sediment
load for each run were inserted into the appropriate sand load and total load rating
curve equations and compared to the BORAMEP Method A results (see Table 5-1.
Comparison of BORAMEP Method A to Rating Curves).

26
DRAFT
Table 5-1. Comparison of BORAMEP Method A to Rating Curves
Method A Results Discharge Rating
Curve Results SS Load Rating Curve
Results SS Conc. Rating
Curve Results
Cross Section
Q (cfs)
Qss (tons/day)
Css (mg/L)
Total Load
(tons/day)
Sand Load
(tons/day)
Total Load
(tons/day)
Sand Load
(tons/day)
Total Load
(tons/day)
Sand Load
(tons/day)
Total Load
(tons/day)
Sand Load
(tons/day)
LF-11A 280 302 399 352 152 442 248 529 331 785 489
LF-11B 273 206 279 220 84 413 232 370 232 492 308 LF-11C 262 193 273 229 85 373 210 349 219 478 299 LF-25A 281 1158 1530 1284 58 444 250 1856 1148 4564 2796 LF-25B 272 1186 1614 1312 134 411 232 1898 1173 4898 2999 LF-25C 287 1176 1518 1232 92 471 264 1884 1165 4521 2770 LF-39A 287 129 167 154 15 468 263 239 151 250 157 LF-39B 277 123 164 138 16 431 242 229 144 245 154 LF-39C 290 129 165 163 15 482 271 240 151 247 156 LF-11A 621 1027 613 1123 465 3283 1802 1660 1027 1378 854 LF-11B 595 978 609 1036 419 2950 1622 1585 982 1365 846 LF-11C 579 929 595 1012 450 2755 1516 1512 936 1323 820 LF-25A 587 495 313 514 84 2849 1567 840 523 570 356 LF-25B 566 474 310 498 82 2599 1431 806 502 564 352 LF-25C 573 460 298 481 87 2681 1475 784 489 534 334 LF-39A 603 390 240 411 57 3048 1675 672 420 403 252 LF-39B 571 360 234 400 45 2657 1462 623 390 389 244
LF-39C 570 354 230 456 49 2645 1456 614 384 381 239
For better comparison purposes, the total load from Method A and the rating
curves were also plotted with the flow rate (see Figure 5-7. Total Load Comparison of
Method A to the Rating Curve Results at Flow Rates Near 300 cfs and Figure 5-8. Total
Load Comparison of Method A to the Rating Curve Results at Flow Rates Near 600 cfs).

27
DRAFT
Total Load Comparison of Method A to the LFCC at San Marcial Rating Curves at 300 cfs
0
1000
2000
3000
4000
5000
6000
LF-11A LF-11B LF-11C LF-25A LF-25B LF-25C LF-39A LF-39B LF-39C
Cross Section
Tota
l Loa
d (to
ns/d
ay)
0
50
100
150
200
250
300
Disc
harg
e (c
fs)
Method ADischarge RCSS Load RCSS Conc. RCDischarge
Figure 5-7. Total Load Comparison of Method A to the Rating Curve Results at Flow Rates
Near 300 cfs
Total Load Comparison of Method A to the LFCC at SanMarcial Rating Curves at 600 cfs
0
500
1000
1500
2000
2500
3000
3500
LF-11A LF-11B LF-11C LF-25A LF-25B LF-25C LF-39A LF-39B LF-39C
Cross Section
Tota
l Loa
d (to
ns/d
ay)
050100150200250300350400450500550600650
Disc
harg
e (c
fs)
Method ADischarge RCSS Load RCSS Conc. RCDischarge
Figure 5-8. Total Load Comparison of Method A to the Rating Curve Results at Flow Rates
Near 600 cfs
Looking closely at Figure 5-7, the total load estimates from Method A, the discharge
rating curves, the suspended sediment load rating curves, and the suspended sediment

28
DRAFT
concentration rating curves yield similar results for the LF-11 and LF-39 cross sections
at flow rates near 300 cfs, but at LF-25 the results appear to vary greatly due to the
abnormally high suspended sediment concentration recorded at this cross section for a
particularly low flow rate. On Figure 5-8, it is apparent that the results from BORAMEP
Method A are similar in magnitude to the results from the suspended sediment load and
concentration rating curves. This suggests that there is a higher correlation between
total load and suspended sediment rather than discharge itself; this argument seems
very intuitive. When comparing the BORAMEP results to total load estimates from total
load versus river discharge rating curves, the BORAMEP results are much lower than the
results from the discharge rating curves. This supports the argument that BORAMEP
may be more sensitive to suspended sediment concentrations rather than river
discharge.
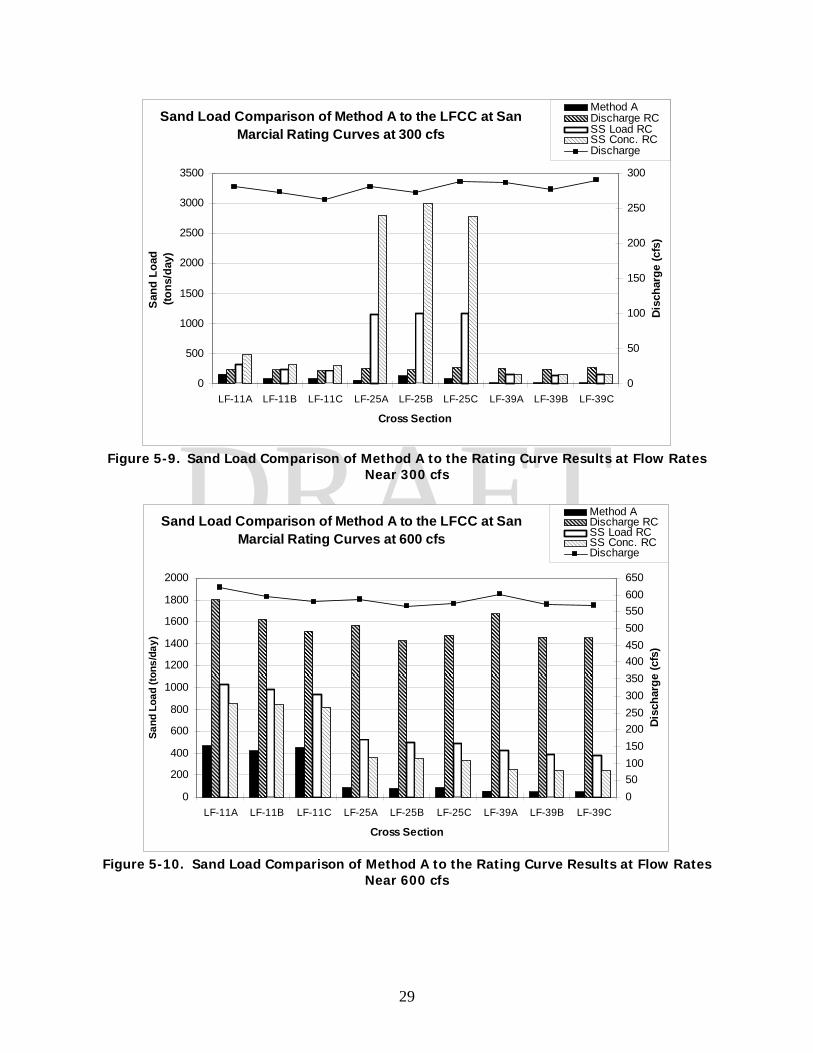
In a similar manner, the BORAMEP Method A sand load estimates were also
compared to the estimates from the sand load rating curves (see Figure 5-9. Sand
Load Comparison of Method A to the Rating Curve Results at Flow Rates Near 300 cfs
and Figure 5-10. Sand Load Comparison of Method A to the Rating Curve Results at
Flow Rates Near 600 cfs).
29
DRAFT
Sand Load Comparison of Method A to the LFCC at SanMarcial Rating Curves at 300 cfs
0
500
1000
1500
2000
2500
3000
3500
LF-11A LF-11B LF-11C LF-25A LF-25B LF-25C LF-39A LF-39B LF-39C
Cross Section
San
d Lo
ad
(tons
/day
)
0
50
100
150
200
250
300
Dis
char
ge (c
fs)
Method ADischarge RCSS Load RCSS Conc. RCDischarge
Figure 5-9. Sand Load Comparison of Method A to the Rating Curve Results at Flow Rates
Near 300 cfs
Sand Load Comparison of Method A to the LFCC at SanMarcial Rating Curves at 600 cfs
0
200
400
600
800
1000
1200
1400
1600
1800
2000
LF-11A LF-11B LF-11C LF-25A LF-25B LF-25C LF-39A LF-39B LF-39C
Cross Section
Sand
Loa
d (to
ns/d
ay)
050100150200250300350400450500550600650
Disc
harg
e (c
fs)
Method ADischarge RCSS Load RCSS Conc. RCDischarge
Figure 5-10. Sand Load Comparison of Method A to the Rating Curve Results at Flow Rates
Near 600 cfs

30
DRAFT
When comparing the sand load estimates from Method A to the sand load results from
the three rating curves, it appears that the sand load from Method A is always lower
than the sand load from the rating curves. This underestimation could just be due to
supplementing the BORAMEP Method A results with the suspended sediment load when
error messages occurred.
To further understand the variability of the BORAMEP total load results, the
BORAMEP total load and sand load estimates (from Method A) were plotted on the total
load vs. river discharge and sand load vs. river discharge rating curves. (see Figure
5.11. BORAMEP Total Load Inside Variability and Figure 5.12. BORAMEP Sand Load
Variability.
San Marcial CC Total Load Rating Curve 1968-1994y = 0.0003x2.5202
R2 = 0.8275
10
100
1000
10000
100000
10 100 1000 10000
River Discharge (cfs)
Tota
l Loa
d (to
ns/d
ay)
Rating Curve Data BORAMEP Method A Power (Rating Curve Data)
Figure 5-11. BORAMEP Total Load Variability

31
DRAFT
San Marcial CC Sand Load Rating Curve 1968-1994y = 0.0002x2.49
R2 = 0.8092
10
100
1000
10000
100000
10 100 1000 10000
River Discharge (cfs)
Sand
Loa
d (to
ns/d
ay)
Rating Curve Data BORAMEP Method A Power (Rating Curve Data)
Figure 5-12. BORAMEP Sand Load Variability
The BORAMEP total load estimates appear to be within the measured variability of the
total load at San Marcial, but the sand load estimates from BORAMEP Method A appear
to be on the low side of the variability of the sand load measurements at San Marcial.
The sand load estimates from Method A may be underestimating the sand load because
of the occurrence of error messages (not enough overlapping bins and fitted Z-values
generated negative exponent) and the supplementing the total load with the suspended
sediment load

32
DRAFT
6. Comparison to Total Load Sampling Sills
Two total load sampling sills are located at the Foot Bridge (LF-FB) and Vehicle
Bridge (LF-FB) (The relative locations of these sampling sills can be found on the maps
contained in Appendix I). The presence of the sampling sill allows the entire water
column to be sampled with depth integrated or point samplers with a tolerance of 0.05
to 0.1 feet. Suspended sediment samples were taken on the same days as samples
were taken at LF-11, LF-25 (except on 6/11/01), and LF-39. The suspended sediment
concentrations (mg/L) at the sampling sills were multiplied by the approximate flow rate
(300 and 600 cfs) and the appropriate conversion factor (0.0027) to give an estimate of
the total load (in tons per day) at the total load sampling sills. The total load results
from the sampling sills (LF-FB and LF-VB) along with the BORAMEP Method A total load
estimates were plotted against the date on which the field samples were taken (see
Figure 6-1. Sampling Sill and BORAMEP Total Load Results vs. Date at 300 cfs and
Figure 6-2. Sampling Sill and BORAMEP Total Load Results vs. Date at 600 cfs).

33
DRAFT
Sampling Sill and BORAMEP Total Load vs. Date--300 cfs
0
200
400
600
800
1000
1200
1400
6/3/01 6/4/01 6/5/01 6/6/01 6/7/01 6/8/01 6/9/01 6/10/01 6/11/01 6/12/01
Date
Tota
l Loa
d (to
ns/d
ay)
LF-FB
LF-VB
LF-11
LF-25
LF-39
Figure 6-1. Sampling Sill and BORAMEP Total Load vs. Date at 300 cfs
Sampling Sill and BORAMEP Total Load vs. Date--600 cfs
0
500
1000
1500
2000
2500
3000
3500
5/17/01 5/19/01 5/21/01 5/23/01 5/25/01 5/27/01 5/29/01 5/31/01 6/2/01
Date
Tota
l Loa
d (to
ns/d
ay)
LF-FB
LF-VB
LF-11
LF-25
LF-39
Figure 6-2. Sampling Sill and BORAMEP Total Load vs. Date at 600 cfs
From the above figures, it is evident that the total load at LF-VB is consistently higher
than the total load at LF-FB for most of the sampling dates. No trend in the change in
total load can be seen when comparing the total loads from the different sampling
dates at 300 cfs but a slight decline in total load over time can be seen at 300 cfs.

34
DRAFT
The total load estimates from the sampling sills were also compared to the total
load estimates from BORAMEP Method A by plotting the total load and the flow rate
(see Figure 6-3. Sampling Sill and BORAMEP Total Load vs. Flow Rate).
Sampling Sill and BORAMEP Total Load vs. Flow Rate
0
500
1000
1500
2000
2500
3000
3500
0 100 200 300 400 500 600 700
Q (cfs)
Tota
l Loa
d (to
ns/d
ay)
LF-FB
LF-VB
LF-11
LF-25
LF-39
Figure 6-3. Sampling Sill and BORAMEP Total Load vs. Flow Rate
From Figure 6-3, The BORAMEP Method A (LF-11, LF-25, and LF-39) results seem to be
within the same range as the total load estimates from the sampling sills at 300 cfs; but
the BORAMEP Method A results seem to underestimate the total load at 600 cfs when
compared to the total load sampling sill estimates. If there was an error in the
suspended sediment data collection at LF-25 at 300 cfs, it is possible that BORAMEP is
underestimating the total load at all flow rates. This could also be due to
supplementing the suspended sediment load in for the total load when error messages
occurred. Because of the variability of total load on any given day, it may be inaccurate
to compare the total load estimates from BORAMEP to total load estimates from the
sampling sills from other sampling days.

35
DRAFT
Similarly, the sand load (particles larger than 0.0625 mm) estimates from
BORAMEP Method A were compared to the sand load estimates from the sampling sills
by plotting the sand load and the discharge (see Figure 6-4. Sampling Sill and
BORAMEP Sand Load vs. Flow Rate).
Sampling Sill and BORAMEP Sand Load vs. Flow Rate
0
100
200
300
400
500
0 100 200 300 400 500 600 700
Q (cfs)
Sand
Loa
d (to
ns/d
ay)
LF-FB
LF-VB
LF-11
LF-25
LF-39
Figure 6-4. Sampling Sill and BORAMEP Sand Load vs. Flow Rate
Less data points for the sampling sills were used for Figure 6-4 than Figure 6-3 because
many of the samples from the sampling sills did not contain size fraction data. From
the above figure, it appears that the BORAMEP Method A sand load estimates are
consistent with the sand load estimates from the sampling sills at flow rates near 300
and 600 cfs. This is most likely due to the occurrence of error messages (not enough
overlapping bins and fitted Z-values generated a negative exponent) and supplementing
the total load with the suspended sediment load when these error messages occurred.

36
DRAFT
7. Conclusions
The main conclusions for the application of BORAMEP on the LFCC are as
follows:
1. The BORAMEP results suggest that the total load range of the LFCC is between
100 and 1300 tons per day at flow rates near 300 cfs and between 350 and 1150
tons per day at flow rates near 600 cfs (see Figure 7-1. Total Load vs.
Discharge).
Total Load vs. Discharge
0200400600800
100012001400
0 100 200 300 400 500 600 700
Discharge (cfs)
Tota
l Loa
d (to
ns/d
ay)
LF-11LF-25LF-39
Figure 7-1. Total Load vs. Discharge
2. The field measurements for all three cross sections were taken on different days
for the given discharge. If measurements were taken at all three cross sections
at each discharge on the same day, the data range would be expected to have a
smaller range than what is shown on Figure 7-1.
3. Sand load results from BORAMEP are between 10 and 150 tons per day at 300
cfs and between 50 and 450 tons per day at 600 cfs (see Figure 7-2. Sand Load
vs. Discharge).

37
DRAFT
Sand Load vs. Discharge
0
100
200
300
400
500
0 100 200 300 400 500 600 700
Discharge (cfs)
San
d Lo
ad (t
ons/
day)
LF-11LF-25LF-39
Figure 7-2. Sand Load vs. Discharge
4. The sand load range at 300 cfs is an order of magnitude smaller than the total
load range at 300 cfs. This difference is due to the large amount of wash load at
cross section LF-25 on 6/11/01. The sand load at LF-11 at 600 cfs is as much as
350 tons per day higher than the sand load at the other two cross sections at
600 cfs. Since over half of the total load is wash load, the total load in the LFCC
will vary greatly at a given discharge. At times, the diverted water from the Rio
Grande will contain a large amount of fine sediment. This could be from
irrigation returns, heavy thunderstorms, or high flow in the Rio Grande.
5. The BORAMEP total load figures from Method A, Method B, and Method D were
almost always greater than the suspended sediment load calculated in method C.
They were 13-14% greater than the suspended sediment load at flows near 300
cfs and 8-12% greater than the suspended sediment load at flows near 600 cfs.
This was an expected result since the total load should be greater than the
suspended sediment load or measured load.

38
DRAFT
6. For the most part, BORAMEP total load estimates appear to be consistent with
the results from the three total load rating curves (versus river discharge,
suspended sediment load, and suspended sediment concentration); but
BORAMEP sand load estimates appear to be less than the sand load estimates
from the rating curves (especially at the higher flow rate). This was most likely
caused by substituting the suspended sediment load in for the BORAMEP total
load when error messages occurred in BORAMEP.
7. BORAMEP total load results appear to be consistent with the total load estimates
from the sampling sills at flow rates near 300 cfs but tend to underestimate the
total load at flow rates near 600 cfs by at least a factor of two when compared to
the total load estimates from the sampling sills.
8. Sand load estimates from BORAMEP appear to be consistent with sand load
estimates from the sampling sills at flow rates near 300 and 600 cfs.
9. BORAMEP does a satisfactory job of estimating the total load and sand load in
the LFCC. Due to a lack of overlapping suspended sediment and bed material
size fractions for BORAMEP to complete the MEP calculations, the effectiveness
of BORAMEP in estimating the total load in the LFCC was greatly impaired. If
there was a better overlap between the bed material and suspended sediment
data, the application of BORAMEP would have been more successful.

39
DRAFT
Appendix A: BORAMEP Input Sheets

40
DRAFT
Table A-1. BORAMEP Method A Input Sheet 300 cfs *** bin1 bin2 bin3 bin4 bin5 bin6 bin7 bin8 bin9
16 0.001 0.002 0.002 0.004 0.004 0.016 0.016 0.0625 0.0625 0.125 0.125 0.25 0.25 0.5 0.5 1 1 Input Variables Title Date Time S_energy g (ft/s2)
gamma_w (lb/ft3)
gamma_s (lb/ft3) Q (cfs)
Vavg (ft/s) h (ft) W (ft)
T (F)
dn (ft)
Cs (ppm)
d65 (mm)
d35 (mm)
ds (ft)
### LF-11A-20-32 6/8/2001 1130 0.0008 32.17 62.4 165 38.098 1.3228 3.3 12 72 0.3 354.462 0.9 0.34 3 ### LF-11A-32-36.5 6/8/2001 1130 0.0008 32.17 62.4 165 51.518 2.2063 5.7 4.5 72 0.3 443.125 0.21 0.15 5.4 ### LF-11A-36.5-39.5 6/8/2001 1130 0.0008 32.17 62.4 165 35.758 2.4832 5.9 3 72 0.3 421.455 0.18 0.14 5.6 ### LF-11A-39.5-42.5 6/8/2001 1130 0.0008 32.17 62.4 165 35.265 2.5011 5.7 3 72 0.3 451.692 0.16 0.12 5.4 ### LF-11A-42.5-45.5 6/8/2001 1130 0.0008 32.17 62.4 165 32.203 2.2758 6 3 72 0.3 411.719 0.18 0.14 5.7 ### LF-11A-45.5-48 6/8/2001 1130 0.0008 32.17 62.4 165 26.368 2.1791 5.7 2.5 72 0.3 391.408 0.21 0.15 5.4 ### LF-11A-48-63 6/8/2001 1130 0.0008 32.17 62.4 165 53.535 1.4768 3.1 15 72 0.3 392.48 0.2 0.15 2.8 ### LF-11B-20-32 6/8/2001 1600 0.0008 32.17 62.4 165 33.168 1.1359 4.5 12 72 0.3 274.762 0.18 0.14 4.2 ### LF-11B-32-36.5 6/8/2001 1600 0.0008 32.17 62.4 165 46.11 1.9961 5.3 4.5 72 0.3 296.667 0.19 0.15 5 ### LF-11B-36.5-39.5 6/8/2001 1600 0.0008 32.17 62.4 165 32.465 2.115 5.1 3 72 0.3 322 0.21 0.16 4.8 ### LF-11B-39.5-42.5 6/8/2001 1600 0.0008 32.17 62.4 165 32.55 2.1919 5.2 3 72 0.3 290.847 0.17 0.14 4.9 ### LF-11B-42.5-45.5 6/8/2001 1600 0.0008 32.17 62.4 165 34.598 2.1556 5.4 3 72 0.3 256 0.18 0.15 5.1 ### LF-11B-45.5-48 6/8/2001 1600 0.0008 32.17 62.4 165 26.808 1.9931 5.4 2.5 72 0.3 298.621 0.22 0.17 5.1 ### LF-11B-48-63 6/8/2001 1600 0.0008 32.17 62.4 165 56.41 1.452 4.4 15 72 0.3 295.077 0.21 0.16 4.1 ### LF-11C-20-32 6/8/2001 1750 0.0008 32.17 62.4 165 35.127 1.2325 4.5 12 72 0.3 245.208 0.12 0.001 4.2 ### LF-11C-32-36.5 6/8/2001 1750 0.0008 32.17 62.4 165 49.113 2.1447 5.2 4.5 72 0.3 237.624 0.19 0.15 4.9 ### LF-11C-36.5-39.5 6/8/2001 1750 0.0008 32.17 62.4 165 35.6 2.2894 5.2 3 72 0.3 203.425 0.19 0.15 4.9 ### LF-11C-39.5-42.5 6/8/2001 1750 0.0008 32.17 62.4 165 35.258 2.1967 5.4 3 72 0.3 291.667 0.18 0.14 5.1 ### LF-11C-42.5-45.5 6/8/2001 1750 0.0008 32.17 62.4 165 35.53 2.0361 5.9 3 72 0.3 299.398 0.21 0.16 5.6 ### LF-11C-45.5-48 6/8/2001 1750 0.0008 32.17 62.4 165 28.845 2.0242 5.7 2.5 72 0.3 267.891 0.22 0.16 5.4 ### LF-11C-48-63 6/8/2001 1750 0.0008 32.17 62.4 165 60.688 1.5702 3.4 15 72 0.3 255.385 0.22 0.16 3.1 ### LF-39A-11-29 6/9/2001 1450 0.0008 32.17 62.4 165 51.608 0.9366 4.9 18 72 0.3 132.041 0.31 0.22 4.6 ### LF-39A-29-34.5 6/9/2001 1450 0.0008 32.17 62.4 165 43.11 1.7383 4.7 5.5 72 0.3 149.623 0.32 0.24 4.4 ### LF-39A-34.5-39.5 6/9/2001 1450 0.0008 32.17 62.4 165 40.553 1.8391 4.8 5 72 0.3 169.091 0.33 0.25 4.5 ### LF-39A-39.5-44.5 6/9/2001 1450 0.0008 32.17 62.4 165 42.91 1.9071 4.5 5 72 0.3 169.167 0.08 0.033 4.2 ### LF-39A-44.5-49.5 6/9/2001 1450 0.0008 32.17 62.4 165 36.203 1.7574 4.4 5 72 0.3 184.737 0.24 0.17 4.1 ### LF-39A-49.5-56 6/9/2001 1450 0.0008 32.17 62.4 165 38.005 1.4875 3.9 6.5 72 0.3 178.125 0.3 0.2 3.6 ### LF-39A-56-73 6/9/2001 1450 0.0008 32.17 62.4 165 37.589 0.7026 4.3 17 72 0.3 184.583 0.32 0.24 4 ### LF-39B-11-29 6/9/2001 1030 0.0008 32.17 62.4 165 54.871 1.0059 4.6 18 73 0.3 151.803 0.31 0.21 4.3 ### LF-39B-29-34.5 6/9/2001 1030 0.0008 32.17 62.4 165 41.595 1.6772 4.5 5.5 73 0.3 171.067 0.31 0.22 4.2 ### LF-39B-34.5-39.5 6/9/2001 1030 0.0008 32.17 62.4 165 39.498 1.7633 4.5 5 73 0.3 162.063 0.32 0.23 4.2 ### LF-39B-39.5-44.5 6/9/2001 1030 0.0008 32.17 62.4 165 39.055 1.8466 4.2 5 73 0.3 151.897 0.1 0.064 3.9 ### LF-39B-44.5-49.5 6/9/2001 1030 0.0008 32.17 62.4 165 34.958 1.8066 3.9 5 73 0.3 157.636 0.22 0.16 3.6 ### LF-39B-49.5-56 6/9/2001 1030 0.0008 32.17 62.4 165 36.385 1.4671 3.8 6.5 73 0.3 158.627 0.27 0.18 3.5 ### LF-39B-56-73 6/9/2001 1030 0.0008 32.17 62.4 165 31.026 0.6539 3.7 17 73 0.3 210.2 0.33 0.26 3.4

41
DRAFT
Table A-1. BORAMEP Method A Input Sheet 300 cfs *** bin1 bin2 bin3 bin4 bin5 bin6 bin7 bin8 bin9
16 0.001 0.002 0.002 0.004 0.004 0.016 0.016 0.0625 0.0625 0.125 0.125 0.25 0.25 0.5 0.5 1 1 Input Variables Title Date Time S_energy g (ft/s2)
gamma_w (lb/ft3)
gamma_s (lb/ft3) Q (cfs)
Vavg (ft/s) h (ft) W (ft)
T (F)
dn (ft)
Cs (ppm)
d65 (mm)
d35 (mm)
ds (ft)
### LF-39C-11-29 6/9/2001 1712 0.0008 32.17 62.4 165 55.65 1.0202 4.5 18 72 0.3 163.725 0.31 0.21 4.2 ### LF-39C-29-34.5 6/9/2001 1712 0.0008 32.17 62.4 165 44.203 1.7611 4.5 5.5 72 0.3 163.03 0.34 0.27 4.2 ### LF-39C-34.5-39.5 6/9/2001 1712 0.0008 32.17 62.4 165 42.485 1.8882 4.5 5 72 0.3 168.226 0.32 0.22 4.2 ### LF-39C-39.5-44.5 6/9/2001 1712 0.0008 32.17 62.4 165 40.08 1.9131 4.1 5 72 0.3 170.164 0.14 0.088 3.8 ### LF-39C-44.5-49.5 6/9/2001 1712 0.0008 32.17 62.4 165 34.793 1.7981 3.9 5 72 0.3 166.207 0.29 0.2 3.6 ### LF-39C-49.5-56 6/9/2001 1712 0.0008 32.17 62.4 165 37.021 1.4808 3.9 6.5 72 0.3 163.8 0.28 0.19 3.6 ### LF-39C-56-73 6/9/2001 1712 0.0008 32.17 62.4 165 32.441 0.6495 3.8 17 72 0.3 178.909 0.34 0.27 3.5 ### LF-25A-8-25 6/11/2001 1445 0.0008 32.17 62.4 165 34.183 0.6018 5.2 17 73 0.3 60.3604 0.06 0.028 4.9 ### LF-25A-25-30.5 6/11/2001 1445 0.0008 32.17 62.4 165 8.0585 0.3289 4.6 5.5 73 0.3 1805.09 0.081 0.049 4.3 ### LF-25A-30.5-36 6/11/2001 1445 0.0008 32.17 62.4 165 41.106 1.2648 6 5.5 73 0.3 1690.45 0.32 0.21 5.7 ### LF-25A-36-42 6/11/2001 1445 0.0008 32.17 62.4 165 56.59 1.5504 6.1 6 73 0.3 1734.22 0.11 0.072 5.8 ### LF-25A-42-48 6/11/2001 1445 0.0008 32.17 62.4 165 60.045 1.6633 6 6 73 0.3 1643.04 0.35 0.28 5.7 ### LF-25A-48-54 6/11/2001 1445 0.0008 32.17 62.4 165 54.32 1.4923 6 6 73 0.3 1670 0.3 0.19 5.7 ### LF-25A-54-68 6/11/2001 1445 0.0008 32.17 62.4 165 33.032 0.7028 5.4 14 73 0.3 1687.05 0.34 0.26 5.1 ### LF-25B-8-25 6/11/2001 1840 0.0008 32.17 62.4 165 26.159 0.4791 4.9 17 73 0.3 1548.03 0.09 0.05 4.6 ### LF-25B-36-42 6/11/2001 1840 0.0008 32.17 62.4 165 57.92 1.6044 6 6 73 0.3 1674.51 0.17 0.11 5.7 ### LF-25B-42-48 6/11/2001 1840 0.0008 32.17 62.4 165 62.15 1.7264 6 6 73 0.3 1599.48 0.33 0.26 5.7 ### LF-25B-48-54 6/11/2001 1840 0.0008 32.17 62.4 165 55.425 1.5311 6.1 6 73 0.3 1591.88 0.26 0.15 5.8 ### LF-25B-54-68 6/11/2001 1840 0.0008 32.17 62.4 165 28.853 0.5961 5.3 14 73 0.3 1560.69 0.32 0.22 5 ### LF-25C-8-25 6/11/2001 2000 0.0008 32.17 62.4 165 34.744 0.6149 4.9 17 73 0.3 1589.55 0.1 0.035 4.6 ### LF-25C-25-30.5 6/11/2001 2000 0.0008 32.17 62.4 165 10.898 0.4476 4.4 5.5 73 0.3 1623.64 0.078 0.045 4.1 ### LF-25C-30.5-36 6/11/2001 2000 0.0008 32.17 62.4 165 34.056 1.0829 5.8 5.5 73 0.3 1538.77 0.26 0.14 5.5 ### LF-25C-36-42 6/11/2001 2000 0.0008 32.17 62.4 165 56.975 1.5826 6 6 73 0.3 1578 0.14 0.068 5.7 ### LF-25C-42-48 6/11/2001 2000 0.0008 32.17 62.4 165 58.14 1.6105 6 6 73 0.3 1517.14 0.36 0.28 5.7 ### LF-25C-48-54 6/11/2001 2000 0.0008 32.17 62.4 165 54.41 1.4907 6.1 6 73 0.3 1528.97 0.12 0.03 5.8 ### LF-25C-54-68 6/11/2001 2000 0.0008 32.17 62.4 165 31.478 0.6424 5.2 14 73 0.3 1575.77 0.32 0.23 4.9

42
DRAFT
Table A-2. BORAMEP Method A Input Sheet 600 cfs *** bin1 bin2 bin3 bin4 bin5 bin6 bin7 bin8 bin9
16 0.001 0.002 0.002 0.004 0.004 0.016 0.016 0.063 0.063 0.125 0.125 0.25 0.25 0.5 0.5 1 1 Input Variables Title Date Time S_energy g (ft/s2)
gamma_w (lb/ft3)
gamma_s (lb/ft3) Q (cfs)
Vavg (ft/s) h (ft) W (ft)
T (F)
dn (ft)
Cs (ppm)
d65 (mm)
d35 (mm)
ds (ft)
### LF-11A-15-34 5/27/2001 1130 0.0008 32.17 62.4 165 142.8 2.084 5.4 17 70 0.3 579.231 0.3 0.19 5.1 ### LF-11A-34-38 5/27/2001 1130 0.0008 32.17 62.4 165 93.71 3.082 7.6 2 70 0.3 643.307 0.3 0.19 7.3 ### LF-11A-38-42 5/27/2001 1130 0.0008 32.17 62.4 165 91.07 2.976 7.9 2 70 0.3 715.04 0.3 0.19 7.6 ### LF-11A-42-46 5/27/2001 1130 0.0008 32.17 62.4 165 91.16 3.08 8.4 2 70 0.3 690.073 0.19 0.15 8.1 ### LF-11A-46-50 5/27/2001 1130 0.0008 32.17 62.4 165 86.61 2.906 8.4 2 70 0.3 535.769 0.14 0.028 8.1 ### LF-11A-50-54 5/27/2001 1130 0.0008 32.17 62.4 165 56.64 2.473 7.7 2 70 0.3 555.868 0.17 0.13 7.4 ### LF-11A-54-66 5/27/2001 1130 0.0008 32.17 62.4 165 59.5 1.787 4.2 2 70 0.3 538.571 0.17 0.13 3.9 ### LF-11B-15-34 5/27/2001 1620 0.0008 32.17 62.4 165 138.7 2.033 7.2 17 70 0.3 565.556 0.19 0.16 6.9 ### LF-11B-34-38 5/27/2001 1620 0.0008 32.17 62.4 165 88.05 2.945 7.5 2 70 0.3 699.107 0.19 0.16 7.2 ### LF-11B-38-42 5/27/2001 1620 0.0008 32.17 62.4 165 89.06 2.979 7.4 2 70 0.3 731.404 0.19 0.16 7.1 ### LF-11B-42-46 5/27/2001 1620 0.0008 32.17 62.4 165 88.93 2.964 7.5 2 70 0.3 593.273 0.175 0.135 7.2 ### LF-11B-46-50 5/27/2001 1620 0.0008 32.17 62.4 165 83.11 2.846 7.3 2 70 0.3 586.542 0.175 0.135 7 ### LF-11B-50-54 5/27/2001 1620 0.0008 32.17 62.4 165 49.96 2.357 4.8 2 70 0.3 537.5 0.16 0.11 4.5 ### LF-11B-54-66 5/27/2001 1620 0.0008 32.17 62.4 165 57.47 1.715 4 2 70 0.3 505.769 0.16 0.11 3.7 ### LF-11C-15-34 5/27/2001 2200 0.0008 32.17 62.4 165 130.8 1.983 7.2 17 70 0.3 593.469 0.19 0.15 6.9 ### LF-11C-34-38 5/27/2001 2200 0.0008 32.17 62.4 165 91.67 3.161 7.5 2 70 0.3 566.545 0.19 0.15 7.2 ### LF-11C-38-42 5/27/2001 2200 0.0008 32.17 62.4 165 90.58 3.167 7.4 2 70 0.3 644.262 0.28 0.11 7.1 ### LF-11C-42-46 5/27/2001 2200 0.0008 32.17 62.4 165 87.43 3.057 7.5 2 70 0.3 752.929 0.2 0.16 7.2 ### LF-11C-46-50 5/27/2001 2200 0.0008 32.17 62.4 165 75.13 2.655 7.3 2 70 0.3 579.145 0.185 0.14 7 ### LF-11C-50-54 5/27/2001 2200 0.0008 32.17 62.4 165 46.51 2.215 4.8 2 70 0.3 499.608 0.17 0.12 4.5 ### LF-11C-54-66 5/27/2001 2200 0.0008 32.17 62.4 165 57.11 1.715 4 2 70 0.3 420.202 0.17 0.12 3.7 ### LF-25A-5-21 5/28/2001 1138 0.0008 32.17 62.4 165 72.11 1.165 6 13 70 0.3 266.265 0.37 0.32 5.7 ### LF-25A-21-27.5 5/28/2001 1138 0.0008 32.17 62.4 165 31.87 0.703 7.2 3 70 0.3 314.333 0.37 0.32 6.9 ### LF-25A-27.5-34.5 5/28/2001 1138 0.0008 32.17 62.4 165 67.34 1.347 7.5 3.5 70 0.3 320.787 0.37 0.32 7.2 ### LF-25A-34.5-41.5 5/28/2001 1138 0.0008 32.17 62.4 165 120.8 2.259 7.9 3.5 70 0.3 337.949 0.38 0.31 7.6 ### LF-25A-41.5-48.5 5/28/2001 1138 0.0008 32.17 62.4 165 126.3 2.383 7.7 3.5 70 0.3 325.954 0.34 0.27 7.4 ### LF-25A-48.5-57 5/28/2001 1138 0.0008 32.17 62.4 165 127.6 1.981 7.7 3.5 70 0.3 310.199 0.35 0.28 7.4 ### LF-25A-57-71 5/28/2001 1138 0.0008 32.17 62.4 165 40.97 0.811 4.8 5 70 0.3 274.423 0.35 0.28 4.5 ### LF-25B-5-21 5/28/2001 1710 0.0008 32.17 62.4 165 65.56 1.159 6.1 13 70 0.3 274.894 0.38 0.28 5.8 ### LF-25B-21-27.5 5/28/2001 1710 0.0008 32.17 62.4 165 33.07 0.739 7 3 70 0.3 305.95 0.38 0.28 6.7 ### LF-25B-27.5-34.5 5/28/2001 1710 0.0008 32.17 62.4 165 61.11 1.263 6.7 3.5 70 0.3 316.522 0.38 0.28 6.4 ### LF-25B-34.5-41.5 5/28/2001 1710 0.0008 32.17 62.4 165 117 2.198 7.6 3.5 70 0.3 332.571 0.35 0.29 7.3 ### LF-25B-41.5-48.5 5/28/2001 1710 0.0008 32.17 62.4 165 118.9 2.248 7.6 3.5 70 0.3 307.013 0.36 0.3 7.3 ### LF-25B-48.5-57 5/28/2001 1710 0.0008 32.17 62.4 165 129.5 2.012 7.6 3.5 70 0.3 311.571 0.33 0.26 7.3 ### LF-25B-57-71 5/28/2001 1710 0.0008 32.17 62.4 165 40.91 0.854 4.2 5 70 0.3 302.301 0.33 0.26 3.9

43
DRAFT
Table A-2. BORAMEP Method A Input Sheet 600 cfs *** bin1 bin2 bin3 bin4 bin5 bin6 bin7 bin8 bin9
16 0.001 0.002 0.002 0.004 0.004 0.016 0.016 0.063 0.063 0.125 0.125 0.25 0.25 0.5 0.5 1 1 Input Variables Title Date Time S_energy g (ft/s2)
gamma_w (lb/ft3)
gamma_s (lb/ft3) Q (cfs)
Vavg (ft/s) h (ft) W (ft)
T (F)
dn (ft)
Cs (ppm)
d65 (mm)
d35 (mm)
ds (ft)
### LF-25C-5-21 5/29/2001 1045 0.0008 32.17 62.4 165 68.48 1.135 6.1 13 70 0.3 271.942 0.34 0.24 5.8 ### LF-25C-21-27.5 5/29/2001 1045 0.0008 32.17 62.4 165 30.24 0.694 7.1 3 70 0.3 294.609 0.34 0.24 6.8 ### LF-25C-27.5-34.5 5/29/2001 1045 0.0008 32.17 62.4 165 65.86 1.325 7.5 3.5 70 0.3 303.871 0.34 0.24 7.2 ### LF-25C-34.5-41.5 5/29/2001 1045 0.0008 32.17 62.4 165 113.9 2.153 7.7 3.5 70 0.3 307.6 0.38 0.29 7.4 ### LF-25C-41.5-48.5 5/29/2001 1045 0.0008 32.17 62.4 165 122 2.333 7.7 3.5 70 0.3 306.23 0.37 0.29 7.4 ### LF-25C-48.5-57 5/29/2001 1045 0.0008 32.17 62.4 165 127.1 1.982 7.7 3.5 70 0.3 299.149 0.32 0.23 7.4 ### LF-25C-57-71 5/29/2001 1045 0.0008 32.17 62.4 165 45.51 0.867 4.7 5 70 0.3 277.622 0.32 0.23 4.4 ### LF-39A-5-20 5/29/2001 1545 0.0008 32.17 62.4 165 40.16 0.95 4.8 13 70 0.3 229.15 0.22 0.17 4.5 ### LF-39A-20-28 5/29/2001 1545 0.0008 32.17 62.4 165 80.65 1.603 6.4 4 70 0.3 219.744 0.22 0.17 6.1 ### LF-39A-28-37 5/29/2001 1545 0.0008 32.17 62.4 165 140 2.333 7.1 5 70 0.3 242.188 0.35 0.28 6.8 ### LF-39A-37-46 5/29/2001 1545 0.0008 32.17 62.4 165 141 2.452 6.9 5 70 0.3 243.951 0.3 0.2 6.6 ### LF-39A-46-55 5/29/2001 1545 0.0008 32.17 62.4 165 104 1.989 5.9 5 70 0.3 244.595 0.3 0.2 5.6 ### LF-39A-55-62 5/29/2001 1545 0.0008 32.17 62.4 165 56.2 1.364 6.4 5 70 0.3 250.385 0.3 0.2 6.1 ### LF-39A-62-77 5/29/2001 1545 0.0008 32.17 62.4 165 40.76 0.786 5.4 4 70 0.3 243.788 0.3 0.2 5.1 ### LF-39B-5-20 5/30/2001 945 0.0008 32.17 62.4 165 37.51 0.959 5.1 13 70 0.3 213.684 0.3 0.2 4.8 ### LF-39B-20-28 5/30/2001 945 0.0008 32.17 62.4 165 80.53 1.595 6.5 4 70 0.3 230.143 0.3 0.2 6.2 ### LF-39B-28-37 5/30/2001 945 0.0008 32.17 62.4 165 136.8 2.262 6.9 5 70 0.3 246.986 0.31 0.21 6.6 ### LF-39B-37-46 5/30/2001 945 0.0008 32.17 62.4 165 130.4 2.292 6.8 5 70 0.3 243.289 0.35 0.27 6.5 ### LF-39B-46-55 5/30/2001 945 0.0008 32.17 62.4 165 103.6 2.035 5.8 4 70 0.3 219 0.3 0.2 5.5 ### LF-39B-55-62 5/30/2001 945 0.0008 32.17 62.4 165 47.72 1.178 6 3 70 0.3 224.211 0.19 0.12 5.7 ### LF-39B-62-77 5/30/2001 945 0.0008 32.17 62.4 165 34.66 0.691 5 5 70 0.3 230.806 0.19 0.12 4.7 ### LF-39C-5-20 5/30/2001 1230 0.0008 32.17 62.4 165 38.75 0.975 4.8 13 70 0.3 210.635 0.24 0.18 4.5 ### LF-39C-20-28 5/30/2001 1230 0.0008 32.17 62.4 165 78.93 1.572 6 4 70 0.3 223.537 0.24 0.18 5.7 ### LF-39C-28-37 5/30/2001 1230 0.0008 32.17 62.4 165 129.6 2.171 6.7 5 70 0.3 262.121 0.31 0.22 6.4 ### LF-39C-37-46 5/30/2001 1230 0.0008 32.17 62.4 165 133.6 2.352 6.3 5 70 0.3 228.986 0.33 0.25 6 ### LF-39C-46-55 5/30/2001 1230 0.0008 32.17 62.4 165 101 1.956 5.6 4 70 0.3 213.333 0.25 0.19 5.3 ### LF-39C-55-62 5/30/2001 1230 0.0008 32.17 62.4 165 51.61 1.262 5.9 3 70 0.3 229.273 0.21 0.08 5.6 ### LF-39C-62-77 5/30/2001 1230 0.0008 32.17 62.4 165 36.82 0.729 5.4 5 70 0.3 202.813 0.21 0.08 5.1

44
DRAFT
Table A-3. BORAMEP Method D Input Sheet 300 cfs *** bin1 bin2 bin3 bin4 bin5 bin6 bin7 bin8 bin9
16 0.001 0.002 0.002 0.004 0.004 0.016 0.016 0.063 0.0625 0.125 0.125 0.25 0.25 0.5 0.5 1 1 Input Variables Title Date Time S_energy
g (ft/s2)
gamma_w (lb/ft3)
gamma_s (lb/ft3)
Q (cfs)
Vavg (ft/s) h (ft) W (ft)
T (F)
dn (ft)
Cs (ppm)
d65 (mm)
d35 (mm)
ds (ft)
### LF-11A 6/8/2001 1750 0.0008 32.17 62.4 165 280.2 1.82 3.566 43 72 0.3 394.603 0.21 0.17 3.566 ### LF-11B 6/8/2001 1130 0.0008 32.17 62.4 165 272.7 1.9 3.329 43 72 0.3 288.637 0.2 0.14 3.329 ### LF-11C 6/8/2001 1600 0.0008 32.17 62.4 165 262.1 1.73 3.508 43 72 0.3 253.39 0.19 0.13 3.508 ### LF-39A 6/9/2001 1712 0.0008 32.17 62.4 165 286.7 1.31 3.506 62 72 0.3 168.917 0.2 0.07 3.506 ### LF-39B 6/9/2001 1450 0.0008 32.17 62.4 165 277.4 1.29 3.46 62 73 0.3 163.07 0.2 0.097 3.46 ### LF-39C 6/9/2001 1030 0.0008 32.17 62.4 165 290 1.29 3.615 62 72 0.3 171.545 0.19 0.07 3.615 ### LF-25A 6/11/2001 2000 0.0008 32.17 62.4 165 280.7 1.04 4.498 60 73 0.3 1570.35 0.29 0.14 4.498 ### LF-25B 6/11/2001 1840 0.0008 32.17 62.4 165 272.4 1.02 4.44 60 73 0.3 1235.9 0.29 0.15 4.44 ### LF-25C 6/11/2001 1445 0.0008 32.17 62.4 165 287.3 1.06 4.497 60 73 0.3 1588.37 0.3 0.19 4.497 Table A-4. BORAMEP Method D Input Sheet 600 cfs *** bin1 bin2 bin3 bin4 bin5 bin6 bin7 bin8 bin9
16 0.001 0.002 0.002 0.004 0.004 0.016 0.016 0.063 0.0625 0.125 0.125 0.25 0.25 0.5 0.5 1 1 Input Variables Title Date Time S_energy
g (ft/s2)
gamma_w (lb/ft3)
gamma_s (lb/ft3)
Q (cfs)
Vavg (ft/s) h (ft) W (ft)
T (F)
dn (ft)
Cs (ppm)
d65 (mm)
d35 (mm)
ds (ft)
### LF-11A 5/27/2001 1130 0.0008 32.17 62.4 165 621 2.53 4.804 51 70 0.3 588.794 0.082 0.001 4.804 ### LF-11B 5/27/2001 1620 0.0008 32.17 62.4 165 595.2 2.46 4.743 51 70 0.3 576.59 0.016 0.0005 4.743 ### LF-11C 5/27/2001 2200 0.0008 32.17 62.4 165 579.3 2.47 4.696 50 70 0.3 558.594 0.1 0.0005 4.696 ### LF-25A 5/28/2001 1138 0.0008 32.17 62.4 165 587 1.55 5.742 66 70 0.3 302.429 0.39 0.28 5.742 ### LF-25B 5/28/2001 1710 0.0008 32.17 62.4 165 566 1.54 5.576 66 70 0.3 298.104 0.39 0.29 5.576 ### LF-25C 5/29/2001 1045 0.0008 32.17 62.4 165 573 1.53 5.682 66 70 0.3 289.688 0.37 0.26 5.682 ### LF-39A 5/29/2001 1530 0.0008 32.17 62.4 165 603 1.7 4.931 72 70 0.3 238.629 0.31 0.2 4.931 ### LF-39B 5/30/2001 920 0.0008 32.17 62.4 165 571 1.64 4.847 72 70 0.3 228.868 0.3 0.19 4.847 ### LF-39C 5/30/2001 1500 0.0008 32.17 62.4 165 570 1.63 4.847 72 70 0.3 221.393 0.302 0.2 4.847

45
DRAFT
Appendix B: BORAMEP Error Messages for Methods A and B

46
DRAFT
BORAMEP Method A Error Messages 300 cfs
LF-11A-32-36.5,6/8/2001,-9999,FITTED Z-VALUES GENERATED NEGATIVE EXPONENT, NOT CONTINUING... LF-11B-20-32,6/8/2001,-9999,FITTED Z-VALUES GENERATED NEGATIVE EXPONENT, NOT CONTINUING... LF-11B-36.5-39.5,6/8/2001,-9999,FITTED Z-VALUES GENERATED NEGATIVE EXPONENT, NOT CONTINUING... LF-11B-39.5-42.5,6/8/2001,-9999,FITTED Z-VALUES GENERATED NEGATIVE EXPONENT, NOT CONTINUING... LF-11B-45.5-48,6/8/2001,-9999,FITTED Z-VALUES GENERATED NEGATIVE EXPONENT, NOT CONTINUING... LF-11C-20-32,6/8/2001,-9999,FITTED Z-VALUES GENERATED NEGATIVE EXPONENT, NOT CONTINUING... LF-39A-11-29,6/9/2001,-9999,NOT ENOUGH OVERLAPPING BINS FOR MEP LF-39A-29-34.5,6/9/2001,-9999,FITTED Z-VALUES GENERATED NEGATIVE EXPONENT, NOT CONTINUING... LF-39A-34.5-39.5,6/9/2001,-9999,FITTED Z-VALUES GENERATED NEGATIVE EXPONENT, NOT CONTINUING... LF-39A-49.5-56,6/9/2001,-9999,FITTED Z-VALUES GENERATED NEGATIVE EXPONENT, NOT CONTINUING... LF-39A-56-73,6/9/2001,-9999,NOT ENOUGH OVERLAPPING BINS FOR MEP LF-39B-11-29,6/9/2001,-9999,NOT ENOUGH OVERLAPPING BINS FOR MEP LF-39B-44.5-49.5,6/9/2001,-9999,FITTED Z-VALUES GENERATED NEGATIVE EXPONENT, NOT CONTINUING... LF-39B-49.5-56,6/9/2001,-9999,FITTED Z-VALUES GENERATED NEGATIVE EXPONENT, NOT CONTINUING... LF-39B-56-73,6/9/2001,-9999,NOT ENOUGH OVERLAPPING BINS FOR MEP LF-39C-11-29,6/9/2001,-9999,NOT ENOUGH OVERLAPPING BINS FOR MEP LF-39C-56-73,6/9/2001,-9999,NOT ENOUGH OVERLAPPING BINS FOR MEP LF-25A-8-25,6/11/2001,-9999,NOT ENOUGH OVERLAPPING BINS FOR MEP LF-25A-25-30.5,6/11/2001,-9999,NOT ENOUGH OVERLAPPING BINS FOR MEP LF-25A-36-42,6/11/2001,-9999,FITTED Z-VALUES GENERATED NEGATIVE EXPONENT, NOT CONTINUING... LF-25A-54-68,6/11/2001,-9999,NOT ENOUGH OVERLAPPING BINS FOR MEP LF-25B-8-25,6/11/2001,-9999,NOT ENOUGH OVERLAPPING BINS FOR MEP LF-25B-25-30.5,6/11/2001,-9999,NOT ENOUGH OVERLAPPING BINS FOR MEP LF-25B-48-54,6/11/2001,-9999,FITTED Z-VALUES GENERATED NEGATIVE EXPONENT, NOT CONTINUING... LF-25B-54-68,6/11/2001,-9999,NOT ENOUGH OVERLAPPING BINS FOR MEP LF-25C-8-25,6/11/2001,-9999,NOT ENOUGH OVERLAPPING BINS FOR MEP LF-25C-25-30.5,6/11/2001,-9999,NOT ENOUGH OVERLAPPING BINS FOR MEP LF-25C-36-42,6/11/2001,-9999,FITTED Z-VALUES GENERATED NEGATIVE EXPONENT, NOT CONTINUING... LF-25C-48-54,6/11/2001,-9999,FITTED Z-VALUES GENERATED NEGATIVE EXPONENT, NOT CONTINUING... LF-25C-54-68,6/11/2001,-9999,NOT ENOUGH OVERLAPPING BINS FOR MEP

47
DRAFT
BORAMEP Method A Error Messages 600 cfs
LF-11A-34-38,5/27/2001,-9999,NOT ENOUGH OVERLAPPING BINS FOR MEP LF-11A-50-54,5/27/2001,-9999,FITTED Z-VALUES GENERATED NEGATIVE EXPONENT, NOT CONTINUING... LF-11A-54-66,5/27/2001,-9999,FITTED Z-VALUES GENERATED NEGATIVE EXPONENT, NOT CONTINUING... LF-11B-34-38,5/27/2001,-9999,NOT ENOUGH OVERLAPPING BINS FOR MEP LF-11B-38-42,5/27/2001,-9999,FITTED Z-VALUES GENERATED NEGATIVE EXPONENT, NOT CONTINUING... LF-11B-42-46,5/27/2001,-9999,NOT ENOUGH OVERLAPPING BINS FOR MEP LF-11C-15-34,5/27/2001,-9999,NOT ENOUGH OVERLAPPING BINS FOR MEP LF-11C-46-50,5/27/2001,-9999,NOT ENOUGH OVERLAPPING BINS FOR MEP LF-11C-50-54,5/27/2001,-9999,FITTED Z-VALUES GENERATED NEGATIVE EXPONENT, NOT CONTINUING... LF-25A-5-21,5/28/2001,-9999,NOT ENOUGH OVERLAPPING BINS FOR MEP LF-25A-21-27.5,5/28/2001,-9999,NOT ENOUGH OVERLAPPING BINS FOR MEP LF-25A-27.5-34.5,5/28/2001,-9999,NOT ENOUGH OVERLAPPING BINS FOR MEP LF-25A-57-71,5/28/2001,-9999,NOT ENOUGH OVERLAPPING BINS FOR MEP LF-25B-5-21,5/28/2001,-9999,NOT ENOUGH OVERLAPPING BINS FOR MEP LF-25B-21-27.5,5/28/2001,-9999,NOT ENOUGH OVERLAPPING BINS FOR MEP LF-25B-27.5-34.5,5/28/2001,-9999,NOT ENOUGH OVERLAPPING BINS FOR MEP LF-25B-57-71,5/28/2001,-9999,NOT ENOUGH OVERLAPPING BINS FOR MEP LF-25C-5-21,5/29/2001,-9999,NOT ENOUGH OVERLAPPING BINS FOR MEP LF-25C-21-27.5,5/29/2001,-9999,NOT ENOUGH OVERLAPPING BINS FOR MEP LF-25C-27.5-34.5,5/29/2001,-9999,NOT ENOUGH OVERLAPPING BINS FOR MEP LF-25C-57-71,5/29/2001,-9999,NOT ENOUGH OVERLAPPING BINS FOR MEP LF-39A-5-20,5/29/2001,-9999,NOT ENOUGH OVERLAPPING BINS FOR MEP LF-39A-20-28,5/29/2001,-9999,FITTED Z-VALUES GENERATED NEGATIVE EXPONENT, NOT CONTINUING... LF-39A-62-77,5/29/2001,-9999,NOT ENOUGH OVERLAPPING BINS FOR MEP LF-39B-5-20,5/30/2001,-9999,NOT ENOUGH OVERLAPPING BINS FOR MEP LF-39B-20-28,5/30/2001,-9999,FITTED Z-VALUES GENERATED NEGATIVE EXPONENT, NOT CONTINUING... LF-39B-28-37,5/30/2001,-9999,FITTED Z-VALUES GENERATED NEGATIVE EXPONENT, NOT CONTINUING... LF-39B-62-77,5/30/2001,-9999,NOT ENOUGH OVERLAPPING BINS FOR MEP LF-39C-5-20,5/30/2001,-9999,NOT ENOUGH OVERLAPPING BINS FOR MEP LF-39C-20-28,5/30/2001,-9999,FITTED Z-VALUES GENERATED NEGATIVE EXPONENT, NOT CONTINUING... LF-39C-28-37,5/30/2001,-9999,FITTED Z-VALUES GENERATED NEGATIVE EXPONENT, NOT CONTINUING... LF-39C-62-77,5/30/2001,-9999,NOT ENOUGH OVERLAPPING BINS FOR MEP

48
DRAFT
Appendix C: BORAMEP Error Messages for Method D

49
DRAFT
BORAMEP Method D Error Messages 300 cfs
LF-11B,6/8/2001,-9999,FITTED Z-VALUES GENERATED NEGATIVE EXPONENT, NOT CONTINUING... LF-11C,6/8/2001,-9999,FITTED Z-VALUES GENERATED NEGATIVE EXPONENT, NOT CONTINUING...
BORAMEP Method D Error Message 600 cfs
LF-11B,5/27/2001,-9999,FITTED Z-VALUES GENERATED NEGATIVE EXPONENT, NOT CONTINUING...

50
DRAFT
Appendix D: BORAMEP Method A Output

51
DRAFT
Table D-1. BORAMEP Method A Output 300 cfs
*** Discharge Conc Suspended d65 d35 Temp Total Load Total Sand CS total CS tot sand %sand
Location Date (cfs) (PPM) Sample (tons/day) (mm) (mm) F (tons/day)
(>0.625mm) (tons/day) tons/day tons/day
LF-11A-20-32 6/8/2001 38.098 354.5 36.46154 0.9 0.34 72 41.747112 14.60800762 31.944444 LF-11A-32-36.5 51.5175 443.1 61.566424 27.42267503 44.541608 LF-11A-36.5-39.5 6/8/2001 35.7575 421.5 40.68943 0.18 0.14 72 45.584928 18.90709448 37.100949 LF-11A-39.5-42.5 6/8/2001 35.265 451.7 43.00811 0.16 0.12 72 57.620693 34.0044684 47.207084 LF-11A-42.5-45.5 6/8/2001 32.2025 411.7 35.79761 0.18 0.14 72 43.027961 20.61476988 41.70778 LF-11A-45.5-48 6/8/2001 26.3675 391.4 27.86525 0.21 0.15 72 32.309856 13.18283836 36.020151 LF-11A-48-63 6/8/2001 53.535 392.5 56.73083 0.2 0.15 72 69.878542 23.71270173 351.7355158 152.45256 38.850387 LF-11B-20-32 33.168 274.8 24.577556 8.760457634 35.644136 LF-11B-32-36.5 6/8/2001 46.11 296.7 36.93411 0.19 0.15 72 42.293346 18.14305242 36.543606 LF-11B-36.5-39.5 32.465 322 28.192538 12.45774967 44.18811 LF-11B-39.5-42.5 32.55 290.8 25.531666 8.808127289 34.498834 LF-11B-42.5-45.5 6/8/2001 34.5975 256 23.91379 0.18 0.15 72 28.457298 9.185573729 26.953125 LF-11B-45.5-48 26.8075 298.6 21.589327 7.229682232 33.487298 LF-11B-48-63 6/8/2001 56.41 295.1 44.94228 0.21 0.16 72 49.722174 19.31214733 220.3639054 83.89679 41.397289 LF-11C-20-32 35.127 245.2 23.229464 6.295835914 27.102804 LF-11C-32-36.5 6/8/2001 49.1125 237.6 31.5098 0.19 0.15 72 41.436731 9.7160831 21.5 LF-11C-36.5-39.5 6/8/2001 35.6 203.4 19.55318 0.19 0.15 72 24.936872 9.086511452 31.717172 LF-11C-39.5-42.5 6/8/2001 35.2575 291.7 27.76528 0.18 0.14 72 33.315034 16.36719633 45.350649 LF-11C-42.5-45.5 6/8/2001 35.53 299.4 28.7216 0.21 0.16 72 33.079433 16.36142065 47.965846 LF-11C-45.5-48 6/8/2001 28.845 267.9 20.86376 0.22 0.16 72 24.480083 9.85964463 38.953784 LF-11C-48-63 6/8/2001 60.688 255.4 41.84671 0.22 0.16 72 48.279187 16.83294894 228.7568032 84.519641 31.325301 LF-25A-8-25 34.183 60.36 5.5644839 0.885845202 15.919629 LF-25A-25-30.5 8.0585 1805 39.229883 3.215564151 8.1967213 LF-25A-30.5-36 6/11/2001 41.1055 1690 187.6149 0.32 0.21 73 191.80267 2.716088038 12.007168 LF-25A-36-42 56.59 1734 264.67078 20.86075098 7.8817734 LF-25A-42-48 6/11/2001 60.045 1643 266.3721 0.35 0.28 73 377.33874 3.977045972 7.8822412 LF-25A-48-54 6/11/2001 54.32 1670 244.9289 0.3 0.19 73 255.37179 3.396734774 27.251462 LF-25A-54-68 33.032 1687 150.28828 22.7298297 1284.266615 57.781859 15.124153 LF-25B-8-25 26.159 1548 109.21012 16.51124951 15.11879 LF-25B-25-30.5 9.1135 1584 38.940908 3.490416534 8.9633671 LF-25B-30.5-36 6/11/2001 32.8295 1678 148.6981 0.26 0.15 73 157.87686 1.983980302 27.91381

52
DRAFT
Table D-1. BORAMEP Method A Output 300 cfs
*** Discharge Conc Suspended d65 d35 Temp Total Load Total Sand CS total CS tot sand %sand
Location Date (cfs) (PPM) Sample (tons/day) (mm) (mm) F (tons/day)
(>0.625mm) (tons/day) tons/day tons/day
LF-25B-36-42 6/11/2001 57.92 1675 261.8671 0.17 0.11 73 366.76531 4.703663668 16.231555 LF-25B-42-48 6/11/2001 62.15 1599 268.4014 0.33 0.26 73 279.56133 4.141526031 12.110727 LF-25B-48-54 55.425 1592 237.94689 40.88333431 17.181706 LF-25B-54-68 28.853 1561 121.4428 62.74351832 1311.744212 134.45769 51.665081 LF-25C-8-25 34.744 1590 148.94186 10.52403581 7.0658683 LF-25C-25-30.5 10.898 1624 47.719784 4.967115042 10.408922 LF-25C-30.5-36 6/11/2001 34.056 1539 141.4915 0.26 0.14 73 145.14704 1.701623876 12.176414 LF-25C-36-42 56.975 1578 242.46789 23.82632411 9.8265896 LF-25C-42-48 6/11/2001 58.14 1517 238.1581 0.36 0.28 73 289.45322 4.164613657 9.1286307 LF-25C-48-54 54.41 1529 224.35758 19.44980262 8.6691087 LF-25C-54-68 31.478 1576 133.77121 26.91737675 1231.858583 91.550892 20.121951 LF-39A-11-29 51.6076 132 18.377429 7.51554566 40.895522 LF-39A-29-34.5 43.11 149.6 17.395553 0.180010424 1.0348072 LF-39A-34.5-39.5 40.5525 169.1 18.49272 0.253597393 1.3713364 LF-39A-39.5-44.5 6/9/2001 42.91 169.2 19.59914 0.08 0.033 72 38.645414 4.051568274 1.6951508 LF-39A-44.5-49.5 6/9/2001 36.2025 184.7 18.05743 0.24 0.17 72 24.588991 2.352252595 1.0809232 LF-39A-49.5-56 38.005 178.1 18.256962 0.183380726 1.0044427 LF-39A-56-73 37.589 184.6 18.711825 0.458447111 154.4688931 14.994802 2.4500395 LF-39B-11-29 54.871 151.8 22.463991 0.218692299 0.9735238 LF-39B-29-34.5 6/9/2001 41.595 171.1 19.2119 0.31 0.22 73 20.412793 2.000701238 1.1439842 LF-39B-34.5-39.5 6/9/2001 39.4975 162.1 17.28298 0.32 0.23 73 25.779383 8.210871218 1.3105206 LF-39B-39.5-44.5 6/9/2001 39.055 151.9 16.01726 0.1 0.064 73 21.798154 4.635945611 1.2155163 LF-39B-44.5-49.5 34.9575 157.6 14.861398 0.1966174 1.3230074 LF-39B-49.5-56 36.385 158.6 15.565519 0.187058318 1.201748 LF-39B-56-73 31.026 210.2 17.5882 0.367822994 138.4694396 15.817709 2.0913055 LF-39C-11-29 55.6503 163.7 24.572351 0.189403745 0.7708003 LF-39C-29-34.5 6/9/2001 44.2025 163 19.45714 0.34 0.27 72 33.404032 3.905032958 1.1870101 LF-39C-34.5-39.5 6/9/2001 42.485 168.2 19.2971 0.32 0.22 72 20.933164 2.676202643 1.1305973 LF-39C-39.5-44.5 6/9/2001 40.08 170.2 18.41446 0.14 0.088 72 23.909522 3.452330585 1.417214 LF-39C-44.5-49.5 6/9/2001 34.7925 166.2 15.61343 0.29 0.2 72 24.527804 2.125925609 1.3418079 LF-39C-49.5-56 6/9/2001 37.0205 163.8 16.37269 0.28 0.19 72 20.153375 1.744937062 1.1253246

53
DRAFT
Table D-1. BORAMEP Method A Output 300 cfs
*** Discharge Conc Suspended d65 d35 Temp Total Load Total Sand CS total CS tot sand %sand
Location Date (cfs) (PPM) Sample (tons/day) (mm) (mm) F (tons/day)
(>0.625mm) (tons/day) tons/day tons/day
LF-39C-56-73 32.4405 178.9 15.652469 0.890169684 163.1527161 14.984002 5.6870881

54
DRAFT
Table D-2. BORAMEP Method A Output 600 cfs
*** Discharge Conc Suspended d65 d35 Temp Total Load Total Sand CS total total sand %sand
Location Date (cfs) (PPM) Sample (tons/day) (mm) (mm) F (tons/day)
(>0.625mm) (tons/day) tons/day
LF-11A-15-34 5/27/2001 142.752 579.2 223.2531 0.3 0.19 70 229.161791 85.82107726 36.653 LF-11A-34-38 93.705 643.3 162.571344 68.41129486 42.081 LF-11A-38-42 5/27/2001 91.065 715 175.8108 0.3 0.19 70 200.960722 104.3270706 46.162 LF-11A-42-46 5/27/2001 91.155 690.1 169.8397 0.19 0.15 70 201.284343 85.04555834 41.95 LF-11A-46-50 5/27/2001 86.61 535.8 125.288 0.14 0.028 70 157.635426 68.93035578 38.191 LF-11A-50-54 56.64 555.9 84.9097636 30.1716228 35.534 LF-11A-54-66 59.497 538.6 86.4174153 22.34933154 1122.9408 465.0563 25.862 LF-11B-15-34 5/27/2001 138.661 565.6 211.7353 0.19 0.16 70 230.089893 75.32023954 31.5 LF-11B-34-38 88.05 699.1 166.010667 73.40088487 44.215 LF-11B-38-42 89.06 731.4 175.672032 79.3452713 45.167 LF-11B-42-46 88.925 593.3 142.279114 79.4024722 55.808 LF-11B-46-50 5/27/2001 83.11 586.5 131.6183 0.175 0.135 70 133.07597 47.89497002 35.755 LF-11B-50-54 5/27/2001 49.96 537.5 72.50445 0.16 0.11 70 96.6579726 35.89127945 32.713 LF-11B-54-66 5/27/2001 57.468 505.8 78.47697 0.16 0.11 70 91.8573622 27.46801898 1035.64301 418.7231 27.452 LF-11C-15-34 130.848 593.5 209.424895 85.70000842 40.922 LF-11C-34-38 5/27/2001 91.67 566.5 140.2251 0.19 0.15 70 166.002596 66.53267119 38.318 LF-11C-38-42 5/27/2001 90.575 644.3 157.5559 0.28 0.11 70 184.104612 97.8828641 46.056 LF-11C-42-46 5/27/2001 87.425 752.9 177.7271 0.2 0.16 70 199.195732 109.2547984 51.274 LF-11C-46-50 75.13 579.1 117.344792 49.80572922 42.444 LF-11C-50-54 46.51 499.6 62.6669389 21.05294337 33.595 LF-11C-54-66 5/27/2001 57.111 420.2 64.79503 0.17 0.12 70 73.1886198 19.52053283 1011.92819 449.7495 24.327 LF-25A-5-21 72.107 266.3 51.7791006 4.451596886 8.5973 LF-25A-21-27.5 31.8695 314.3 27.0164687 3.409289263 12.619 LF-25A-27.5-34.5 67.335 320.8 58.253371 8.607886446 14.777 LF-25A-34.5-41.5 5/28/2001 120.76 337.9 110.1889 0.38 0.31 70 116.158936 21.95664308 16.743 LF-25A-41.5-48.5 5/28/2001 126.325 326 111.1756 0.34 0.27 70 118.142471 22.70860282 16.909 LF-25A-48.5-57 5/28/2001 127.5875 310.2 106.8592 0.35 0.28 70 112.520489 19.07149949 15.371 LF-25A-57-71 40.966 274.4 30.3184563 3.463145319 514.189294 83.66866 11.423 LF-25B-5-21 65.56 274.9 48.6033825 4.815195793 9.9071 LF-25B-21-27.5 33.0745 306 27.2902319 3.40575017 12.48 LF-25B-27.5-34.5 61.1085 316.5 52.1636607 8.741712363 16.758 LF-25B-34.5-41.5 5/28/2001 116.9525 332.6 105.0167 0.35 0.29 70 114.253726 24.62333154 19.33 LF-25B-41.5-48.5 5/28/2001 118.92 307 98.57696 0.36 0.3 70 103.216002 19.95883796 17.09 LF-25B-48.5-57 5/28/2001 129.4675 311.6 108.9136 0.33 0.26 70 118.751897 16.44068618 11.967

55
DRAFT
Table D-2. BORAMEP Method A Output 600 cfs
*** Discharge Conc Suspended d65 d35 Temp Total Load Total Sand CS total total sand %sand
Location Date (cfs) (PPM) Sample (tons/day) (mm) (mm) F (tons/day)
(>0.625mm) (tons/day) tons/day
LF-25B-57-71 40.906 302.3 33.3495 3.983195549 497.628399 81.96871 11.944 LF-25C-5-21 68.475 271.9 50.219448 5.898792304 11.746 LF-25C-21-27.5 30.24325 294.6 24.0290674 3.404354291 14.168 LF-25C-27.5-34.5 65.85725 303.9 53.9704072 10.3701101 19.214 LF-25C-34.5-41.5 5/29/2001 113.9175 307.6 94.61076 0.38 0.29 70 103.481868 20.0564992 17.208 LF-25C-41.5-48.5 5/29/2001 122.0025 306.2 100.8741 0.37 0.29 70 108.793112 22.87174075 18.094 LF-25C-48.5-57 5/29/2001 127.1375 299.1 102.6892 0.32 0.23 70 106.303329 19.30834141 16.264 LF-25C-57-71 45.507 277.6 34.0718386 4.788938521 480.869071 86.69878 14.055 LF-39A-5-20 40.164 229.2 24.8210605 1.939809066 7.8152 LF-39A-20-28 80.65 219.7 47.7951117 4.182769401 8.7515 LF-39A-28-37 5/29/2001 139.99 242.2 91.54034 0.35 0.28 70 98.2494981 17.48114939 12.903 LF-39A-37-46 5/29/2001 141.01 244 92.87859 0.3 0.2 70 98.9199213 15.82820076 13.36 LF-39A-46-55 5/29/2001 104.02 244.6 68.69537 0.3 0.2 70 75.5420848 8.990090469 9.3923 LF-39A-55-62 5/29/2001 56.195 250.4 37.98998 0.3 0.2 70 39.3634825 5.143748331 17.051 LF-39A-62-77 40.758 243.8 26.7971044 3.580719354 411.488263 57.14649 13.362 LF-39B-5-20 37.511 213.7 21.6169276 2.076502902 9.6059 LF-39B-20-28 80.53 230.1 49.9825137 5.243354944 10.49 LF-39B-28-37 136.825 247 91.1383618 10.76676154 11.814 LF-39B-37-46 5/30/2001 130.4 243.3 85.65736 0.35 0.27 70 119.354223 18.19891179 13.034 LF-39B-46-55 5/30/2001 103.56 219 61.23503 0.3 0.2 70 66.2960592 5.204830743 6.1644 LF-39B-55-62 5/30/2001 47.715 224.2 28.88515 0.19 0.12 70 30.242489 2.057565804 6.1033 LF-39B-62-77 34.66 230.8 21.5744333 1.613182644 400.205008 45.16111 7.4773 LF-39C-5-20 38.749 210.6 22.0117092 1.343593403 6.104 LF-39C-20-28 78.93 223.5 47.5831961 3.45257233 7.2559 LF-39C-28-37 129.595 262.1 91.612199 12.92102691 14.104 LF-39C-37-46 5/30/2001 133.575 229 82.58419 0.33 0.25 70 176.742872 20.88145184 9.8734 LF-39C-46-55 5/30/2001 100.955 213.3 58.15008 0.25 0.19 70 63.622726 6.044044096 7.6705 LF-39C-55-62 5/30/2001 51.61 229.3 31.94847 0.21 0.08 70 34.7680439 3.184095785 7.6923 LF-39C-62-77 36.822 202.8 20.140256 0.837884302 456.481002 48.66467 4.1602

56
DRAFT
Appendix E: BORAMEP Method D Output

57
DRAFT
Table E-1. BORAMEP Method D Output 300 cfs
Location Date Discharge (cfs)
Conc (ppm)
Suspended Sample
(tons/day)
d65 (mm)
d35 (mm)
Temp (F)
Total Load (tons/day)
Total Sand Load (>0.0625) (tons/day) %>sand
LF-11A 6/8/2001 280.16 394.6028 298.4901 0.21 0.17 72 351.090381 146.9372433 38.0145162 LF-11B 6/8/2001 272.743 288.637 212.309048 79.67877835 37.5296198 LF-11C 6/8/2001 262.108 253.39008 179.11534 56.83157397 31.7290378 LF-25A 6/11/2001 280.7 1570.35 1190.153 0.29 0.14 73 1238.45095 18.04885138 11.9115363 LF-25B 6/11/2001 272.4 1235.898 908.9779 0.29 0.15 73 906.548452 83.63524376 14.5925213 LF-25C 6/11/2001 287.3 1588.369 1232.113 0.3 0.19 73 1254.26305 15.03489891 25.688785 LF-39A 6/9/2001 286.6713 168.9171 130.744 0.2 0.07 72 188.959772 29.5331819 2.14626263 LF-39B 6/9/2001 277.4 163.0703 122.1364 0.2 0.097 73 153.527925 28.81315002 12.7573554 LF-39C 6/9/2001 289.9766 171.5449 134.3088 0.19 0.07 72 179.353368 37.71999131 1.36282647 Table E-2. BORAMEP Method D Output 600 cfs
Location Date Discharge (cfs)
Conc (ppm)
Suspended Sample
(tons/day)
d65 (mm)
d35 (mm)
Temp (F)
Total Load (tons/day)
Total Sand Load (>0.0625) (tons/day) %>sand
LF-11A 5/27/2001 621 588.7935 987.2301 0.082 0.001 70 1424.19396 578.4373034 35.7339788 LF-11B 5/27/2001 595.2 576.58996 925.535101 323.4931017 34.9520079 LF-11C 5/27/2001 579.3 558.5942 873.7027 0.1 0.0005 70 1227.52209 512.1096752 37.5722404 LF-25A 5/28/2001 587 302.4286 479.3191 0.39 0.28 70 508.888561 73.42319855 13.3455981 LF-25B 5/28/2001 566 298.1038 455.5623 0.39 0.29 70 473.719985 65.00746053 12.8659141 LF-25C 5/29/2001 573 289.6881 448.1765 0.37 0.26 70 528.462422 85.55739266 15.1009544 LF-39A 5/29/2001 603 238.6293 388.5123 0.31 0.2 70 430.608782 53.8123042 11.4990487 LF-39B 5/30/2001 571 228.8677 352.8454 0.3 0.19 70 398.0067 41.47435172 9.2118714 LF-39C 5/30/2001 570 221.3929 340.7238 0.302 0.2 70 376.512425 33.70996487 7.59999432

58
DRAFT
Appendix F: BORAMEP Method B Output

59
DRAFT
Table F-1. BORAMEP Method B Output 300 cfs
*** Discharge Conc Suspended d65 d35 Temp Total Load Total Sand
Load mb SS
TL mobile
bed mb
sand mb SS
total side
slopes Q mb %sand Location Date (cfs) (PPM) Sample
(tons/day) (mm) (mm) F (tons/day) (>0.625mm)
(tons/day) tons/day
LF-11A-20-32 6/8/2001 38.098 354.5 36.419518 11.63401259 36.41952 31.944 LF-11A-32-36.5 51.5175 443.1 61.566424 27.42267503 61.56642 44.542 LF-11A-36.5-39.5 6/8/2001 35.7575 421.5 40.68943 0.18 0.14 72 45.584928 18.90709448 40.64254 37.101 LF-11A-39.5-42.5 6/8/2001 35.265 451.7 43.00811 0.16 0.12 72 57.620693 34.0044684 42.95854 47.207 LF-11A-42.5-45.5 6/8/2001 32.2025 411.7 35.79761 0.18 0.14 72 43.027961 20.61476988 35.75635 41.708 LF-11A-45.5-48 6/8/2001 26.3675 391.4 27.86525 0.21 0.15 72 32.309856 13.18283836 27.83313 240.10986 114.132 208.75698 93.084953 181.1 36.02 LF-11A-48-63 6/8/2001 53.535 392.5 56.665436 22.01474121 56.66544 38.85 LF-11B-20-32 33.168 274.8 24.577556 8.760457634 24.57756 35.644 LF-11B-32-36.5 6/8/2001 46.11 296.7 36.93411 0.19 0.15 72 42.293346 18.14305242 36.89154 36.544 LF-11B-36.5-39.5 32.465 322 28.192538 12.45774967 28.19254 44.188 LF-11B-39.5-42.5 32.55 290.8 25.531666 8.808127289 25.53167 34.499 LF-11B-42.5-45.5 6/8/2001 34.5975 256 23.91379 0.18 0.15 72 28.457298 9.185573729 23.88623 26.953 LF-11B-45.5-48 26.8075 298.6 21.589327 7.229682232 21.58933 146.06418 55.8242 136.0913 69.468035 172.5 33.487 LF-11B-48-63 6/8/2001 56.41 295.1 44.890479 18.58344128 44.89048 41.397 LF-11C-20-32 35.127 245.2 23.229464 6.295835914 23.22946 27.103 LF-11C-32-36.5 6/8/2001 49.1125 237.6 31.5098 0.19 0.15 72 41.436731 9.7160831 31.47349 21.5 LF-11C-36.5-39.5 6/8/2001 35.6 203.4 19.55318 0.19 0.15 72 24.936872 9.086511452 19.53064 31.717 LF-11C-39.5-42.5 6/8/2001 35.2575 291.7 27.76528 0.18 0.14 72 33.315034 16.36719633 27.73328 45.351 LF-11C-42.5-45.5 6/8/2001 35.53 299.4 28.7216 0.21 0.16 72 33.079433 16.36142065 28.68849 47.966 LF-11C-45.5-48 6/8/2001 28.845 267.9 20.86376 0.22 0.16 72 24.480083 9.85964463 20.83971 157.24815 61.3909 128.26562 65.02794 184.3 38.954 LF-11C-48-63 6/8/2001 60.688 255.4 41.798476 13.09349861 41.79848 31.325 LF-25A-8-25 34.183 60.36 5.5644839 0.885845202 5.564484 15.92 LF-25A-25-30.5 8.0585 1805 39.229883 3.215564151 39.22988 8.1967 LF-25A-30.5-36 6/11/2001 41.1055 1690 187.6149 0.32 0.21 73 191.80267 2.716088038 187.3986 12.007 LF-25A-36-42 56.59 1734 264.67078 20.86075098 264.6708 7.8818 LF-25A-42-48 6/11/2001 60.045 1643 266.3721 0.35 0.28 73 377.33874 3.977045972 266.0651 7.8822 LF-25A-48-54 6/11/2001 54.32 1670 244.9289 0.3 0.19 73 255.37179 3.396734774 244.6466 1128.4139 34.1662 1002.011 155.85276 220.1 27.251 LF-25A-54-68 33.032 1687 150.28828 22.7298297 150.2883 15.124 LF-25B-8-25 26.159 1548 109.21012 16.51124951 109.2101 15.119 LF-25B-25-30.5 9.1135 1584 38.940908 3.490416534 38.94091 8.9634 LF-25B-30.5-36 6/11/2001 32.8295 1678 148.6981 0.26 0.15 73 157.87686 1.983980302 148.5267 27.914 LF-25B-36-42 6/11/2001 57.92 1675 261.8671 0.17 0.11 73 366.76531 4.703663668 261.5652 16.232 LF-25B-42-48 6/11/2001 62.15 1599 268.4014 0.33 0.26 73 279.56133 4.141526031 268.092 12.111 LF-25B-48-54 55.425 1592 237.94689 40.88333431 237.9469 1081.0913 55.2029 955.07172 230.65292 217.4 17.182 LF-25B-54-68 28.853 1561 121.4428 62.74351832 121.4428 51.665

60
DRAFT
Table F-1. BORAMEP Method B Output 300 cfs
*** Discharge Conc Suspended d65 d35 Temp Total Load Total Sand
Load mb SS
TL mobile
bed mb
sand mb SS
total side
slopes Q mb %sand Location Date (cfs) (PPM) Sample
(tons/day) (mm) (mm) F (tons/day) (>0.625mm)
(tons/day) tons/day
LF-25C-8-25 34.744 1590 148.94186 10.52403581 148.9419 7.0659 LF-25C-25-30.5 10.898 1624 47.719784 4.967115042 47.71978 10.409 LF-25C-30.5-36 6/11/2001 34.056 1539 141.4915 0.26 0.14 73 145.14704 1.701623876 141.3284 12.176 LF-25C-36-42 56.975 1578 242.46789 23.82632411 242.4679 9.8266 LF-25C-42-48 6/11/2001 58.14 1517 238.1581 0.36 0.28 73 289.45322 4.164613657 237.8836 9.1286 LF-25C-48-54 54.41 1529 224.35758 19.44980262 224.3576 949.14551 54.1095 893.7572 282.71307 214.5 8.6691 LF-25C-54-68 31.478 1576 133.77121 26.91737675 133.7712 20.122 LF-39A-11-29 51.6076 132 18.377429 7.51554566 18.37743 40.896 LF-39A-29-34.5 43.11 149.6 17.395553 0.180010424 17.39555 1.0348 LF-39A-34.5-39.5 40.5525 169.1 18.49272 0.253597393 18.49272 1.3713 LF-39A-39.5-44.5 6/9/2001 42.91 169.2 19.59914 0.08 0.033 72 38.645414 4.051568274 19.57656 1.6952 LF-39A-44.5-49.5 6/9/2001 36.2025 184.7 18.05743 0.24 0.17 72 24.588991 2.352252595 18.03661 1.0809 LF-39A-49.5-56 38.005 178.1 18.256962 0.183380726 18.25696 117.37964 7.02081 91.758398 37.089254 200.8 1.0044 LF-39A-56-73 37.589 184.6 18.711825 0.458447111 18.71183 2.45 LF-39B-11-29 54.871 151.8 22.463991 0.218692299 22.46399 0.9735 LF-39B-29-34.5 6/9/2001 41.595 171.1 19.2119 0.31 0.22 73 20.412793 2.000701238 19.18976 1.144 LF-39B-34.5-39.5 6/9/2001 39.4975 162.1 17.28298 0.32 0.23 73 25.779383 8.210871218 17.26306 1.3105 LF-39B-39.5-44.5 6/9/2001 39.055 151.9 16.01726 0.1 0.064 73 21.798154 4.635945611 15.9988 1.2155 LF-39B-44.5-49.5 34.9575 157.6 14.861398 0.1966174 14.8614 1.323 LF-39B-49.5-56 36.385 158.6 15.565519 0.187058318 15.56552 98.417248 15.2312 82.878529 40.052191 191.5 1.2017 LF-39B-56-73 31.026 210.2 17.5882 0.367822994 17.5882 2.0913 LF-39C-11-29 55.6503 163.7 24.572351 0.189403745 24.57235 0.7708 LF-39C-29-34.5 6/9/2001 44.2025 163 19.45714 0.34 0.27 72 33.404032 3.905032958 19.43471 1.187 LF-39C-34.5-39.5 6/9/2001 42.485 168.2 19.2971 0.32 0.22 72 20.933164 2.676202643 19.27485 1.1306 LF-39C-39.5-44.5 6/9/2001 40.08 170.2 18.41446 0.14 0.088 72 23.909522 3.452330585 18.39323 1.4172 LF-39C-44.5-49.5 6/9/2001 34.7925 166.2 15.61343 0.29 0.2 72 24.527804 2.125925609 15.59544 1.3418 LF-39C-49.5-56 6/9/2001 37.0205 163.8 16.37269 0.28 0.19 72 20.153375 1.744937062 16.35381 122.9279 13.9044 89.052049 40.224819 198.6 1.1253 LF-39C-56-73 32.4405 178.9 15.652469 0.890169684 15.65247 5.6871

61
DRAFT
Table F-2. BORAMEP Method B Output 600 cfs
*** Discharge Conc Suspended d65 d35 Temp Total Load Total Sand
Load MB SS TL mobile
bed mb sand
total mb SS
TL side
slopes Q
mb %sand Location Date (cfs) (PPM) Sample
(tons/day) (mm) (mm) F (tons/day) (>0.625mm)
(tons/day) tons/day
LF-11A-15-34 5/27/2001 142.752 579.23 222.99583 81.73552351 222.99583 36.653 LF-11A-34-38 93.705 643.31 162.57134 68.41129486 162.571344 42.081 LF-11A-38-42 5/27/2001 91.065 715.04 175.8108 0.3 0.19 70 200.96072 104.3270706 175.608173 46.162 LF-11A-42-46 5/27/2001 91.155 690.07 169.8397 0.19 0.15 70 201.28434 85.04555834 169.643969 41.95 LF-11A-46-50 5/27/2001 86.61 535.77 125.288 0.14 0.03 70 157.63543 68.93035578 125.143609 722.45 326.71 632.97 394.323 363 38.191 LF-11A-50-54 56.64 555.87 84.909764 30.1716228 84.9097636 35.534 LF-11A-54-66 59.497 538.57 86.417415 22.34933154 86.4174153 25.862 LF-11B-15-34 5/27/2001 138.661 565.56 211.49127 66.61905867 211.491274 31.5 LF-11B-34-38 88.05 699.11 166.01067 73.40088487 166.010667 44.215 LF-11B-38-42 89.06 731.4 175.67203 79.3452713 175.672032 45.167 LF-11B-42-46 88.925 593.27 142.27911 79.4024722 142.279114 55.808 LF-11B-46-50 5/27/2001 83.11 586.54 131.6183 0.18 0.14 70 133.07597 47.89497002 131.46658 617.03 280.04 615.43 362.298 349 35.755 LF-11B-50-54 5/27/2001 49.96 537.5 72.420879 23.69117132 72.4208791 32.713 LF-11B-54-66 5/27/2001 57.468 505.77 78.386515 21.51903564 78.3865149 27.452 LF-11C-15-34 130.848 593.47 209.42489 85.70000842 209.424895 40.922 LF-11C-34-38 5/27/2001 91.67 566.55 140.2251 0.19 0.15 70 166.0026 66.53267119 140.063482 38.318 LF-11C-38-42 5/27/2001 90.575 644.26 157.5559 0.28 0.11 70 184.10461 97.8828641 157.374352 46.056 LF-11C-42-46 5/27/2001 87.425 752.93 177.7271 0.2 0.16 70 199.19573 109.2547984 177.522225 51.274 LF-11C-46-50 75.13 579.15 117.34479 49.80572922 117.344792 666.64 323.47 592.3 336.812 345 42.444 LF-11C-50-54 46.51 499.61 62.666939 21.05294337 62.6669389 33.595 LF-11C-54-66 5/27/2001 57.111 420.2 64.720338 15.74446674 64.7203376 24.327 LF-25A-5-21 72.107 266.27 51.779101 4.451596886 51.7791006 8.5973 LF-25A-21-27.5 31.8695 314.33 27.016469 3.409289263 27.0164687 12.619 LF-25A-27.5-34.5 67.335 320.79 58.253371 8.607886446 58.253371 14.777 LF-25A-34.5-41.5 5/28/2001 120.76 337.95 110.1889 0.38 0.31 70 116.15894 21.95664308 110.061842 16.743 LF-25A-41.5-48.5 5/28/2001 126.325 325.95 111.1756 0.34 0.27 70 118.14247 22.70860282 111.047499 16.909 LF-25A-48.5-57 5/28/2001 127.5875 310.2 106.8592 0.35 0.28 70 112.52049 19.07149949 106.736018 432.09 75.75 413.12 82.097 474 15.371 LF-25A-57-71 40.966 274.42 30.318456 3.463145319 30.3184563 11.423 LF-25B-5-21 65.56 274.89 48.603383 4.815195793 48.6033825 9.9071 LF-25B-21-27.5 33.0745 305.95 27.290232 3.40575017 27.2902319 12.48 LF-25B-27.5-34.5 61.1085 316.52 52.163661 8.741712363 52.1636607 16.758 LF-25B-34.5-41.5 5/28/2001 116.9525 332.57 105.0167 0.35 0.29 70 114.25373 24.62333154 104.895608 19.33 LF-25B-41.5-48.5 5/28/2001 118.92 307.01 98.57696 0.36 0.3 70 103.216 19.95883796 98.4633393 17.09 LF-25B-48.5-57 5/28/2001 129.4675 311.57 108.9136 0.33 0.26 70 118.7519 16.44068618 108.788062 415.67 73.17 391.6 81.952 460 11.967 LF-25B-57-71 40.906 302.3 33.3495 3.983195549 33.3495 11.944

62
DRAFT
Table F-2. BORAMEP Method B Output 600 cfs
*** Discharge Conc Suspended d65 d35 Temp Total Load Total Sand
Load MB SS TL mobile
bed mb sand
total mb SS
TL side
slopes Q
mb %sand Location Date (cfs) (PPM) Sample
(tons/day) (mm) (mm) F (tons/day) (>0.625mm)
(tons/day) tons/day
LF-25C-5-21 68.475 271.94 50.219448 5.898792304 50.219448 11.746 LF-25C-21-27.5 30.24325 294.61 24.029067 3.404354291 24.0290674 14.168 LF-25C-27.5-34.5 65.85725 303.87 53.970407 10.3701101 53.9704072 19.214 LF-25C-34.5-41.5 5/29/2001 113.9175 307.6 94.61076 0.38 0.29 70 103.48187 20.0564992 94.5017108 17.208 LF-25C-41.5-48.5 5/29/2001 122.0025 306.23 100.8741 0.37 0.29 70 108.79311 22.87174075 100.757794 18.094 LF-25C-48.5-57 5/29/2001 127.1375 299.15 102.6892 0.32 0.23 70 106.30333 19.30834141 102.570854 396.57 76.01 375.83 84.2912 459 16.264 LF-25C-57-71 45.507 277.62 34.071839 4.788938521 34.0718386 14.055 LF-39A-5-20 40.164 229.15 24.821061 1.939809066 24.8210605 7.8152 LF-39A-20-28 80.65 219.74 47.795112 4.182769401 47.7951117 8.7515 LF-39A-28-37 5/29/2001 139.99 242.19 91.54034 0.35 0.28 70 98.249498 17.48114939 91.4348237 12.903 LF-39A-37-46 5/29/2001 141.01 243.95 92.87859 0.3 0.2 70 98.919921 15.82820076 92.7715254 13.36 LF-39A-46-55 5/29/2001 104.02 244.59 68.69537 0.3 0.2 70 75.542085 8.990090469 68.6161914 9.3923 LF-39A-55-62 5/29/2001 56.195 250.38 37.98998 0.3 0.2 70 39.363483 5.143748331 37.9461906 359.87 51.62 338.56 51.618 522 17.051 LF-39A-62-77 40.758 243.79 26.797104 3.580719354 26.7971044 13.362 LF-39B-5-20 37.511 213.68 21.616928 2.076502902 21.6169276 9.6059 LF-39B-20-28 80.53 230.14 49.982514 5.243354944 49.9825137 10.49 LF-39B-28-37 136.825 246.99 91.138362 10.76676154 91.1383618 11.814 LF-39B-37-46 5/30/2001 130.4 243.29 85.65736 0.35 0.27 70 119.35422 18.19891179 85.5586358 13.034 LF-39B-46-55 5/30/2001 103.56 219 61.23503 0.3 0.2 70 66.296059 5.204830743 61.1644466 6.1644 LF-39B-55-62 5/30/2001 47.715 224.21 28.88515 0.19 0.12 70 30.242489 2.057565804 28.8518569 357.01 41.47 316.7 43.191 499 6.1033 LF-39B-62-77 34.66 230.81 21.574433 1.613182644 21.5744333 7.4773 LF-39C-5-20 38.749 210.63 22.011709 1.343593403 22.0117092 6.104 LF-39C-20-28 78.93 223.54 47.583196 3.45257233 47.5831961 7.2559 LF-39C-28-37 129.595 262.12 91.612199 12.92102691 91.612199 14.104 LF-39C-37-46 5/30/2001 133.575 228.99 82.58419 0.33 0.25 70 176.74287 20.88145184 82.489004 9.8734 LF-39C-46-55 5/30/2001 100.955 213.33 58.15008 0.25 0.19 70 63.622726 6.044044096 58.0830454 7.6705 LF-39C-55-62 5/30/2001 51.61 229.27 31.94847 0.21 0.08 70 34.768044 3.184095785 31.9116381 414.32 46.48 311.68 42.151 495 7.6923 LF-39C-62-77 36.822 202.81 20.140256 0.837884302 20.140256 4.1602

63
DRAFT
Appendix G: Method C Results

64
DRAFT
Table G-1. Method C Results 300 cfs
*** Discharge Conc Suspended d65 d35 Temp Total Load Cross Section total Location Date (cfs) (PPM) Sample (tons/day) (mm) (mm) F (tons/day) (tons/day)
LF-11A-20-32 6/8/2001 38.098 354.461539 36.419518 LF-11A-32-36.5 51.5175 443.125 61.566424 LF-11A-36.5-39.5 6/8/2001 35.7575 421.4546 40.68943 0.18 0.14 72 40.64254 LF-11A-39.5-42.5 6/8/2001 35.265 451.6923 43.00811 0.16 0.12 72 42.958536 LF-11A-42.5-45.5 6/8/2001 32.2025 411.7188 35.79761 0.18 0.14 72 35.75635 LF-11A-45.5-48 6/8/2001 26.3675 391.4084 27.86525 0.21 0.15 72 27.833126 LF-11A-48-63 6/8/2001 53.535 392.48 56.665436 301.841929 LF-11B-20-32 33.168 274.761905 24.577556 LF-11B-32-36.5 6/8/2001 46.11 296.6667 36.93411 0.19 0.15 72 36.891543 LF-11B-36.5-39.5 32.465 322 28.192538 LF-11B-39.5-42.5 32.55 290.847458 25.531666 LF-11B-42.5-45.5 6/8/2001 34.5975 256 23.91379 0.18 0.15 72 23.886228 LF-11B-45.5-48 26.8075 298.62069 21.589327 LF-11B-48-63 6/8/2001 56.41 295.076923 44.890479 205.5593374 LF-11C-20-32 35.127 245.208333 23.229464 LF-11C-32-36.5 6/8/2001 49.1125 237.6238 31.5098 0.19 0.15 72 31.473488 LF-11C-36.5-39.5 6/8/2001 35.6 203.4247 19.55318 0.19 0.15 72 19.530645 LF-11C-39.5-42.5 6/8/2001 35.2575 291.6667 27.76528 0.18 0.14 72 27.733281 LF-11C-42.5-45.5 6/8/2001 35.53 299.3985 28.7216 0.21 0.16 72 28.688492 LF-11C-45.5-48 6/8/2001 28.845 267.8911 20.86376 0.22 0.16 72 20.839712 LF-11C-48-63 6/8/2001 60.688 255.384615 41.798476 193.2935582 LF-25A-8-25 34.183 60.3603604 5.5644839 LF-25A-25-30.5 8.0585 1805.09434 39.229883 LF-25A-30.5-36 6/11/2001 41.1055 1690.455 187.6149 0.32 0.21 73 187.39864 LF-25A-36-42 56.59 1734.21687 264.67078 LF-25A-42-48 6/11/2001 60.045 1643.04 266.3721 0.35 0.28 73 266.06508 LF-25A-48-54 6/11/2001 54.32 1670 244.9289 0.3 0.19 73 244.64657 LF-25A-54-68 33.032 1687.04762 150.28828 1157.863714 LF-25B-8-25 26.159 1548.02817 109.21012 LF-25B-25-30.5 9.1135 1584.375 38.940908 LF-25B-30.5-36 6/11/2001 32.8295 1677.557 148.6981 0.26 0.15 73 148.52667 LF-25B-36-42 6/11/2001 57.92 1674.513 261.8671 0.17 0.11 73 261.5652

65
DRAFT
Table G-1. Method C Results 300 cfs
*** Discharge Conc Suspended d65 d35 Temp Total Load Cross Section total Location Date (cfs) (PPM) Sample (tons/day) (mm) (mm) F (tons/day) (tons/day)
LF-25B-42-48 6/11/2001 62.15 1599.484 268.4014 0.33 0.26 73 268.09204 LF-25B-48-54 55.425 1591.88406 237.94689 LF-25B-54-68 28.853 1560.69444 121.4428 1185.724634 LF-25C-8-25 34.744 1589.54955 148.94186 LF-25C-25-30.5 10.898 1623.63636 47.719784 LF-25C-30.5-36 6/11/2001 34.056 1538.767 141.4915 0.26 0.14 73 141.32838 LF-25C-36-42 56.975 1578 242.46789 LF-25C-42-48 6/11/2001 58.14 1517.143 238.1581 0.36 0.28 73 237.88357 LF-25C-48-54 54.41 1528.97059 224.35758 LF-25C-54-68 31.478 1575.76923 133.77121 1176.470271 LF-39A-11-29 51.6076 132.040816 18.377429 LF-39A-29-34.5 43.11 149.622642 17.395553 LF-39A-34.5-39.5 40.5525 169.090909 18.49272 LF-39A-39.5-44.5 6/9/2001 42.91 169.1667 19.59914 0.08 0.033 72 19.576556 LF-39A-44.5-49.5 6/9/2001 36.2025 184.7368 18.05743 0.24 0.17 72 18.036608 LF-39A-49.5-56 38.005 178.125 18.256962 LF-39A-56-73 37.589 184.583333 18.711825 128.8476527 LF-39B-11-29 54.871 151.803279 22.463991 LF-39B-29-34.5 6/9/2001 41.595 171.0667 19.2119 0.31 0.22 73 19.189758 LF-39B-34.5-39.5 6/9/2001 39.4975 162.0635 17.28298 0.32 0.23 73 17.263057 LF-39B-39.5-44.5 6/9/2001 39.055 151.8965 16.01726 0.1 0.064 73 15.998796 LF-39B-44.5-49.5 34.9575 157.636364 14.861398 LF-39B-49.5-56 36.385 158.627451 15.565519 LF-39B-56-73 31.026 210.2 17.5882 122.9307204 LF-39C-11-29 55.6503 163.72549 24.572351 LF-39C-29-34.5 6/9/2001 44.2025 163.0303 19.45714 0.34 0.27 72 19.43471 LF-39C-34.5-39.5 6/9/2001 42.485 168.2258 19.2971 0.32 0.22 72 19.274855 LF-39C-39.5-44.5 6/9/2001 40.08 170.1639 18.41446 0.14 0.088 72 18.393232 LF-39C-44.5-49.5 6/9/2001 34.7925 166.2069 15.61343 0.29 0.2 72 15.595438 LF-39C-49.5-56 6/9/2001 37.0205 163.8 16.37269 0.28 0.19 72 16.353815 LF-39C-56-73 32.4405 178.909091 15.652469 129.2768681

66
DRAFT
Table G-2. Method C Results 600 cfs
*** Discharge Conc Suspended d65 d35 Temp Total Load Cross Section total Location Date (cfs) (PPM) Sample (tons/day) (mm) (mm) F (tons/day) (tons/day)
LF-11A-15-34 5/27/2001 142.752 579.2308 222.99583 LF-11A-34-38 93.705 643.307087 162.57134 LF-11A-38-42 5/27/2001 91.065 715.04 175.8108 0.3 0.19 70 175.60817 LF-11A-42-46 5/27/2001 91.155 690.073 169.8397 0.19 0.15 70 169.64397 LF-11A-46-50 5/27/2001 86.61 535.7692 125.288 0.14 0.028 70 125.14361 LF-11A-50-54 56.64 555.867769 84.909764 LF-11A-54-66 59.497 538.571429 86.417415 1027.290104 LF-11B-15-34 5/27/2001 138.661 565.5555 211.49127 LF-11B-34-38 88.05 699.107143 166.01067 LF-11B-38-42 89.06 731.403509 175.67203 LF-11B-42-46 88.925 593.272727 142.27911 LF-11B-46-50 5/27/2001 83.11 586.5421 131.6183 0.175 0.135 70 131.46658 LF-11B-50-54 5/27/2001 49.96 537.5 72.420879 LF-11B-54-66 5/27/2001 57.468 505.7692 78.386515 977.7270607 LF-11C-15-34 130.848 593.469388 209.42489 LF-11C-34-38 5/27/2001 91.67 566.5455 140.2251 0.19 0.15 70 140.06348 LF-11C-38-42 5/27/2001 90.575 644.2623 157.5559 0.28 0.11 70 157.37435 LF-11C-42-46 5/27/2001 87.425 752.9293 177.7271 0.2 0.16 70 177.52223 LF-11C-46-50 75.13 579.145299 117.34479 LF-11C-50-54 46.51 499.607843 62.666939 LF-11C-54-66 5/27/2001 57.111 420.202 64.720338 929.1170227 LF-25A-5-21 72.107 266.26506 51.779101 LF-25A-21-27.5 31.8695 314.333333 27.016469 LF-25A-27.5-34.5 67.335 320.787402 58.253371 LF-25A-34.5-41.5 5/28/2001 120.76 337.9487 110.1889 0.38 0.31 70 110.06184 LF-25A-41.5-48.5 5/28/2001 126.325 325.9542 111.1756 0.34 0.27 70 111.0475 LF-25A-48.5-57 5/28/2001 127.5875 310.1987 106.8592 0.35 0.28 70 106.73602 LF-25A-57-71 40.966 274.423077 30.318456 495.212756 LF-25B-5-21 65.56 274.893617 48.603383 LF-25B-21-27.5 33.0745 305.950413 27.290232 LF-25B-27.5-34.5 61.1085 316.521739 52.163661 LF-25B-34.5-41.5 5/28/2001 116.9525 332.5714 105.0167 0.35 0.29 70 104.89561

67
DRAFT
Table G-2. Method C Results 600 cfs
*** Discharge Conc Suspended d65 d35 Temp Total Load Cross Section total Location Date (cfs) (PPM) Sample (tons/day) (mm) (mm) F (tons/day) (tons/day)
LF-25B-41.5-48.5 5/28/2001 118.92 307.013 98.57696 0.36 0.3 70 98.463339 LF-25B-48.5-57 5/28/2001 129.4675 311.5714 108.9136 0.33 0.26 70 108.78806 LF-25B-57-71 40.906 302.300885 33.3495 473.5537843 LF-25C-5-21 68.475 271.942446 50.219448 LF-25C-21-27.5 30.24325 294.608696 24.029067 LF-25C-27.5-34.5 65.85725 303.870968 53.970407 LF-25C-34.5-41.5 5/29/2001 113.9175 307.6 94.61076 0.38 0.29 70 94.501711 LF-25C-41.5-48.5 5/29/2001 122.0025 306.2295 100.8741 0.37 0.29 70 100.75779 LF-25C-48.5-57 5/29/2001 127.1375 299.1489 102.6892 0.32 0.23 70 102.57085 LF-25C-57-71 45.507 277.622378 34.071839 460.1211199 LF-39A-5-20 40.164 229.150327 24.821061 LF-39A-20-28 80.65 219.74359 47.795112 LF-39A-28-37 5/29/2001 139.99 242.1875 91.54034 0.35 0.28 70 91.434824 LF-39A-37-46 5/29/2001 141.01 243.9506 92.87859 0.3 0.2 70 92.771525 LF-39A-46-55 5/29/2001 104.02 244.5946 68.69537 0.3 0.2 70 68.616191 LF-39A-55-62 5/29/2001 56.195 250.3846 37.98998 0.3 0.2 70 37.946191 LF-39A-62-77 40.758 243.787879 26.797104 390.1820077 LF-39B-5-20 37.511 213.684211 21.616928 LF-39B-20-28 80.53 230.142857 49.982514 LF-39B-28-37 136.825 246.986301 91.138362 LF-39B-37-46 5/30/2001 130.4 243.2895 85.65736 0.35 0.27 70 85.558636 LF-39B-46-55 5/30/2001 103.56 219 61.23503 0.3 0.2 70 61.164447 LF-39B-55-62 5/30/2001 47.715 224.2105 28.88515 0.19 0.12 70 28.851857 LF-39B-62-77 34.66 230.806452 21.574433 359.8871758 LF-39C-5-20 38.749 210.634921 22.011709 LF-39C-20-28 78.93 223.536585 47.583196 LF-39C-28-37 129.595 262.121212 91.612199 LF-39C-37-46 5/30/2001 133.575 228.9855 82.58419 0.33 0.25 70 82.489004 LF-39C-46-55 5/30/2001 100.955 213.3333 58.15008 0.25 0.19 70 58.083045 LF-39C-55-62 5/30/2001 51.61 229.2727 31.94847 0.21 0.08 70 31.911638 LF-39C-62-77 36.822 202.8125 20.140256 353.8310478

68
DRAFT
Appendix H: Ratio of Sand Load to Wash Load

69
DRAFT
Table H-1. Ratio of Sand Load to Wash Load 300 cfs
CR-Sec Date Method Q (cfs) Total Load
(Ton/day)
Sand Load
(Ton/day)
Wash Load
(Ton/Day)
Ratio sand/ wash
LF-11A 6/8/2001 Method D 280.2 351 147 204 0.72LF-11B 6/8/2001 Method D 272.7 212 80 133 0.60LF-11C 6/8/2001 Method D 262.1 179 57 122 0.46LF-25A 6/11/2001 Method D 280.7 1238 18 1220 0.01LF-25B 6/11/2001 Method D 272.4 907 84 823 0.10LF-25C 6/11/2001 Method D 287.3 1254 15 1239 0.01LF-39A 6/9/2001 Method D 286.7 189 30 159 0.19LF-39B 6/9/2001 Method D 277.4 154 29 125 0.23LF-39C 6/9/2001 Method D 290.0 179 38 142 0.27LF-11A 6/8/2001 Method B--Mobile Bed 181.1 240 114 126 0.91LF-11B 6/8/2001 Method B--Mobile Bed 172.5 146 56 90 0.62LF-11C 6/8/2001 Method B--Mobile Bed 184.3 157 61 96 0.64LF-25A 6/11/2001 Method B--Mobile Bed 220.1 1128 34 1094 0.03LF-25B 6/11/2001 Method B--Mobile Bed 217.4 1081 55 1026 0.05LF-25C 6/11/2001 Method B--Mobile Bed 214.5 949 54 895 0.06LF-39A 6/9/2001 Method B--Mobile Bed 200.8 117 7 110 0.06LF-39B 6/9/2001 Method B--Mobile Bed 191.5 98 15 83 0.18LF-39C 6/9/2001 Method B--Mobile Bed 198.6 123 14 109 0.13LF-11A 6/8/2001 Method A 280.2 352 152 199 0.77LF-11B 6/8/2001 Method A 272.7 220 84 136 0.61LF-11C 6/8/2001 Method A 262.1 229 85 144 0.59LF-25A 6/11/2001 Method A 280.7 1284 58 1226 0.05LF-25B 6/11/2001 Method A 272.4 1312 134 1177 0.11LF-25C 6/11/2001 Method A 287.3 1232 92 1140 0.08LF-39A 6/9/2001 Method A 286.7 154 15 139 0.11LF-39B 6/9/2001 Method A 277.4 138 16 123 0.13LF-39C 6/9/2001 Method A 290.0 163 15 148 0.10

70
DRAFT
Table H-2. Ratio of Sand Load to Wash Load 600 cfs
CR-Sec Date Method Q (cfs)
Total Load
(Ton/day)
Sand Load
(Ton/day)
Wash Load
(Ton/Day)
Ratio sand/ wash
LF-11A 5/27/2001 Method D 621 1424 578 846 0.68LF-11B 5/27/2001 Method D 595.2 926 323 602 0.54LF-11C 5/27/2001 Method D 579.3 1228 512 715 0.72LF-25A 5/28/2001 Method D 587 509 73 435 0.17LF-25B 5/28/2001 Method D 566 474 65 409 0.16LF-25C 5/29/2001 Method D 573 528 86 443 0.19LF-39A 5/29/2001 Method D 603 431 54 377 0.14LF-39B 5/30/2001 Method D 571 398 41 357 0.12LF-39C 5/30/2001 Method D 570 377 34 343 0.10LF-11A 5/27/2001 Method B--Mobile Bed 362.5 722 327 396 0.83LF-11B 5/27/2001 Method B--Mobile Bed 349.1 617 280 337 0.83LF-11C 5/27/2001 Method B--Mobile Bed 344.8 667 323 343 0.94LF-25A 5/28/2001 Method B--Mobile Bed 473.9 432 76 356 0.21LF-25B 5/28/2001 Method B--Mobile Bed 459.5 416 73 343 0.21LF-25C 5/29/2001 Method B--Mobile Bed 459.2 397 76 321 0.24LF-39A 5/29/2001 Method B--Mobile Bed 521.9 360 52 308 0.17LF-39B 5/30/2001 Method B--Mobile Bed 499.0 357 41 316 0.13LF-39C 5/30/2001 Method B--Mobile Bed 494.7 414 46 368 0.13LF-11A 5/27/2001 Method A 621 1123 465 658 0.71LF-11B 5/27/2001 Method A 595.2 1036 419 617 0.68LF-11C 5/27/2001 Method A 579.3 1012 450 562 0.80LF-25A 5/28/2001 Method A 587 514 84 431 0.19LF-25B 5/28/2001 Method A 566 498 82 416 0.20LF-25C 5/29/2001 Method A 573 481 87 394 0.22LF-39A 5/29/2001 Method A 603 411 57 354 0.16LF-39B 5/30/2001 Method A 571 400 45 355 0.13LF-39C 5/30/2001 Method A 570 456 49 408 0.12

71
DRAFT
Appendix I: LFCC Maps

72
DRAFT

73
DRAFT