idaho department of fish and game - home - research site
TRANSCRIPT

i
IDAHO DEPARTMENT OF FISH AND GAME FISHERY MANAGEMENT ANNUAL REPORT
Virgil K. Moore, Director
SOUTHWEST REGION
2009
Arthur E. Butts, Regional Fishery Biologist Joseph R. Kozfkay, Regional Fishery Biologist
Chris Sullivan, Fishery Technician Jeffrey C. Dillon, Regional Fishery Manager
April 2011
IDFG #11-108

i
2009 Southwest Region (Nampa) Annual Fishery Management Report
Table of Contents Page
Lowland Lake Surveys
ABSTRACT ........................................................................................................................... 1Arrowrock Reservoir Lowland Lake Survey
INTRODUCTION .................................................................................................................. 2
METHODS ............................................................................................................................ 2 RESULTS ............................................................................................................................. 3
DISCUSSION........................................................................................................................ 4 MANAGEMENT RECOMMENDATIONS ............................................................................... 5 Tables ............................................................................................................................. 6 Figures ............................................................................................................................ 9 C.J. Strike Reservoir Lowland Lake Survey ABSTRACT ......................................................................................................................... 14 INTRODUCTION ................................................................................................................ 15 METHODS .......................................................................................................................... 15 RESULTS ........................................................................................................................... 16 DISCUSSION...................................................................................................................... 17 MANAGEMENT RECOMMENDATIONS ............................................................................. 18 Tables ........................................................................................................................... 19 Figures .......................................................................................................................... 24 Deadwood Reservoir Kokanee Population Monitoring ABSTRACT ......................................................................................................................... 27 INTRODUCTION ................................................................................................................ 28 METHODS .......................................................................................................................... 29 Mid-Water Trawling ....................................................................................................... 29 Hydroacoustics .............................................................................................................. 29 Kokanee Escapement ................................................................................................... 31 RESULTS ........................................................................................................................... 31 Mid-Water Trawling ....................................................................................................... 31 Hydroacoustics .............................................................................................................. 31 Kokanee Escapement ................................................................................................... 32 DISCUSSION...................................................................................................................... 32 MANAGEMENT RECOMMENDATIONS ............................................................................. 34 Tables ........................................................................................................................... 35 Figures .......................................................................................................................... 37 Assessment of Larval Fish Production in Lake Lowell ABSTRACT ......................................................................................................................... 43 INTRODUCTION ................................................................................................................ 44 OBJECTIVES ..................................................................................................................... 44 METHODS .......................................................................................................................... 44 RESULTS ........................................................................................................................... 45

ii
Table of Contents (cont.) Page
DISCUSSION...................................................................................................................... 45 MANAGEMENT RECOMMENDATIONS ............................................................................. 46 Tables ........................................................................................................................... 47 Figures .......................................................................................................................... 50 Lucky Peak Reservoir Lowland Lake Survey ABSTRACT ......................................................................................................................... 54 INTRODUCTION ................................................................................................................ 55 METHODS .......................................................................................................................... 55 RESULTS ........................................................................................................................... 56 DISCUSSION...................................................................................................................... 57 MANAGEMENT RECOMMENDATIONS ............................................................................. 58 Tables ........................................................................................................................... 59 Figures .......................................................................................................................... 62 High Mountain Lakes Surveys ABSTRACT ......................................................................................................................... 66 OBJECTIVES ..................................................................................................................... 67 METHODS .......................................................................................................................... 67 RESULTS AND DISCUSSION ............................................................................................ 68 Browns Lake ................................................................................................................. 68 Diamond Lake ............................................................................................................... 68 Glacier Lake .................................................................................................................. 69 Hippy Lake .................................................................................................................... 69 Island Lake .................................................................................................................... 70 Johnson Lake ................................................................................................................ 70 Little Scenic Lake .......................................................................................................... 70 Scenic Lake .................................................................................................................. 71 Snowbank Lake ............................................................................................................. 71 The Hole Lake ............................................................................................................... 71 Triangle Lake ................................................................................................................ 72 Unnamed Lakes ............................................................................................................ 72 Queen’s River Lakes (QRL) .......................................................................................... 73 Johnson Creek Ponds (JCP) ......................................................................................... 73 MANAGEMENT RECOMMENDATIONS ............................................................................. 73 Tables ........................................................................................................................... 74 Figures .......................................................................................................................... 80 Urban Pond Limnological Evaluations ABSTRACT ......................................................................................................................... 82 INTRODUCTION ................................................................................................................ 83 METHODS .......................................................................................................................... 83 RESULTS AND DISCUSSION ............................................................................................ 84 Tables ........................................................................................................................... 86 Figures .......................................................................................................................... 88

iii
Table of Contents (cont.) Page
River and Stream Investigations
Lower Payette River Fish Population Surveys ABSTRACT ......................................................................................................................... 90 INTRODUCTION ................................................................................................................ 91 OBJECTIVES ..................................................................................................................... 91 METHODS .......................................................................................................................... 91 RESULTS ........................................................................................................................... 92 DISCUSSION...................................................................................................................... 93 MANAGEMENT RECOMMENDATIONS ............................................................................. 94 Tables ........................................................................................................................... 95 Figures .......................................................................................................................... 97
Long-term Monitoring of Redband Trout Populations in Desert Basins of the
Bruneau, Owyhee, and Snake River Drainages in Southwestern Idaho ABSTRACT ....................................................................................................................... 100 INTRODUCTION .............................................................................................................. 101 METHODS ........................................................................................................................ 101 RESULTS ......................................................................................................................... 102 DISCUSSION.................................................................................................................... 102 Tables ......................................................................................................................... 103 Figure .......................................................................................................................... 104 South Fork Boise River Electrofishing Survey ABSTRACT ....................................................................................................................... 105 INTRODUCTION .............................................................................................................. 106 METHODS ........................................................................................................................ 106 Fry Monitoring ............................................................................................................. 107 RESULTS AND DISCUSSION .......................................................................................... 108 Fry Monitoring ............................................................................................................. 109 MANAGEMENT RECOMMENDATIONS ........................................................................... 109 Figures ........................................................................................................................ 110 Upper Middle Fork Salmon River Chinook Salmon Redd Counts ABSTRACT ....................................................................................................................... 116 INTRODUCTION .............................................................................................................. 117 OBJECTIVES ................................................................................................................... 117 METHODS ........................................................................................................................ 117 RESULTS AND DISCUSSION .......................................................................................... 118 MANAGEMENT RECOMMENDATIONS ........................................................................... 118 Figures ........................................................................................................................ 119 Bruneau River Sloped-Velocity Barrier and Diversion Dam Re-build ABSTRACT ....................................................................................................................... 125 METHODS AND RESULTS .............................................................................................. 126 ACKNOWLEDGEMENTS ................................................................................................. 126 Figures ........................................................................................................................ 127 LITERATURE CITED ........................................................................................................ 129

1
2009 Southwest Region (Nampa) Annual Fishery Management Report
Lowland Lake Surveys
ARROWROCK RESERVOIR LOWLAND LAKE SURVEY
ABSTRACT
A total of 951 fish were captured during the standard lowland lake survey at Arrowrock Reservoir on June 22-25, 2009. Catch was predominately northern pikeminnow Ptychocheilus oregonensis (n = 475) and largescale suckers Catostomus macrocheilius (n = 240). A total of 171 smallmouth bass Micropterus dolomieu, 18 rainbow trout Oncorhynchus mykiss, 2 kokanee O. nerka, and 2 bull trout Salvelinus confluentas were also captured. Remaining fish species sampled included bridgelip suckers C. columbianus, chiselmouth Acrocheilus alutaceus, redside shiner Richardsonius balteatus, and yellow perch Perca flavescens. CPUE and WPUE indices for combined species were 221 and 58, respectively. Despite stocking over one million rainbow trout since 2004, rainbow trout contributed <1% of the total biomass collected at Arrowrock Reservoir. Due to abundant predators and severe drawdown in the fall, currently no good alternative exists for stocking fingerlings in Arrowrock Reservoir, except perhaps addressing the predator abundance within the reservoir. Stocking catchable-sized rainbow trout (150 - 330 mm) is clearly the best alternative for Arrowrock Reservoir at this point. Author: Art Butts Regional Fishery Biologist

2
INTRODUCTION
Arrockrock Reservoir is a 3,150 ha, dendritic impoundment located approximately 32 km northeast of Boise, Idaho in the upper Boise River drainage (Figure 1). It is a 29 km-long, narrow canyon reservoir that impounds two major tributaries; the Middle Fork Boise River (MFBR) and South Fork Boise River (SFBR). Arrowrock Dam, operated by the U.S. Bureau of Reclamation (BOR), sits directly upstream of Lucky Peak Reservoir. Due to its close proximity to Boise, the reservoir is a popular recreational area for boaters and anglers. The reservoir provides a sport fishery that includes rainbow trout, kokanee, and smallmouth bass. An adfluvial population of bull trout also resides in Arrowrock Reservoir. According to historic Idaho Department of Fish and Game (IDFG) gill netting surveys, the fishery is dominated by two nongame species; northern pikeminnow and largescale sucker. In addition, yellow perch, bridgelip sucker, chiselmouth, and redside shiner have also been observed frequently in the reservoir.
During fall 2003, Arrowrock Reservoir was drafted to approximately 1% of capacity for dam repairs. During this period, much of the reservoir was reduced to a river channel which meandered through a number of kilometers of mud flats and the majority of resident fish were either entrained into Lucky Peak Reservoir, resided in the river channels in areas normally inundated by the reservoir, or moved up into the Middle Fork and South Fork Boise rivers. Data collected by the BOR on bull trout suggest that fish residing in the channel located within the reservoir boundary experienced high levels of mortality from predation (due to lack of cover) and being buried by collapsing banks (Salow 2005). In 2004, after the reservoir had re-filled the following spring, IDFG stocked a total of 151,935 catchable rainbow trout (> 152 mm), 331,019 fingerling rainbow trout (76 - 152 mm), and 77,025 fingerling kokanee (76 - 152 mm; Table 1). During 2004-2008, IDFG has stocked Arrowrock Reservoir with 220,525 catchable, 733,539 fingerling, and 250,320 fry-sized rainbow trout. In addition, 147,025 fingerling kokanee have been stocked into the reservoir as well. Despite stocking a large number of rainbow trout and kokanee, IDFG regional fishery personnel field complaints every summer regarding poor catch rates of rainbow trout, in particular. Many anglers also reported catching only northern pikeminnow during fishing trips. Therefore, IDFG southwest regional fishery personnel conducted a standard lowland lake fisheries survey during June 22 - 25, 2009.
METHODS
Fish populations in Arrowrock Reservoir were sampled with standard IDFG lowland lake
sampling gears during June 22 - 25, 2009. Arrowrock Reservoir was divided into three sections, (main reservoir, SFBR arm, and MFBR arm) for sampling to determine if spatial differences in species assemblages existed within the reservoir. Sampling gear included: (1) paired gill nets, (2) trap nets, and (3) night electrofishing. Paired gill net sets included floating and sinking monofilament nets, 46 m x 2 m, with six panels composed of 19, 25, 32, 38, 51, and 64-mm bar mesh. One floating and one sinking net, fished for one night, equaled one unit of gill net effort. Trap nets possessed 15-m leads, 1-m x 2-m frames, crowfoot throats on the first and third of five loops, 19-mm bar mesh, and had been treated with black tar. One trap net fished for one night equaled one unit of trap net effort. For boat electrofishing effort, pulsed direct current was produced by a 5,000-watt generator. Frequency was set at 120 pulses per second and a pulse

3
width of 40, which yielded an output of 5 - 6 amps. One hour of active on-time electrofishing equaled one unit of effort. In total, eight trap nets, eight gill net pairs, and one electrofishing unit, (three 1,200 second sub-samples) were utilized during 2009.
Captured fish were identified to species, measured for total length (± 1 mm), and
weighed (±1g for fish under 5,000 g or ± 10 g for fish greater than 5,000 g) with a digital scale. In the event that weight was not collected, length-weight relationships were built from fish weighed and measured in 2009 which allowed us to estimate weights of un-weighed fish. Furthermore, for those fish not weighed or measured, average weights were used to calculate biomass estimates. Relative weight (Wr) was calculated as an index of general body condition for selected species, where a value of 100 is considered average (Anderson and Neumann 1996). Values greater than 100 describe robust body condition, whereas values less that 80 indicate suboptimal body condition and suggest less than ideal foraging conditions. Standard weight values for estimation of Wr were obtained for lentic rainbow trout (Simpkins and Hubert 1996) and northern pikeminnow (Parker et al. 1995). Catch data were summarized as the number of fish caught per unit of effort (CPUE) and the weight in kg caught per unit effort (WPUE). These indices were calculated by standardizing the catch of each gear type to one unit of effort and then summing across the three gear types.
RESULTS
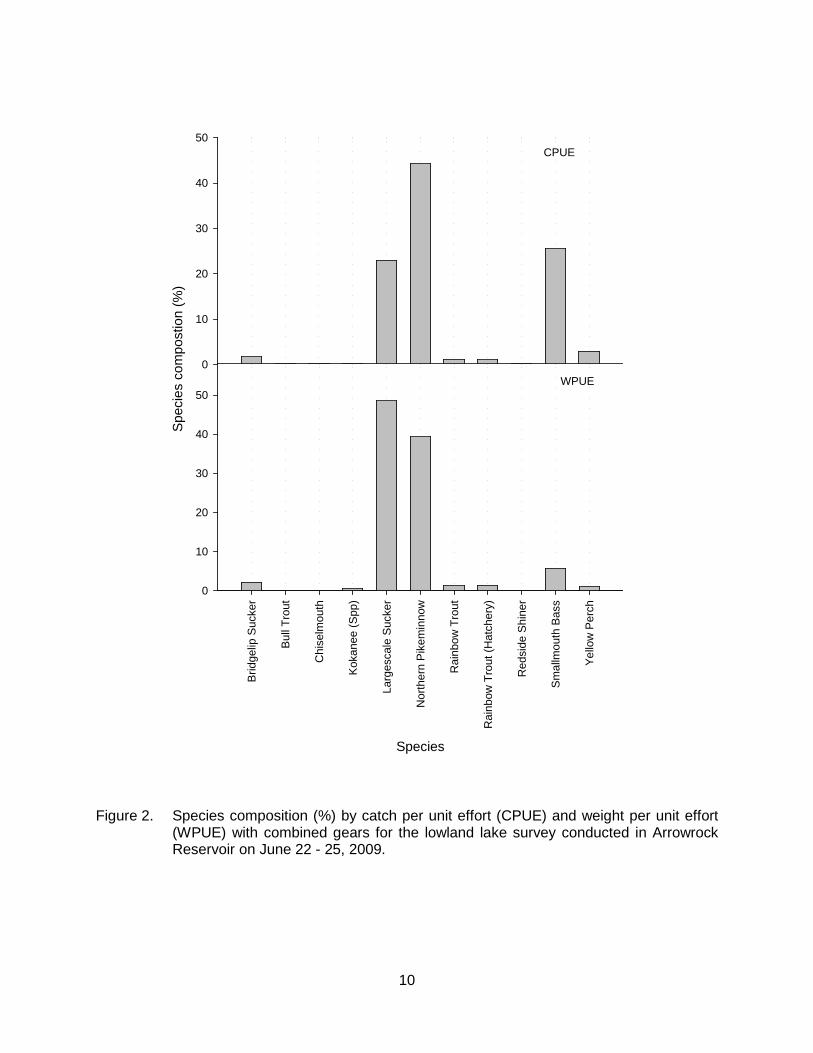
A total of 951 fish were captured during the standard lowland lake survey (Table 2). Catch was predominantly northern pikeminnow (n = 475) and largescale suckers (n = 240). A total of 171 smallmouth bass, 18 rainbow trout, 2 kokanee, and 2 bull trout were also captured. Remaining fish species sampled included bridgelip suckers, chiselmouth, redside shiner, and yellow perch. CPUE and WPUE indices for combined species were 221 and 58, respectively (Table 2 and 3). Electrofishing was the most effective gear type with a total CPUE of 163.3, followed by gill nets (CPUE = 55.1). Based on CPUE, northern pikeminnow made up 44% of the total catch, followed by smallmouth bass (25%), largescale sucker (23%) and yellow perch (3%) Rainbow trout (wild and hatchery combined) contributed only 2% of total catch, while all other species captured were <1% of total catch (Figure 2). Based on WPUE, the fish community consisted of largescale sucker (48%), northern pikeminnow (39%), smallmouth bass (6%), and bridgelip sucker (2%). Remaining species represented less than 1% of the total biomass, individually, and less than 5% of the total biomass (Figure 2). A total of 10 wild and 8 hatchery rainbow trout were captured during the survey. Wild rainbow trout had a total CPUE of 2.5 and a WPUE of 0.7 while hatchery rainbow trout CPUE was 2.3 and WPUE was 0.8 kg (Tables 2 and 3). Overall, rainbow trout were sampled with a CPUE of 4.7 and WPUE of 1.5 kg. Near shore electrofishing was most effective for sampling rainbow trout (n = 12) followed by gill nets (n = 6). Wild rainbow trout ranged between 120 and 370 mm while hatchery trout measured between 220 and 400 mm (Figure 3). Mean relative weight for fish over 120 mm (n = 16) was 81.2, indicating below average body condition and that resources may be limited within Arrowrock Reservoir. Northern pikeminnow were the most abundant fish sampled with 475 fish captured. Northern pikeminnow were captured with a total CPUE of 98 fish and a WPUE of 22.6 kg (Tables 2 and 3). Electrofishing yielded the highest CPUE (61 fish/h) of the individual capture methods followed by gill nets with a CPUE of 35.5 fish/night. Northern pikeminnow ranged between 150 and 540 mm, however 91% of fish were between 280 and 350 mm and likely belong to a single year class (Figure 4). Mean relative weight of fish over 250 mm was 74.2,

4
indicating poor body condition and limited foraging conditions. However, fish were captured post-spawn and may instead reflect normal body conditions after spawning. Largescale sucker were the second most common fish sampled (240 fish) with an overall CPUE of 51 fish (Table 2). However, largescale suckers made up the majority of biomass (48%) and had the highest WPUE of 28 kg (Table 3). In terms of sampling gear, electrofishing had a CPUE of 33 fish/hr followed by 16.6 fish/night captured by gill nets. Largescale suckers ranged from 50 to 590 mm with 97% of fish > 300 mm (Figure 4). Smallmouth bass were the third most abundant fish species at Arrowrock with 171 fish captured by combined gear types. Fish were primarily collected using electrofishing (98%) and CPUE for that gear was 56 fish/h. Overall CPUE was 56.4 fish but WPUE was 3.3 kg (Table 2 and 3). Smallmouth bass ranged from 50 to 470 mm but 61% of fish were < 110 mm (Figure 3). Previous lowland lake surveys of Arrowrock Reservoir have only partially followed the standardized guidelines sampling procedures and gear. Therefore it is difficult to assess the changes in fish populations over time. Curtain gill-net sets utilized (during hydroacoustic assessment; Butts et al. 2004) prior to the reservoir draining, on July 8, 2003 allow comparison of pre-draw down and post-draw down fish populations. Species proportions from 2003 gill-netting efforts revealed that the community was dominated by largescale suckers (61%) and northern pikeminnow (26%) for a combined 87% of the entire catch (Figure 5). The remaining catch was made up of approximately 8% kokanee, 3% rainbow trout, and 1% of smallmouth bass and chiselmouth chub.
DISCUSSION The low capture rates of rainbow trout corroborate angler reports of low catch rates, particularly in the summer. Although over one million rainbow trout have been stocked since 2004, they contributed <1% of the total biomass collected at Arrowrock Reservoir in June 2009. Conversely, 88% of the total biomass was comprised of largescale suckers (48%) and northern pikeminnow (39%). In terms of biomass, smallmouth bass was the only sportfish of note as they contributed 6% of the biomass. However, 61% of collected fish were <110 mm and only 2% of the smallmouth bass captured exceeded 300 mm. It is assumed that the fish community at Arrowrock Reservoir underwent pronounced changes due to the draining event that occurred in 2004. During this event, the reservoir pool was reduced to <1% capacity and significant mortality to the population is believed to have occurred. However, relative abundance of fish species in Arrowrock Reservoir prior to draining in 2003 (Butts 2004), was quite similar to our 2009 sample. Nearly 90% of the fish captured during both sampling periods were largescale suckers and northern pikeminnow with rainbow trout and kokanee making up <5% of the catch. The 2009 lowland lake survey at Arrowrock Reservoir suggests that the current rainbow trout stocking program has not been successful, particularly in terms of fingerling fish. Rainbow trout were caught at low rates and hatchery fish made up <1% of total catch, despite the high numbers that have been stocked into the reservoir over the past five years. Because 78% of the fish that were stocked were spring fingerlings (61%; 125 - 175 mm) or fry (21%; 0 - 75 mm) it can be assumed that the low abundance is a result of poor survival of stocked fish.
Two major sources of mortality for smaller stocked fish are predation by larger piscivore predators or indirect results of an inability to quickly adapt to a reservoir environment. The latter
5
includes starvation, either from not switching over to natural food or low availability of food resources in general. Currently, Arrowrock Reservoir is stocked with spring fingerlings. Spring fingerlings require greater zooplankton and invertebrate abundance but increases the risk of predation as generally fingerlings are smaller and thus more susceptible. Spring fingerling returns in Idaho reservoirs were lowest in waters with complex communities and abundant predators, both of which characterize Arrowrock Reservoir (Dillon and Alexander 1995). The 2009 lowland lake survey at Arrowrock Reservoir revealed a strong year class of northern pikeminnow between 280 and 350 mm that likely exerts substantial predatory pressure upon stocked fingerling trout. Examination of fish/pound of fingerlings stocked into the reservoir revealed that fish were approximately 50 - 75 mm in length and thus quite susceptible to predation by northern pikeminnow in the reservoir.
Conversely, fall stocking of fingerling rainbow trout into Arrowrock Reservoir does not
appear to be a better alternative. Although fall fingerlings were likely less susceptible to predation because of their size, Dillon and Alexander (1995) found evidence that fall fingerling success was likely related to fall water levels and availability of large zooplankton. Extreme drawdowns of Arrowrock Reservoir are common through the summer and fall and the zooplankton community and size structure are likely heavily impacted by this regime. Therefore no good alternative exists for stocking fingerlings in Arrowrock Reservoir, except perhaps addressing the predator abundance within the reservoir.
Stocking catchable-sized rainbow trout (150 - 330 mm) is clearly the best alternative for
Arrowrock Reservoir at this point. However, the availability of catchable sized fish is limited within the hatchery system as they are more expensive to produce and the demand within the state is high. Therefore switching over to a strictly catchable stocking program on a large reservoir like Arrowrock Reservoir is unrealistic.
MANAGEMENT RECOMMENDATIONS
1. Stock catchable rainbow trout in spring and fall whenever available.
2. Seek opportunities to decrease predator impacts on IDFG stocking program in Arrowrock Reservoir.
3. Evaluate limnological conditions prior to future spring fingerling stockings to evaluate zooplankton abundance and size structure.

6
Table 1. Numbers and size of rainbow trout and kokanee stocked into Arrowrock Reservoir by IDFG between 2004 and 2008.
Species 2004 2005 2006 2007 2008 Total
Rainbow trout Catchable (200-250 mm) 151,935 15,500 14,040 - 39,050 220,525
Fingerling (125-175 mm) 331,019 163,170 58,630 180,720 - 733,539 Fry (0-75 mm) - - 91,440 - 158,880 250,320
Total 482,954 178,670 164,110 180,720 197,930 1,204,384
Kokanee Fingerling (125-175 mm) 77,025 - 70,000 - - 147,025

7
Table 2. Catch and catch per unit effort (CPUE) statistics by species and gear type for the lowland lake survey conducted in Arrowrock Reservoir on June 22-25, 2009.
Electrofish
Catch Electrofish
CPUE Gill Net Catch
Gill Net CPUE
Trap Net Catch
Trap Net CPUE
Total Catch
Total CPUE
Bridgelip Sucker
11 4
11 4 Bull Trout
2 0.3
2 0.3
Chiselmouth
2 0.3
2 0.3 Kokanee (Spp)
2 0.3
2 0.3
Largescale Sucker
100 33 133 16.6 7 0.9 240 51 Northern Pikeminnow
184 61 284 35.5 7 0.9 475 98
Rainbow Trout (Wild)
6 2 4 0.5
10 2.5 Rainbow Trout (Hatchery)
6 2 2 0.3
8 2.3
Redside Shiner
1 0.3
1 0.3 Smallmouth Bass
168 56 3 0.4
171 56.4
Yellow Perch
14 5 9 1.1 6 0.8 29 6.5 Total 490 163.3 441 55.1 20 2.5 951 221

8
Table 3. Total biomass (kg) and weight per unit effort (WPUE) statistics by species and gear type for the lowland lake survey conducted in Arrowrock Reservoir on June 22-25, 2009.
Electrofish
Weight Electrofish
WPUE Gill Net Weight
Gill Net WPUE
Trap Net Weight
Trap Net WPUE
Total Weight
Total WPUE
Bridgelip Sucker
3.8 1.3
4 1.3 Bull Trout
0.1
0.1
Chiselmouth
0.4 0.1
0.4 0.1 Kokanee (Spp)
2.4 0.3
2.4 0.3
Largescale Sucker
68 22.6 37 4.6 6 0.7 110.5 28 Northern Pikeminnow
48.5 16.2 50 6.2 2 0.2 100.3 22.6
Rainbow Trout (Wild)
1.6 0.5 1.6 0.2
3.2 0.7 Rainbow Trout (Hatchery)
1.9 0.6 1.1 0.1
3.0 0.8
Redside Shiner Smallmouth Bass
8.7 3 3.2 0.4
12 3.3 Yellow Perch
0.7 0.2 1.7 0.2 1.2 0.2 3.6 0.6
Total 133 44 97 12 9 1 239 58

9
Figure 1. Map of Arrowrock Reservoir, Idaho showing gill netting, trap netting, and electroshocking transect locations during the 2009 lowland lake survey. The reservoir was stratified into 3 sections, the Middle Fork Boise River (MFBR) arm, the South Fork Boise River (SFBR) arm, and the main pool below the confluence of both arms.
10
0
10
20
30
40
50
Species
Brid
gelip
Suc
ker
Bul
l Tro
ut
Chi
selm
outh
Kok
anee
(Spp
)
Larg
esca
le S
ucke
r
Nor
ther
n P
ikem
inno
w
Rai
nbow
Tro
ut
Rai
nbow
Tro
ut (H
atch
ery)
Red
side
Shi
ner
Sm
allm
outh
Bas
s
Yello
w P
erch
Spec
ies
com
post
ion
(%)
0
10
20
30
40
50
CPUE
WPUE
Figure 2. Species composition (%) by catch per unit effort (CPUE) and weight per unit effort (WPUE) with combined gears for the lowland lake survey conducted in Arrowrock Reservoir on June 22 - 25, 2009.

11
X Data
0
20
40
60
80
100
0
20
40
60
80
100
X Data
Freq
uenc
y (%
)
0
10
20
30
40
50Rainbow trout (wild) n=10Rainbow trout (hatchery) n=8
X Data
0
5
10
15
Total length (mm)
0 100 200 300 400 500 6000
5
10
15
Bull troutn=2
Kokaneen=2
Smallmouth bassn= 171
Yellow perchn=29
Figure 3. Length frequency and sample size of bull trout, kokanee, hatchery and wild rainbow trout, smallmouth bass, and yellow perch collected during the lowland lake survey of Arrowrock Reservoir on June 22 - 25, 2009.

12
X Data
0
5
10
15
20
X Data
Freq
uenc
y (%
)
0
10
20
30
40
50
X Data
0
2
4
6
8
10
12
14
Total length (mm)
0 100 200 300 400 500 6000
10
20
30
Bridgelip suckern=11
Chiselmouthn=2
Largescale suckern=240
Northern pikeminnown=475
Figure 4. Length frequency and sample size of bridgelip sucker, chiselmouth, largescale sucker, and northern pikeminnow collected during the lowland lake survey of Arrowrock Reservoir on June 22 - 25, 2009.

13
Species
Chi
selm
outh
Kok
anee
Larg
esca
le s
ucke
r
Nor
ther
n pi
kem
inno
w
Rai
nbow
trou
t
Sm
allm
outh
Bas
s
Spec
ies
com
posi
tion
(%)
0
10
20
30
40
50
60
70
Figure 5. Species composition as determined by eight net curtains during a hydroacoustic survey conducted in Arrowrock Reservoir on July 8, 2003, prior to the reservoir draining later that fall.

14
C.J. STRIKE RESERVOIR LOWLAND LAKE SURVEY
ABSTRACT
We sampled fish populations in C.J. Strike Reservoir using standard IDFG lowland lake
sampling gears and protocols from May 19 to 22, 2009 to monitor game and non-game fish populations. During 2009, we collected 3,629 fish with three gear types. Catch-per-unit-effort (CPUE) and weight-per-unit-effort (WPUE) effort indices were 691 and 199, respectively. Based on CPUE, black crappie Pomoxis nigromaculatus was the most abundant fish sampled and comprised over 59% of the fish community. Smallmouth bass (19%) and largescale sucker (6%) were the two next most abundant species numerically, whereas other species represented less than 4% of the total. Based on WPUE, the fish community consisted of black crappie (38%), largescale sucker (25%), as well as common carp Cyprinus carpio and smallmouth bass (10% each of the total). Despite reaching record high abundance, black crappie remain in above average body condition. Author: Joe Kozfkay Regional Fishery Biologist

15
INTRODUCTION
C.J. Strike Reservoir is a 3,035-ha impoundment located 10 km east of Grandview, Idaho. The earthen dam, built by Idaho Power Company (IPC) in the early 1950s, impounds water from the Snake and Bruneau rivers. Surface elevation of the reservoir is relatively stable (749 m), due to water management and power production strategies (block loading). The reservoir possesses diverse aquatic habitats due to its varied tributary inputs and underling topography. The Bruneau Arm is supplied by the Bruneau River and is relatively shallow, warm, turbid, and has a lower turnover rate leading to higher primary and secondary productivity. The Snake Arm is generally deeper (up to 35 m near the dam), clearer, and has a higher turnover rate. Much of the lands surrounding the reservoir are owned by IDFG, BOR, or IPC and are publicly accessible.
C.J. Strike Reservoir is one of the most popular waters among anglers in southwest Idaho. Panfish, rainbow trout, and smallmouth bass receive the majority of the fishing pressure. Panfish fisheries (black crappie, bluegill Lepomis macrochirus, white crappie Pomoxis annularis and yellow perch are popular; especially in years when crappie populations reach high abundances. Rainbow trout are targeted mostly during the cold water periods near the dam. Recently, IPC and IDFG have stocked 80,000 catchable and 200,000 fingerling rainbow trout, respectively, on an annual basis. This increased and more stable stocking strategy has produced a more consistent trout fishery that is popular among anglers. White sturgeon Acipenser transmontanus and channel catfish Ictalurus punctatus also are targeted by a small portion of anglers. C.J. Strike Reservoir is managed under general regulations, including a 305-mm minimum length and six fish bag limit for bass, six fish bag limit for trout, mandatory catch and release for white sturgeon, and no size or bag limits on all other species.
METHODS
Fish populations in C.J. Strike Reservoir were sampled with standard IDFG lowland lake
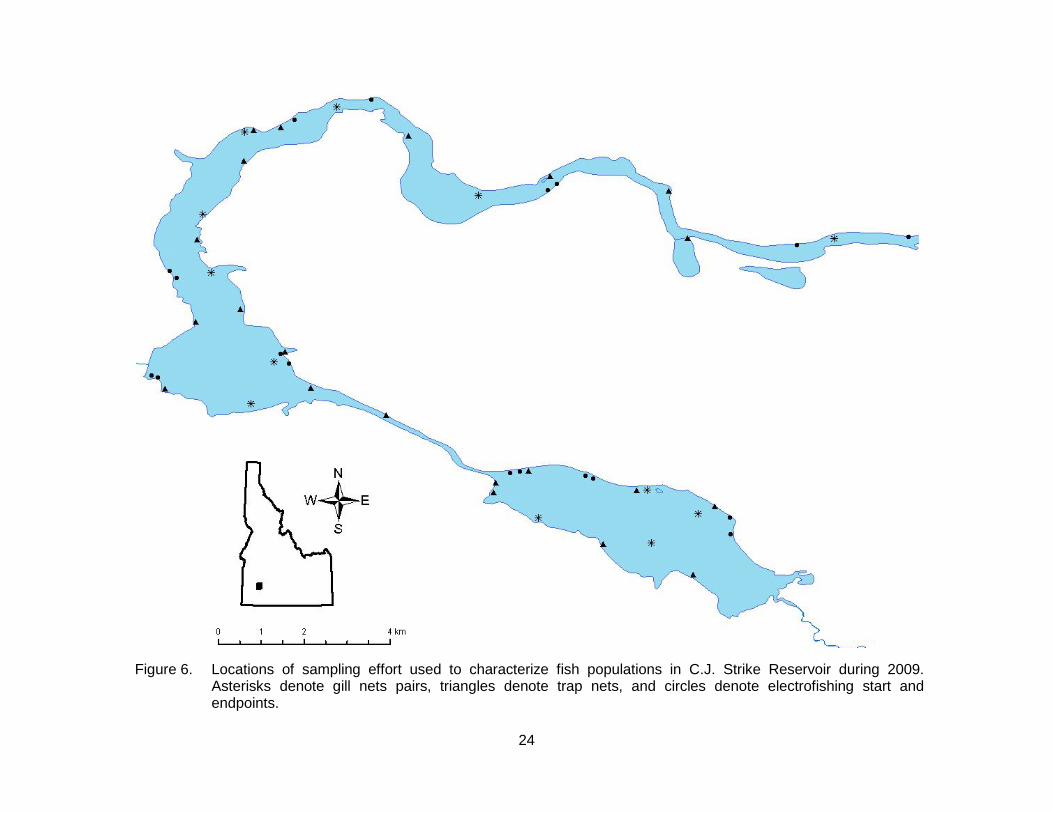
sampling gears from May 19 to 22, 2009. Sampling gear included: (1) paired gill nets, (2) trap nets, and (3) night electrofishing. Paired gill net sets included floating and sinking monofilament nets, 46 m x 2 m, with six panels composed of 19, 25, 32, 38, 51, and 64-mm bar mesh. One floating and one sinking net, fished for one night, equaled one unit of gill net effort. Trap nets possessed 15-m leads, 1-m x 2-m frames, crowfoot throats on the first and third of five loops, 19-mm bar mesh, and had been treated with black tar. One trap net fished for one night equaled one unit of trap net effort. For boat electrofishing effort, pulsed direct current was produced by a 5,000-watt generator. Frequency was set at 120 pulses per second and a pulse width of 40, which yielded an output of 5-6 amps. One hour of active on-time electrofishing equaled one unit of effort. Due to the relatively large size of C.J. Strike Reservoir, we divided the reservoir into three sections (strata): Bruneau Pool, Main Pool, and the Snake Arm. We used roughly equal amounts of effort in each of the strata, including about 1 h of electrofishing effort (divided into three approximately equal duration runs), seven trap nets, and four paired gill net sets. Thus, in total, 21 trap net sets, 12 paired gill net sets, and 3.13 h of electrofishing were utilized during 2009 (Figure 6).
Captured fish were identified to species, measured for total length (± 1 mm), and
weighed (±1g for fish under 5,000 g or ± 10 g for fish greater than 5,000 g) with a digital scale. In the event that weight was not collected, length-weight relationships were built from fish

16
weighed and measured in 2009 which allowed us to estimate weights of un-weighed fish. Furthermore, for those fish not weighed or measured, average or estimated weights were used to calculate biomass estimates. Proportional stock densities (PSD) were calculated for gamefish populations as outlined by Anderson and Neuman (1996) to describe length-frequency data. Also, relative weight (Wr), was calculated as an index of general fish body condition where a value of 100 is considered average. Values greater than 100 describe robust body condition, whereas values less than 100 indicate less than ideal foraging conditions. Catch data were summarized as the number of fish caught-per-unit-effort (CPUE) and the weight in kg caught-per-unit-effort (WPUE). These indices were calculated by standardizing the catch of each gear type to one unit of effort and then summing across the three gear types.
RESULTS
During 2009, we collected 3,629 fish with three gear types, including 1,879 black
crappie, 54 bluegill, 21 bridgelip sucker, 20 brown bullhead Ictalurus nebulosus, 68 channel catfish, 33 chiselmouth, 19 common carp, 14 largemouth bass, 333 largescale sucker, 82 northern pikeminnow, 94 peamouth Mylocheilus caurinus, 3 pumpkinseed Lepomis gibbosus, 145 hatchery rainbow trout, 425 smallmouth bass, 3 unidentified suckers Catostomus spp., 92 white crappie, and 326 yellow perch (Table 4). For all species and gear types combined, CPUE and WPUE effort indices were 691 and 199 (Table 4 and 5), respectively. Electrofishing was the most effective gear type on a per number basis yielding a total CPUE of 559 fish/hr, followed by gill nets (CPUE = 100), and trap nets (CPUE = 33). Based on CPUE, black crappie was the most abundant fish sampled and comprised over 59% of the fish community. Smallmouth bass (19%) and largescale sucker (6%) were the two next most abundant species numerically, whereas other species represented less than 4% of the total. Based on WPUE, the fish community consisted of black crappie (38%), largescale sucker (25%), as well as common carp and smallmouth bass (10% each of the total). Other species (n = 13) represented less than 4% of the total biomass index individually or less than 18% of the total biomass index cumulatively.
Black crappie was the most common game fish sampled with a CPUE of 408 and WPUE
of 75. Most black crappie were sampled with electrofishing gear (electrofishing CPUE = 364 fish/hr). Catch rates were highest in the Bruneau Arm pool stratum where CPUE averaged 624 fish/hr. PSD for black crappie was 92, calculated from 550 stock length fish (≥130 mm) of which 507 were quality length fish (≥200 mm). This high PSD is indicative of a black crappie population skewed towards adult-sized fish with few recruits (Figure 7). Mean length and weight were 219 mm and 183 g. Mean relative weight, Wr, for fish over 100 mm was 111, indicating relatively good average body condition. Wr showed no significant trend across the lengths of fish examined (slope = -0.03; P = 0.35; n = 479).
Smallmouth bass was the second most common fish sampled with a CPUE of 130
fish/standard effort unit and a WPUE of 19 kg/standard effort unit (Table 4 and 5). Most smallmouth bass were sampled with electrofishing gear (Electrofishing CPUE = 128 fish/hr). Catch rates were highest in the Main Pool stratum where CPUE averaged 218 fish/hr. Proportional stock density for smallmouth bass was 16, calculated from 331 stock length fish (≥180 mm) of which 53 were quality length fish (≥280 mm). This is a relatively low PSD and indicates that the sample was composed of mostly smaller fish with few quality size fish present (Figure 8). Mean Wr for fish over 150 mm was 87, indicating fair body condition. Wr tended to decrease as length increased (slope = -0.1 ; P < 0.01 ; n = 363).

17
Other popular sport fish in the reservoir include rainbow trout, channel catfish, and yellow perch. During 2009, CPUE and WPUE for rainbow trout were 23 and 9, respectively (Tables 4 and 5). All rainbow trout were sampled with gill nets (35%) and electrofishing (65%) gears with nearly all rainbow trout being sampled from the Snake Arm and Main Pool. Mean length and weight for rainbow trout were 328 mm and 393 g. Mean Wr for rainbow trout over 120 mm was 90 indicating fair body condition. Wr tended to decrease as length increased (slope = -0.08 ; P < 0.01; n = 130). CPUE and WPUE for channel catfish were 6 and 7 (Tables 4 and 5). Most channel catfish were sampled from the Snake Arm with gill nets. Mean length and weight for channel catfish were 393 mm and 1,088 g. Proportional stock density for channel catfish was 86, calculated from 42 stock length fish (≥280 mm) of which 36 were quality length fish (≥410 mm). Mean Wr for channel catfish over 70 mm was 126 indicating excellent body condition. CPUE and WPUE for yellow perch were 27 and 4.6, respectively (Tables 4 and 5). Most yellow perch (96%) were sampled with gill nets and catch rates for yellow perch tended to be higher in the Main Pool stratum. Mean length and weight for yellow perch were 239 mm and 177 g. Proportional stock density for yellow perch was 70, calculated from 173 stock length fish ( ≥ 150 mm) of which 246 were quality length fish (≥ 230 mm). Mean Wr for yellow perch over 100 mm was 87 indicating fair body condition.
In addition to lowland lake survey efforts, IPC personnel completed a one-year creel
survey that allowed comparison to creel survey collected by IDFG during 1992-93 (Allen et al. 1995) and other IPC creel surveys (Brink and Brown 2008). Total effort expended during these creel survey efforts has been fairly consistent (Figure 9). Mean total effort for these years was 259,158 h ± 36,570. Effort peaked during 1994 at nearly 380,000 h. Despite relatively similar effort, catch and predominant species in the catch has been variable. For instance, an estimated 231,627 fish were caught in 1992-1993 compared to 460,360 fish during 2009. Approximately 69 and 44% of caught fish were released during 1992-1993 and 2009 surveys, respectively. Composition of harvested fish in the creel differed between the two studies with yellow perch (37%), rainbow trout (29%), and bluegill (18%) comprising the majority of the harvest during 1992-1993, whereas crappie (82%) and yellow perch (16%) comprised the majority of the harvest during 2009. Estimated crappie and yellow perch harvest were approximately 234,000 and 44,000, respectively. In addition to creel surveys during 2008-2009, IDFG’s research staff estimated exploitation rates with tagging studies for smallmouth bass (24%) and crappie (30.8%; Meyer et al. 2009).
DISCUSSION
Abundance and biomass indices for C.J. Strike Reservoir were at the higher end of the
spectrum for Idaho waters, especially for CPUE. This high CPUE was almost entirely created by very high black crappie abundance and by the timing of sampling efforts which coincided with peak near-shore spawning activity for black crappie. Although record high abundances were documented, relative weight indices indicated that fish were still in very good body condition suggesting no food limitations. According to age estimates, the black crappie population consisted almost entirely of age-3 individuals, that were produced during 2006 (Tony Lamansky, IDFG, pers. comm.). Analysis of length frequency data indicates a paucity of small, younger fish.
Summaries of smallmouth data indicated high catch rates, but poor size structure and
body condition. It is doubtful that the true size structure of this population was this unbalanced. Quality sized smallmouth bass are difficult to sample with the gears we used partially due to habitat use and reservoir morphology. Larger smallmouth bass may only be vulnerable to
18
electrofishing efforts for a brief period during early May which did not overlap with this sampling effort. Similarly, smallmouth bass PSD was low (16) during 2000 (Table 8; Flatter et al. 2003). Creel survey data and tagging studies indicated that release rates for smallmouth bass were high.
During April 2009, an approximately 600 mm walleye Sander vitreus was caught by an
angler in the Snake River Arm of C.J. Strike Reservoir near Cove Arm Reservoir. Officers from IDFG and Owyhee County verified the catch visually. This is the first authenticated report of walleye in Southwest Idaho waters to our knowledge. Due to our concern over walleye establishment in the Snake River and its reservoirs, we set gill nets at several locations near the capture location to determine if spawning concentrations were present. No additional walleye were captured. It is not possible to determine whether this was a fluke occurrence or whether a small population has been established. If walleye reside in C.J. Strike Reservoir, population density must be very low or other specimens would have been documented with our intense sampling efforts, the sampling efforts of others, or in the high-use recreational fishery.
Catch and biomass indices have been fairly consistent over the last six surveys. CPUE
and WPUE were at the second highest levels recorded (Table 6). The CPUE for 2009 of 691 was only exceeded by the survey conducted during 1995 when CPUE equaled 753 and the catch was composed mostly of yellow perch (52%; Table 7). The WPUE for 2009 of 199 was only exceeded during the 1996 survey (WPUE = 202) when approximately half of biomass was composed of largescale sucker and common carp. The high CPUE and WPUE levels documented during 2009 were influenced primarily by black crappie which composed 59% and 38% of the CPUE and WPUE indices, respectively.
MANAGEMENT RECOMMENDATIONS
1. Continue basic life-history studies for warm water species especially targeting larval
production
2. Assess other methods for determining year-class strength of recreationally important fishes prior to them becoming vulnerable to the fishery.
3. Periodically sample C.J. Strike at 3-5 year intervals to track population changes.
4. Collaborate with Idaho Power personnel to fully evaluate catch, effort, and harvest rates of crappie, bass, and rainbow trout paying particular attention to the relative performance of stocked catchables and fingerlings.
5. Publicize predicted fishery changes.

19
Table 4. Catch per unit effort (CPUE,#) for a lowland lake survey conducted on C.J. Strike Reservoir during 2009. Species names
were abbreviated as black crappie (BCR), bluegill (BLG), bridgelip sucker (BLS), brown bullhead (BBH), channel catfish (CAT), chiselmouth (CSL), common carp (CRP), largemouth bass (LMB), largescale sucker (LSS), northern pikeminnow (NPM), peamouth (PEA), pumpkinseed (PKS), hatchery rainbow trout (HRB), smallmouth bass (SMB), unidentified sucker species (SUC), white crappie (WCR), and yellow perch (YLP).
Method BCR SMB LSS YLP HRB BLG PEA NPM CAT WCR CSL CRP LMB BLS BBH PKS SUC Total
Electrofish 364 128 21 1 15 15 0 1 0 0 2 4 4 2 0 1 1 559
Trap net 26 1 0 1 0 0 0 0 0 4 0 0 0 0 1 0 0 33
Gill net 18 1 22 26 8 0 8 7 5 1 2 1 0 1 1 0 0 100
Total 408 130 43 27 23 16 8 7 6 5 4 4 4 3 1 1 1 691
20
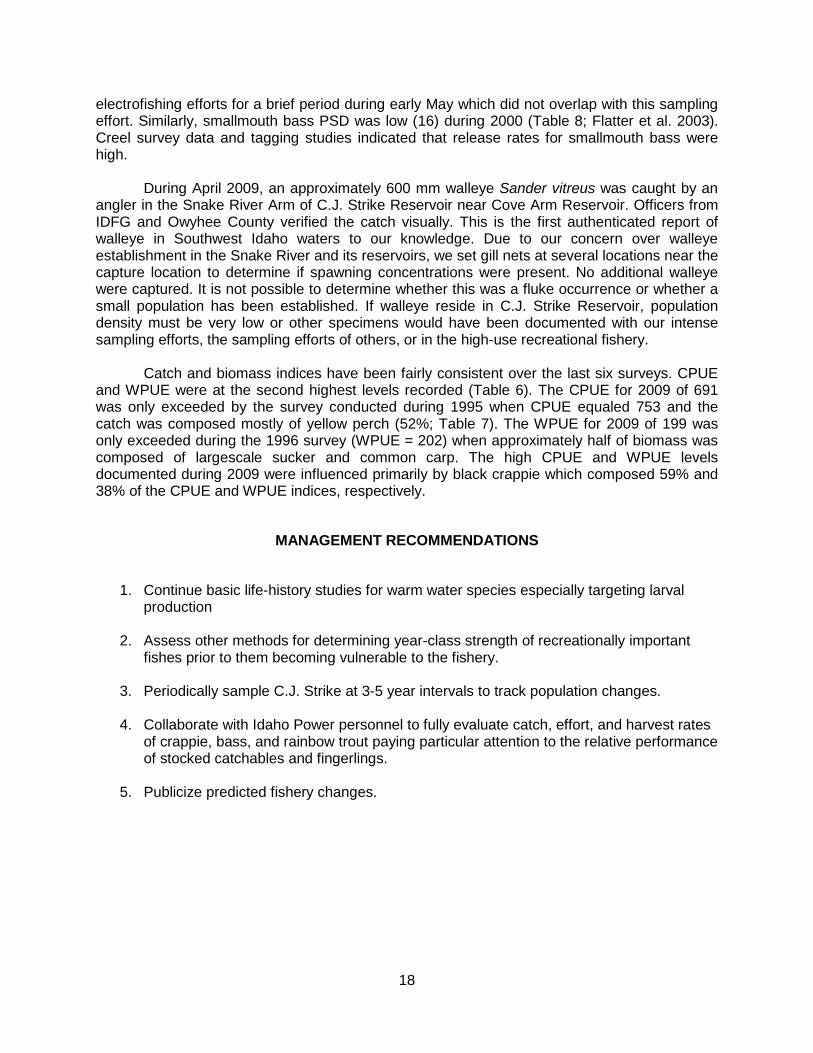
Table 5. Weight per unit effort (WPUE,kg) for a lowland lake survey conducted on C.J. Strike Reservoir during 2009. Species names were abbreviated as black crappie (BCR), bluegill (BLG), bridgelip sucker (BLS), brown bullhead (BBH), channel catfish (CAT), chiselmouth (CSL), common carp (CRP), largemouth bass (LMB), largescale sucker (LSS), northern pikeminnow (NPM), peamouth (PEA), pumpkinseed (PKS), hatchery rainbow trout (HRB), smallmouth bass (SMB), unidentified sucker species (SUC), white crappie (WCR), and yellow perch (YLP).
Method BCR LSS CRP SMB HRB CAT YLP NPM BLG LMB PEA BLS BBH CSL WCR PKS SUC Total
Electrofish 67 23 18 19 5 1 0 1 1 2 0 1 0 0 0 0 0 139
Trap net 5 0 0 0 0 0 0 0 0 0 0 0 0 0 1 0 0 7
Gill net 3 25 3 0 3 6 5 4 0 0 2 1 0 1 0 0 0 53
Total 75 49 21 19 9 7 5 4 2 2 2 1 1 1 1 0 0 199

21
Table 6. Catch per unit effort (CPUE) and weight per unit effort (WPUE) for all gear types and species combined for the last six standard lowland lake surveys conducted on C.J. Strike Reservoir.
Year Date CPUE WPUE
1995 6/13 753 96
1996 5/14 625 202
1997 5/28 471 160
1998 4/2 596 101
2000 5/12 402 121
2009 5/19 691 199

22
Table 7. Electrofishing catch per unit effort (CPUE; fish/hr) of warmwater fishes in C.J. Strike Reservoir during the last six lowland lake surveys.
Year Date Black
crappie Bluegill Smallmouth
bass White
crappie Yellow Perch
1995 6/13 15 16 22 0 159
1996 5/14 15 50 109 55 5
1997 5/28 8 65 162 1 1
1998 4/2 0 0 12 5 15
2000 5/12 9 76 87 16 33
2009 5/19 364 15 128 0 1

23
Table 8. Proportional stock density (PSD) of warmwater fishes for all gear types combined in C.J. Strike Reservoir for the last six lowland lake surveys.
Year Date Black
crappie Bluegill Smallmouth
bass White
crappie Yellow Perch
1995 6/13 100 50 64 50 68
1996 5/14 6 41 21 46 43
1997 5/28 63 58 26 93 85
1998 4/2 27 100 86 25 48
2000 5/12 89 49 16 98 83
2009 5/19 92 63 16 96 92
24
Figure 6. Locations of sampling effort used to characterize fish populations in C.J. Strike Reservoir during 2009. Asterisks denote gill nets pairs, triangles denote trap nets, and circles denote electrofishing start and endpoints.

25
Figure 7. Length frequency of black crappie (n = 550) sampled from C.J. Strike Reservoir
during 2009.
Figure 8. Length frequency of smallmouth bass (n = 407) sampled from C.J. Strike Reservoir during 2009.
0
20
40
60
80
100
120
140
160
0-9
20-29
40-49
60-69
80-89
100-109
120-129
140-149
160-169
180-189
200- 209
220-229
240-249
260-269
280-289
300-309
320-329
340-349
360-369
380-389Fr
eque
ncy
Length Interval (mm)
0
5
10
15
20
25
30
35
40
45
50
0-920-2940-4960-6980-89100-109120-129140-149160-169180-189200-209220-229240 -249260-269280-289300-309320-329340-349360-369380-389400-409420-429440-449460-469480-489
Freq
uenc
y
Length Interval (mm)

26
Figure 9. Total annual fishing effort expended on C.J. Strike Reservoir estimated during creel
surveys conducted by Idaho Power Company and Idaho Department of Fish and Game.
0
50000
100000
150000
200000
250000
300000
350000
400000
1992-93 1994 1995 1996 2001 2007 2008 2009
Effo
rt (h
)
Year

27
DEADWOOD RESERVOIR KOKANEE POPULATION MONITORING
ABSTRACT
The kokanee salmon population at Deadwood Reservoir has exhibited drastic cycles of density-dependent growth for many years. From 2003 to 2007, kokanee size at spawning decreased from over 420 mm to 250 mm and angler interest and effort has declined. In 2008, we estimated kokanee abundance using hydroacoustics and mid-water trawling on July 20-21, 2009. Ninety-four kokanee, ranging in size from 30-330 mm, were captured during the trawling survey, representing four age classes. Hydroacoustic fish densities among transects ranged from 230 fish/ha to 826 fish/ha with the highest densities (257 fish/ha) of fish corresponding to age-0 fish. Age-2 kokanee displayed the lowest densities (37.3 fish/ha) among age classes. Overall, total mean kokanee density was 455 fish/ha. When expanded to a population estimate using the reservoir surface area (1,215 ha) on the survey date, a total of 552,430 kokanee (487,414 to 626,096; 90% CI) were estimated. Age-0 kokanee made up 57% of this total or 312,566 (273,473 to 357,222) fish. A total of 106,620 (87,405 to 130,002) age-1, 45,294 (36,709 to 55,823) age-2, and 64,204 (52,534 to 78,408) age-3 fish were also estimated. Hydroacoustic and mid-water trawl kokanee abundance estimates collected over the past eight years are summarized and compared. Total kokanee abundance in 2009 has declined 42% since the last hydroacoustic survey was conducted in 2006. Finally, we discuss future management actions for monitoring and controlling the kokanee population at Deadwood Reservoir.
Author: Art Butts Regional Fishery Biologist

28
INTRODUCTION
Deadwood Reservoir is a 1,260-ha impoundment located on the Deadwood River in
Valley County, approximately 40 km southeast of Cascade and 85 km northeast of Boise, Idaho. Deadwood Reservoir provides sport fishing opportunity for kokanee, rainbow trout and westslope cutthroat trout O. clarkii lewisi. Bull trout are present in Deadwood Reservoir at very low numbers. In addition, remnant resident fall chinook O. tshawytscha, from a previous stocking program that ended after 1998, have been observed in small numbers.
Over the last 10 years, the kokanee population in Deadwood Reservoir has cycled
drastically. Because kokanee exhibit density-dependent growth, increases in population result in decreases in adult fish length. Historically, this relationship has been especially evident at Deadwood Reservoir as the kokanee population experiences relatively low angler pressure and has access to at least five tributaries with excellent spawning habitat. In addition, Deadwood Reservoir contains very small populations of piscivorous predators that are not capable of exerting a population level impact upon the kokanee population.
Mean female kokanee length observed at the kokanee spawning trap on the Deadwood
River has varied from a low of 208 mm in 1992 to a high of 421 mm in 2003 with mean size decreasing since 2003. The management goal for adult kokanee at Deadwood Reservoir is an average size of 325 mm. Deadwood Reservoir also functions as one of the state’s primary egg sources in Idaho, providing early spawn kokanee for stocking throughout the state. However, the egg take operation at Deadwood Reservoir was discontinued in 2009 because a permanent weir has been constructed on the South Fork Boise River (SFBR), above Anderson Ranch Reservoir. The location of future egg takes will likely alternate between Deadwood River and SFBR, dependent upon spawning escapement predictions for each year.
Because of Deadwood Reservoir’s importance as both a recreational fishery and source for kokanee eggs, efforts to better understand and manage kokanee production were implemented in 2004 (Flatter et al., In press). The rationale for this investigation was that by understanding and controlling escapement into tributaries utilized by kokanee and removing kokanee prior to spawning, a reduction in density within the reservoir might be achieved, which would result in larger kokanee for anglers and more eggs/female for fish handled during annual egg takes. Tributaries to Deadwood Reservoir were surveyed for the presence of spawning kokanee in 2004 and results of these surveys, along with historical records, identified five streams that are primarily utilized by kokanee for spawning. In addition to Deadwood River, where annual egg take efforts have been focused, Basin, Beaver, South Fork Beaver, and Trail creeks had notable spawning escapements, where Trail Creek was observed to hold the largest spawning run that has not been controlled by the Deadwood River weir. Prior to the 2006 escapement, picket weirs were installed on all five streams to block fish passage and allow for the evaluation and control of kokanee escapement in each tributary (Kozfkay et al. 2010). Kokanee were not intentionally allowed to pass upstream above the weirs, and were culled after counts and measurements. Although a great deal of effort has been expended on culling kokanee from spawning tributaries from 2006-2008, success has often been hampered by breached weirs, primarily following storm events, and interrupted weir access due to evacuations caused by nearby wildfires. Despite setbacks, IDFG personnel have culled a total of 231,914 kokanee between 2005 and 2007, of which approximately 80% (186,854) were from the Deadwood River trap. Due to the moderate success of the kokanee escapement reduction

29
efforts and the funding cooperation of BOR to continue the weir program for bull trout monitoring, weir operations were continued in 2008. In addition to tributary investigations, multiple mid-water trawling (2005-06, 2008-09) and hydroacoustic surveys (2000, 2002-06, 2009) have been conducted in hopes of developing a standard method to gauge the abundance of kokanee in the reservoir. Results of these surveys need to be evaluated and compared in order to assess the variation in estimates between years and survey type, and to compare abundance estimates to spawner numbers and size. This will allow us to determine whether these types of surveys are effective for population monitoring and fishery forecasting at Deadwood Reservoir.
METHODS Mid-Water Trawling
To estimate kokanee abundance, density, and biomass in Deadwood Reservoir, mid-
water trawling was conducted at night during the dark (new) moon on July 20, 2009. Trawling was performed in a stepped-oblique fashion as described by Rieman (1992) and Kline (1995) with the exception that the otter-boards were replaced by a fixed frame at the net mouth with a 4.5 m2 opening. Reservoir elevations in July allowed sampling four standardized trend transects on the east and west sides of the reservoir (Figure 10). The net was towed at 1.5 m/s with a 7.3 m boat. Abundance estimates generated by the program were based on lake surface area on day of sampling. Kokanee captured were measured for total length, weighed, and a subset had otoliths removed for estimating age. Density and biomass were estimated using the single section MS Excel Spreadsheet developed by the IDFG’s Lake Pend Oreille Fish Recovery Project (Maiolie et al. 2004). Ages were estimated using length frequency graphs and otoliths collected from 28 fish ranging between 46 - 319 mm.
Hydroacoustics
Hydroacoustic estimates of fish densities, lengths, and vertical depth distributions were obtained with a Hydroacoustic Technology, Inc. (HTI) Model 241-2 split-beam digital echosounder. The 200 kHz sounder was equipped with a 15° vertically aimed transducer (downlooking) which was suspended at a 1 m depth using a retractable pole mount mounted on the port side of the boat. Boat speed during data collection ranged from 1 to 1.5 m/s. Sampling transects were determined prior to surveys and were followed using Global Positioning System (GPS) coordinates (Figure 10). Data were collected at a sampling rate of 10 pings/s and a transmit pulse width of 0.2 ms was used.
Thresholds were generally established so that targets larger than –60 dB along the
acoustic axis were accepted for the downlooking transducer. Thresholds corresponded to a minimum size acceptance of 30 mm fish targets for the downlooking transducer (Love 1977). The bottom threshold was set at 2.0 V, and echoes within 1.5 to 2.0 m of the bottom were excluded from analysis (bottom window). However, in some instances, the bottom was tracked manually in efforts to detect fish closer to the bottom. In these instances, the bottom was manually traced using the returning echo strength and bottom editing functions within the software during fish tracking analyses.
Target tracking was used to classify returning echoes as fish and thus obtain fish density
estimates. This method combines individual echo returns that meet specific criteria and records them as individual fish. Following methods described by Teuscher (2001), fish tracking criteria

30
included: 1) a minimum of three echoes with a minimum acceptable change in range between echoes of 0.2 m, 2) a maximum difference in returning echo strength of 10 dB, 3) maximum swimming velocity of 3 m/sec, and 4) mean target strength for a tracked fish between a size range of –20 and –60 dB. During the survey, data were collected and processed, and fish were tracked and recorded using the HTI software, Digital Echo Processor (DEP). However, because the default tracking parameters may allow gas bubbles, bottom or complex substrate to be counted as fish, we individually examined tracked fish using HTI’s EchoScape software. The software allows the user to further examine individual echoes within a fish trace and thereby reduce errors associated with using the automatic tracking procedures, i.e., overestimating fish density. Midwater trawling was used for target verification and targets outside of the suspended kokanee layer were excluded from fish estimates.
Estimates of downlooking fish densities (>6 m deep) for each transect were obtained
using a range weighting technique as described by Yule (2000). This method standardizes fish density estimates by accounting for expanding sampling volume with increasing range. Tracked fish are weighted back to a 1 m swath at the surface using the following formula:
where wF is weighted fish, R is range, and 7.5° equals half the nominal transducer beam width.
Fish densities (fish/m2) for each transect were calculated by summing weighted fish and dividing that value by transect length (m).
Because the distribution of fish density estimates from transects was not normal, the geometric mean density was calculated for expansion to population estimates. The geometric mean and 90% confidence interval for density estimates was computed using methods described by Elliott (1983). A log(x+1) transformation was used because density estimates sometimes contained zero values. Total fish abundance was estimated by multiplying the geometric mean sidelooking and downlooking fish density (fish/ha) by the surface area of the reservoir on the survey date and summing them together. The standard error for the total population estimate was calculated using the following equation (Elliot 1983):
where 2
xs is the variance of x , 2
ys is the variance of y , and xn and yn is the sample size of each estimate.
1(2* *tan(7.5 ))wF
R=
°
2 2x y
x y
s sSEn n
= +

31
Ninety percent confidence intervals were calculated for population estimates using the methods described in Scheaffer et al. (1996). Regardless of transect length, each transect was considered a sample unit.
Kokanee Escapement To estimate mean female length at maturity, BOR biologists recorded the lengths of 33 females trapped as they entered Trail Creek during August 12-18, 2009. Fish were captured in trap nets that were deployed to monitor bull trout migration into Trail Creek.
RESULTS Mid-Water Trawling Ninety-four kokanee, ranging in size from 30 - 330 mm, were captured during the trawling survey on July 20, 2009 (Figure 11). Length frequency was used along with counting annuli on whole otoloiths to construct size ranges of four age classes. These analyses suggested that age-0 fish were fish <100mm, age-1 fish were between 100 - 200 mm, age-2 fish between 200 - 300 mm, and age-3 fish were >300 mm.
The kokanee population was estimated at 253,353 (± 110,610) and biomass was estimated at 8,695 kg (Table 9). Age-0 kokanee were the most abundant age class numerically 173,964 (+ 82,518), followed by age-1 fish (50,465 + 32,270).
Kokanee abundance in Deadwood Reservoir was estimated in 2005, 2006, and 2008-09 during July or August using mid-water trawling (Kozfkay et al. 2010; Hebdon et al. 2009; Kozflkay et al. 2009). When comparing the recent trawl events at Deadwood Reservoir, it is difficult to detect any change in the population in terms of abundance because of the large error associated with the estimates (Figure 12). This is a result of the size, depth, and contour of the reservoir which makes it difficult to complete transects of reasonable duration. Reservoir drawdown will continue to be a primary concern when conducting trawling surveys because the inability to sample at least six transects clearly impacts the usefulness of population estimates. Hydroacoustics Fourteen hydroacoustic transects were conducted at Deadwood Reservoir on July 21, 2009 (Figure 10). Converted target strengths suggested that kokanee ranged between 30 and 400 mm and the length frequency from converted target strength corresponded well with fish collected during mid-water trawling (Figure 11). Therefore, the fish size-age relationships that were estimated from mid-water trawling were used to partition hydroacoustic estimates into estimates for individual age classes.
Fish densities among transects ranged from 230 fish/ha to 826 fish/ha with the highest densities (257 fish/ha) of fish corresponding to age-0 fish (Table 10). Age-2 kokanee displayed the lowest densities (37.3 fish/ha) among age classes. Overall, total mean kokanee density was 455 fish/ha. When expanded to a population estimate using the reservoir surface area (1,215 ha) on the survey date, a total of 552,430 kokanee were estimated. Age-0 kokanee made up 57% of this total or 312,566 fish. A total of 106,620 age-1, 45,294 age-2, and 64,204 age-3 fish were also estimated.

32
Total kokanee abundance in 2009 has declined 42% since the last hydroacoustic survey was conducted in 2006 (Figure 13). Hydroacoustic abundance trend information from 2000-2009 shows that kokanee numbers were at their highest in 2005, lowest in 2002, and 2009 estimates were similar to those in 2004. Lower numbers were expected in 2009 as a result of the spawner removal efforts conducted by IDFG in 2006-2008.
Kokanee Escapement A total of 33 female and 43 male spawning kokanee were collected in the trap net at the mouth of Trail Creek. The mean length for females was 338 mm, and lengths ranged from 304 to 360 mm. Male lengths ranged from 292 to 365 mm and the mean was 344 mm. The overall management objective for kokanee at Deadwood Reservoir is for the population to maintain an average adult size of at least 325 mm. This minimum average length for adult fish should provide for both a quality kokanee fishery and a potential egg source for the state hatchery system. Recent efforts at Deadwood Reservoir have examined methods for monitoring the overall abundance of kokanee, the average size of adults as represented by spawning fish, and means to control the population when densities are high and size declines. For example, using the 2002-09 hydroacoustic data, the estimated population began to exceed 500,000 in 2004, and the average length of adult female spawners declined dramatically (Figure 13). An inverse relationship between mean female length (mm) and fish density (fish/ha) was observed using data collected at Deadwood Reservoir 2002-2009 (TL = 404.3 - 0.12 * fish density, n = 6, r2 = 0.73; Figure 15). This relationship predicts that the management objective of 325 mm will be met or exceeded at population densities <650 fish/ha.
DISCUSSION
We compared trawl estimates to 2000-09 hydroacoustic estimates (Figure 12 and 13). However, there were only four years (2005-06; 09) where abundance was estimated by both trawling and hydroacoustics. Hydroacoustic estimates of kokanee abundance were generally substantially larger than trawl estimates in terms of age class and total abundance for the same years. While hydroacoustics generate estimates that have smaller error bounds which enable us to better detect population changes between years, there are concerns that estimates might be biased high. For example, in 2005, we estimated kokanee escapement to be approximately 71,000 fish in all tributaries. In comparison, the 2005 mid-water trawl estimate of age 2-4 kokanee was 107,681 + 41% and the hydroacoustic estimate of fish >200 mm was 313,157 + 17%. However, an unknown portion of these fish may not have been spawners as the average length of spawning kokanee in Deadwood River was approximately 275 mm. Also, escapement estimates may underestimate actual numbers due to periodic weir failure which allowed fish to escape upstream.
Intrinsic errors are also associated with hydroacoustics, such as including targets in the
hydroacoustic kokanee estimate that were not kokanee. Although target verification is of primary concern in hydroacoustic assessments in mixed-species fisheries, gillnetting was conducted for target verification purposes during the 2003-2005 surveys, where kokanee was the predominant catch (86%) followed by mountain whitefish (9.7%). Both hydroacoustics and midwater trawling may overestimate abundance when extrapolating density estimates into population estimates using total surface area because not all of the surface area contains habitat utilized by kokanee.

33
Whether these proposed methods under or over-estimate actual species abundance is likely irrelevant as long as they continue to provide a stable relative population estimate, which offers many of the same advantages as an absolute estimate (Thorne 1983; Yule 2000). However, both methods would require additional sampling of spawning adults in tributaries to evaluate mean length if any relationship between population abundance and mean fish length were to be developed.
A more simplistic and less expensive approach to monitoring the kokanee population at Deadwood Reservoir would be to collect and measure a number of fish from both Deadwood River and Trail Creek in order to assess mean length of adults. Fish would be collected by electrofishing near the approximate peak run period at the end of August. Because achieving a minimum mean adult length of 325 mm is the desired objective, this would be the most direct approach to determine whether the population is meeting management goals. A drawback to this approach would be an inability to gauge the relative abundance of younger fish and therefore lacks prediction of the size of youger year classes needed for implementing management activities.
Regardless of the approach for kokanee population monitoring, the larger challenge remains controlling or reducing abundance in a system where spawning is virtually unlimited. Efforts to understand, estimate, and manage the kokanee escapement at Deadwood Reservoir have been labor intensive and only partially successful. Escapement reduction efforts only began in earnest in 2006 and limited population level responses in fish size have been observed. Because of the isolated location of Deadwood Reservoir, the costs of constructing and maintaining weirs throughout the escapement period in the major spawning tributaries is extremely high. Weir failure caused by periodic storm events at or near peak escapement can result in tens of thousands of kokanee entering an individual tributary (Hebdon et al. 2009). Maintaining annual efforts to manage the kokanee population on a limited regional budget is therefore unrealistic.
The kokanee population at Deadwood Reservoir has historically exhibited density-dependent growth. The reservoir experiences relatively low angler pressure and kokanee utilize at least five or six tributaries with suitable spawning habitat. Historically, other means to control kokanee escapement and reduce numbers have been tried such as rotenone and stocking pelagic predators at Deadwood Reservoir. However, the use of such methods has been limited since the petition to list bull trout as threatened in 1998 (USFWS 1998). Fall chinook (last stocked in 1998), Atlantic salmon Salmo salar (last stocked in 1995), and westslope cutthroat trout (last stocked in 1998) have been introduced to Deadwood Reservoir in hopes of controlling the kokanee population and providing sport fisheries for these species. Re-stocking pelagic predators into Deadwood Reservoir could function as a valuable tool for regulating the kokanee population at Deadwood Reservoir, in addition to providing a sport fishery. The high abundance of age-0 and age-1 kokanee (over 400,000 fish) would provide ample forage and buffer predation on bull trout. During June 2009, approximately 5,200 fingerling fall chinook, marked with adipose fin clips, were stocked into the reservoir, which equates to a stocking density of 4 fish/ha. We plan to continue to stock fall chinook at this low density when fish are available and evaluate survival, growth, and diet of chinook after three years.

34
MANAGEMENT RECOMMENDATIONS
1. Continue monitoring the kokanee population in Deadwood Reservoir with midwater trawling and hydroacoustics and sample spawning fish to estimate mean length for an additional year.
2. Stock an additional 5,000 fall chinook fingerling during 2010 and 2011. Evaluate survival, growth, and diet of stocked fall chinook in 2012.

35
Table 9. Kokanee mid-water trawling estimates for population (+ 90% CI), biomass (kg), and
standing stock (kg/ha) during the survey at Deadwood Reservoir, Idaho on July 20, 2009.
Age-0 Age-1 Age-2 Age-3 Total Population 173,964 50,465 8043 20,881 253,353 90% CI 82,518 32,270 7,438 12,860 110,610
Biomass (kg) 157.9 1,421.7 916.9 6,198.20 8,694.70
Standing Stock (kg/ha) 0.1 1.2 0.8 5.1 7.2

36
Table 10. Kokanee fish densities (number/ha) per hydroacoustic transect and total abundance estimates calculated by arithmetic and geometric mean densities at Deadwood Reservoir, Idaho on July 21, 2009.
Fish densities (number / ha) Transect Transect length (m) Age-0 Age-1 Age-2 Age-3 Total
1 591 209.2 50.4 16.0 20.8 296.4 2 493 379.2 118.7 74.0 119.7 691.6 3 594 552.7 173.0 34.9 65.7 826.3 4 507 373.1 64.9 36.3 54.2 528.6 5 377 297.8 145.9 24.7 65.3 533.7 6 564 131.5 75.4 25.8 69.4 302.1 7 451 174.3 178.3 60.9 74.1 487.5 8 458 153.0 25.5 20.3 31.2 230.0 9 702 276.9 108.3 66.1 57.4 508.8 10 736 250.5 29.0 11.2 12.7 303.5 11 963 305.2 99.2 117.3 69.7 591.3 12 793 407.5 150.2 41.0 113.3 712.1 13 535 181.5 79.5 33.2 32.8 327.0 14 810 206.3 123.6 65.8 70.8 466.5
Arithmetic Mean (AM) 278.5 101.6 44.8 61.2 486.1
90% CI (AM) 38.0 16.1 9.3 9.9 58.0
Abundance (AM) 281,539 102,689 45,318 61,884 491,430
+ 38,443 + 16,277 + 9,449 + 10,048 + 10,048
Geometric Mean (GM) 257.2 87.7 37.3 52.8 454.6
90% CI (GM) 225.0 to 293.9 71.9 to 107.0 30.2 to 45.9 43.2 to 64.5 401.1 to 515.2
Abundance (GM) 312,566 106,620 45,294 64,204 552,430
273,473 to
357,222 87,405 to 130,002
36,709 to 55,823
52,534 to 78,408
487,414 to 626,096

37
Figure 10. Map of Deadwood Reservoir, Idaho showing mid-water trawling and hydroacoustic
transect locations during the 2009 survey.

38
0
2
4
6
8
10
12
14
Total length (mm)
50 100 150 200 250 300 350 400
Freq
uenc
y (%
)
0
10
20
30
40
50
Target strength
Trawl
Figure 11. Length frequency of kokanee as estimated by converted hydroacoustic target
strengths and length frequency of kokanee captured during mid-water trawling during the survey at Deadwood Reservoir, Idaho on July 20 - 21, 2009.

39
X Data
0
50000
100000
150000
200000
250000
300000
350000
Age-0 kokaneeA
bund
ance
+ 9
0% C
I
0
100000
200000
300000
400000
500000
600000 Age-1 kokanee
Year
2005 2006 2007 2008 20090
200000
400000
600000
800000Total (Age-0-4)
Figure 12. Comparison of kokanee abundance estimates + 90% CI for age-0, age-1, and total
fish as estimated from mid-water trawling 2005 - 2009 at Deadwood Reservoir, Idaho.

40
Year
2000 2002 2004 2006 2008
0
500000
1000000
1500000
2000000
2500000Abun
danc
e +
90%
CI
0
100000
200000
300000
4000000
100000200000300000400000500000600000
0200000400000600000800000
100000012000001400000
<100 mm
100-200 mm
>200 mm
Total
Figure 13. Comparison of kokanee abundance estimates + 90% CI for fish <100 mm (age-0),
100-200 mm (age-1), >200 mm (age-2+), and total fish as estimated from annual hydroacoustic surveys in 2000 - 2009 at Deadwood Reservoir, Idaho.

41
Year
2000
2002
2004
2006
2008
Abun
danc
e +
90%
CI
500000
1000000
1500000
2000000
2500000
Mea
n Fe
mal
leng
th (m
m)
240
260
280
300
320
340
360
380
400
420
440
AbundanceMean length
Managment objective
Figure 14. Kokanee trend data for 2000 - 2006 hydroacoustic abundance estimates (all ages
combined) and mean female total length (mm) collected at the Deadwood River trap from 1998 - 2008. The management objective for minimum adult length is also shown.

42
Total fish density (fish/ha)
0 200 400 600 800 1000 1200 1400 1600
Mea
n ad
ult f
emal
e le
ngth
(TL;
mm
)
200
250
300
350
400
450
r2 = 0.73 P<0.03
Figure 15. Relationship between mean adult female length (mm) and fish density (fish/ha) at
Deadwood Reservoir 2002 - 2009 (TL = 404.3 - 0.12 * fish density, n = 6, r2 = 0.73). This relationship predicts that the management objective of 325 mm will be met or exceeded at population densities < 650 fish/ha.

43
ASSESSMENT OF LARVAL FISH PRODUCTION IN LAKE LOWELL
ABSTRACT
Regional staff conducted larval trawl surveys of Lake Lowell during 2009 to gain a better
understanding of warm water fish recruitment patterns and factors that may affect reproductive success. In addition, we transferred approximately 5,385 pre-spawn adult-sized crappie from C.J. Strike Reservoir to bolster production potential. During 2009, we caught a total of 806 larval fish with the Neuston net during 48 separate tows. For bluegill, the highest catch per unit effort of 39.3 fish/100 m3 occurred on July 16 at site 2. For black crappie, the highest CPUE of 23.4 fish/100 m3 occurred on July 16 at site 3. Crappie production was approximately 5 times higher than at any other time since monitoring began in 2006. Bluegill production during 2009 was only about 25% of highs documented previously. Improvements in panfish populations will require more consistently high spring reservoir levels, removal of nuisance common carp, improved water quality, and increased abundance of adult panfish. Author: Joe Kozfkay Regional Fishery Biologist

44
INTRODUCTION
Lake Lowell is a 3,640 hectare BOR irrigation reservoir located 10 km southwest of Nampa, Idaho. The reservoir was built from 1906 to 1909 by forming four embankments around a naturally-occurring low-lying area. Shortly thereafter, the lands surrounding the reservoir were incorporated into the National Wildlife Refuge system and continue to be managed by the U. S. Fish and Wildlife Service. Uniquely, no streams or rivers flow into the reservoir; instead, water is supplied by the New York Canal which diverts water from the Boise River. Due to recent leakage at the upper embankment, maximum full pool was lowered from 771.5 m (2,531.2 ft) to 770 m (2,526.0 ft) during June 2005 (Figure 16). Additionally, the lake was lowered to 766 m (2,514 ft) during fall 2007 to allow repair work. High snow pack and completion of dam repair work allowed reservoir levels to reach near full pool (2,530 ft) during spring of 2009. The reservoir is fairly shallow with a maximum depth of 11 m. Much of the littoral zone is occupied by extensive beds of smartweed (Polygonum spp.).
Due to proximity to Idaho’s population center, Lake Lowell receives substantial fishing pressure. Largemouth bass Micropterus salmoides receive the majority of the attention and several tournaments are held annually. Panfish fisheries (black crappie, bluegill, and yellow perch) are also popular; however, population abundances have fluctuated widely leading to inconsistent use. IDFG stocks both channel catfish and Lahontan cutthroat trout O. clarkii henshawi in the reservoir. Since 2003, approximately 6,000 to 9,000 fingerling channel catfish have been planted annually. Additionally, recent plants of Lahontan cutthroat trout fingerlings have ranged from 40,000 to 103,000 annually. Lake Lowell is managed under general regulations, except for largemouth bass which are managed under a no harvest regulation from January 1 thru June 30 and a 2-fish, 305 - 406 mm protected slot limit thereafter.
OBJECTIVES
1. Assess reproductive success of recreationally important warm-water fishes. 2. Translocate adult, pre-spawn crappie to bolster production potential.
METHODS
Horizontal surface trawls were used to index the abundance of larval fish in the reservoir. Trawls were made with a 1-m deep x 2-m wide x 4-m long Neuston net at six sites spread throughout the reservoir (Figure 17). Tows were begun at dusk and all sites were completed within 3 h. Mesh size was 1.3 mm. The net was fit with a flow meter to estimate the volume of water sampled. Tow duration was 5 minutes and an average of 560 m3 was sampled per tow. Two tows were made in each of the three sections of the reservoir. Tows were made on an approximately weekly basis beginning June 17, 2009 until few larval fish were sampled by mid-August. Specimens were stored in 10% formalin and viewed under a dissecting microscope. Sampled fish from each tow were identified to species and measured for length, unless the total number of larval fish exceeded 50 individuals. For large samples, we randomly selected 50 individuals, identified and measured those, and counted the remainder. Furthermore, we scanned the entire sample for the presence of larval channel catfish.
We captured black and white crappie in C.J. Strike Reservoir and transferred them to Lake Lowell during spring to bolster depressed adult populations. Pre-spawn adult-sized fish

45
were captured in C.J. Strike during lowland lake survey efforts using trap nets and electrofishing gear. Additionally, volunteer fishermen, some from local fishing clubs, caught and donated live crappie for transfer. Fish were collected from May 13 - 26, 2009. After capture, fish were transferred to live cars and held until sufficient numbers were captured to fill a transport truck or trailer. Once loaded, fish were supplied with supplemental oxygen at the rate of 2 L/min. All transplanting occurred on the same day as fish were trapped.
RESULTS
During 2009, we caught a total of 806 larval fish with the Neuston net during 48 separate tows (six fixed sites on eight sampling dates). Fish species sampled included bluegill, black crappie, channel catfish, largemouth bass, unknown, white crappie, and yellow perch. Bluegill were by far the most numerous species (63%) captured, followed by black crappie (34%), and channel catfish (2%). Most of the larval fish (82%) were caught in three sites (sites 2, 5, & 6; Table 11). Catch of larval fish was generally low for the first three sampling dates, started to increase by July 8th, peaked on July 16th, and declined rapidly thereafter. The highest catches of bluegill, black crappie, and channel catfish all occurred on July 16th. For bluegill, the highest catch per unit effort of 39.3 fish/100 m3 occurred on July 16 at site 2 (Figure 18). For black crappie, the highest catch per unit effort of 23.4 fish/100 m3 occurred on July 16 at site 3 (Table 12; Figure 19).
In total, we transferred approximately 4,725 black crappie and 660 white crappie from C.J. Strike to Lake Lowell during lowland lake survey and volunteer fishing efforts (Table 12). Mean weight of black crappie and white crappie was 183 g and 264 g, respectively. External examination of fish indicated that most fish were in pre-spawn condition.
DISCUSSION
The production of larval crappie in Lake Lowell during 2009 was the highest we have documented during the last four years of monitoring and was approximately 5 times higher than the highest mean CPUE documented previously (2007; Hebdon et al. 2009). It is not possible to discern whether this increase was caused by adult translocations or higher spring reservoir levels. However, different relative spatial abundances suggest that adult translocations were a contributing factor to increased larval abundance. In all previous years, larval crappie abundance were most abundant as site 5 or site 6 on all sampling occassions. During 2009, larval abundance was highest at site 3, near adult release sites. Assuming a 50:50 sex ratio and a fecundity of 25,000 eggs per adults (Carlander 1977), we added approximately, 75 million crappie eggs to the reservoir by translocating pre-spawn adults. We have no estimates of crappie abundance in Lake Lowell prior to translocations; however, abundance appeared very low in recent surveys (Kozfkay et al. 2009). Therefore, we believe this translocation effort represented a substantial boost to production potential. Alternatively, Lake Lowell filled to near full pool levels during spring for the first time since 2000 as repair work on the upper dam had been completed and inflow and carryover were sufficient to allow re-filling. At these pool elevations, most near shore cover was inundated creating favorable spawning conditions for warm water fish species. Despite these favorable conditions and translocations, larval fish abundance was still much lower than documented for other southwestern Idaho waters. During 2006, strong crappie year classes were produced in C.J. Strike and Brownlee reservoirs (Tony Lamansky, IDFG, unpublished data). Mean larval crappie abundance in these reservoirs during 2006 peaked at 58-119 fish/100 m3 (or approximately 2.5 to 5 times higher than were noted in Lake Lowell during 2009.

46
Although crappie production increased during 2009, bluegill production was lower than in previous years. Bluegill production during 2009 (7 fish/100 m3) was about 25% of levels observed during 2006 (26/100 m3). In addition, bluegill spawning appeared to occur over a shorter time period whereas in other years, multiple broods were likely produced. It is difficult to pinpoint the cause of this decrease. A blue-green algae bloom occurred during mid-July at the same time larval bluegill are pelagic. It is possible that this bloom could have decreased survival or precluded additional spawning attempts. Additional adult translocations, improved water quality, more consistently high reservoir levels during spring, and control of nuisance carp are needed to rebuild crappie and other warm water fish populations.
MANAGEMENT RECOMMENDATIONS
1. Continue channel catfish stocking program as it has produced a healthy population.
2. Determine if adult translocations of yellow perch, black crappie, and white crappie populations lead to increased abundance of older age classes with additional sampling efforts.
3. Suppress common carp as a strategy for restoring panfish populations.

47
Table 11. Larval fish abundance (#/100 m3) at six monitoring sites in Lake Lowell. Samples were collected with a Neuston net from June 17th to August 13th, 2009.
Date (2009) Site BLG BCR CAT LMB UNK WCR YLP
6/17 1 0.18 0.18 2 0.18 3 4 0.18
5 6 0.18 0.18
Mean 0.09 0.03 0.06
6/25 1 0.46
2 0.15 3 0.31 4 5 0.36 0.18 6 0.61 Mean 0.31 0.03
7/1 1 0.16 2 0.18 3 4 5 0.20 6 1.07 Mean 0.27
7/8 1 0.30 2 1.58 3 0.33 4 0.19 5 4.03 8.98 6 26.66 5.24 0.22 Mean 5.12 2.72 0.09

48
Table 11 continued. Larval fish abundance (#/100 m3) at six monitoring sites in Lake Lowell. Samples were collected with a Neuston net from June 17th to August 13th, 2009.
Date (2009) Site BLG BCR CAT LMB UNK WCR YLP
7/16 1 2 39.29 1.42 3 0.68 23.42 0.68 4 3.83 0.18 5 1.54 9.69 0.22 6 4.99 0.47 Mean 6.92 7.22 0.26
7/23 1 0.16 2 4.29 0.20 0.20 3 1.59 4 2.41 0.60 0.20 5 0.50 0.17 0.17 6 0.98 0.16 0.16 Mean 1.66 0.19 0.06 0.06
7/30 1 0.68 0.23 2 1.03 0.21 3 0.18 4 5 0.81 0.16 6 1.40 0.17 0.17 Mean 0.68 0.03 0.03 0.04 0.06
8/13 1 0.11 2 3 4 0.37 5 1.80 0.18 6 3.28 Mean 0.93 0.03
Overall Mean 1.912 1.353 0.059 0.004 0.005 0.019 0.007

49
Table 12. Summary of black and white crappie transferred from C.J. Strike Reservoir to Lake Lowell during spring 2009.
Date (2009)
black crappie white crappie
# lbs # lbs
13-May 900 363 100 58
21-May 600 242 100 58
22-May 270 109 30 17
23-May 1785 720 200 116
26-May 1170 472 230 134
Total 4725 1906 660 384

50
Figure 16. Surface elevation (ft) of Lake Lowell from 1980 to present. Black dots indicate
surface elevation on May 1.
2505
2510
2515
2520
2525
2530
2535
1980
1982
1984
1986
1988
1990
1992
1994
1996
1998
2000
2002
2004
2006
2008R
eser
voir
Surf
ace
Elev
atio
n (ft
)
Year

51
Figure 17. Lake Lowell sampling sections (Large bolded text #1 - 3), larval fish towing sites
(Small text #1 - 6), and zooplankton sampling sites (Small text #1, #3, & #5) used during 2009 for fish and invertebrate surveys.
N
1
Upper Embankment
2
3
Lower Embankment
Gott's Point
6
5
4
3
2
1
0 2.5 5 1.25 km

52
Figure 18. Mean density of larval bluegill (#/100 m3) sampled with horizontal Neuston net tows
at six sites in Lake Lowell from 2006 to 2009.
0
5
10
15
20
25
30La
rval
Blu
egill
Den
sity
(#/1
00 m
3 )
Date
2006
2007
2008
2009

53
Figure 19. Mean density of larval black crappie (#/100 m3) sampled with horizontal Neuston net
tows at six sites in Lake Lowell from 2006 to 2009.
0
1
2
3
4
5
6
7
8La
rval
Bla
ck C
rapp
ie D
ensi
ty (#
/100
m3 )
Date
2006
2007
2008
2009

54
LUCKY PEAK RESERVOIR LOWLAND LAKE SURVEY
ABSTRACT
A total of 1,258 fish were captured during the standard lowland lake survey at Lucky Peak Reservoir on June 1 - 4, 2009. Catch was predominately largescale sucker (485), northern pikeminnow (240), smallmouth bass (183), bridgelip sucker (168), and redside shiner (166). A total of 56 rainbow trout, 52 kokanee and 37 yellow perch were also caught. Remaining fish species sampled included chiselmouth, mountain whitefish Prosopium williamsoni, brown bullhead Ameiurus nebulosus, and a single cutthroat trout. CPUE and WPUE indices for combined species were 321 and 57, respectively. The kokanee fishery is not subjected to the cyclical trends in size and abundance seen at many Idaho kokanee waters, largely a result of the lack of natural recruitment within the system. The population relies solely on stocking of fingerling kokanee in the spring, which for the last 3 - 4 years, has produced a reliable and stable fishery in both numbers and individual fish size. The majority of fish biomass (69%) at Lucky Peak Reservoir was comprised of largescale sucker (35%) and northern pikeminnow (34%). However, the reservoir is still producing a quality sport fishery and angler satisfaction with the reservoir is high.
Author:
Art Butts Regional Fishery Biologist

55
INTRODUCTION
Lucky Peak Reservoir is an 1,140 ha mesotrophic impoundment in the Boise River
drainage, immediately downstream from Arrowrock Reservoir. It has a mean depth of 32.8 m, a total capacity of 3,615 x 105 m3, and is managed to provide irrigation, power generation, and recreation. Because of the reservoir’s close proximity to the Boise area, it is utilized intensively for boating and other recreational activities. The impoundment has a mixed species assemblage that includes smallmouth bass, yellow perch, rainbow trout, kokanee, mountain whitefish, bull trout, northern pikeminnow, and largescale and bridgelip suckers. The reservoir is managed primarily as a yield fishery for smallmouth bass, kokanee, and rainbow trout.
METHODS
Fish populations in Lucky Peak Reservoir were sampled with standard IDFG lowland lake sampling gears during June 1 - 4, 2009. Lucky Peak Reservoir was divided into three sections, (main reservoir, SFBR arm, and MFBR arm) for sampling to determine if differences in species assemblages existed within the reservoir (Figure 20). Sampling gear included: (1) paired gill nets, (2) trap nets, and (3) night electrofishing. Paired gill net sets included floating and sinking monofilament nets, 46 m x 2 m, with six panels composed of 19, 25, 32, 38, 51, and 64-mm bar mesh. One floating and one sinking net, fished for one night, equaled one unit of gill net effort. Trap nets possessed 15-m leads, 1-m x 2-m frames, crowfoot throats on the first and third of five loops, 19-mm bar mesh, and had been treated with black tar. One trap net fished for one night equaled one unit of trap net effort. For boat electrofishing effort, pulsed direct current was produced by a 5,000 watt generator. Frequency was set at 120 pulses/s and a pulse width of 40, which yielded an output of 5 - 6 amps. One hour of active on-time electrofishing equaled one unit of effort. In total, eight trap nets, eight gill net pairs, and one electrofishing units, composed of three 1,200 second sub-samples, were utilized during 2009.
Captured fish were identified to species, measured for total length (± 1 mm), and weighed (±1g for fish under 5,000 g or ± 10 g for fish greater than 5,000 g) with a digital scale. In the event that weight was not collected, length-weight relationships were built from fish weighed and measured in 2009 which allowed us to estimate weights of un-weighed fish. Furthermore, for those fish not weighed or measured, average weights were used to calculate biomass estimates. Relative weight, Wr, was calculated as an index of general body condition for selected species, where a value of 100 is considered average (Anderson and Neumann 1996). Values greater than 100 describe robust body condition, whereas values less that 80 indicate suboptimal body condition and suggest less than ideal foraging conditions. Standard weight values for estimation of Wr were obtained for lentic rainbow trout (Simpkins and Hubert 1996), kokanee (Hyatt and Hubert 2000), and smallmouth bass (Kolander et al. 1993). Catch data were summarized as the number of fish CPUE and the weight in kg WPUE. These indices were calculated by standardizing the catch of each gear type to one unit of effort and then summing across the three gear types.
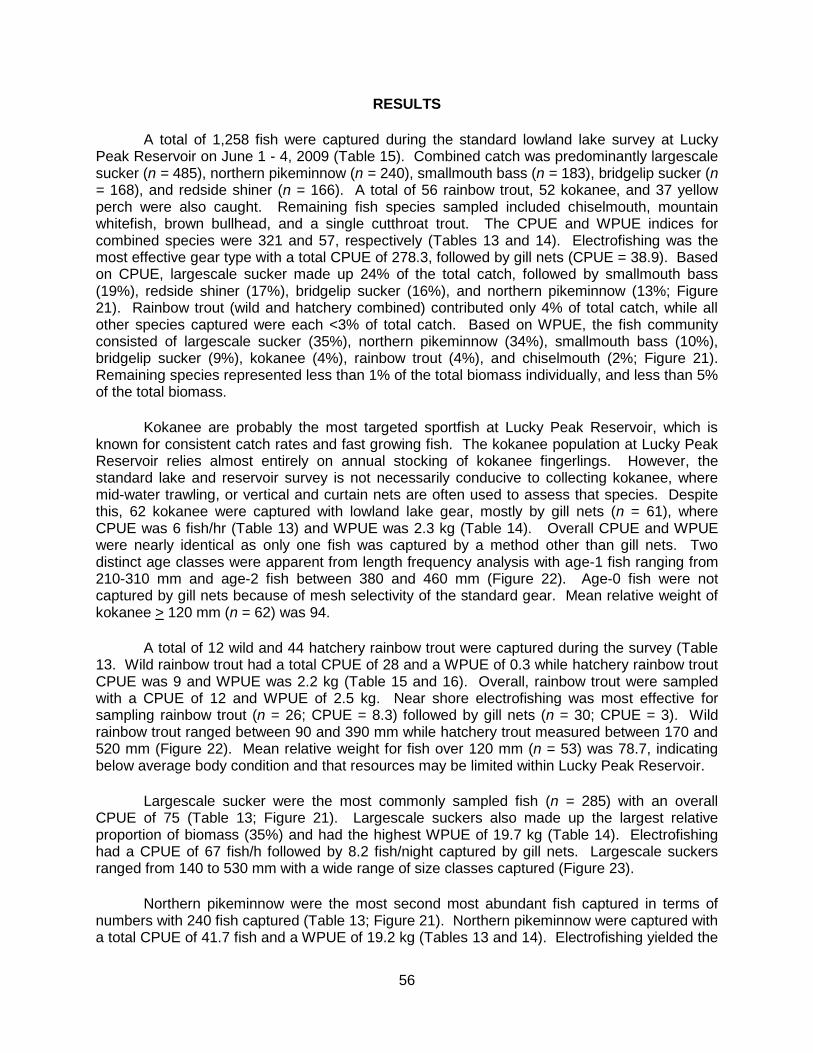
56
RESULTS
A total of 1,258 fish were captured during the standard lowland lake survey at Lucky Peak Reservoir on June 1 - 4, 2009 (Table 15). Combined catch was predominantly largescale sucker (n = 485), northern pikeminnow (n = 240), smallmouth bass (n = 183), bridgelip sucker (n = 168), and redside shiner (n = 166). A total of 56 rainbow trout, 52 kokanee, and 37 yellow perch were also caught. Remaining fish species sampled included chiselmouth, mountain whitefish, brown bullhead, and a single cutthroat trout. The CPUE and WPUE indices for combined species were 321 and 57, respectively (Tables 13 and 14). Electrofishing was the most effective gear type with a total CPUE of 278.3, followed by gill nets (CPUE = 38.9). Based on CPUE, largescale sucker made up 24% of the total catch, followed by smallmouth bass (19%), redside shiner (17%), bridgelip sucker (16%), and northern pikeminnow (13%; Figure 21). Rainbow trout (wild and hatchery combined) contributed only 4% of total catch, while all other species captured were each <3% of total catch. Based on WPUE, the fish community consisted of largescale sucker (35%), northern pikeminnow (34%), smallmouth bass (10%), bridgelip sucker (9%), kokanee (4%), rainbow trout (4%), and chiselmouth (2%; Figure 21). Remaining species represented less than 1% of the total biomass individually, and less than 5% of the total biomass.
Kokanee are probably the most targeted sportfish at Lucky Peak Reservoir, which is known for consistent catch rates and fast growing fish. The kokanee population at Lucky Peak Reservoir relies almost entirely on annual stocking of kokanee fingerlings. However, the standard lake and reservoir survey is not necessarily conducive to collecting kokanee, where mid-water trawling, or vertical and curtain nets are often used to assess that species. Despite this, 62 kokanee were captured with lowland lake gear, mostly by gill nets (n = 61), where CPUE was 6 fish/hr (Table 13) and WPUE was 2.3 kg (Table 14). Overall CPUE and WPUE were nearly identical as only one fish was captured by a method other than gill nets. Two distinct age classes were apparent from length frequency analysis with age-1 fish ranging from 210-310 mm and age-2 fish between 380 and 460 mm (Figure 22). Age-0 fish were not captured by gill nets because of mesh selectivity of the standard gear. Mean relative weight of kokanee > 120 mm (n = 62) was 94.
A total of 12 wild and 44 hatchery rainbow trout were captured during the survey (Table 13. Wild rainbow trout had a total CPUE of 28 and a WPUE of 0.3 while hatchery rainbow trout CPUE was 9 and WPUE was 2.2 kg (Table 15 and 16). Overall, rainbow trout were sampled with a CPUE of 12 and WPUE of 2.5 kg. Near shore electrofishing was most effective for sampling rainbow trout (n = 26; CPUE = 8.3) followed by gill nets (n = 30; CPUE = 3). Wild rainbow trout ranged between 90 and 390 mm while hatchery trout measured between 170 and 520 mm (Figure 22). Mean relative weight for fish over 120 mm (n = 53) was 78.7, indicating below average body condition and that resources may be limited within Lucky Peak Reservoir.
Largescale sucker were the most commonly sampled fish (n = 285) with an overall CPUE of 75 (Table 13; Figure 21). Largescale suckers also made up the largest relative proportion of biomass (35%) and had the highest WPUE of 19.7 kg (Table 14). Electrofishing had a CPUE of 67 fish/h followed by 8.2 fish/night captured by gill nets. Largescale suckers ranged from 140 to 530 mm with a wide range of size classes captured (Figure 23).
Northern pikeminnow were the most second most abundant fish captured in terms of numbers with 240 fish captured (Table 13; Figure 21). Northern pikeminnow were captured with a total CPUE of 41.7 fish and a WPUE of 19.2 kg (Tables 13 and 14). Electrofishing yielded the

57
highest CPUE (25 fish/h) of the individual capture methods followed by gill nets with a CPUE of 16 fish/night. Northern pikeminnow ranged between 70 and 580 mm, with a number of year classes present where 63% of fish were between 300 and 400 mm (Figure 23).
Smallmouth bass were the third most abundant fish species at Lucky Peak Reservoir with 183 fish captured by combined gear types (Table 13; Figure 21). All fish were collected using electrofishing and CPUE was 61 fish while WPUE was 6 kg (Table 13 and 14). Smallmouth bass ranged from 50 to 450 mm with a number of different age classes present and 80% of fish between 140 and 250 mm (Figure 22). Mean relative weight for smallmouth bass >150 mm (n=124) was 90.
DISCUSSION
Lucky Peak Reservoir contains a diverse and complex fish community, which includes kokanee, rainbow trout, smallmouth bass, and five species of non-game fish in abundant numbers. Brown bullhead, mountain whitefish, and yellow perch were also collected during the survey. Unfortunately, past surveys conducted by IDFG regional personnel were recorded in a manner that is not directly comparable to the 2009 survey. However, angler satisfaction with the fishery, particularly the kokanee fishery, appears to be high based on angler feedback.
The kokanee fishery is not subjected to the cyclical trends in size and abundance seen at many Idaho kokanee waters, largely a result of the lack of natural recruitment within the system. The population relies solely on stocking of fingerling kokanee in the spring, which for the last three to four years, has produced a reliable and stable fishery in both numbers and individual fish size. This is in contrast to the fluctuating numbers of fingerlings and fry that have been stocked into the reservoir since 2001 (Table 15). Overall, the goal is to stock approximately 200,000 fingerling kokanee into the reservoir annually. With the exception of 2008, when only fry were stocked, actual stocking has exceeded or approached the objective. Keeping numbers as close as possible to this objective appears to provide good survival and growth, as measured by both the standard survey and angler satisfaction.
The rainbow trout population within the reservoir appears to be primarily supported by hatchery fish although a number of wild fish also were observed in the survey. Anglers also express satisfaction with this fishery and catch rates, particularly in the fall. The hatchery trout stocking program at Lucky Peak Reservoir has included catchable (200 - 250 mm), fingerling (125 - 175 mm), and fry-sized (0 - 75 mm) rainbow trout (Table 13). Numbers have been highly variable among years since 2001, largely a result of inconsistent availability of catchable-sized trout within the hatchery system.
The majority of fish biomass (69%) at Lucky Peak Reservoir was comprised of largescale and bridgelip suckers (44%) and northern pikeminnow (34%; Figure 14). However, the reservoir is still producing a quality sport fishery and angler satisfaction with the reservoir is high. Although it is desirable to have sportfish contribute a greater proportion of total fish biomass, there are currently no feasible opportunities to reduce largescale sucker and northern pikeminnow abundance within the reservoir. However, given the species composition of the reservoir, stocking catchable-sized rainbow trout rather than fingerlings when available.

58
MANAGEMENT RECOMMENDATIONS
1. Continue to monitor angler satisfaction and catch rates when possible to assess status of kokanee and rainbow trout fisheries within the reservoir.
2. Resample Arrowrock Reservoir in three to five years to monitor the fish community, especially to determine whether largescale suckers and northern pikeminnow have increased in abundance or biomass.
3. Suppplement default stocking with additional catchable-sized rainbow trout when available.

59
Table 13. Catch and catch per unit effort (CPUE) statistics by species and gear type for the lowland lake survey conducted on Lucky Peak Reservoir on June 1 - 4, 2009.
Electrofish
Catch Electrofish
CPUE Gill Net Catch
Gill Net CPUE
Trap Net Catch
Trap Net CPUE
Total Catch
Total CPUE
Bridgelip Sucker
151 50 8 0.8 9 1.125 168 52 Brown Bullhead
1 0.3
3 0.375 4 0.7
Chiselmouth
22 7.3 30 3.0
52 10.3 Cutthroat Trout
1 0.1
1 0.1
Kokanee
1 0.3 61 6.1
62 6 Largescale Sucker
201 67 82 8.2 2 0.3 285 75
Mountain Whitefish
4 0.4
4 0.4 Northern Pikeminnow
75 25 158 15.8 7 0.9 240 41.7
Rainbow Trout
7 2.3 5 0.5
12 2.8 Rainbow Trout (Hatchery)
19 6 25 2.5
44 9
Redside Shiner
156 52 10 1.0
166 53 Smallmouth Bass
183 61
183 61
Yellow Perch
19 6 5 0.5 13 1.6 37 8.5 Grand Total 835 278.3 389 38.9 34 4.25 1258 321

60
Table 14. Total biomass (kg) and weight per unit effort (WPUE) statistics by species and gear type for the lowland lake survey conducted on Lucky Peak Reservoir on June 1 - 4, 2009.
Electrofish
Weight Electrofish
WPUE Gill Net Weight
Gill Net WPUE
Trap Net Weight
Trap Net WPUE
Total Weight
Total WPUE
Bridgelip Sucker
12.8 4.3 2.9 0.3 3.0 0.4 19 4.9
Brown Bullhead
0.1 0.04
0.4 0.04 0.5 0.1 Chiselmouth
1.7 0.6 5.5 0.6
7.2 1.1
Cutthroat Trout
0.3 0.03
0.3 0.03 Kokanee
0.2 0.1 23 2.3
22.9 2
Largescale Sucker
43.7 14.6 51 5.1 1 0.1 95.1 19.7 Mountain Whitefish
1.5 0.2
1.5 0.2
Northern Pikeminnow
28.8 9.6 3.5 0.3 73.9 9.2 106.2 19.2 Rainbow Trout
0.4 0.1 1.8 0.2
2.1 0.3
Rainbow Trout (Hatchery)
3.6 1 10.3 1.0
14 2.2
Redside Shiner
0.9 0.3 0.4 0.04
1 0.3 Smallmouth Bass
17.1 6
17 5.7
Yellow Perch
0.8 0.3 0.7 0.1 1.2 0.1 2.7 0.5 Grand Total 110 37 100 10 79 10 289 57
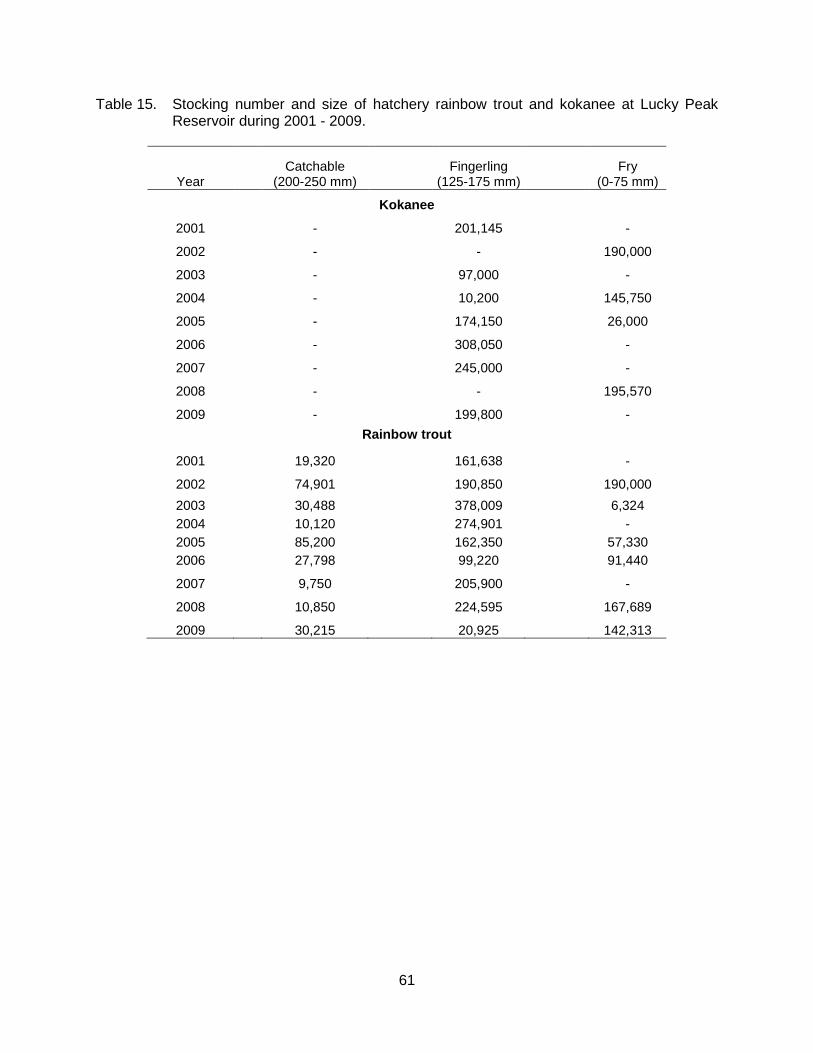
61
Table 15. Stocking number and size of hatchery rainbow trout and kokanee at Lucky Peak Reservoir during 2001 - 2009.
Catchable (200-250 mm)
Fingerling
(125-175 mm)
Fry
(0-75 mm) Year
Kokanee
2001
-
201,145
-
2002
-
-
190,000
2003
-
97,000
-
2004
-
10,200
145,750
2005
-
174,150
26,000
2006
-
308,050
-
2007
-
245,000
-
2008
-
-
195,570
2009
-
199,800
- Rainbow trout
2001
19,320
161,638
-
2002
74,901
190,850
190,000 2003
30,488
378,009
6,324
2004
10,120
274,901
- 2005
85,200
162,350
57,330
2006
27,798
99,220
91,440
2007
9,750
205,900
-
2008
10,850
224,595
167,689
2009 30,215 20,925 142,313

62
Figure 20. Map of Lucky Peak Reservoir, Idaho showing gill-netting, trap-netting, and electroshocking transect locations during the June 1 - 4, 2009 lowland lake survey. The reservoir was stratified into 3 sections, the upper, the main, and the lower pool.

63
Spec
ies
com
posi
tion
(%)
0
5
10
15
20
25
Species
Brid
gelip
Suc
ker
Chi
selm
outh
Kok
anee
(Spp
)
Larg
esca
le S
ucke
r
Nor
ther
n P
ikem
inno
w
Rai
nbow
Tro
ut
Rai
nbow
Tro
ut (H
atch
ery)
Red
side
Shi
ner
Sm
allm
outh
Bas
s
Yello
w P
erch
0
10
20
30
CPUE
WPUE
Figure 21. Species composition (%) by catch per unit effort (CPUE) and weight per unit effort (WPUE) with combined gears for the lowland lake survey conducted on Lucky Peak Reservoir on June 1 - 4, 2009.

64
X Data
0
5
10
15
20
25
X Data
0
5
10
15
20
25
X Data
Perc
ent f
requ
ency
(%)
0
5
10
15
20
25
Total length (mm)
0 100 200 300 400 5000
5
10
15
20
25
Kokanee (n=62)
Smallmouth bass (n=183)
Yellow perch (n=37)
Wild rainbow trout (n=12)
Hatchery rainbow trout (n=44)
Figure 22. Length frequency and sample size of kokanee, hatchery and wild rainbow trout,
smallmouth bass, and yellow perch collected during the lowland lake survey at Lucky Peak Reservoir on June 1 - 4, 2009.

65
X Data
02468
1012
X Data
0
2
4
6
8
10
Perc
ent f
requ
ency
02468
101202468
1012
Total length (mm)
0 100 200 300 400 500 6000
10
20
30
Bridgelip sucker (n=168)
Chiselmouth (n=52)
Largescale sucker (n=285)
Northern pikeminnow (n=240)
Redside shiner (n=166)
Figure 23. Length frequency and sample size of bridgelip sucker, chiselmouth, largescale sucker, northern pikeminnow, and redside shiner collected during the lowland lake survey at Lucky Peak Reservoir on June 1 - 4, 2009.
66
HIGH MOUNTAIN LAKE SURVEYS
ABSTRACT
IDFG personnel conducted surveys at 30 mountain lakes in the Southwest Region in
2009. The lakes were located in the Middle Fork and North Fork of the Boise River drainages near the headwaters of the Queens River. All of the lakes surveyed were located in remote, steep country and appear to receive little use by recreationalists. Fish, amphibian, and habitat surveys were conducted at each lake. Fish were present in 11 lakes and amphibians were observed in 14 lakes. Westslope cutthroat trout were the most abundant fish species in the lakes, but golden trout O. aquabonita and rainbow x cutthroat hybrids were also present in some lakes. Gill net catch per unit effort (CPUE; fish/h) varied among lakes which contained fish and ranged from a low of 1 fish/h in Johnson Lake to a high of 25 fish/h in Glacier Lake. The mean condition factor of fish captured in all lakes was 0.93, suggesting fish are in relatively good condition. Because of the good condition of the fish in these lakes, it is recommended that current stocking practices be continued with the exception of Johnson Lake which has not responded well to past stocking efforts.
Amphibians encountered in the surveys included Columbia spotted frogs Rana pretiosa,
Western toads Bufo boreas, and long-toed salamanders Ambystoma macrodactylum. Most of the lakes where amphibians were observed do not support fish, and it is recommended that they be managed as amphibian sanctuaries.
All of the lakes surveyed were located in remote, steep country and appear to receive
little use by recreationalists.
Authors: Chris Sullivan Fishery Technician Art Butts Regional Fishery Biologist

67
OBJECTIVES
1. Describe the distribution, relative abundance, and species composition of fish and amphibian populations in high mountain lakes of the Southwest Region.
2. Assess factors affecting the distribution, relative abundance, and species composition of fish and amphibian populations in high mountain lakes including stocking strategies, habitat characteristics, and human use.
3. Provide recommendations based on survey information that can be used to manage these areas in the future.
METHODS
We conducted surveys on 30 mountain lakes in the Southwest Region between August 3 and August 7, 2009. Lakes were located in the Middle Fork and North Fork of the Boise River drainages near the headwaters of the Queens River (Figure 21; Table 16). The lakes either had not been surveyed in recent years or had never been surveyed according to IDFG records. At each lake we assessed fish and amphibian presence/absence, human use, and habitat characteristics. In lakes that were capable of supporting fish or had previous stocking history, we set Swedish type gill nets that measured 46 m long by 1.5 m deep, with 19, 25, 30, 33, 38, and 48 mm bar mesh panels. One unit of sampling effort was defined as one gill net fished overnight. All fish captured were identified to species, measured for total length (mm), and weighed (g). Fulton’s condition factor was calculated for each captured fish according to the formula (Anderson and Neumann 1996):
where W is weight (g) and L is length (mm).
Habitat surveys consisted of collecting limnological and morphological data in individual lake basins. Lake length was measured across the long axis of each lake using a laser rangefinder (Bushnell Yardage-Pro), and width measurements were recorded at ¼, ½, and ¾ distances along the length axis. Average depth was determined by taking cross-sectional measurements at three points along each width measurement transect using a hand-held sonar device (Strikemaster Polar Vision). Maximum depth was estimated as the greatest depth observed during the cross-sectional measurements. Surface water temperatures were recorded along the lake shore at one point. A visual assessment of spawning opportunity in each lake and the inlets and outlets was determined based on substrate quality, flow, and gradient.
Amphibian surveys were conducted by walking the perimeter of each lake and noting the abundance and life stages of individual species. Life stages were classified as adult, sub-adult, or larvae. Shoreline habitat adjacent to lakes including areas under logs and rocks were also inspected to detect hidden amphibians.
Human use of mountain lakes was evaluated based on general appearance of use, number and condition of campsites, number of fire rings, access trail condition and difficulty, and presence of litter. General levels of human use were categorized by IDFG personnel as rare, low, moderate, and high based on an overall visual assessment of the factors described above.

68
RESULTS AND DISCUSSION
IDFG stocking records show nine of the 30 lakes sampled had been stocked in the past 10 years and surveys confirmed fish presence in these lakes and two additional lakes that were not recently stocked. An additional 19 lakes were surveyed where fish were not present. We encountered westslope cutthroat trout, rainbow trout, and golden trout in our surveys (Table 17).
Amphibians were observed in 14 lakes, 10 of which were fishless and 4 where fish were present (Table 18). Amphibian species observed included Columbia spotted frogs, long-toed salamanders, and Western toads.
Human use in the area was generally low, but a few lakes which contained fishable populations of trout received moderate use. Campsites were only present at four of the 30 lakes, and complete or partial trail access around lakes was rare (Table 19). The long hiking distance required to reach the lakes coupled with steep, rugged terrain likely contributes to the lakes’ infrequent use.
Survey results from individual and groups of lakes are summarized below.
Browns Lake
We surveyed Brown’s Lake on August 4 - 5th, 2009. Brown’s Lake is located 13.7 km from the trailhead at an elevation of 2,523 meters. Coniferous trees cover approximately 60% of the shoreline (Table 20). The area of Browns Lake is 7.73 ha with a maximum depth of 6.9 m and an average depth of 5.3 m. Shoreline water temperature at the time of sampling was 19.4°C (Table 21). There was no trail around the perimeter of the lake, but there were two established campsites, each with a fire ring. Human use was ranked as low (Table 19).
Fish surveys consisted of two gill nets set overnight. We caught 13 westslope cutthroat trout ranging from 260 - 310 mm in total length (TL) and 7 rainbow x cutthroat trout hybrids ranging from 245 - 300 mm TL, resulting in a gill net catch per unit effort (CPUE) of 10 fish. The mean condition factor for fish captured in Browns Lake was 0.94 (Figure 20). We suspect there is natural reproduction occurring in the Browns lake because of the presence of hybrid trout and visual observations of redds. Stocking records show hybrids have not been stocked in Brown’s lake since 1980 (Table 17), making it unlikely that the hybrids observed were from those stocks.
No amphibians were observed in Browns Lake (Table 18). It is uncertain if this is the effect of an established fish population, lack of suitable amphibian habitat, or a combination of factors.
Diamond Lake
We surveyed Diamond Lake on August 5 - 6th, 2009. Diamond Lake is located 13.2 km from the trailhead at an elevation of 2,460 m. Coniferous trees cover approximately 70% of the shoreline (Table 20). The area of Diamond Lake is 0.23 ha with a maximum depth of 15.5 m and an average depth of 8.1 m. Shoreline water temperature at the time of sampling was 18.6°C (Table 21). Approximately 10% of the lake was directly accessible by trail. There were two established campsites, one with a fire ring, and human use was ranked as low (Table 19).

69
Fish surveys consisted of a single, overnight gillnet set. We caught four westslope cutthroat trout ranging from 306 - 380 mm in total length and three rainbow x cutthroat trout hybrids ranging from 307 - 310 mm TL resulting in a gill net CPUE of 7 fish. The mean condition factor for fish captured in Diamond Lake was 0.94 (Figure 20). The presence of trout fry and hybrids which have not been stocked in Diamond Lake since 1980 (Table 17) suggest natural reproduction is occurring.
No amphibians were observed in Diamond Lake (Table 18). It is uncertain if this is the effect of an established fish population, lack of suitable amphibian habitat, or a combination of factors. Surveyors reported limited refuge for amphibians from fish predators around the perimeter of the lake.
Glacier Lake
We surveyed Glacier Lake on August 4 - 5th, 2009. Glacier Lake is located 17.4 km from the trailhead at an elevation of 2,621 m. Coniferous trees cover approximately 10% of the shoreline (Table 20). The area of Glacier Lake is 0.65 ha with a maximum depth of 22 m and an average depth of 10.3 m. Shoreline water temperature at the time of sampling was 15.5°C (Table 21). There was no access trail around the lake, no established campsites, and human use was ranked as low (Table 19).
Fish surveys consisted of a single, overnight gill net set. We caught 24 golden trout ranging from 174 - 337 mm TL and one westslope cutthroat trout 315 mm TL resulting in a gill net CPUE of 25 fish. The mean condition factor for fish captured in Glacier Lake was 0.96 (Figure 20). Although spawning opportunity is limited in Glacier Lake, fingerlings observed in the outlet and the presence of westslope cutthroat trout which have not been stocked since 1970 (Table 17) suggest some natural reproduction may be occurring. Impassible barriers between Glacker Lake and The Hole Lake make fish movement between the lakes unlikely.
No amphibians were observed in Glacier Lake (Table 18). It is uncertain if this is the effect of an established fish population, lack of suitable amphibian habitat, or a combination of factors.
Hippy Lake
We surveyed Hippy Lake on August 6 - 7th, 2009. Hippy Lake is located 15.8 km from the trailhead at an elevation of 2,432 m. Coniferous trees cover approximately 10% of the shoreline (Table 20). The area of Hippy Lake is 0.52 ha with a maximum depth of 1.3 m and an average depth of 1.0 m. Shoreline water temperature at the time of sampling was 16.5°C (Table 21). There was no access trail around the lake, no established campsites, and human use was ranked as low (Table 19).
Fish surveys consisted of a single, overnight gill net set. We caught 21 westslope cutthroat trout ranging from 179 - 337 mm TL resulting in a gill net CPUE of 21 fish. The mean condition factor for fish captured in Hippy Lake was 0.98 (Figure 20). Hippy Lake has not been stocked (Table 17) and fish likely migrated into the lake via the outlets from Johnson Lake or The Hole Lake. The inlet stream possesses spawning habitat, but the shallow depth of Hippy Lake could prevent overwintering. Surveyors observed seven adult and 27 larval-stage Columbia spotted frogs (Table 18).

70
Island Lake
We surveyed Island Lake on August 5 - 6th, 2009. Island Lake is located 17.5 km from the trailhead at an elevation of 2,692 m. Coniferous trees cover approximately 10% of the shoreline (Table 20). The area of Island Lake is 0.21 ha with a maximum depth of 4.7 m and an average depth of 2.9 m. Shoreline water temperature at the time of sampling was 19.3°C (Table 21). There was no access trail around the lake, no established campsites, and human use was ranked as low (Table 19).
Fish surveys consisted of a single, overnight gill net set. We caught eight westslope cutthroat trout ranging from 247 - 306 mm TL resulting in a gill net CPUE of 8 fish. The mean condition factor for fish captured in Island Lake was 1.04 (Figure 20). The lake was last stocked with grayling in 2006 and cutthroat in 1984 (Table 17). Surveys documented no visible spawning habitat, fry, or fingerlings, and suggests the fish present probably migrated to Island Lake via the outlet from Snowbank Lake.
Surveyors observed one adult Western toad (Table 18). It is unknown if the lack of other amphibians is the effect of an established fish population, lack of suitable amphibian habitat, or a combination of factors.
Johnson Lake
We surveyed Johnson Lake on August 6 - 7th, 2009. Johnson Lake is located 15.5 km from the trailhead at an elevation of 2,463 m. Coniferous trees cover approximately 10% of the shoreline (Table 20). The area of Johnson Lake is 1.54 ha with a maximum depth of 3.9 m and an average depth of 2.9 m. Shoreline water temperature at the time of sampling was 17.5°C (Table 21). A trail was present around the entire lake. There were two established campsites, one with a fire ring, and human use was ranked as moderate (Table 17).
Fish surveys consisted of a single, overnight gill net set. We caught one westslope cutthroat trout that was 217 mm TL resulting in a gill net CPUE of one fish. The reasons for low fish abundance are unclear as Johnson Lake receives regular stocking of cutthroat trout by IDFG and appears large and deep enough to support overwintering (Table 17).
Surveyors observed two adult Columbia spotted frogs (Table 18). The low abundance of amphibians in Johnson Lake could be the result of an established fish population, lack of suitable amphibian habitat, or a combination of factors.
Little Scenic Lake
We surveyed Little Scenic Lake on August 3 - 4th, 2009. Little Scenic Lake is located 12.2 km from the trailhead at an elevation of 2,521 m. Coniferous trees cover approximately 35% of the shoreline (Table 20). The area of Little Scenic Lake is 0.13 h with a maximum depth of 9.1 m and an average depth of 7.0 m. Shoreline water temperature at the time of sampling was 16.7°C (Table 21). A trial was present around the entire lake. There were two established campsites, one with a fire ring, and human use was ranked as moderate (Table 19).
Fish surveys consisted of a single, overnight gill net set. We caught 17 westslope cutthroat trout ranging from 182 - 325 mm TL and two rainbow x cutthroat hybrid trout, resulting in a gill net CPUE of 19 fish. The mean condition factor for fish captured in Little Scenic Lake

71
was 0.8 (Figure 22). The presence of hybrids which have not been stocked in Little Scenic Lake since 1981 (Table 17), and the presence of trout fry suggest natural reproduction is occurring.
No amphibians were observed in Little Scenic Lake (Table 18). It is uncertain if this is the effect of an established fish population, lack of suitable amphibian habitat, or a combination of factors.
Scenic Lake
We surveyed Scenic Lake on August 3 - 4th, 2009. Scenic Lake is located 12.8 km from the trailhead at an elevation of 2,557 m. Coniferous trees cover approximately 15% of the shoreline (Table 20). The area of Scenic Lake is 0.22 ha with a maximum depth of 19.2 m and an average depth of 12.5 m. Shoreline water temperature at the time of sampling was 18.0°C (Table 21). Approximately 30% of the lake was directly accessible by trail. There were no established campsites, and human use was ranked as low (Table 19).
Fish surveys consisted of two gill nets set overnight. We caught 32 westslope cutthroat trout ranging from 227 - 380 mm TL and seven rainbow x cutthroat hybrid trout ranging from 282 - 332 mm TL resulting in a gill net CPUE of 19.5 fish. The mean condition factor for fish captured in Scenic Lake was 0.93 (Figure 20). Scenic lake has not been stocked since 1991 (Table 17), suggesting the fish present are likely a result of natural reproduction which is occurring in the lake.
No amphibians were observed in Scenic Lake (Table 18). It is uncertain if this is the effect of an established fish population, lack of suitable amphibian habitat, or a combination of factors.
Snowbank Lake
We surveyed Snowbank Lake on August 5 - 6th, 2009. Snowbank Lake is located 17.9 km from the trailhead at an elevation of 2,702 m. Coniferous trees cover approximately 5% of the shoreline (Table 20). The area of Snowbank Lake is 0.51 ha with a maximum depth of 11.1 m and an average depth of 7.1 m. Shoreline water temperature at the time of sampling was 20.3°C (Table 21). There was no access trail around the lake, no established campsites, and human use was ranked as low (Table 19).
Fish surveys consisted of a single, overnight gill net set. We caught 14 westslope cutthroat trout ranging from 242 - 312 mm TL resulting in a gill net CPUE of 14 fish. The mean condition factor for fish captured in Snowbank Lake was 0.89 (Figure 20). These results are consistent with the stocking history at Snowbank Lake which has been stocked every three years with cutthroat trout fry since 1999 (Table 17).
No amphibians were observed in Snowbank Lake (Table 18). It is uncertain if this is the effect of an established fish population, lack of suitable amphibian habitat, or a combination of factors.
The Hole Lake
We surveyed The Hole Lake on August 4 - 5th, 2009. The Hole Lake is located 18.2 km from the trailhead at an elevation of 2,558 m. Coniferous trees cover approximately 40% of the

72
shoreline (Table 20). The area of The Hole Lake is 0.38 ha with a maximum depth of 5.6 m and an average depth of 4.7 m. Shoreline water temperature at the time of sampling was 19.7°C (Table 21). There was no access trail around the lake, no established campsites, and human use was ranked as moderate (Table 19).
Fish surveys consisted of a single, overnight gill net set. We caught 11 westslope cutthroat trout ranging from 224 - 353 mm TL and a golden trout that was 267 mm TL, resulting in a gill net CPUE of 12 fish. The mean condition factor for fish captured in The Hole Lake was 1.07 (Figure 20). The cutthroats are likely the remnants of fry which have been stocked every three years since 1999 (Table 17), and the golden trout probably migrated down the outlet from Glacier Lake.
Surveyors observed five adult Columbia spotted frogs and one adult Western toad (Table 18). The low abundance and diversity of amphibians could be the result of an established fish population, lack of suitable amphibian habitat, or a combination of factors.
Triangle Lake
We surveyed Triangle Lake on August 5 - 6th, 2009. Triangle Lake is located 13.9 km from the trailhead at an elevation of 2,520 m . Coniferous trees cover approximately 65% of the shoreline (Table 20). The area of Triangle Lake is 0.51 ha with a maximum depth of 10.8 m and an average depth of 6.4 m. Shoreline water temperature at the time of sampling was 19.1°C (Table 21). Approximately 30% of the lake was directly accessible by trail. There were no established campsites, and human use was ranked as rare (Table 19).
Fish surveys consisted of a single, overnight gill net set. We caught five westslope cutthroat trout ranging from 230 - 320 mm TL and six rainbow x cutthroat hybrid trout ranging from 220 - 300 mm TL resulting in a gill net CPUE of 11 fish. The mean condition factor for fish captured in Triangle Lake was 0.78 (Figure 20). The presence of hybrids, which have not been stocked in Triangle Lake since 1981 (Table 17), suggests natural reproduction is occurring.
No amphibians were observed in Triangle Lake (Table 18). It is uncertain if this is the effect of an established fish population, lack of suitable amphibian habitat or a combination of factors. Visual surveys indicated there was no shoreline cover for amphibians to hide from fish.
Unnamed Lakes
A total of nine unnamed lakes were sampled during August 4 - 6th, 2009. These lakes ranged in elevation from 2,399 - 2,710 m and 0.13 - 0.78 ha in size. All of the lakes were shallow with maximum depths rarely exceeding 2.0 m, and one basin was dry. Surface temperatures ranged from 16.4 - 22.4°C (Table 21). Human use was ranked as low at all unnamed lakes because no campsites, trails, or other signs of human use were observed (Table 19).
Fish were not observed in any of the lakes, but amphibians were present in 4 of the 9 lakes (Table 18). Long-toed salamanders were abundant in lake #1151513439236, where 60 sub-adults and three larval-stage salamanders were observed. Long-toed salamanders were also present in lake #1151405439243, where 6 sub-adults were observed. An adult Columbia spotted frog was observed in lake #1151200439039, and an adult Western toad was observed in lake #1151416439290.

73
Queens River Lakes (QRL)
(QRL #6, QRL #7, QRL #8, QRL #9, QRL #14, QRL #15, QRL #16)
Seven of the numbered Queens River Lakes were sampled during August 4 - 6th, 2009. These lakes ranged in elevation from 2,425 - 2,716 m and 0.1 - 4.89 ha in size. Maximum depth ranged from 3.7 - 13.7 m and average depths ranged from 2.1 - 8.8 m. Surface temperatures ranged from 18.0 - 20.6°C (Table 21). Human use was ranked as low at all Queen’s River Lakes because no campsites, trails, or other signs of human use were observed (Table 19).
Stocking records show no fish have been stocked in the Queens River Lakes we surveyed (Table 17). Fish were not observed in any lakes, but amphibians were present in three of the seven lakes (Table 18). Low densities of adult and sub-adult Columbia spotted frogs were observed in QRL #7 and QRL #8. Long-toed salamanders were present in QRL #16, where five sub-adults were observed.
Johnson Creek Ponds (JCP)
(JCP #1, JCP #3 upper, JCP #3 lower)
Three lakes in the headwaters of Johnson Creek were sampled on August 6th, 2009. These lakes ranged in elevation from 2,448 - 2,451 m and 0.16 - 0.28 ha in size. Maximum depth ranged from 0.9 - 1.5 m, and surface temperatures ranged from 14.5 - 17.4°C (Table 21). Human use was ranked as low at all Johnson Creek Ponds because no campsites, trails, or other signs of human use were observed (Table 19).
Stocking records show no fish have been stocked in the Johnson Creek Ponds and visual surveys confirmed the absence of fish (Table 17). Amphibians were present in all three lakes. Survey results showed numerous adult and larval-stage Columbia spotted frogs were present in all three lakes and two adult Western toads were observed in JCP #1 (Table 18).
MANAGEMENT RECOMMENDATIONS
With the exception of Johnson Lake, the lakes in the headwaters of the Queen’s River drainage have responded well to current management. Several lakes have been stocked with cutthroat trout on one or two year rotations and the presence of fish in these lakes indicates overwinter survival is occurring. Although the presence of fry, fingerling, and cutthroat-rainbow hybrids in many of the lakes indicates that natural reproduction is occurring, it is recommended to continue stocking these lakes to maintain healthy fisheries. The relatively good condition of the fish surveyed indicates that stocking additional fish is not overwhelming the food resources in these lakes, and current stocking rates can be maintained. Johnson Lake has been stocked with cutthroat trout every two years since 1999, but our survey results indicated low fish densities in this lake. Stocking of Johnson Lake should either be stopped completely, or more fish should be stocked annually to bolster fish densities.
We surveyed 19 fishless lakes in the Queen’s river drainage. Most of these lakes lacked good fish habitat, but supported amphibian populations. These lakes should be managed as amphibian sanctuaries in an effort to maintain the abundance and diversity of these species.

74
Table 16. Lake locations according to the World Geodetic System (WGS 84) datum surface. Map numbers refer to individual water bodies in Figure 21.
Lake name / LLID # Map # Latitude Longitude 1151200439039 29 43.90390 -115.12003 1151214439048 27 43.90482 -115.12140 1151360439220 28 43.92309 -115.13836 1151369438975 22 43.89751 -115.13692 1151386439253 15 43.92529 -115.13856 1151405439243 14 43.92430 -115.14046 1151416439290 10 43.92899 -115.14156 1151462439256 13 43.92561 -115.14624 1151513439236 19 43.92361 -115.15133 Browns Lake 9 43.93211 -115.14441 Diamond Lake 11 43.92709 -115.15548 Glacier Lake 8 43.94373 -115.13154 Hippy Lake 3 43.94756 -115.14279 Island Lake 6 43.94722 -115.12405 Johnson Creek Pond # 1 4 43.94635 -115.15243 Johnson Creek Pond # 3 (lower) 30 43.94600 -115.13902 Johnson Creek Pond # 3 (upper) 1 43.94601 -115.13900 Johnson Lake 5 43.94681 -115.14442 Little Scenic Lake 20 43.90233 -115.14723 Queens River Lake # 14 17 43.92482 -115.13028 Queens River Lake # 15 16 43.92583 -115.13241 Queens River Lake # 16 18 43.92311 -115.13836 Queens River Lake # 6 24 43.89808 -115.12492 Queens River Lake # 7 25 43.90275 -115.12252 Queens River Lake # 8 26 43.90317 -115.12520 Queens River Lake # 9 23 43.89927 -115.13514 Scenic Lake 21 43.89991 -115.14344 Snowbank Lake 7 43.94722 -115.12405 The Hole Lake 2 43.94658 -115.12943 Triangle Lake 12 43.92711 -115.15024

75
Table 17. Fish stocking data from lakes where fish were observed during 2009 surveys. The last year each species was stocked in a given lake is listed, and superscript letters denote previous ten-year stocking history. Fish observed refers to species which were encountered by IDFG during surveys conducted from August 3 - 7, 2009.
Lake name Map # Cutthroat Golden Rainbow/Cutthroat hybrid Grayling Fish observed
Browns Lake 9 20081 - 1980 - Cutthroat & hybrid
Diamond Lake 11 20082 - 1980 - Cutthroat & hybridGlacier Lake 8 1970 20082 - - Cutthroat & golden
Hippy Lake 3 - - - - Cutthroat
Island Lake 6 1984 - 1981 20064 Cutthroat
Johnson Lake 5 20083 - 1981 - Cutthroat
Little Scenic Lake 20 20082 - 1981 - Cutthroat & hybrid
Scenic Lake 21 1991 - - - Cutthroat & hybrid
Snowbank Lake 7 20083 - 1981 - Cutthroat
The Hole Lake 2 20063 - 1981 - Cutthroat & golden
Triangle Lake 12 20082 - 1980 - Cutthroat & hybrid1 Fry stocked annually since 19992 Fry stocked every 2 years since 19993 Fry stocked every 3 years since 19994 Fry stocked in 2003 and 2006
Trout species
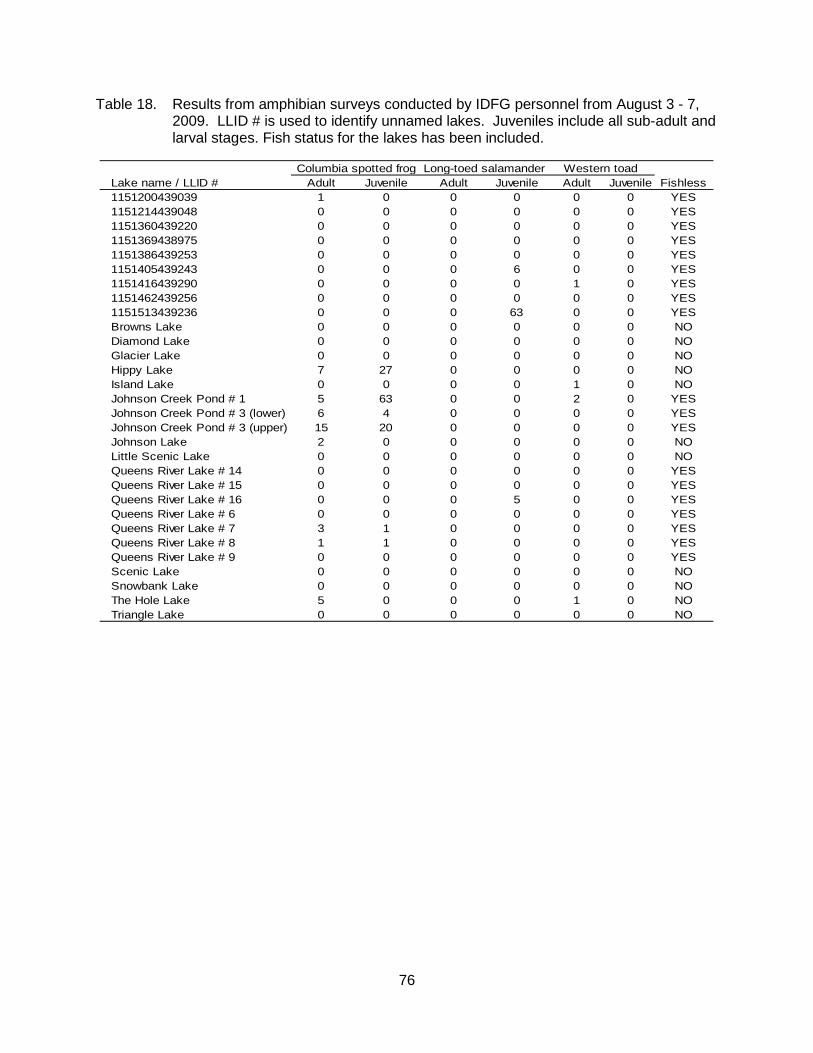
76
Table 18. Results from amphibian surveys conducted by IDFG personnel from August 3 - 7, 2009. LLID # is used to identify unnamed lakes. Juveniles include all sub-adult and larval stages. Fish status for the lakes has been included.
Lake name / LLID # Adult Juvenile Adult Juvenile Adult Juvenile Fishless1151200439039 1 0 0 0 0 0 YES1151214439048 0 0 0 0 0 0 YES1151360439220 0 0 0 0 0 0 YES1151369438975 0 0 0 0 0 0 YES1151386439253 0 0 0 0 0 0 YES1151405439243 0 0 0 6 0 0 YES1151416439290 0 0 0 0 1 0 YES1151462439256 0 0 0 0 0 0 YES1151513439236 0 0 0 63 0 0 YESBrowns Lake 0 0 0 0 0 0 NODiamond Lake 0 0 0 0 0 0 NOGlacier Lake 0 0 0 0 0 0 NOHippy Lake 7 27 0 0 0 0 NOIsland Lake 0 0 0 0 1 0 NOJohnson Creek Pond # 1 5 63 0 0 2 0 YESJohnson Creek Pond # 3 (lower) 6 4 0 0 0 0 YESJohnson Creek Pond # 3 (upper) 15 20 0 0 0 0 YESJohnson Lake 2 0 0 0 0 0 NOLittle Scenic Lake 0 0 0 0 0 0 NOQueens River Lake # 14 0 0 0 0 0 0 YESQueens River Lake # 15 0 0 0 0 0 0 YESQueens River Lake # 16 0 0 0 5 0 0 YESQueens River Lake # 6 0 0 0 0 0 0 YESQueens River Lake # 7 3 1 0 0 0 0 YESQueens River Lake # 8 1 1 0 0 0 0 YESQueens River Lake # 9 0 0 0 0 0 0 YESScenic Lake 0 0 0 0 0 0 NOSnowbank Lake 0 0 0 0 0 0 NOThe Hole Lake 5 0 0 0 1 0 NOTriangle Lake 0 0 0 0 0 0 NO
Columbia spotted frog Long-toed salamander Western toad

77
Table 19. Results from human use surveys conducted by IDFG personnel from August 3 - 7, 2009. The LLID # is used to identify unnamed lakes. Category for % trail access reflects the amount of the lake perimeter that was directly accessible by trail.
Lake name / LLID # Map # Human use1 # camp sites # fire rings % trail access1151200439039 29 Low 0 0 01151214439048 27 Rare 0 0 01151360439220 28 Low 0 0 01151369438975 22 Rare 0 0 01151386439253 15 Rare 0 0 01151405439243 14 Rare 0 0 01151416439290 10 Rare 0 0 01151462439256 13 Rare 0 0 01151513439236 19 Rare 0 0 0Browns Lake 9 Low 2 2 0Diamond Lake 11 Low 2 1 10Glacier Lake 8 Low 0 0 0Hippy Lake 3 Low 0 0 0Island Lake 6 Low 0 0 0Johnson Creek Pond # 1 4 Low 0 0 0Johnson Creek Pond # 3 (lower) 30 Low 0 0 0Johnson Creek Pond # 3 (upper) 1 Low 0 0 0Johnson Lake 5 Medium 2 1 100Little Scenic Lake 20 Medium 2 1 100Queens River Lake # 14 17 Rare 0 0 0Queens River Lake # 15 16 Rare 0 0 0Queens River Lake # 16 18 Rare 0 0 0Queens River Lake # 6 24 Rare 0 0 0Queens River Lake # 7 25 Rare 0 0 0Queens River Lake # 8 26 Rare 0 0 0Queens River Lake # 9 23 Rare 0 0 0Scenic Lake 21 Low 0 0 30Snowbank Lake 7 Low 0 0 0The Hole Lake 2 Medium 0 0 0Triangle Lake 12 Rare 0 0 30

78
Table 20. Elevation, trail length, and shoreline vegetation information for lakes sampled by IDFG personnel from August 3 - 7th, 2009.
Length from % Shorline Dominant Lake name / LLID # Map # Elevation (m)trailhead (km) forested tree species1151200439039 29 2,407 12.6 100 Lodgepole pine1151214439048 27 2,399 12.6 0 N/A1151360439220 28 2,730 16.8 10 Spruce1151369438975 22 2,654 13.6 0 N/A1151386439253 15 2,710 15.0 90 Spruce1151405439243 14 2,681 14.8 5 Spruce1151416439290 10 2,546 14.5 10 Fir1151462439256 13 2,657 14.4 40 Fir1151513439236 19 2,546 13.8 30 Lodgepole pineBrowns Lake 9 2,563 13.7 60 Lodgepole pineDiamond Lake 11 2,460 13.2 70 Lodgepole pineGlacier Lake 8 2,621 17.4 10 Fir Hippy Lake 3 2,432 15.8 10 N/AIsland Lake 6 2,692 17.5 10 Fir Johnson Creek Pond # 1 4 2,481 15.1 N/A N/AJohnson Creek Pond # 3 (lower) 30 2,448 16.1 5 N/AJohnson Creek Pond # 3 (upper 1 2,450 16.1 2 N/AJohnson Lake 5 2,463 15.5 10 N/ALittle Scenic Lake 20 2,521 12.2 35 N/AQueens River Lake # 14 17 2,656 16.1 40 SpruceQueens River Lake # 15 16 2,616 16.1 30 SpruceQueens River Lake # 16 18 2,716 16.6 40 SpruceQueens River Lake # 6 24 2,472 12.1 1 N/AQueens River Lake # 7 25 2,425 12.9 70 N/AQueens River Lake # 8 26 2,437 12.9 80 N/AQueens River Lake # 9 23 2,644 11.5 5 N/AScenic Lake 21 2,557 12.8 15 N/ASnowbank Lake 7 2,702 17.9 5 Fir The Hole Lake 2 2,558 18.2 40 Fir Triangle Lake 12 2,520 13.9 65 Lodgepole pine

79
Table 21. Record of maximum and mean depths, shoreline water temperature, surface area, and spawning opportunity for surveyed lakes.
Lake name / LLID # Map # Maximum Mean Water temp. (°C) Area (ha) Spawn opp.1151200439039 29 0.9 0.3 18.5 0.78 NO1151214439048 27 0.0 0.0 NA 0.00 NO1151360439220 28 0.6 NA 16.4 0.20 NO1151369438975 22 1.2 NA 19.1 0.19 NO1151386439253 15 0.2 NA 16.6 0.39 NO1151405439243 14 0.6 NA 18.0 2.33 NO1151416439290 10 0.2 NA 22.4 0.57 NO1151462439256 13 3.0 NA 19.1 0.16 NO1151513439236 19 0.4 NA 19.6 0.13 NOBrowns Lake 9 6.9 5.3 19.4 7.73 YESDiamond Lake 11 15.5 8.1 18.6 0.23 YESGlacier Lake 8 22.0 10.3 15.5 0.65 NOHippy Lake 3 1.3 1.0 16.5 0.52 YESIsland Lake 6 4.7 2.9 19.3 0.21 NOJohnson Creek Pond # 1 4 1.2 0.6 17.4 0.28 NOJohnson Creek Pond # 3 (lower 30 0.9 NA 14.5 0.27 YESJohnson Creek Pond # 3 (upper 1 1.5 NA 17.1 0.16 YESJohnson Lake 5 3.9 2.9 17.5 1.54 YESLittle Scenic Lake 20 9.1 7.0 16.7 0.13 YESQueens River Lake # 14 17 4.6 NA 18.8 0.70 NOQueens River Lake # 15 16 7.6 NA 18.0 1.49 NOQueens River Lake # 16 18 5.1 NA 18.0 0.10 NOQueens River Lake # 6 24 10.1 6.5 18.8 1.39 NOQueens River Lake # 7 25 3.5 2.8 20.6 1.35 YESQueens River Lake # 8 26 3.7 2.1 20.4 4.89 YESQueens River Lake # 9 23 13.7 8.8 18.0 1.13 NOScenic Lake 21 19.2 12.5 18.0 0.22 YESSnowbank Lake 7 11.1 7.1 20.3 0.51 NOThe Hole Lake 2 5.6 4.7 19.7 0.38 NOTriangle Lake 12 10.8 6.4 19.1 0.51 YES
Depth (m)

80
Figure 21. Lakes surveyed by IDFG personnel during August 3 - 7th, 2009. Lake names can be
found in Table 19 and are referenced by the numbers displayed above.

81
Figure 22. Mean values for Fulton’s condition factor calculated for lakes that contained fish
during 2009 surveys. Error bars represent the standard deviation of the mean. The dashed line at the value 1.0 represents the standard value for healthy fish.
0.0
0.2
0.4
0.6
0.8
1.0
1.2
1.4Co
nditi
on F
acto
r
Lake Name

82
URBAN POND LIMNOLOGICAL EVALUATIONS
ABSTRACT
Southwest regional urban ponds have become increasingly popular with anglers and families who desire nearby fishing opportunities. However, many of these ponds often have temperature or dissolved oxygen concentrations that inhibit survival of hatchery rainbow trout during the summer. We sampled 21 urban ponds located throughout the Southwest Region to determine summer water temperature, dissolved oxygen concentrations and maximum and mean depth. In addition, zooplankton ratio index (ZPR) and zooplankton quality index (ZQI) indices were also calculated for most of the ponds. Surface temperatures exceeded 19 °C at fifteen ponds and many of these ponds exceeded 19 °C throughout the entire water column. Only Veterans Pond, Lowman Pond, Marsing Pond, Settlers Pond, and both Wilson Spring ponds had surface water temperature <19 °C. Horseshoe Bend, Sadie Creek, Sego Praire, Lowman, Settlers, and Wilson Spring ponds all contained adequate dissolved oxygen (DO) concentrations throughout the entire water column whereas 13 ponds contained anoxic conditions near the bottom. Both Wilson Spring ponds, and Marsing Pond, were habitable to stocked rainbow trout throughout the water column. Temperature and DO sampling at regional urban ponds confirmed current stocking strategies at most waters. However, it revealed that during cooler summers, there may be windows in which we could continue to provide fishing opportunities by stocking trout. For example, in 2009, both Veterans and Settlers ponds could have been stocked with rainbow trout in the month of July. However, these windows of hospitable conditions may be short during the summer and bi-weekly sampling would likely need to be conducted. Author: Art Butts Regional Fishery Biologist

83
INTRODUCTION
Many local fishing opportunities in the Treasure Valley are small ponds, often located within urban areas and within easy access of many citizens. Ponds are managed by IDFG by introducing self-sustaining populations of largemouth bass and bluegill and routine stocking of catchable-sized rainbow trout. Many of these ponds were created by filling existing gravel quarries or excavating an area for the purpose of storing irrigation water for park facilities and fishing opportunities were considered a secondary benefit. As such, the design of many ponds, including size, shoreline slope, depth, and water source are not conducive to trout survival during the summer months. As public use of these waters increases, so does the priority to maximize the recreational potential of these ponds. Under the current stocking schedule, trout are not stocked in most ponds during the warm summer months of July and August, potentially reducing recreational use and harvest opportunity during that period. Because IDFG does not often participate in the planning or construction of these ponds, parameters such as depth, temperature, and oxygen levels are often unknown. Rainbow trout stocking management plans have developed over time through visual observations of ponds and measurement of surface temperatures during summer periods when water temperature and oxygen profiles are likely to inhibit survival of stocked trout. Generally, ponds are stocked with rainbow trout beginning in early spring through early June, and stocking resumes when temperatures cool again in September or October (Table 22). However, a formal evaluation of late summer temperature and oxygen profiles in urban ponds would help describe the feasibility of summer rainbow trout stocking. Assessment of urban ponds began with a small sample of ponds that appeared to be popular with local anglers in 2005 (Hebdon et al. 2008) but the majority of ponds in the region have yet to be formally evaluated.
METHODS
Sampling was conducted to determine if the respective ponds provided suitable habitat for trout during warm summer weather conditions. Sampling was conducted on 21 urban ponds located in the Treasure Valley and Lowman, Idaho between July 13th and September 2nd, 2009 (Table 25). Ponds were located in 12 different cities and ranged in size from 0.28 ha(Settlers Pond) to 14.3 ha (Sawyers Pond). Three of these ponds, Esther Simplot Pond, Sego Prairie Pond, and Sadie Creek Pond, are waters that are not yet stocked with fish nor are open to the public. These ponds are expected to open to fishing in 2010 or 2011. Maximum and mean depths (m) were estimated by measuring 3 - 5 depths along the longest axis of a pond with a Strikemaster Polar Vision® handheld digital sonar meter. Depth, D.O., and water temperature were measured at 1-m increments from the surface to the substrate at each of the ponds using a Hydrolab. Measurements were taken at the location where the maximum depth was measured. Ponds were considered to be capable of supporting trout if at some level in the water column temperatures were less than 19 oC and D.O. was ≥ 5.0 mg/l (Heimer and Howser 1990).
Zooplankton was collected using three 50 cm diameter, Wisconsin-style plankton nets with 153, 500, and 750 μm mesh. Two samples were taken per site using each net so that six zooplankton samples were collected at each station. Vertical hauls were taken from the entire water column and samples were preserved in denatured ethyl alcohol, using a 1:1 (sample volume:alcohol) ratio. Zooplankton was analyzed and indices were calculated using methods described by Teuscher (1998). The ZPR was calculated by dividing the mean zooplankton biomass in the 750 μm net by the mean biomass collected in the 500 μm net (Yule and Whaley

84
2000). The ZQI, which accounts for abundance, was calculated by multiplying the sum of the zooplankton weight collected in the 500 and 750 μm nets by the ZPR (Teuscher 1998).
RESULTS AND DISCUSSION
Mean pond depths ranged from 1.6 m at Sadie Creek Pond to 9.3 m at Quinn’s Pond (Table 25). Only nine of the ponds had average depths that were >3 m and only four of these ponds exceeded 5 m. The shallow nature of the majority of these ponds increase the likelihood that water temperatures will exceed trout tolerance levels during summer.
Most of the ponds (19) were sampled between July13th and 17th, 2009 when maximum daily air temperatures ranged from 24.2 to 37.8 °C (Figure 23). Two ponds in Kuna were sampled on September 2nd, 2009 when the maximum air temperature was 35.2 °C. Water surface temperatures ranged from 29.2 °C at Star Lane Pond to 15.7 °C at Lowman Pond. Surface temperatures exceeded 19 °C at fifteen ponds and many of these ponds exceeded 19 °C throughout the entire water column (Table 23). Only Veterans Pond, Lowman Pond, Marsing Pond, Settlers Pond, and both Wilson Spring ponds had surface water temperature <19 °C.
Dissolved oxygen concentrations varied by depth in the water column and all but Caldwell Pond #2 and Payette Greenbelt Pond contained surface oxygen concentrations >5 mg/L (Table 23). Horseshoe Bend, Sadie Creek, Sego Praire, Lowman, Settlers, and Wilson Spring ponds all contained adequate D.O. concentrations throughout the entire water column whereas 13 ponds had anoxic conditions near the bottom.
Both Wilson Spring ponds, and Marsing Pond, were habitable to stocked rainbow trout throughout the water column. Both waters are already on a stocking schedule that includes the summer months. Limnological sampling also revealed that seven ponds may have water conditions in mid-summer that are capable of supporting trout by standards developed by Heimer and Howser (1990). Esther Simplot, Quinns, Veterans, Caldwell Rotary, Eds, Sego Praire, and Settlers ponds all contained water temperatures and DO conducive to trout survival (Tables 22 and 23). Esther Simplot Pond water temperatures did not fall below 19 °C until 5-m depth at which point the DO concentration dropped to 3.2 mg/L, below values recommended for trout. Veterans Pond contained adequate temperature and DO values in the top 6-m of water, but approached anoxic conditions at greater depths. Temperature in Quinns Pond exceed 20 °C in the top six m and at greater depths, DO fell below 5 mg/L. Similarly, Ed’s Pond contained adequate DO values in the top two m, but water temperatures exceeded 20 °C. Conditions at Sego Prairie Pond, while within the limits defined by Heimer and Howser (1990), both temperature and DO were at the borderline for both variables throughout the water column. Throughout the entire water column, Settlers Pond temperature and DO profiles were within values capable of supporting rainbow trout.
Two ponds, Veterans and Settlers, are not stocked during the period between July and September/October, because water temperatures are thought to exceed physiological constraints of rainbow trout (Table 23). Sampling in July 2009 suggested that both waters would have been capable of supporting stocked trout. However, the decision to stock either pond would likely have to be made on an annual basis as summer air temperatures may often be much warmer than they were in 2009. For example, when Veteran’s Pond was measured for temperature and DO concentrations in August 2005, temperature did not fall below 19 °C until 5-m depth at which point DO was below 3 mg/L (Figure 24). It is also possible that had limnological sampling taken place in August 2009, conditions at both ponds would have
85
restricted trout stocking as both were close to exceeding trout tolerances. Maximum daily air temperatures measured during the latter part of July 2009 suggest that water temperatures would have increased during that period as well (Figure 23).
ZPR and ZQI, indices of zooplankton biomass and abundance, respectively, ranged widely between ponds (Table 23). Although availability of zooplankton likely has little influence on the survival of catchable-sized trout, it does provide insight into production and water quality of the ponds. ZPR ranged from a low of 0.1 in Caldwell Pond #2 and Wilson Springs Pond (south) to a high of 5.0 at Caldwell Pond #3. Fourteen of the ponds had ZPR indices that were < 1.0. ZQI ranged from 0.0 at Quinns, Caldwell #2, and Sawyers Pond to a high of 1.36 at Veteran’s Pond. These values are consistently low and suggest that cropping of zooplankton is occurring and food sources are likely limited.
Temperature and D.O. sampling at regional urban ponds confirmed current stocking strategies at most waters. However, it revealed that during cooler summers, there may be windows in which we could continue to provide fishing opportunities by stocking trout. For example, in 2009, both Veterans and Settlers ponds could have been stocked with rainbow trout in the month of July. However, these windows of hospitable conditions may be short during the summer and bi-weekly sampling would likely need to be conducted. Sampling also provided baseline information for three new ponds that are not yet stocked with IDFG fish. Sego Prairie Pond, in Kuna, will start being stocked in spring of 2010, while Esther Simplot Pond and Sadie Creek Pond will likely open to the public in 2011-12. Sampling at all three water bodies suggested that trout stocking during the summer period will likely be limited.

86
Table 22. City, county, surface area (ha) and stocking schedule for selected Southwest Regional urban ponds sampled during the 2009 summer.
City County Water Body Surface area
(ha) Months Stocked Boise Ada Esther Simplot Pond - -
Quinns Pond 10.0
Feb-Jun, Sept-Dec
Veterans Pond 6.5 Feb-Jun, Oct-Dec
Caldwell Canyon Caldwell Pond #2 2.4 Mar-Jun, Oct-Nov
Caldwell Pond #3 1.3 Mar-Jun, Oct-Nov
Caldwell Rotary Pond 6.5 Feb-May, Oct-Dec
Eagle Ada Eagle Island Park Pond 4.3 Feb-Jun, Oct-Dec Emmett Gem Airport Pond 4.3 -
Eds Pond 0.6 Feb-Jun, Oct-Nov
Sawyers Pond 14.3 Feb-Jun, Oct-Dec
Star Lane Pond 0.7 -
Horseshoe Bend Boise Horseshoe Bend Pond 5.1 Feb-Jun, Oct-Nov Kuna Ada Sadie Creek Pond - -
Sego Prairie Pond 0.6 Mar-Jun, Oct-Nov
Lowman Boise Lowman Pond 0.8 Apr-Oct Marsing Owhyee Marsing Pond 1.6 Jan-Dec
Meridian Ada Settlers Pond 0.3 Feb-Jun, Sept-
Dec Middleton Canyon Duff Lane Pond 2.2 Mar-June, Oct Nampa Canyon Wilson Springs Pond (N) 2.2 Jan-Dec
Wilson Springs Pond (S) 0.4 Jan-Dec
Payette Payette Payette Greenbelt Pond 2.2 Feb-Jun, Oct-Nov

87
Table 23. Sampling date, maximum and mean depths (m), temperature (°C) and dissolved oxygen concentrations (D.O.; mg/L), zooplankton productivity ratio (ZPR) and zooplankton quality index (ZQI) for urban ponds sampled in 2009 summer. Temperature and DO ranges are listed in order of surface to bottom.
Sampling Date
(2009)
Max Depth
(m)
Mean Depth
(m) Temperature Range (°C)
Dissolved O2 Range
(mg/L)
Water Body ZPR ZQI Esther Simplot Pond 17-Jul 8.3 7.8 25.3 - 10.2 10.1 - 0.2 0.22 0.6 Quinns Pond 15-Jul 9.8 9.3 27 - 13.8 8.4 - 0.7 1 0 Veterans Pond 16-Jul 7.6 6.5 18.9 - 16.1 8.2 - 0.5 0.89 1.36 Caldwell Pond #2 13-Jul 3.2 3.1 23.3 - 22.6 4.6 - 1.1 0.1 0 Caldwell Pond #3 13-Jul 2.9 2.3 22.9 - 19.5 11.1 - 0.4 5 0.24 Caldwell Rotary Pond 13-Jul 5.3 4.6 25.7 - 16.5 6.4 - 0.2 2 0.2 Eagle Island Park Pond 15-Jul 3.2 2.9 26.8 - 21.3 7.6 - 0.5 1.5 0.3 Airport Pond 14-Jul 4.3 3.6 26.2 - 19.0 7.1 - 0.4 1 0.1 Eds Pond 14-Jul 3.3 3.1 27.2 - 14.2 7.7 - 0.5 1 0.01 Sawyers Pond 14-Jul 5.8 5.4 25.4 - 20.6 6.2 - 0.2 1 0 Star Lane Pond 14-Jul 2.8 2.0 29.2 - 21.5 12.8 - 0.7 0.43 0.02 Horseshoe Bend Pond 14-Jul 3.5 2.8 23.5 - 21.7 8.3 - 6.4 1 0.01 Sadie Creek Pond 2-Sep 2.1 1.6 20.9 - 17.9 5.4 - 7.0 NC NC Sego Prairie Pond 2-Sep 3.8 2.6 22.1 - 18.0 6.6 - 5.7 NC NC Lowman Pond 14-Jul 3.0 2.7 15.7 - 12.9 10.9 - 10.2 3 0.14 Marsing Pond 15-Jul 2.7 2.3 18.9 - 18 13.1 - 6.2 0.63 0.04 Settlers Pond 16-Jul 3.7 3.6 17.1 - 16.1 7.9 - 7.7 1 0.01 Duff Lane Pond 13-Jul 2.4 2.2 25.3 - 23.9 8.2 - 3.0 1 0.02 Wilson Springs Pond (N) 13-Jul 2.4 1.9 16.5 - 16.2 11.9 - 13.4 0.33 0.01 Wilson Springs Pond (S) 13-Jul 2.4 2.2 16.6 - 15.1 11.4 - 9.1 0.1 0.02 Payette Greenbelt Pond 15-Jul 2.3 2.1 23.3 - 18.1 2.6 - 0.3 2 0.03
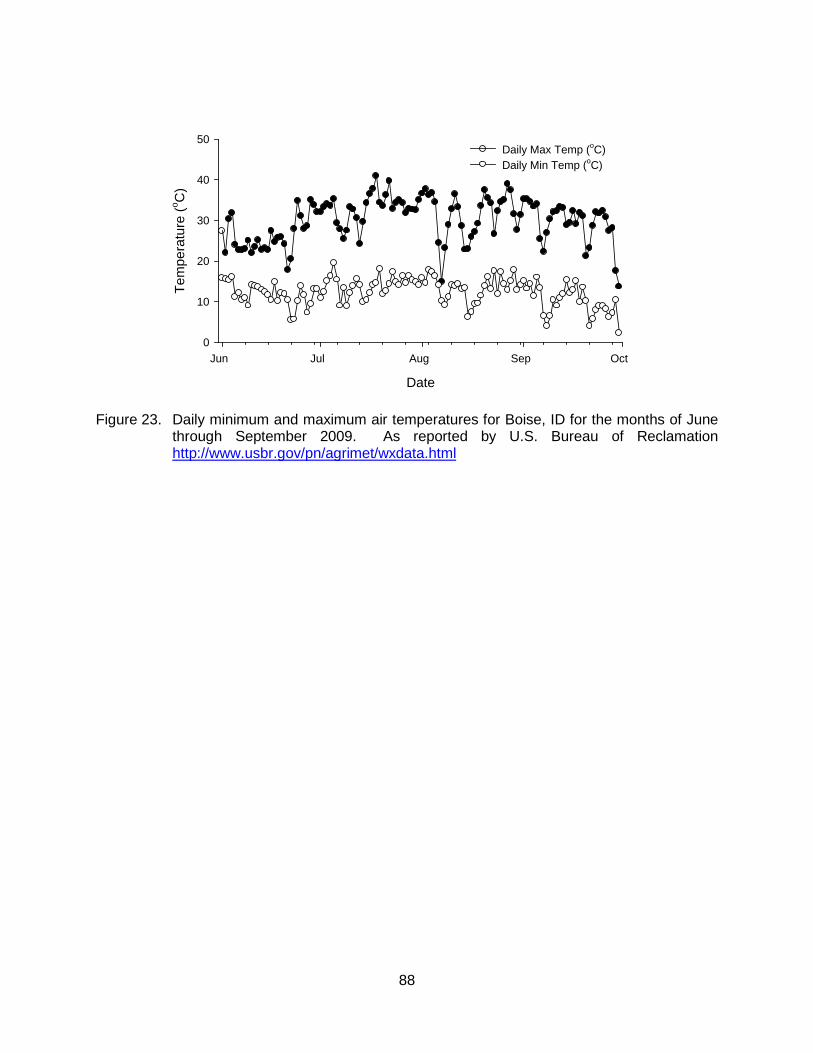
88
Date
Jun Jul Aug Sep Oct
Tem
pera
ture
(o C)
0
10
20
30
40
50Daily Max Temp (oC)Daily Min Temp (oC)
Figure 23. Daily minimum and maximum air temperatures for Boise, ID for the months of June through September 2009. As reported by U.S. Bureau of Reclamation http://www.usbr.gov/pn/agrimet/wxdata.html

89
0
2
4
6
8
0 2 4 6 8 10 12 14
0
2
4
6
80
2
4
6
8
Dep
th (m
)
0
1
2
3
4
50
1
2
30
1
2
3
4
Thin layer of suitable conditions
Thin layer of suitable conditions
Suitable
Not suitable
Not suitable
Suitable near bottom
Veterans Pond
Dissolved oxygen (mg/L)
Esther Simplot Pond
Quinns Pond
Caldwell Rotary Pond
Eds Pond
Sego Prairie Pond
Temperature (oC)
10 12 14 16 18 20 22 24 26
0
1
2
3
Temperature D.O.
Settlers Pond
Suitable
Figure 24. Vertical temperature (ºC) and dissolved oxygen (D.O.; mg/L) profiles for seven urban ponds located in the southwest region during the 2009 summer. Ponds were examined to determine if suitable conditions for hatchery trout survival existed during summer months.

90
2009 Southwest Region (Nampa) Annual Fishery Management Report
River and Stream Investigations
LOWER PAYETTE RIVER FISH POPULATION SURVEYS
ABSTRACT
Very little fish population or creel data has been collected from the lower Payette River. To gain a better understanding of fish populations in this reach, we surveyed 12 sites between Black Canyon Dam and the confluence of the Payette and Snake rivers. Surveys were completed with jet-boat electrofishing equipment. A total of 2,328 fish were sampled including 18 different species. Electrofishing CPUE for all species combined averaged 374 fish/h (± 60). For all sites combined, mountain whitefish was the most numerous species sampled and represented 39% of the CPUE, followed by largescale sucker (20%), smallmouth bass (15%), and northern pikeminnow (7%). WPUE averaged 139 kg/h ( 23). For all sites combined, six species comprised nearly 94% of the fish biomass, including common carp (27%), largescale sucker (23%), channel catfish (20%), northern pikeminnow (9%), smallmouth bass (7%), and flathead catfish Pylodictis olivaris (7%). Both indices tended to be higher at downstream sites. For smallmouth bass, the most popular game fish in the reach, mean length and weight equaled 203 mm ( 7) and 183 g ( 22), respectively. PSD equaled 32 and relative weight averaged 102, indicating balanced size structure within this population and good body condition.
Author: Joe Kozfkay Regional Fishery Biologist

91
INTRODUCTION
Historically, the lower Payette River acted as a migratory corridor for anadromous fish runs. Completion of Black Canyon Dam in 1924 extirpated these runs by blocking access to spawning areas. Additional dam construction downstream in the Snake River and subsequent fish introductions has shaped the fish community in the lower Payette River. Formerly, native salmonids, cyprinids, and catostomids were the most common species present. Now, the fish community has become dominated by non-natives, especially ictalurids and smallmouth bass, similar to other large rivers in Southwest Idaho. Very little fish population or creel data has been collected from the lower Payette River recently. However, angler reports indicate that smallmouth bass fishing has become popular with high catches possible. Due to the lack of information, we initiated an effort to gain a better understanding of the composition and distribution of fish within the lower Payette River.
OBJECTIVES
1. Describe the distribution, relative abundance, and composition of the fish community, in the lower Payette River from Black Canyon Dam to its confluence with the Snake River.
2. Establish trend monitoring sites in the lower Payette River from Black Canyon Dam to its confluence with the Snake River so that fish populations may be compared in future years.
METHODS
Black Canyon Dam, located at river kilometer (rkm) 62 was the upstream boundary of the study area for 2009 sampling efforts, whereas the confluence of the Payette and Snake rivers (rkm 0) was considered the downstream boundary. Twelve non-randomly study sites were selected within this reach (Figure 25). Sites contained readily identifiable landmarks, possessed diverse habitat types, and were well dispersed throughout the study area. These sites allowed relatively high catch rates for several species compared to simpler habitats and will allow trend monitoring for a wide variety of fish species in future years.
To capture fish, I used electrofishing gear mounted to an aluminum jet boat. Pulsed direct current was produced by a 5,000 watt generator. Frequency was set at 80 or 120 pulses per second and a pulse width of 40, which yielded an output of 5 - 6 amps. Electrofishing effort ranged from 0.23 to 0.67 h/sampling site with a mean effort of 0.52 ± 0.06 h. One netter positioned on the bow of the boat captured as many fish as possible, except common carp and largescale sucker. For these species, we attempted to collect ten individuals at each site and then counted the remainder without bringing them into the boat. At each site, one electrofishing pass was expended along or as near as possible to all river banks, including the banks of islands. Surveys were conducted from July 1st to 24th, 2009 during daylight hours. During this period, mean daily river flow measured at the U.S. Geological Survey (USGS) gauging station at Emmett, ID ranged from 62 to 95 m3/s. Water temperatures ranged from 19 - 23º C.

92
Captured fish were identified to species, measured (± 1 mm), and weighed (±1 g for fish < 5,000 g or ± 10 g for fish > 5,000 g) with a digital scale. In the event that fish weight was not determined, length-weight relationships were built from lengths and weights of fish sampled from the Payette River during 2009. Data were log transformed and linear regression was used to allow estimation of weight. PSD were calculated to describe length-frequency data for game fish populations as outlined by Anderson and Neuman (1996). Also, Wr was calculated as an index of general fish body condition, for which a value of 100 is considered average. Values greater than 100 describe robust body condition, whereas values less than 100 indicate less than ideal foraging conditions. Electrofishing effort was converted to hours to standardize CPUE and weight in kg for WPUE indices. Confidence intervals were calculated using α = 0.10. All survey and individual fish data were stored in IDFG’s standard stream survey database.
RESULTS
During 2009 Payette River sampling efforts, a total of 2,328 fish were sampled including 18 different species. Five species of game fish were sampled including mountain whitefish, smallmouth bass, channel catfish, flathead catfish, and largemouth bass. Four species of pan fish were sampled infrequently including, bluegill, black crappie, pumpkinseed L. gibbosus, and yellow perch. Most were small individuals produced presumably in Black Canyon Reservoir and entrained though the dam. Seven native, non-game species were sampled including bridgelip sucker, chiselmouth, largescale sucker, longnose dace Rhinichthys cataractae, mottled sculpin Cottus bairdii, northern pikeminnow, and redside shiner. Finally, two nonnative, non-game species were sampled, common carp, and Oriental weatherfish Misgurnus anguillicaudatus.
CPUE indices indicated that fish tended to be more numerous at downstream sites and were less numerous at upstream sites. Electrofishing CPUE for all species combined averaged 374 fish/h (± 60) for the 12 sites sampled during 2009 (Table 24). The highest total CPUE was 546 fish/h for the most downstream site (#43601), near Payette, ID. At this site, CPUE was composed predominantly of mountain whitefish (33%) and largescale sucker (29%), as well as smallmouth bass (16%). CPUE tended to decrease for upstream sites (slope = -21.3; r2 = 0.44; p = 0.02; Figure X), and the lowest CPUE of 231 fish/hr occurred one mile downstream of Emmett, ID (Site 43603). For all sites combined, mountain whitefish was the most numerous species sampled and represented 39% of the CPUE, followed by largescale sucker (20%), smallmouth bass (15%), and northern pikeminnow (7%). Channel catfish, common carp, and longnose dace represented 4% of the fish community each, whereas all other species combined equaled 6%. Overall, 61% of the fish community was composed of game fish, whereas 39% was non-game fish.
WPUE showed a trend similar to CPUE. WPUE indices indicated that biomass tended to be higher at more downstream sites and to decline at more upstream sites. WPUE for all species combined averaged 139 kg/h ( 23; Table 25). The highest total WPUE was 222 kg/h for site #43597 near the mouth of Willow Creek (RM 8.4). At this site, WPUE was composed predominantly of channel catfish (46%), common carp (25%), largescale sucker (17%), and smallmouth bass (10%). For all sites combined, six species composed nearly 94% of the fish biomass, including common carp (27%), largescale sucker (23%), channel catfish (20%), northern pikeminnow (9%), smallmouth bass (7%), and flathead catfish (7%). Overall, 39% of the WPUE or biomass was composed of game fish, whereas 61% was non-game fish.
In this section of the Payette River, most angling effort is directed towards smallmouth bass and to a lesser extent channel catfish. For smallmouth bass, we sampled a total of 350

93
individuals, with a mean length and weight of 203 mm ( 7) and 183 g ( 22), respectively (Figure 26). PSD equaled 32, calculated from 56 quality length (280 mm) fish and 177 stock length fish (180 mm). Relative weight, for the 253 smallmouth bass over 150 mm, averaged 102, indicating good body condition. CPUE averaged 55 fish/hr ( 14). CPUE tended to be higher in the lower portion of the study area with the 4 highest catch rates occurring at or downstream of rkm 26.4. For channel catfish, we sampled a total of 104 individuals, with a mean length and weight of 562 mm ( 8) and 1,876 g ( 95), respectively (Figure 27). PSD equaled 100, with all fish exceeding the 410 mm quality length criteria. Relative weight averaged 100, indicating good body condition. CPUE averaged 15.2 fish/hr ( 7). CPUE for channel catfish showed a distinct trend with higher catch rates in the lower portion of the study area and low catch rates at upstream sites. For instance, for the four sites near or upstream of Emmett, ID CPUE averaged 5 fish/h, whereas CPUE for the four most downstream sites averaged 26 fish/h.
DISCUSSION
Fish populations within the lower Payette River showed longitudinal trends in numbers and biomass with more fish and higher biomass in downstream areas compared to lower numbers and biomass in upstream areas. These results are at least partially caused by the sediment and nutrient trapping functions of Black Canyon Reservoir leading to low productivity in upstream areas. Moving downstream, tributary streams in this reach add nutrients and increase productivity. Furthermore, fish movement from the lower Snake River into the lower segment of this reach most likely positively influenced catch and biomass indices. Smallmouth bass and channel catfish populations, the two most-sought sport fish in this reach, appeared to be in good condition. Smallmouth bass were found in a wide range of lengths, including some large individuals, and were in good condition. Channel catfish were similarly in good condition and large fish were common; however, no small fish were found indicating that spawning probably does not occur in this reach or that channel catfish do not use the lower Payette as a nursery area.
There are at least four major irrigation diversion dams in this reach of the lower Payette River. Seasonal movements for some fish species may be hampered by these diversion dams. For instance the diversion dam immediately upstream of Highway 95 likely acts as a barrier to upstream movement of flathead catfish as few fish were sampled at sites upstream of this dam despite the presence of useable habitat. Similar blockages, at least seasonally, are likely occurring for other species.
Most fishing effort on the lower Payette River appears to be expended by boat anglers fishing from small jet boats or from non-motorized craft as most of this river segment is bordered by private property. There are several boat launching access points in the upper and lower sections of this reach. However, there is currently a large access gap in the middle portion of this reach. Securing a publicly accessible boat launching site near Letha Bridge would improve fishing access to the lower Payette River.

94
MANAGEMENT RECOMMENDATIONS
1. Use this survey information and trend sites as baseline information for future trend monitoring efforts.
2. Secure a publicly accessible boat site near Letha Bridge. Currently, there is no access between Faulk Bridge (rkm 29) and access points in the city of Emmett, ID (rkm 54), a distance of 25 km. A gap in access of this magnitude likely negates boating and float traffic within the middle segment of this reach.

95
Table 24. Electrofishing catch per unit effort indices (fish/hr) for 12 sites surveyed on the Lower Payette River during 2009. Species names were abbreviated as mountain whitefish (MWF), smallmouth bass (SMB), channel catfish (CAT), flathead catfish (FLT), yellow perch (YLP), black crappie (BCR), bluegill (BLG), pumpkinseed (PKS), largemouth bass (LMB), largescale sucker (LSS), northern pikeminnow (NPM), longnose dace (LND), common carp (CRP), bridgelip sucker (BLS), chiselmouth (CSL), redside shiner (RSS), mottled sculpin (MSC), and Oriental weatherfish (OWF).
Site ID # River Km
Effort (hours) MWF SMB CAT FLT YLP BCR BLG PKS LMB LSS NPM LND CRP BLS CLS RSS MSC OWF
43601 3.4 0.45 174.5 85.0 17.9 8.9 2.2 2.2 2.2 156.6 8.9 20.1 55.9 11.2 43602 6.1 0.67 93.9 43.2 23.9 14.9 1.5 1.5 3.0 165.5 6.0 8.9 14.9 7.5 43597 13.5 0.61 212.1 119.1 50.6 44.0 8.2 29.4 24.5 13.0 1.6 43596 20.0 0.47 184.9 63.8 10.6 2.1 2.1 161.5 25.5 4.3 23.4 10.6 19.1 43598 26.4 0.63 350.2 65.0 20.6 3.2 3.2 17.4 4.8 22.2 4.8 1.6 6.3 1.6
43599 34.4 0.55 125.7 21.9 14.6 29.1 12.8 29.1 3.6 9.1 7.3 38.3 43600 38.9 0.51 74.8 55.1 5.9 19.7 33.5 5.9 35.4 2.0 43604 43.1 0.59 133.5 35.5 18.6 22.0 22.0 40.6 11.8 5.1 1.7 43603 52.0 0.44 43.1 20.4 2.3 2.3 47.6 88.5 4.5 2.3 2.3 43605 55.8 0.59 101.6 54.2 8.5 71.1 16.9 42.3 11.8 3.4 1.7 3.4 20.3 43594 58.1 0.23 100.6 43.7 4.4 135.6 65.6 4.4 13.1 17.5 4.4 4.4 43592 60.7 0.46 136.0 59.2 4.4 13.2 37.3 30.7 2.2 4.4

96
Table 25. Electrofishing weight per unit effort indices (kg/hr) for 12 sites surveyed on the Lower Payette River during 2009. Species names were abbreviated as mountain whitefish (MWF), smallmouth bass (SMB), channel catfish (CAT), flathead catfish (FLT), yellow perch (YLP), black crappie (BCR), bluegill (BLG), pumpkinseed (PKS), largemouth bass (LMB), largescale sucker (LSS), northern pikeminnow (NPM), longnose dace (LND), common carp (CRP), bridgelip sucker (BLS), chiselmouth (CSL), redside shiner (RSS), mottled sculpin (MSC), and Oriental weatherfish (OWF).
Site ID # River Km
Effort (hours) MWF SMB CAT FLT YLP BCR BLG PKS LMB LSS NPM LND CRP BLS CLS RSS MSC OWF
43601 3.4 0.45 0.1 11.3 31.7 44.5 0.4 0.01 0.02 32.5 1.1 81.0 3.0 0.7 43602 6.1 0.67 6.5 37.4 59.9 0.2 0.02 0.01 13.4 2.4 22.4 0.7 0.6 43597 13.5 0.61 0.1 23.2 102.0 37.8 0.6 55.5 1.2 1.0 0.03 43596 20.0 0.47 1.5 11.8 17.0 13.1 0.2 25.7 20.1 0.004 63.0 3.7 1.6 43598 26.4 0.63 4.4 13.9 37.2 0.4 0.1 27.5 1.4 0.02 18.2 2.4 0.7 0.02
43599 34.4 0.55 5.2 3.6 29.7 17.5 0.7 0.03 12.6 2.3 0.5 0.09 43600 38.9 0.51 2.9 11.4 10.4 28.3 14.7 0.01 64.6 2.8 43604 43.1 0.59 5.9 4.7 34.9 18.4 15.4 0.02 55.3 0.1 0.1 43603 52.0 0.44 10.4 5.2 3.8 0.01 34.9 44.5 0.005 11.8 0.05 43605 55.8 0.59 7.7 15.5 19.0 18.4 6.6 0.02 32.2 2.4 0.002 0.01 0.1 43594 58.1 0.23 14.6 5.5 7.8 87.2 19.7 0.02 40.8 1.0 0.9 0.02 43592 60.7 0.46 21.4 7.5 10.9 0.3 48.7 16.1 0.01 0.2

97
Figure 25. Locations of 12 sites used to survey fish populations in the lower Payette River
during 2009.
Bissel Creek 43602
43597
43596 43598
Big Willow Creek
Black Canyon Reservoir
43600 43599
43594
43604
43601
Little Willow Creek
43605 43603
43592
Snake River
Payette River
Area of Detail

98
Figure 26. Length frequency of smallmouth bass (n = 350) in the lower Payette River during
2009 survey efforts, all sites combined.
0
5
10
15
20
25
30
35
0-9
20-29
40-49
60-69
80-89
100-109
120-129
140-149
160-169
180-189
200-209
220-229
240-249
260-269
280-289
300-309
320-329
340-349
360-369
380-389
400-409
420-429
440-449
460-469
480-489Fr
eque
ncy
Length Interval (mm)

99
Figure 27. Length frequency of channel catfish (n = 104) in the lower Payette River during
2009 survey efforts, all sites combined.
0
2
4
6
8
10
12
14
0-920-2940-4960-6980-89100-109120-129140-149160-169180-189200-209220-229240-249260-269280-289300-309320-329340 -349360-369380-389400-409420-429440-449460-469480-489500-509520-529540-549560-569580-589600-609620-629640-649660-669680-689
Freq
uenc
y
Length Interval (mm)

100
LONG-TERM MONITORING OF REDBAND TROUT POPULATIONS IN DESERT BASINS OF THE BRUNEAU, OWYHEE, AND SNAKE RIVER DRAINAGES IN SOUTHWESTERN IDAHO
ABSTRACT
As part of a long-term redband trout O. mykiss gairdneri monitoring effort, IDFG and
BLM personnel agreed to sample 63 stream sites within the Bruneau, Owyhee, and Snake river drainages from 2008-2010. During 2009, we completed 11 fish population surveys near South and Juniper mountains in the Middle Fork Owyhee, North Fork Owyhee, Owyhee, and Deep Creek drainages. Redband trout were captured at 9 of the 11 sites. In the streams containing redband trout, average redband trout density equaled 58 ± 40 trout/100 m2 of stream (mean ± 90% CI). Capture probability for larger and smaller redband trout were nearly equal. For fish less than 100 mm, capture probability was 82%. For fish greater than or equal to 100 mm, capture probability was 80%. For all the 2009 sites combined, a total of 616 were sampled, and overall, 65% of the fish sampled were less than 100 mm, whereas 35% were greater or equal to 100 mm. In the small sub-set of sampling sites with previous data, redband trout populations seemed stable. Author: Joe Kozfkay Regional Fishery Biologist

101
INTRODUCTION
Redband trout are native to all major river drainages in Southwestern Idaho. Within this large and diverse geographical area, redband trout have adapted to a variety of stream habitats including those of montane and desert areas. Some controversy has existed regarding whether adaptation to these disparate habitats has led to speciation at some level. Recently, those redband trout that reside in desert locales were petitioned for listing under the ESA, under the assumption that they could be considered a separate sub species. The petition was denied. Since that time, additional research has indicated that only one species of resident stream dwelling redband trout may exist in Southwest Idaho (Cassinelli 2008). Regardless of species designations, it is important to monitor redband trout population status across their full distribution. Population status of the redband trout from montane habitats has been extensively studied in Southwestern Idaho. However, due to remoteness and little angling interest, the redband trout from desert habitats has received less attention. These habitats include tributaries of the Bruneau, Owyhee, and Snake River drainages most often in headwater areas. As these populations are near the southern extent of their range and water temperatures are projected to increase, it has become especially important to monitor these populations closely.
A long-term assessment of redband trout distribution, density, and size structure was completed by Zoellick et al. (2005). This assessment compared redband population characteristics at 43 sites within the Bruneau, Owyhee, and Snake river drainages from 1993-2003 to data collected at the same sites during 1977 - 1982. Site numbers referred to in this report correspond to the site numbers in Zoellick et al. (2005). As a continuation of this effort and to establish trend data for these populations, IDFG and BLM personnel agreed to resample these 43 sites over a three-year period beginning in 2008. Also, an additional 20 sites were added to more fully encompass the redband trout’s distribution in the high desert environs of Southwest Idaho.
METHODS
Multiple-pass depletion methods were used to estimate fish population characteristics at all sites. Previously-sampled sites were located using descriptions, photographs, or coordinates. Block nets were installed at the upstream and downstream end of each transect. Fish capture efforts utilized a Smith Root backpack electrofisher (Model 15-B) and a two- or three-person crew each of which was equipped with a dip net. Captured fish were held in small buckets and transferred to a livewell placed downstream of the site. Capture efforts focused on redband trout, but non-game species were also captured, identified, and visually categorized as sparse (1 - 10), many (10 - 50), or abundant (>50). The number of passes completed depended on catch during the first pass. If redband catch in the first pass was less than five, sampling was terminated. If more than five redband trout were sampled, a second pass was completed. If catch remained relatively high in subsequent passes (> 25% of the previous pass) additional passes were completed. Also, herpetofauna were identified visually to species and recorded as eggs, larval form, juvenile, or adult. We sampled 11 sites during 2009 in tributaries and the mainstems of the North Fork Owyhee, Middle Fork Owyhee and Owyhee rivers. These sites are southeast of Jordan Valley, OR near South and Juniper mountains (Figure 28). Four of the sites had been sampled previously (Zoellick et al. 2005), whereas the other seven were new sites. Population estimates were calculated using MicroFish 3.0 (Van Deventer 2006). Due to size-related catchability differences, population estimates were calculated for two strata: (1) trout less than 100 mm, and (2) trout greater than or equal to 100 mm, then summed.

102
RESULTS
Redband trout were captured at 9 of the 11 sites sampled during 2009. No redband trout were sampled at the upper Middle Fork Owyhee River site (# 57), which was just a small trickle of water or at the Nickel Creek site (# 55) which was dry. Total catch at the remaining sites ranged from 2 to 263 redband trout. No non-native trout were sampled in this subset of sites, however, smallmouth bass were sampled at the North Fork Owyhee River site. In addition, three native species were sampled including bridgelip sucker, dace Rhinichthys spp., and redside shiner.
Redband trout density for the nine sites from which redband trout were sampled averaged 58 ± 40 trout/100 m2 of stream (mean ± 90% CI) and was highly variable among sites (Table 26). The lowest density of 0.3 trout/100 m2 occurred at the North Fork Owyhee site, whereas the highest density of 151 trout/100 m2 occurred at the Middle Fork Owyhee site (# 58). We saw little difference in capture probability among the two size classes used for this analysis. For fish less than 100 mm, capture probability was 82%. For fish greater than or equal to 100 mm, capture probability was 80%. For all the 2009 sites combined, a total of 616 redband trout were sampled and overall 402 (65%) of the trout sampled were less than 100 mm, whereas 214 (35%) were greater or equal to 100 mm.
Among the four sites that had been sampled during previous years, redband trout density fluctuated both positively and negatively. For the North Fork Owyhee River site (#22), the 0.3 fish/100 m2 sampled during 2009 was the first time redband trout had been sampled at this site, despite two previous sampling attempts during 1977 and 2002 (Table 29). For the Juniper Creek (#23) and Cabin Creek (#24) sites, densities were intermediate to past surveys. For the Corral Creek site (#25), density has increased in each of the last 3 surveys and was 29.5 trout/100 m2 during 2009.
DISCUSSION
From the limited amount of historical data available for the sites re-sampled during 2009, redband trout densities and distribution seemed stable in the Middle Fork Owyhee, North Fork Owyhee, Owyhee, and Deep Creek drainages. It is important to note that this is just a small sub-set of the sites that will be sampled for this effort. After completion of the remaining trend monitoring sites during 2010, a more thorough analysis of redband trout distribution and abundance will be completed.

103
Table 26. Length group, population, and density estimates (#/100 m2) for redband trout
sampled at 11 monitoring sites during 2009 in the Middle Fork Owyhee, North Fork Owyhee, Owyhee, and Deep Creek drainages.
< 100 mm ≥ 100 mm Total
Site Number and Stream Passes Estimate 95% CI Estimate 95% CI Estimate #/100 m2
22. NF Owyhee River 1 -- -- 2 2-2 2 0.3
23. Juniper Creek 1 -- -- 4 2-6 4 1.0
24. Cabin Creek 3 27 25-29 45 42-48 72 40.4
25. Corral Creek 3 9 8-10 38 33-43 47 29.5
44. WF Red Canyon 2 -- -- 6 5-7 6 11.1
45. EF Red Canyon 2 62 57-67 45 41-49 107 132.7
46. Red Canyon 2 22 20-24 1 1-1 23 12.2
55. Nickel Creek 1 -- -- -- -- -- --
56. Little Smith Creek 2 50 48-52 48 46-50 98 142.2
57. MF Owyhee River 2 249 236-262 29 29-29 278 150.8
58. MF Owyhee River 1 -- -- -- -- -- --
Table 27. Comparison of redband trout density estimates (#/100 m2) and 95% confidence
intervals over the last thirty-plus years for trend monitoring sites within the Middle Fork Owyhee, North Fork Owyhee, Owyhee, and Deep Creek drainages.
1977-1982 1993-2003 2009
Site number and stream Estimate 95% CI Estimate 95% CI Estimate 95% CI
22. NF Owyhee River 0 -- 0 -- 0.3 --
23. Juniper Creek 0 -- 4.1 4.1 - 4.6 1 0.5 - 1.6
24. Cabin Creek 0 -- 52.3 52.3 - 53.1 40.4 38.7 - 42.1
25. Corral Creek 0.7 -- 15.2 15.2 - 16.8 29.5 26.3 - 32.6

104
Figure 28. Location of 11 trend redband trout monitoring sites within the Middle Fork Owyhee, North Fork Owyhee, Owyhee, and Deep Creek drainages. Sites were sampled during 2009. Black triangles denote sampling sites.
Oregon Idaho

105
SOUTH FORK BOISE RIVER ELECTROFISHING SURVEY
ABSTRACT
We used mark-recapture techniques to estimate abundance of rainbow trout and
mountain whitefish in the South Fork Boise River, downstream of Anderson Ranch Reservoir in October 13 – 20th, 2009. A total of 761 rainbow trout were collected during both mark and recapture runs. Fish lengths ranged from 43 - 603 mm and multiple modes were observed within the length distribution. Fewer fish >500 mm were observed in the catch when compared to 2006 data while a greater proportion of fish <100 mm were observed in 2009. We captured 405 wild rainbow trout greater than 100 mm in the three sections combined. We marked 391 rainbow trout and recaptured 40 of the marked fish. I estimated 870 rainbow trout / km for the 9.6 km section. Mountain whitefish were collected only in the upper section in 2009 to provide trend information. A total of 338 mountain whitefish were collected ranging between 100-530 mm and we marked 194 mountain whitefish and recaptured 25 of the marked fish, resulting in an estimate of 945 mountain whitefish/km for the upper section. Additionally, four rainbow trout fry monitoring sections, established in 1996, were re-sampled in 2009. I estimated overall mean linear fry density to be 3.1 + 3.4 fish / m in October 2009. Author: Art Butts Regional Fishery Biologist

106
INTRODUCTION
Rivers downstream from dams form some of the most valued trout fisheries in the
western U.S. The SFBR below Anderson Ranch Dam is a highly valued trout fishery and was the first river section in Southwest Idaho to be managed under “Quality Trout” regulations. Regulations restrict terminal tackle to no bait and barbless hooks from Neal Bridge (Forest Road 189) upstream to Anderson Ranch Dam. Rainbow trout harvest is restricted to two fish, none under 20 inches (508 mm). The fishery is supported by a population of wild rainbow trout and mountain whitefish. Migratory bull trout are present at very low densities, and native non-game fish include largescale suckers, northern pikeminnow and sculpin Cottus sp.
METHODS
Rainbow trout populations in the SFBR have been monitored in a 9.6 km section every three years since 1994. The section starts at the boat ramp near Reclamation Village (4.2 km downstream from the dam) and ends at the take-out 1.1 km downstream from Cow Creek Bridge (Flatter et al. 2003). Previous surveys used raft mounted electrofishing gear to estimate abundance and size structure for the entire reach. In 2006 we made the decision to more intensively sample shorter reaches within the historic section (Kozfkay 2009). We identified three stream reaches approximately 1 km in length located within the boundaries of the original reach. The upper boundary corresponded to the starting point of the historic section and the end of the lower reach corresponded to the end of the historic section (Figure 29). The middle section corresponded to the section sampled for density in 2003. Riffles formed the upper and lower reach boundaries. Section length was determined from 1:24 k topographic maps. Wetted widths were measured with a hand-held laser range finder (Leupold RX series). Section area was estimated by multiplying mean widths and section length. For braided channels mean width was measured across the river excluding any distances across islands.
We used mark-recapture techniques to estimate abundance of trout and mountain whitefish in each section. Fish were collected with a canoe electrofishing unit consisting of a 5.2 m Grumman aluminum canoe fitted with two mobile anodes connected to 15.2 m cables. The canoe served as the cathode and carried the generator, Coffelt VVP-15, and a live well for holding fish. Oxygen was introduced to the live well (2 L/min) through an air-stone. Pulsed direct current was produced by a 5,000 watt generator (Honda EG500X). Frequency was set at 60 pulses/s and a pulse width of 60 - 80, with an output of 4 - 5 amperes. Crews consisted of six to seven people. Two operators managed the mobile anodes, one person guided the canoe and operated the safety switch controlling the output, the remaining crew of four or five people were equipped with dip nets to capture stunned fish. Only trout and whitefish were placed in the live well.
Marking and recapture runs were conducted with a single pass from upstream to downstream. The canoe was held upstream of the anode operators. Anodes were swept through the water or thrown across the stream and retrieved. Crews with dip nets walked backward facing upstream, while staying downstream of the anodes and capturing stunned fish. Fish were placed in the live well. When the live well was judged to be at capacity the crew stopped at the nearest riffle to process fish.
107
Rainbow trout and bull trout were marked in all three sections on October 13 – 14th. Whitefish were only marked in the upper section. Fish were marked with a 7 mm diameter hole from a standard paper punch on the upper and lower section of the caudal fin and anal fin, corresponding to their capture reach. Only fish larger than 100 mm were marked. Fish were measured for total length (mm) and a subset were weighed (g). Fish were released 50 to 100 m upstream from the processing site to prevent them from drifting downstream into the next section of water to be sampled. Recapture sampling was completed on October 19 – 20th. During the recapture effort all whitefish and trout greater than 100 mm were captured and placed in the live well. Fish were examined for marks on the caudal fin. All fish were measured for length (mm).
To account for selectivity of electrofishing gear population estimates (N) were calculated using a maximum likelihood estimation to fit the recapture data. A capture probability function of the form
Eff = (exp(-5+β1L+ β2L2)) /(1+ exp(-5+β1L+ β2L2))
where Eff is the probability of capturing a fish of length L, and β1 and β2 are estimated parameters (MFWP 2004). Then N is estimated by length group where M is the number of fish marked by length group.
N = M / Eff
Population estimates were calculated for each reach and pooled for a comprehensive estimate expressed as # fish/km for comparison to previous surveys. Three rainbow trout mortalities were excluded from the population estimates.
Rainbow trout population estimates (Ň) for surveys from 1994 – 2003 were calculated using the Modified Petersen equation for fish >129 mm and >239 mm. In order to make comparisons with the 2006 estimates I used the Modified Petersen equation to estimate the rainbow trout population for the 2006 survey.
Ň =[((M+1)*(C+1)) / (R+1)] – 1
Where M is the number of fish marked, C is the number of fish captured and R is the number of fish recaptured. Population estimates and proportional stock density (PSD) values for previous surveys were taken from Flatter et al. (2003). The PSD index was calculated using the equation from Anderson (1976) with rainbow trout values from Anderson and Neumann (1996).
PSD = [Rainbow trout ≥ 400 mm / Rainbow trout ≥ 250 mm] * 100
Fry Monitoring
Rainbow trout fry were monitored using a Smith Root Type VII backpack shocker in four sections of the SFBR on October 19, 2009 (Figure 29). The 33-m sections were monitored in 1996 by Elle (1997) to assess relative abundance of rainbow trout fry in relation to whirling disease. The area from the north shoreline out to approximately 4 m was sampled. A single, upstream electrofishing pass was completed at each site. All fish were identified, counted and measured for total length. Fry density estimates and lengths were compared to those collected in 1996.

108
RESULTS AND DISCUSSION
Low numbers of recaptured fish in the upper and middle sections prevented us from calculating population estimates for the three individual survey sections. Therefore, mark-recapture data for all three sections were pooled for analysis. However, density estimates were calculated for the three individual sections to allow for comparisions with previous estimates.
A total of 761 rainbow trout were collected during both mark and recapture runs. Fish lengths ranged from 43 - 603 mm and multiple modes were observed within the length distributions (Figure 30). Fewer fish >500 mm were observed in the catch when compared to 2006 data while a greater proportion of fish <100 mm were observed in 2009. During marking efforts, we captured 405 wild rainbow trout greater than 100 mm in the three sections combined (Figure 30). We marked 391 rainbow trout and recaptured 40 of the marked fish. I estimated 870 rainbow trout / km for the 9.6 km section (Figure 31).
Rainbow trout density estimates were similar between reaches, except for the middle reach (Figure 31). Low numbers of recaptured rainbow trout (n = 5) influenced the population estimate for the middle reach. This reach also includes a number of deep runs where wading is not possible. Sampling in these sections consists of attempting to herd fish to the bottom of the runs, however, many fish are likely escaping capture in these areas.
The number of large rainbow trout in the SFBR has increased over the last 10 years, as indexed by PSD, and the numbers of fish between 129 and 239 mm increased from 2006 (Figure 32). Since 2000, the proportion of rainbow trout between 102-230 mm (4-9 in.) has increased with every sampling event, from 17% in 2000 to 49% in 2009. In contrast, the proportion of fish >406 mm (16 in) decreased with each event, from 49% in 2000 to 33% in 2009. The number of fish exceeding 508 mm (20 in.) has declined from 13% in 2006 to 3% in 2009.
Mountain whitefish were only collected in the upper section in 2009 to provide trend information. A total of 338 whitefish were collected ranging between 100 - 530 mm and length distributions were similar between 2006 and 2009 (Figure 33). We marked 194 mountain whitefish and recaptured 25 of the marked fish. We estimated 945 mountain whitefish/km for the upper section, which was down slightly from an estimated 1,111 fish/km in 2006 (Figure 31).
We captured five bull trout in the upper and middle sections. Bull trout ranged from 275-578 mm, with three fish between 420 - 480 mm (Figure 34). All five fish were marked and one was recaptured but sample size was too small to provide valuable estimates of population size or density.
Rainbow trout populations in the SFBR have been relatively stable, but the absence of trout in the 200 to 400 mm length range is puzzling. The numbers of trout greater than 400 mm are currently providing an excellent fishery despite the relative lack of smaller trout in the survey section. Using the canoe electrofishing gear increased sampling efficiency for smaller fish compared to previous efforts with raft electrofishing (Kozfkay 2009). The bi-modal length distribution is atypical for a wild trout population. One explanation for the missing length groups could be that fish of those sizes occur outside our sampling area. The larger fish could be migrating to the system from Andersen Ranch Reservoir, Arrowrock Reservoir or unsampled river reaches downstream. For example, during the first SFBR survey that occurred in the downstream canyon section in 2008, rainbow trout between 250 - 400 mm were present in

109
higher proportions than what was observed in the tailwater section (Kozfkay et al. 2010). This suggests possible segregation based on size or habitat.
Fry monitoring
We collected 408 rainbow trout fry among the four sections ranging between 33-84 mm. Over half the fry (59%) were collected in section 4, directly above Cow Creek bridge. I estimated overall mean fry density to be 3.1 + 3.4 fish/m in October 2009 (Figure 35). This is compared to 2.2 + 0.7 fish/m that was estimated in 1996. Though conclusions may be limited from two years of data spaced 13 years apart, fry monitoring may provide valuable information on recruitment and survival if implemented on an annual basis.
MANAGEMENT RECOMMENDATIONS
1. Continue to monitor rainbow trout population trends in the roaded section on 3-year intervals or less.
2. Continue to monitor the downstream canyon section and examine the possibility of pit-tagging smaller fish to see if they migrate upstream to the tailwater section as they grow.
3. Use annual shoreline electrofishing at established sites to monitor spawning success and fry production; relate fry densities to adult abundance, flows, or other environmental variables as data becomes available.

110
Figure 29. Map of South Fork Boise River, Idaho tailwater sections showing location of
2009 mark-recapture section boundaries and fry monitoring sites.

111
X Data
5 10 15 20 250
2
4
6
8
10
X Data
100 200 300 400 500 6000
2
4
6
8
10
X Data
100 200 300 400 500 600
Per
cent
freq
uenc
y (%
)
0
2
4
6
8
10
X Data
100 200 300 400 500 6000
2
4
6
8
10
Total length (in.)
100 200 300 400 500 6000
2
4
6
8
10
1997n=743
2000n=738
2003n=269
2006n=422
2009n=652
Figure 30. Length distributions of rainbow trout, calculated as proportion of total catch,
during population surveys at the South Fork Boise River below Anderson Ranch Reservoir between 1997 and 2009. Only trout larger than 100 mm are included.

112
Section
comp upper middle lower
Fish
/ km
0200400600800
100012001400
3400
3600
3800
2006 Rbt 2009 Rbt 2006 Mwf 2009 Mwf
Figure 31. Linear density estimates for rainbow trout (>100mm) by reach for the South
Fork Boise River in 2009 from maximum likelihood estimation. Comp is the estimate from pooling the data from all three reaches.

113
Year
1994 1996 1998 2000 2002 2004 2006 2008
Rai
nbow
trou
t / k
m
0
100
200
300
400
500
600
700
800
900
Prop
ortio
nal s
tock
den
sity
(PSD
)
10
20
30
40
50
60
70
80
>130 mm>240 mmPSD
Figure 32. Linear density (# fish/km) and Proportional Stock Density (PSD) for rainbow
trout on the South Fork Boise River downstream from Andersen Ranch Dam between 1994 and 2006. Estimates for 2006 were for rainbow trout > 130 mm and > 240 mm.

114
0
2
4
6
8
10
12
14
Total length (mm)
100 200 300 400 500 600
Freq
uenc
y (%
)
02468
10121416
2009
2006
Figure 33. Length distributions of mountain whitefish, calculated as proportion of total
catch, during population surveys at the South Fork Boise River below Anderson Ranch Reservoir in 2006 and 2009. Only whitefish larger than 100 mm are included.

115
0
5
10
15
20
25
30
35
Total length (mm)
100 200 300 400 500 600
Freq
uenc
y (%
)
05
101520253035
2009
2006
Figure 34. Length distributions of bull trout, calculated as proportion of total catch,
during population surveys at the South Fork Boise River below Anderson Ranch Reservoir in 2006 and 2009.
Year
1996 2009
Fry
/ m +
90%
CI
0
1
2
3
4
5
Figure 35. Comparison of mean rainbow trout fry linear density (fry/km) of fish collected
at four 33-m long shoreline trend sections in 1996 and 2009 at the South Fork Boise River, Idaho.

116
UPPER MIDDLE FORK SALMON RIVER CHINOOK SALMON REDD COUNTS
ABSTRACT
Spawning ground surveys were conducted along 11 historical trend monitoring transects
in Bear Valley, Elk, and Sulphur creeks from August 24 through October 7, 2009 to index the abundance of wild Chinook salmon Oncorhynchus tshawytscha. A total of 143 redds were counted along six transects in Bear Valley Creek. Overall, this represents a 42% increase from 2008 (101 redds), but represents a 61% decline when compared to the morerecent high of 2003 (364 redds) and a 79% decline from the highest count ever noted during 1961 (675 redds). A total of 121 redds were counted along three transects in Elk Creek. Overall, the 2009 count represents an 8% decline from 2008 (132 redds), a 68% decline from the recent high of 2002 (377 redds), and an 81% decline from the historical high of 1961 (654 redds). A total of 23 redds were counted along two transects in Sulphur Creek during 2009. For Sulphur Creek transects, the 2009 count represented a 30% decrease from 2008 (33 redds), and represented a 75% decline from the recent high of 2002 (93 redds), and a 94% decline from the historical high of 1957 (381 redds). Author: Joe Kozfkay Regional Fishery Biologist

117
INTRODUCTION
Tributaries of the upper Middle Fork Salmon River, including Bear Valley, Elk, and Sulphur creeks possess some of the best remaining spring/summer Chinook salmon spawning habitat in the Snake River basin. Idaho Department of Fish and Game has conducted annual spawning ground surveys on these streams since 1957 to enumerate the number of Chinook salmon redds, primarily, as an index of adult population abundance. Initially, surveys were conducted along fairly long transects (6 - 8 km) using aerial counts or, less often, on foot; however, beginning in about 1989, transects were split into shorter segments (3 - 4 km) and have been surveyed on foot annually during the last week of August (Hassemer 1993).
Despite the abundance of high quality spawning and juvenile rearing habitat, overall numbers of wild Chinook salmon have declined precipitously from highs observed during the late 1950 and 1960s. This led to federal listing of Snake River Chinook salmon as threatened under the Endangered Species Act during April 1992. Since then, returning adult abundances have remained critically low, except for a three year period from 2001-2003, when adult numbers rebounded temporarily. During 2004 - 05, this trend reversed, and adult abundances returned to near historical low levels of the late 1990s.
OBJECTIVES
1. To index the abundance of returning wild adult Chinook salmon by counting redds within historical trend monitoring transects in Bear Valley, Elk, and Sulphur creeks during 2008.
2. To compare current redd count information to historical data.
METHODS Spawning ground surveys were conducted along 11 historical trend monitoring transects in Bear Valley, Elk, and Sulphur creeks (Figure 36) from August 24 through October 7, 2009. The timing of initial surveys conducted along Bear Valley and Elk creeks occurred within the interval of past sampling dates, at a time when nearly all adult Chinook salmon had recently spawned. However, two transects, the two uppermost Bear Valley Creek transects were incompletely surveyed and had to be resurveyed later.
All surveying techniques followed the protocol outlined by Hassemer (1992). Prior to conducting surveys, surveyors were required to attend an IDFG sponsored training session taught by experienced biologists. Afterwards, pairs of surveyors walked upstream through each transect. After locating a prospective redd site, surveyors determined and recorded whether a redd, multiple redds, or a test dig had been excavated. Redd locations were recorded with hand-held global positioning system units. For each site, surveyors also recorded the number of live and dead adult Chinook salmon observed, as well as their age and sex. Biological samples were collected from salmon carcasses and provided to the Idaho Natural Production Monitoring and Evaluation Project.

118
RESULTS AND DISCUSSION
A total of 143 redds were counted along six transects in Bear Valley Creek during 2008 surveys. Overall, this represents a 42% increase from 2008 (101 redds), but represents a 61% decline when compared to more the recent high of 2003 (364 redds) and a 79% decline from the highest count ever noted during 1961 (675 redds; Figure 37, 38, & 39). In Bear Valley Creek, redds were concentrated (114 of the 143 redds) in the one site below the mouth of Elk Creek (WS-10a) and the two sites above (WS-9c & WS-9d). The number of redds counted in the three remaining Bear Valley Creek sites was less than 15 each. A total of 142 live adult Chinook salmon were observed in Bear Valley Creek.
A total of 121 redds were counted along three transects in Elk Creek during 2009 surveys. Overall, the 2009 count represents an 8% decline from 2008 (132 redds), a 68% decline from the recent high of 2002 (377 redds), and an 81% decline from the historical high of 1961 (654 redds; Figure 40). The majority of redds in Elk Creek were concentrated in the two most upstream monitoring sites. The highest count (61 redds) occurred in the most upstream transect, WS-11a. Whereas, 48 and 12 redds were counted in the middle (WS-11b) and lower (WS-11c) transects along Elk Creek. A total of 81 live adult Chinook salmon were observed in Elk Creek.
A total of 23 redds were counted along two transects in Sulphur Creek during 2009 surveys. Similarly to Elk Creek, redd counts were slightly lower than for 2008. Also, 2009 redd counts were still much lower than recent and historical highs (Figure 41). Overall for Sulphur Creek transects, the 2009 count (23 redds) represented a 30% decrease from 2008 (33 redds), but represents a 75% decline from the recent high of 2002 (93 redds), and a 94% decline from the historical high of 1957 (381 redds). Three live adult Chinook salmon were observed in Sulphur Creek.
Over the three monitoring streams and 11 trend monitoring transects combined, a total of 287 redds were counted in 2009. This total is a slight increase of 8% over the 2008 count of 266 redds. However, this increase was heavily influenced by higher counts in Bear Valley Creek, whereas counts in Elk and Sulphur Creeks were lower than for 2008. Total redd counts in this area are still much lower than the high of 1440 redds counted within these streams during 1957 and the consistently high counts document during the 1960s. During this decade, cumulative counts in this area exceeded 770 redds in all years except 1965 when 536 redds were counted. Furthermore, total redd counts during 2009 were still 56% less than recent highs documented during 2001-2003, when cumulative counts averaged 643 redds for this period.
MANAGEMENT RECOMMENDATIONS
1. Continue to index the abundance of wild adult Chinook salmon by counting redds in Bear Valley, Elk, and Sulphur creeks.
2. Continue to pursue strategies that improve down river and ocean survival of these
stocks.

119
Figure 36. Location of 11 redd count trend transects on Bear Valley, Elk, and,
Sulphur creeks used to index the abundance of wild spring/summer-run Chinook Salmon in the upper Middle Fork Salmon River Drainage, ID. Red lines denote transect boundaries.
Middle Fork Salmon River
Bear Valley Creek
Marsh Creek
Sulphur Creek
Elk Creek
WS-10a WS-10b
WS-11b WS-11c
WS-9a
WS-9b
WS-9c
WS-9d
WS-11a
OS-4 WS-12
Sack Creek
Fir Creek
Cub Creek
N
0 2.5 5 km

120
Figure 37. Number of Chinook salmon redds counted along upper Bear Valley Creek
index transects from 1957 - 2009. The solid line represents a cumulative count for WS-9a & b that was monitored in most years from 1957 to 1989.
0
10
20
30
40
50
60
70
80#
of C
hino
ok s
alm
on re
dds
Year
WS-9aWS-9bWS-9a,b

121
Figure 38. Number of Chinook salmon redds counted along middle Bear Valley Cr.
index transects from 1957 - 2009. The solid line represents cumulative counts for WS-9c & d.
0
50
100
150
200
250
300
350
400
450
500#
of C
hino
ok s
alm
on re
dds
Year
WS-9cWS-9dWS-9c,d

122
Figure 39. Number of Chinook salmon redds counted along lower Bear Valley Cr.
index transects from 1957 - 2009. The solid line represents cumulative counts for WS-10a & b.
0
50
100
150
200
250
300
350
400
# of
Chi
nook
sal
mon
redd
sWS-10aWS-10bWS-10a,b

123
Figure 40. Number of Chinook salmon redds counted along Elk Creek index
transects from 1957 - 2009. The solid grey line represents a cumulative count for WS-11b and WS-11c, whereas all other lines represent individual transects.
0
50
100
150
200
250
300
350
400#
of C
hino
ok s
alm
on re
dds
Year
WS-11aWS-11bWS-11cWS-11b,c

124
Figure 41. Number of Chinook salmon redds counted along Sulphur Creek index
transects from 1957 - 2009.
0
50
100
150
200
250
300
350
400#
of C
hino
ok s
alm
on re
dds
Year
WS-12OS-4
125
BRUNEAU RIVER SLOPED-VELOCITY BARRIER AND DIVERSION DAM RE-BUILD
ABSTRACT
The Bruneau River represents one of only a few remaining fourth order or larger
drainages in Idaho not significantly impacted by non-native fish. It currently acts as refugium for nine species of native fishes including three species of special concern: bull trout (listed as threatened under the ESA), “desert” redband trout (petitioned for listing under the ESA), and leopard dace R. osculus (limited range). Two small, dilapidated irrigation diversions have blocked migration of non-native fish, specifically common carp, channel catfish, and smallmouth bass, that reside in the Snake River and C.J. Strike Reservoir. Fortifying the upper structure, The Hot Springs Dam, and adding a sloped velocity barrier would be a cost effective method for providing protection to these species by reducing the probability that non native fish could colonize the middle and upper portions of the drainage. Author: Joe Kozfkay Regional Fishery Biologist

126
METHODS AND RESULTS
Completion of this project required obtaining permission and cooperation from landowners, acquiring permits, project design, solicitation of funds, and construction. During spring 2008, a series of meetings were held with local landowners, including the representatives of the JR Simplot Company, and other interested parties to present goals and seek permission to initiate the project. IDFG engineers, primarily John Whipple, designed an irrigation diversion dam with a sloped-velocity barrier on the downstream end (Figure 42). Landowner concerns were addressed including replacing the headgate and raising the dams crest elevation by eight inches. Funds were acquired through five different sources. We received a $20,000 grant ($10,000 federal and $10,000 non-federal) from the National Fish and Wildlife foundation, and also a $24,500 grant from the Idaho Office of Species Conservation. Also, engineering and construction crew wages and benefits were paid with IDFG license revenues (non-federal), totaling approximately $60,000. And, lastly, the Hot Springs Ditch Company purchased a $6,000 headgate for the project (non-federal). Furthermore, we used IDFG regional fisheries operating budget for an additional $10,000 (federal Dingell-Johnson funds). All funds were used for the purchase and pouring of concrete, re-bar, gravel, forms, and for some of the rental fees associated with pouring the concrete structure such as dump truck rental. This included mileage charges for IDFG fleet equipment, concrete pump truck rental, de-watering pump rental, per diem, purchase of new I-beams, and equipment for coffer dam construction. In total, project costs exceeded $120,000.
This project was initiated and completed during fall 2009. After irrigation season (mid-September), water was diverted around the current structure to allow for demolition and reconstruction by Idaho Department of Fish and Game construction and engineering crews (Figure 43). Weakened portions of the structure were removed and replaced. The undercut portion of the structure was filled in and cemented. Afterwards, 8” of new concrete was placed on top of structurally sound portions of the existing dam. The dam apron was extended to act as an enhanced fish barrier and to dissipate turbulence to reduce the under-cutting effect. The point of diversion and headgate on the west side of the structure were replaced or enhanced. The new structure, which was completed in late December, fulfills both conservation and irrigation purposes equally well.
ACKNOWLEDGEMENTS
We would like to thank the 2009 regional field crew Tyler Hopper, Carson Watkins, and John Walrath for their excellent work ethic and assistance in the collection of data. Andy Kvien also provided some assistance. Nampa Fish Hatchery provided fish, equipment, and support through the year. Additionally, crews at Nampa Research assisted in many projects when we were short-handed. IDFG engineering crews provided technical support as well as construction of new diversion dam.

127
Figure 42. Project design schematic for the rebuild of the Hot Springs Diversion Dam on the Bruneau river with addition of a sloped velocity barrier.

128
Figure 43. Pictures of the Hot Springs Diversion Dam after site dewatering (top photo) and after project completion (bottom photo).
129
LITERATURE CITED
Allen, D.B., B. J. Flatter and F. S. Elle. 2001. Regional fisheries management
investigations-Southwest Region, Idaho Department of Fish and Game, 1998 Job Performance Report Project F-71-R-23. Boise.
Allen, D. B, S. P. Yundt and B. J. Flatter. 2000. Regional fisheries management
investigations, Idaho Department of Fish and Game, 1997. Job Performance Report Project F-71-R-22. Boise.
Allen, D. B, S. P. Yundt and B. J. Flatter. 1999. Regional fisheries management
investigations, Idaho Department of Fish and Game, 1996. Job Performance Report Project F-71-R-21. Boise.
Allen, D. B., S. P. Yundt, and B. J. Flatter. 1998. Regional Fisheries Management
Investigations-Southwest Region, Idaho Department of Fish and Game, 1995. Job Performance Report. Program F-71-R-20. Boise.
Allen, D. B., T. Holubetz, and B. J. Flatter 1995. Regional Fisheries Management
Investigations-Southwest Region, Idaho Department of Fish and Game, 1992. Job Performance Report. Program F-71-R-17. Boise.
Anderson, R.O. and R.M. Neumann. 1996. Length, weight, and associated structural
indices. Pages 447-482 in B. R. Murphy and D. W. Willis, editors. Fisheries Techniques, 2nd edition. American Fisheries Society, Bethesda, Maryland.
Anderson, R.O., 1976. Management of small warm water impoundments. Fisheries
1(6):5-7, 26-28. Brink, S. R. and M. Brown. 2009. Article 409 Fish stocking report-2008. C.J. Strike
Hydroelectric Project, FERC Project No. 2055. Idaho Power Company. Boise Butts, A. E., P. Kennedy, K. A. Meyer. 2007. Lake and reservoir research. Job
performance report. Grant F-73-R-27 Project 5. Idaho Department of Fish and Game. Boise.
Butts, A.E. 2004. Lake and reservoir research, 2003. Job performance report. Grant
F-73-R-26 Project 5. Idaho Department of Fish and Game. Boise. Carlander, K. D. 1977. Handbook of Freshwater Fishery Biology, Volume Two. The Iowa
State University Press, Aimes. Cassinelli, J. 2008. Effects of water temperature on growth and physiology of different
populations of redband trout (Oncorhynchus mykiss gairdneri). Master’s thesis University of Idaho, Moscow.
Dillon, J.C. and C.B. Alexander. 1995. Put and Grow Hatchery Trout Evaluations.
Annual Progress Report. Grant F-73-R-17 Project 8. Idaho Department of Fish and Game. Boise.

130
Elle, S. 1997. Wild trout investigations:whirling disease studies. Annual Performance
Report 1996-1997, Grant Number F-73-R-19. Idaho Department of Fish and Game, Boise.
Elliott, J. M. 1983. Some methods for the statistical analysis of samples of benthic
invertebrates. Freshwater Biological Association Scientific Publication 25. Flatter, B.J., K.E. Plaster, J. Dillon. 2006. Fishery Management Report Southwest
Region-Nampa 2003. Idaho Department of Fish and Game. Boise. Flatter, B., L. Hebdon, and J. Dillon. In Press. Southwest Region-Nampa 2004 Fishery
Management Report. Idaho Department of Fish and Game, Boise. Flatter, B. J., K. Plaster, F. S. Elle, J. Dillon and D. Allen. 2003. Regional Fisheries Job
Performance Report F-71-R-26, Program 2000. Idaho Department of Fish & Game, Boise.
Hassemer, P. F. 1992. Manual of standardized procedures for counting Chinook salmon Redds. Idaho Department of Fish and Game, Boise. Hassemer, P. F. 1993. Salmon spawning ground surveys, 1989-92. Project F-73-R-15.
Pacific Salmon Treaty Program. Award Number NA17FP0168-02. Idaho Department of Fish and Game, Boise.
Hebdon, L. J. R. Kozfkay and J. Dillon. 2009. Fishery Management Annual Report,
Southwest Region – 2007. Idaho Department of Fish and Game. Boise. Hebdon, L., B. J. Flatter, A. Knight, and J. Dillon. 2008. Regional Fisheries Management
Investigations-Southwest Region, Idaho Department of Fish and Game, 2005. Job Performance Report. Program F-71-R-31.
Hebdon, L., J. R. Kozfkay, J. Dillon. 2009. Southwest Region-Nampa 2007 Fishery
Management Report. Idaho Department of Fish and Game, Boise. Heimer, C.R. and S.T. Howser. 1990. American Falls Reservoir studies. Job
Performance Report, Project F-71-R-12, IDFG, Boise. Hyatt, M.W., and W.A. Hubert. 2000. Proposed standard weight (Ws) equations for
kokanee, golden trout, and bull trout. Journal of Freshwater Ecology 15:559-564. Kline, P. and J. Younk. 1995. Research and recovery of Snale River sockeye salmon.
IDFG annual progress report 1994, to U.S. DOE, Bonneville Power Administration, Division of Wildlife. Project Number 91-72. Contract Number DE-B179-91BP21065. Portland, Oregon
Kolander, T.D., D.W. Willis, and B.R. Murphy. 1993. Proposed revision of the standard
weight (Ws) equation for smallmouth bass. North American Journal of Fisheries Management 13:398-400.

131
Kozfkay, J.R., A.E. Butts, L. Hebdon, and J.C. Dillon. 2010. Fishery Management Report Southwest Region 2008. Idaho Department of Fish and Game. Boise.
Kozfkay, J. R., L. Hebdon, A. Knight, and J. Dillon. 2009. Regional Fisheries
Management Investigations-Southwest Region, Idaho Department of Fish and Game, 2006. Job Performance Report. Program F-71-R-31.
Love, R. H. 1977. Target strength of an individual fish at any aspect. Journal of
Acoustical Society of America 62:1397-1403. Maiolie, M., W. Harryman, W. Ament. 2004. Lake Pend Oreille Fishery Recovery IDFG
Report Number 04-24. Project 2002 Annual Report. Bonneville Power Administration Project No. 199404700 (BPA Report DOE/BP-00004003-3). Management Investigations, Southwest Region. Federal Aid in Fish Restoration
Meyer, K. A., J. A. Lamansky, Jr., and F. S. Elle. 2009. Lake and reservoir research,
Idaho Department of Fish and Game, 2008. Annual Performance Report Project F-73-R-29. Boise.
Montana Fish, Wildlife and Parks (MFWP). 2004. Fisheries Analysis +. Fisheries
Information System. Bozeman. Parker, R.M., M.P. Zimmerman, and D.L. Ward. 1995. Variability in biological
characteristics of northern squawfish in the Lower Columbia and Snake Rivers. Transactions of the American Fisheries Society 124:335-346.
Rieman, B. E. 1992. Kokanee salmon population dynamics-kokanee salmon monitoring
guidelines. Idaho Department of Fish and Game, Project No. F-73-R-14, Subproject II, Study II. Boise.
Salow, T. 2005. Arrowrock Dam Outlet Works Rehabilitation Endangered Species
Monitoring and Mitigation Project: Compilation of monthly summaries for radio telemetry investigations for listed bull trout (Salvelinus confluentas), Boise, Idaho 2003. U.S.D.I., Bureau of Reclamation, BOR/OALS#00-912/1009.2700. 71 pp.
Scheaffer, R. L., W. Mendenhall III, and R. L. Ott. 1996. Elementary survey sampling, 5th
edition. Duxbury Press. Belmont, California. Simpkins, D. G., and W.A. Hubert. 1996. Proposed revision of the standard-weight
equation for rainbow trout. Journal of Freshwater Ecology 11:319-325. Teuscher, D. 2001. Lake and reservoir research. Job performance report. Grant F-73-R-
23 Project 5. Idaho Department of Fish and Game. Boise. Teuscher, D. 1998. Hatchery trout evaluations. Job performance report. Grant F-73-R-
21, Project 8, Subproject 2. Idaho Department of Fish and Game, Boise. Thorne, R. E. 1983. Hydroacoustics. Pages 239-260 in L. A. Nielsen and D. L. Johnson,
editors. Fisheries Techniques, 1st edition. American Fisheries Society. Bethesda, Maryland.

132
U.S. Bureau of Reclamation. http://www.usbr.gov/pn/agrimet/wxdata.html USFWS (U.S. Fish and Wildlife Service). 1998. Final rule to list Columbia River and
Klamath River population segments of the bull trout as a threatened species. Federal Register 63:31647-31674.
Van Deventer 2006. MicroFish 3.0. Demonstration Version.
Website:http://www.microfish.org/ Yule D. L. 2000. Comparison of purse seine and horizontal acoustic estimates of trout
densities and sizes in eleven Wyoming waters. North American Journal of Fisheries Management 20:759-775.
Yule, D., and R. Whaley. 2000. A simple nomograph to predict gill net catches of quality-
size trout from stocking densities and zooplankton size-structure. Wyoming Game and Fish Department, Administrative report. Cheyenne, Wyoming.
Zoellick, B. W., D. B. Allen, and B. J. Flatter. 2005. A long-term comparison of redband
trout distribution, density, and size structure in Southwestern Idaho. North American Journal of Fisheries Management 25: 1179-1190.

133
Prepared by: Approved by: IDAHO DEPARTMENT OF FISH AND GAME
Jeffery C. Dillon Regional Fishery Manager
_______________________________
Joseph R. Kozfkay Edward B. Schriever, Chief Regional Fishery Biologist Fisheries Bureau Arthur E. Butts ________________________________ Regional Fishery Biologist
State Fishery Manager
Chris Sullivan Fishery Technician