idaho department of fish and game greater sage-grouse · greater sage-grouse idaho department of...
TRANSCRIPT
Greater Sage-GrouseIdaho Department of Fish and Game
gA Landscape Species and Its Habitat
Steven T. KnickUSGS Forest and RangelandEcosystem Science Center
John W ConnellyJohn W. ConnellyIdaho Department of Fish and Game
e ©
U.S. Department of the InteriorU.S. Geological Survey
Pho
to: T
erry
Ste
ele
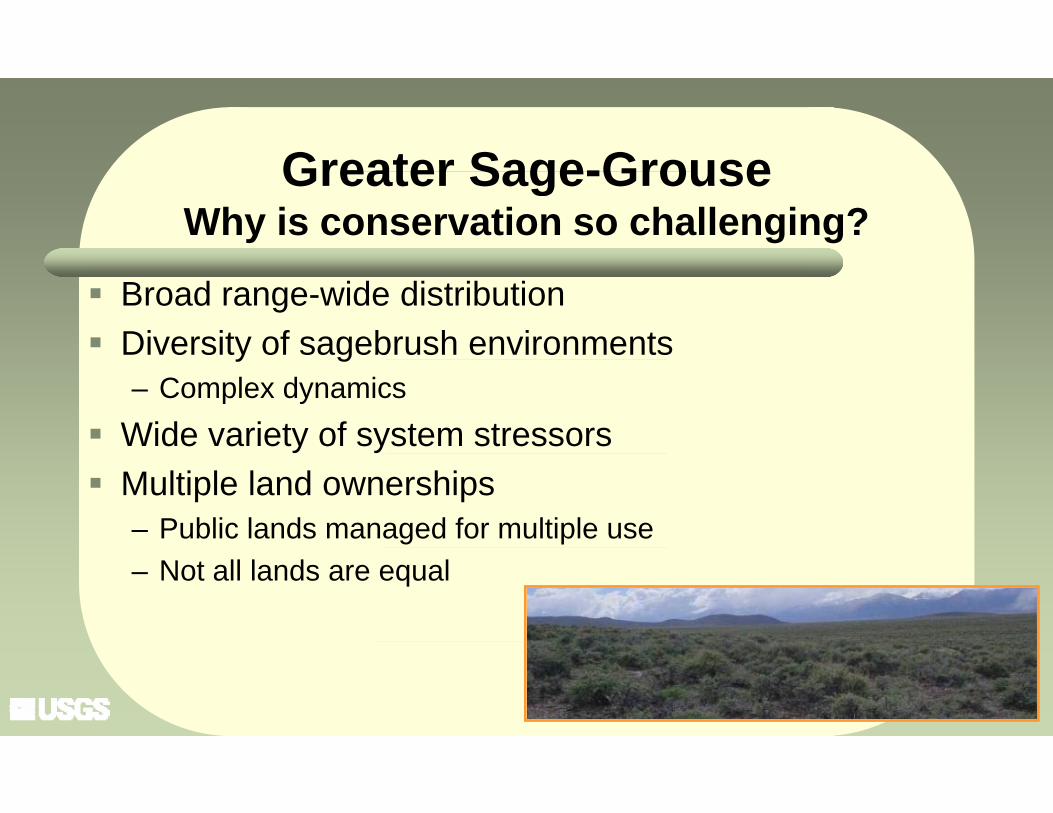
Greater Sage-GrouseGreater Sage-GrouseWhy is conservation so challenging?
Broad range-wide distribution Diversity of sagebrush environmentsy g
– Complex dynamics Wide variety of system stressors Multiple land ownerships
– Public lands managed for multiple use – Not all lands are equal
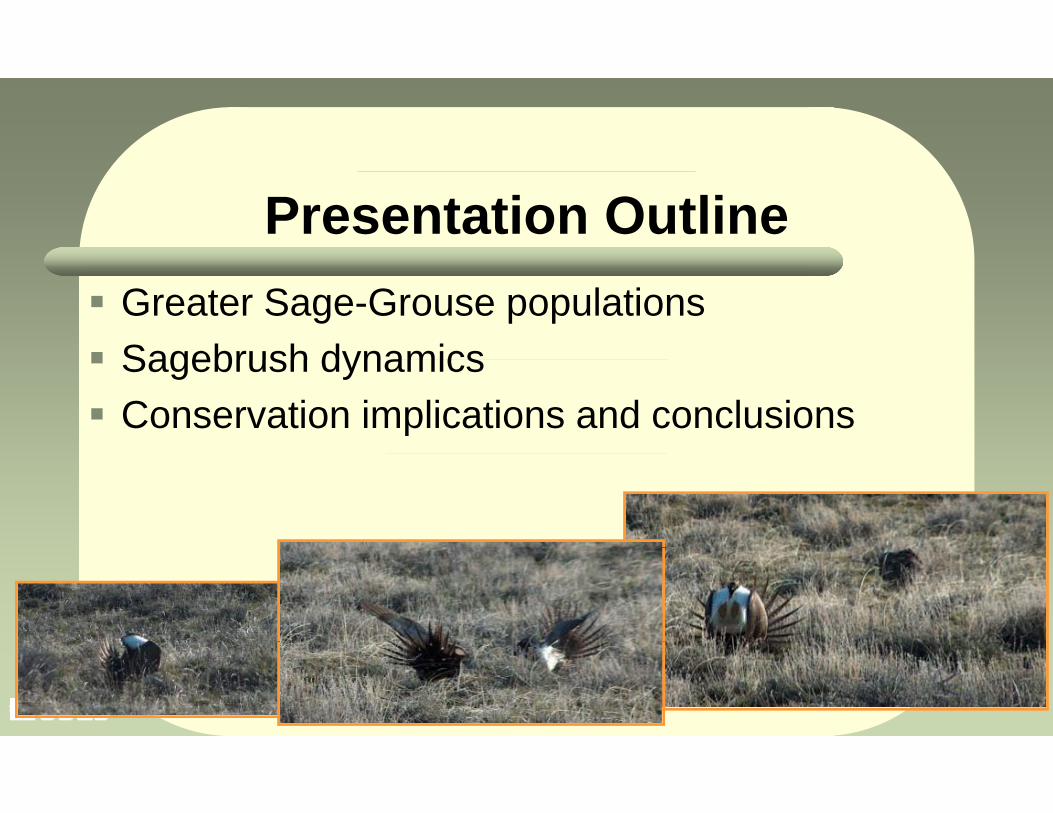
Presentation Outline Greater Sage-Grouse populations Sagebrush dynamics Sagebrush dynamics Conservation implications and conclusions
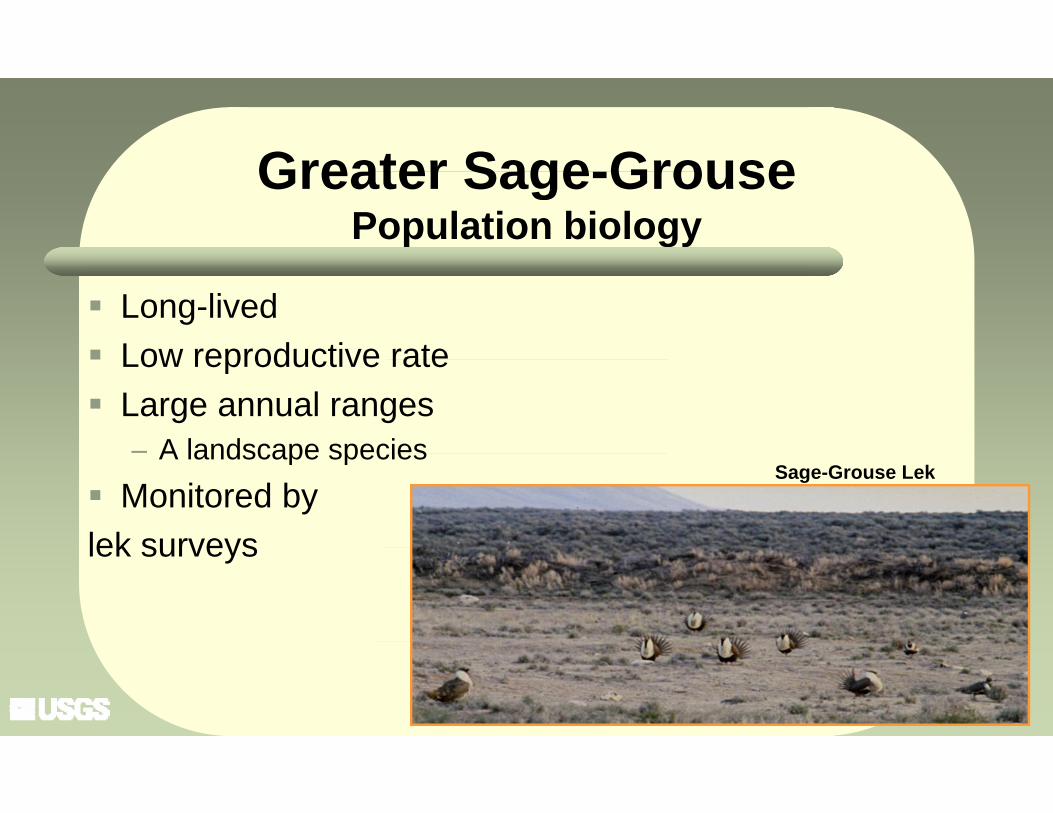
Greater Sage-GrouseGreater Sage-GrousePopulation biology
Long-lived Low reproductive rateLow reproductive rate Large annual ranges
– A landscape speciesA landscape species Monitored by lek surveys
Sage-Grouse Lek
lek surveys
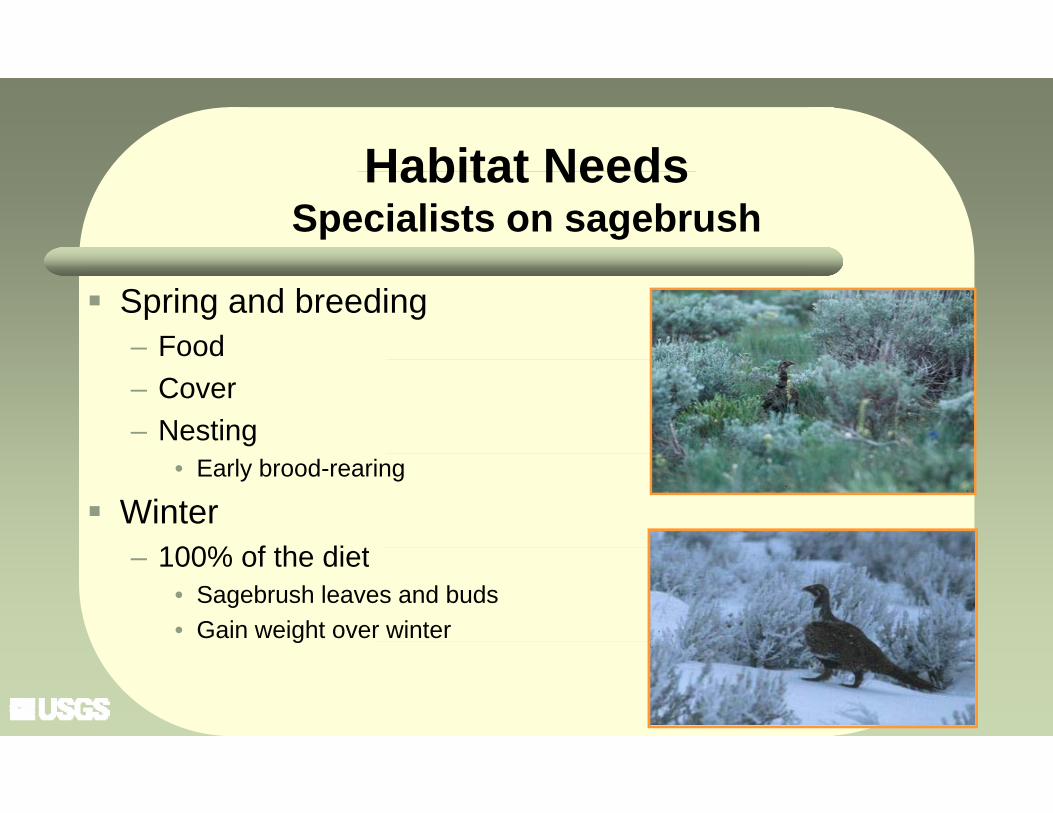
Habitat NeedsHabitat NeedsSpecialists on sagebrush
Spring and breeding– Food– Cover– Nesting
• Early brood-rearing
Winter100% f th di t– 100% of the diet
• Sagebrush leaves and buds• Gain weight over winterg
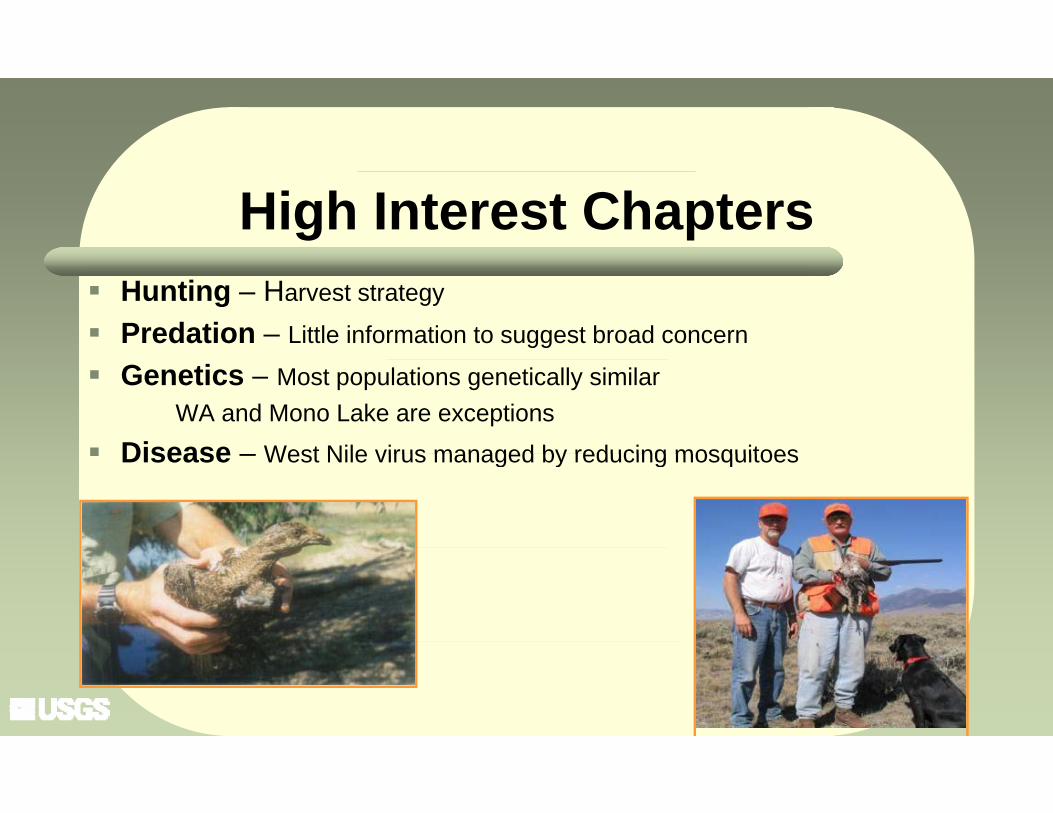
High Interest Chapters Hunting – Harvest strategy
Predation – Little information to suggest broad concern
Genetics – Most populations genetically similar WA and Mono Lake are exceptions
Disease – West Nile virus managed by reducing mosquitoes Disease – West Nile virus managed by reducing mosquitoes
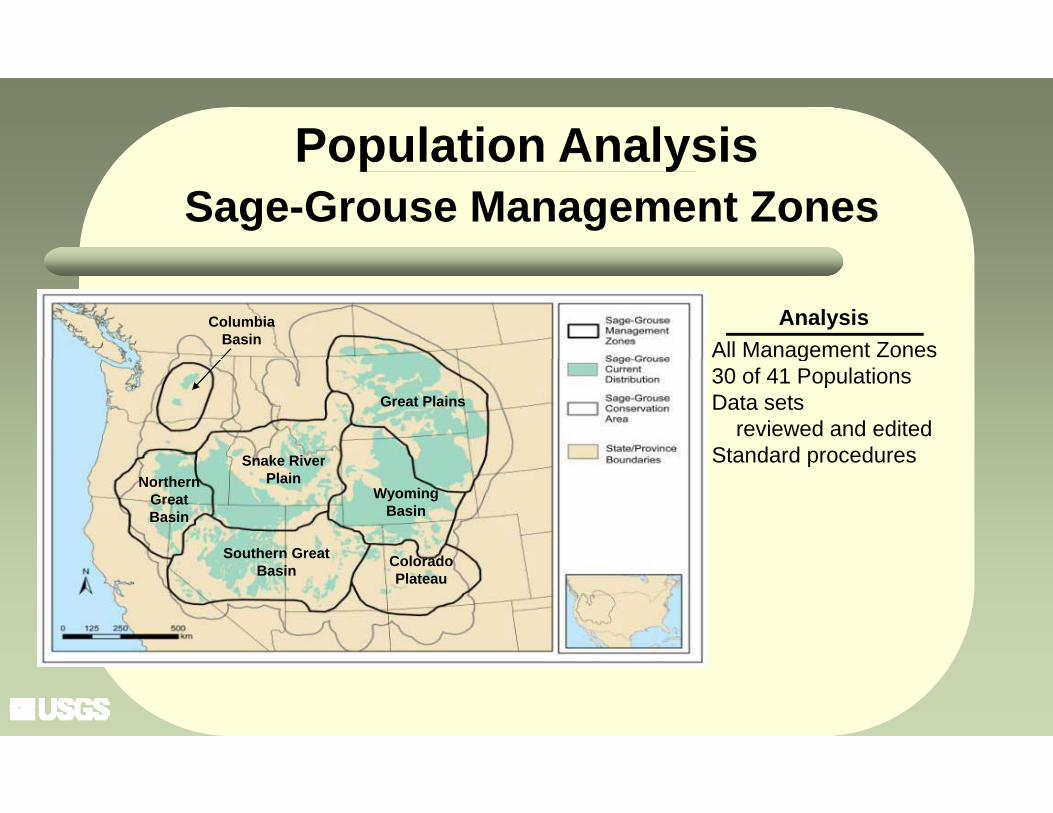
Population AnalysisSage-Grouse Management Zones
y
ColumbiaBasin
AnalysisAll Management Zones
Great Plains
g30 of 41 PopulationsData sets
reviewed and editedStandard procedures
NorthernGreatBasin
WyomingBasin
S h G
Snake RiverPlain
Standard procedures
ColoradoPlateau
Southern GreatBasin
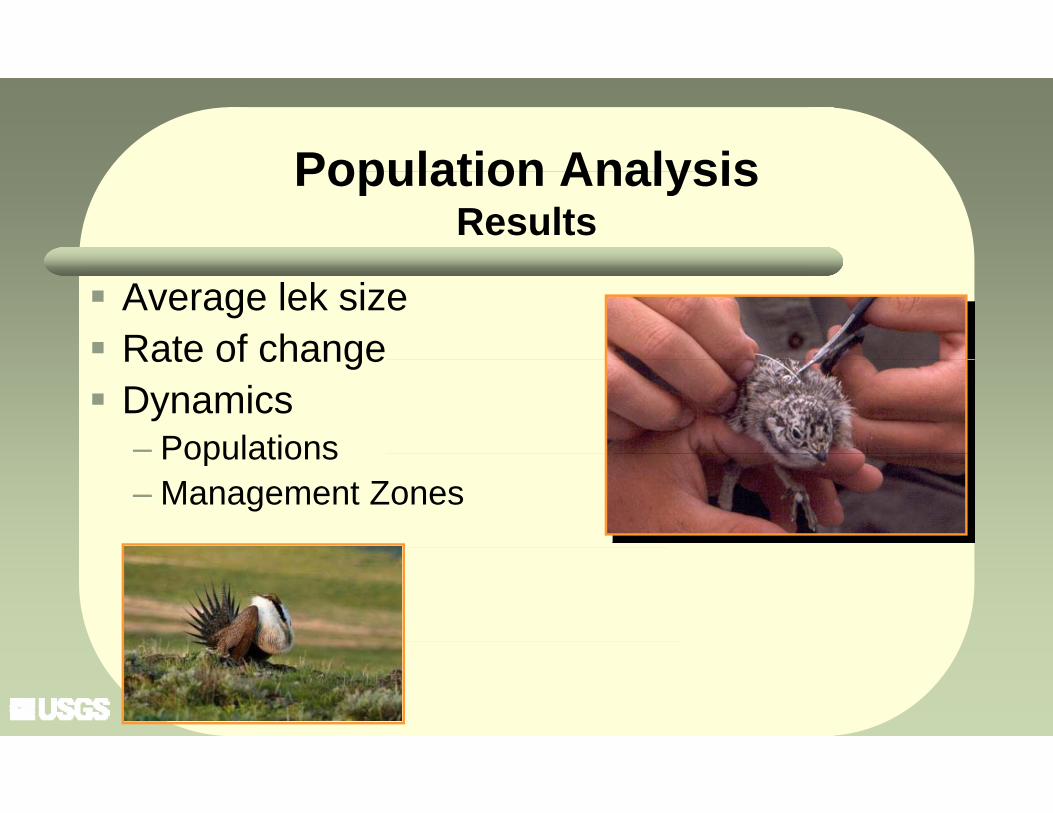
Population AnalysisPopulation AnalysisResults
Average lek size Rate of changeRate of change Dynamics
– PopulationsPopulations– Management Zones
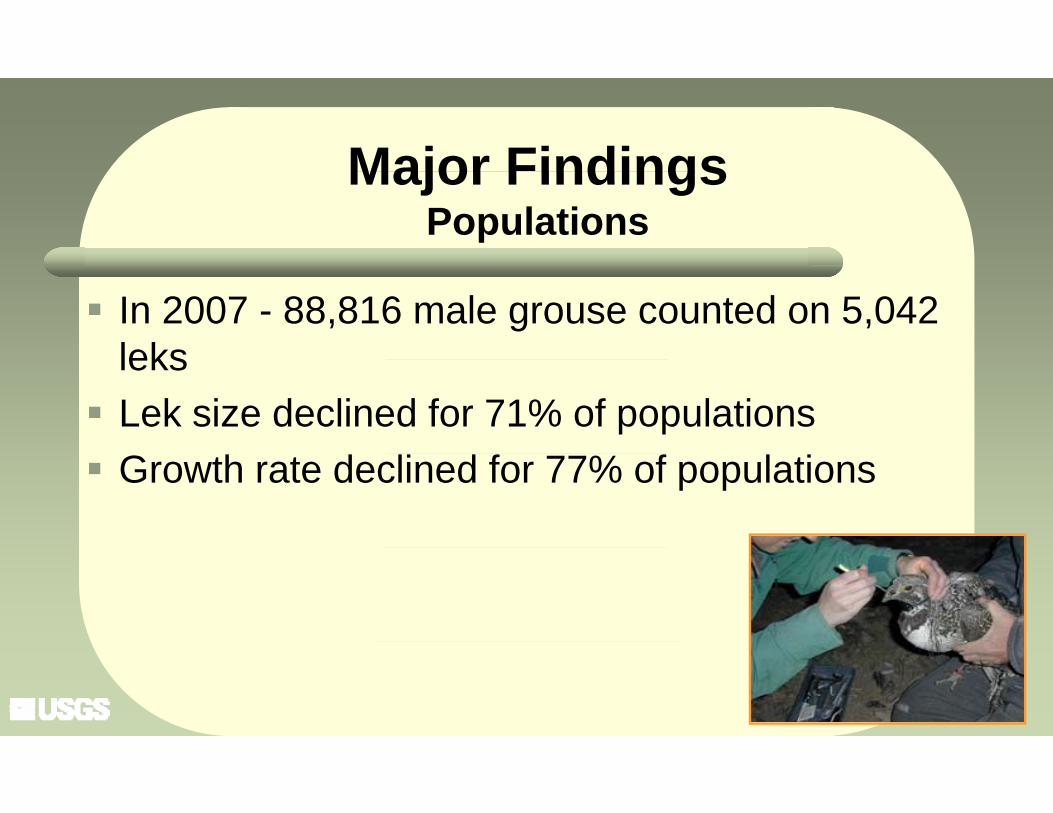
Major FindingsMajor FindingsPopulations
In 2007 - 88,816 male grouse counted on 5,042 leksleks Lek size declined for 71% of populations Growth rate declined for 77% of populations
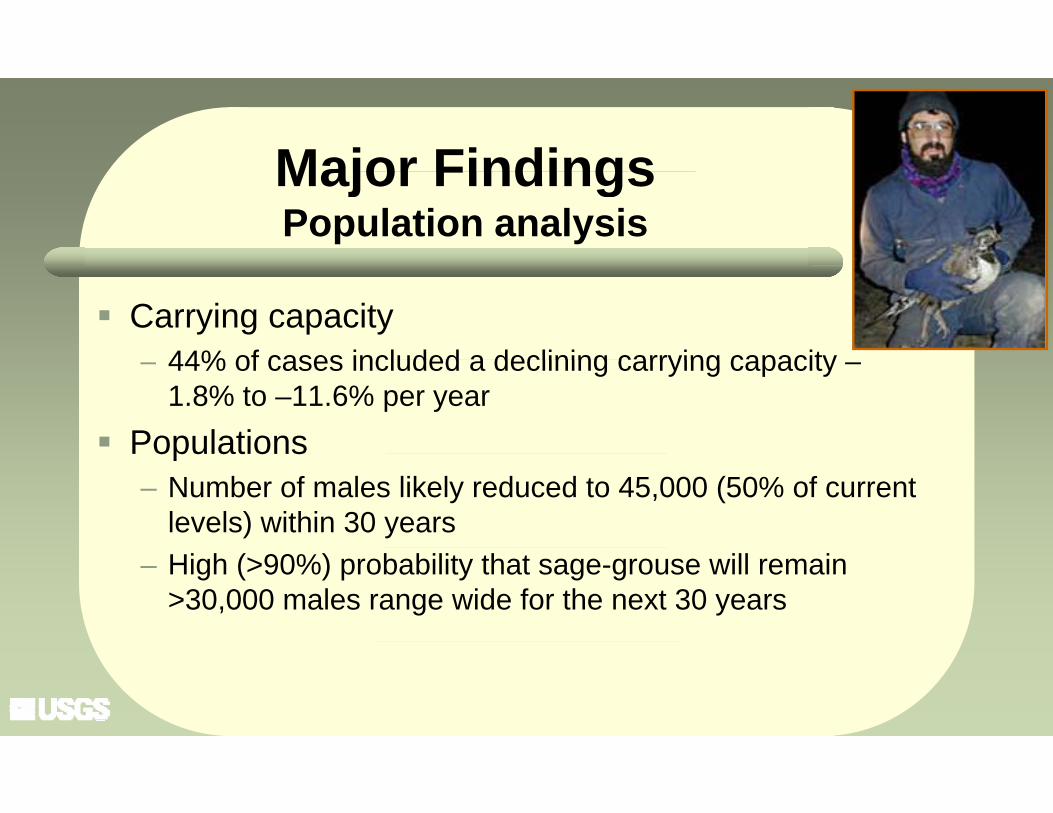
Major FindingsMajor FindingsPopulation analysis
Carrying capacity44% of cases included a declining carrying capacity– 44% of cases included a declining carrying capacity –1.8% to –11.6% per year
PopulationsPopulations– Number of males likely reduced to 45,000 (50% of current
levels) within 30 years– High (>90%) probability that sage-grouse will remain
>30,000 males range wide for the next 30 years
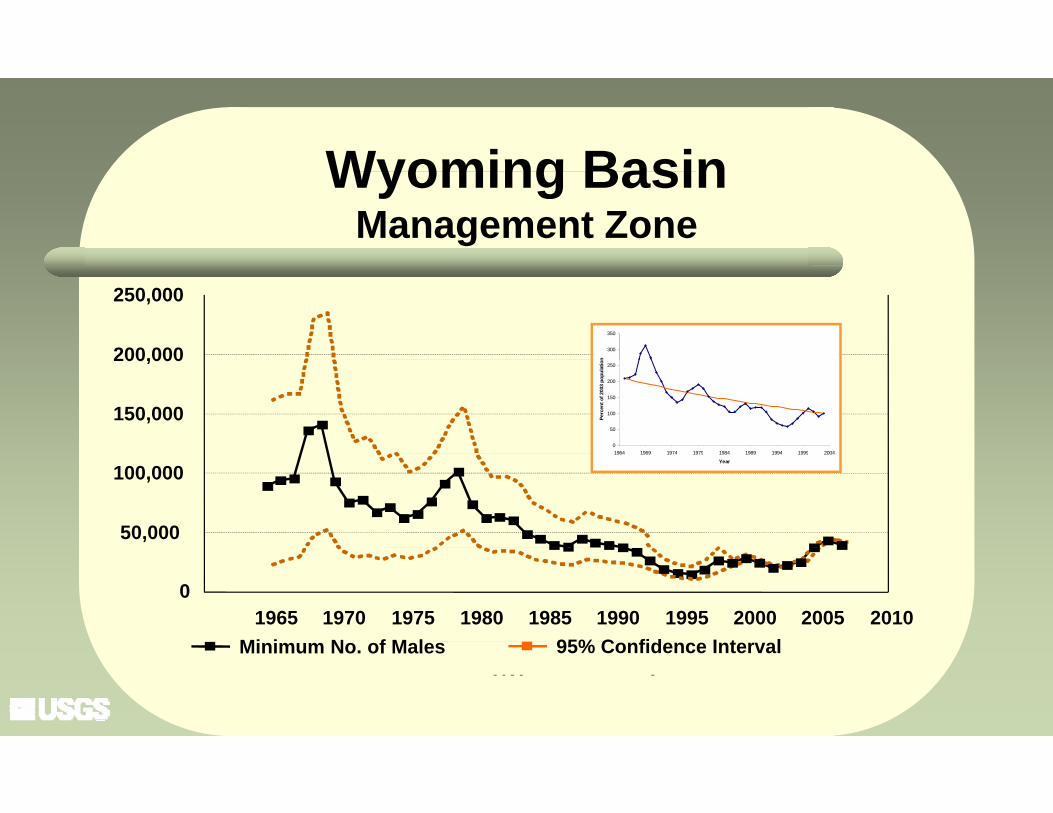
Wyoming BasinWyoming BasinManagement Zone
200,000
250,000
300
350
n
150,000
200,000
0
50
100
150
200
250
1964 1969 1974 1979 1984 1989 1994 1999 2004
Perc
ent o
f 200
3 po
pula
tion
50,000
100,0001964 1969 1974 1979 1984 1989 1994 1999 2004
Year
01965 1970 1975 1980 1985 1990 1995 2000 2005 2010
Mi i N f M l 95% C fid I t lMinimum No. of Males 95% Confidence Interval
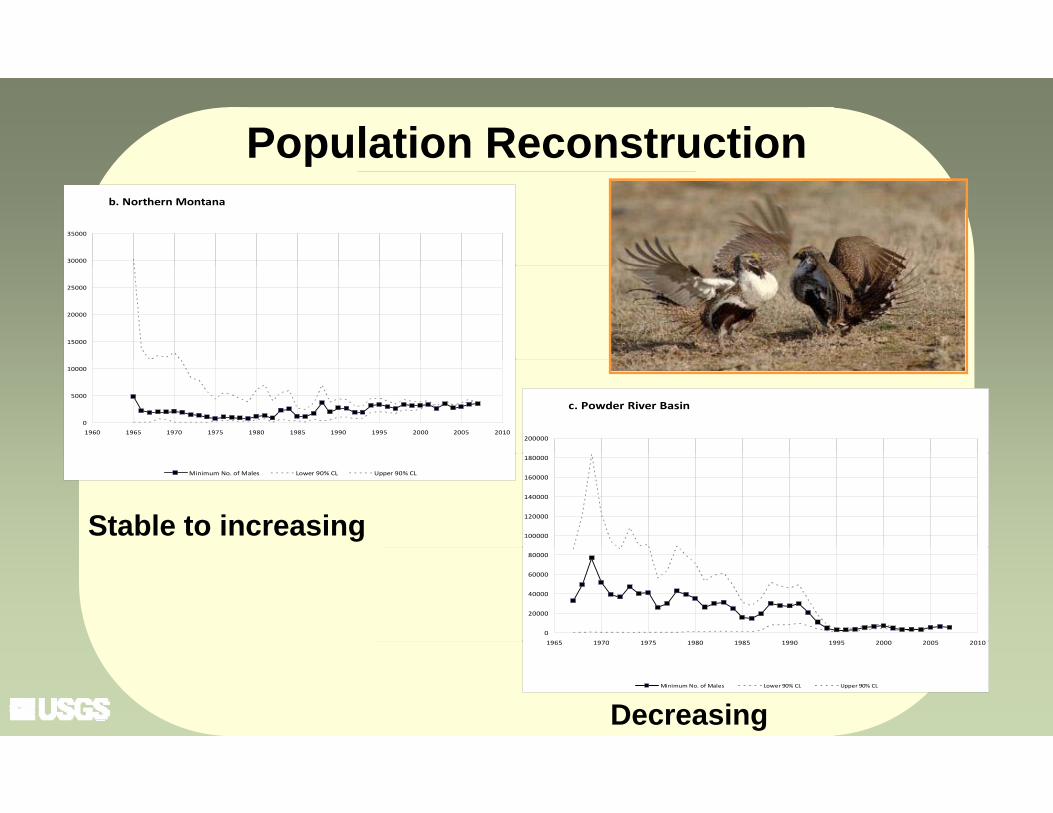
Population Reconstructionb. Northern Montana
30000
35000
15000
20000
25000
0
5000
10000
1960 1965 1970 1975 1980 1985 1990 1995 2000 2005 2010
c. Powder River Basin
200000
Minimum No. of Males Lower 90% CL Upper 90% CL
100000
120000
140000
160000
180000
Stable to increasing
0
20000
40000
60000
80000
1965 1970 1975 1980 1985 1990 1995 2000 2005 20101965 1970 1975 1980 1985 1990 1995 2000 2005 2010
Minimum No. of Males Lower 90% CL Upper 90% CL
Decreasing
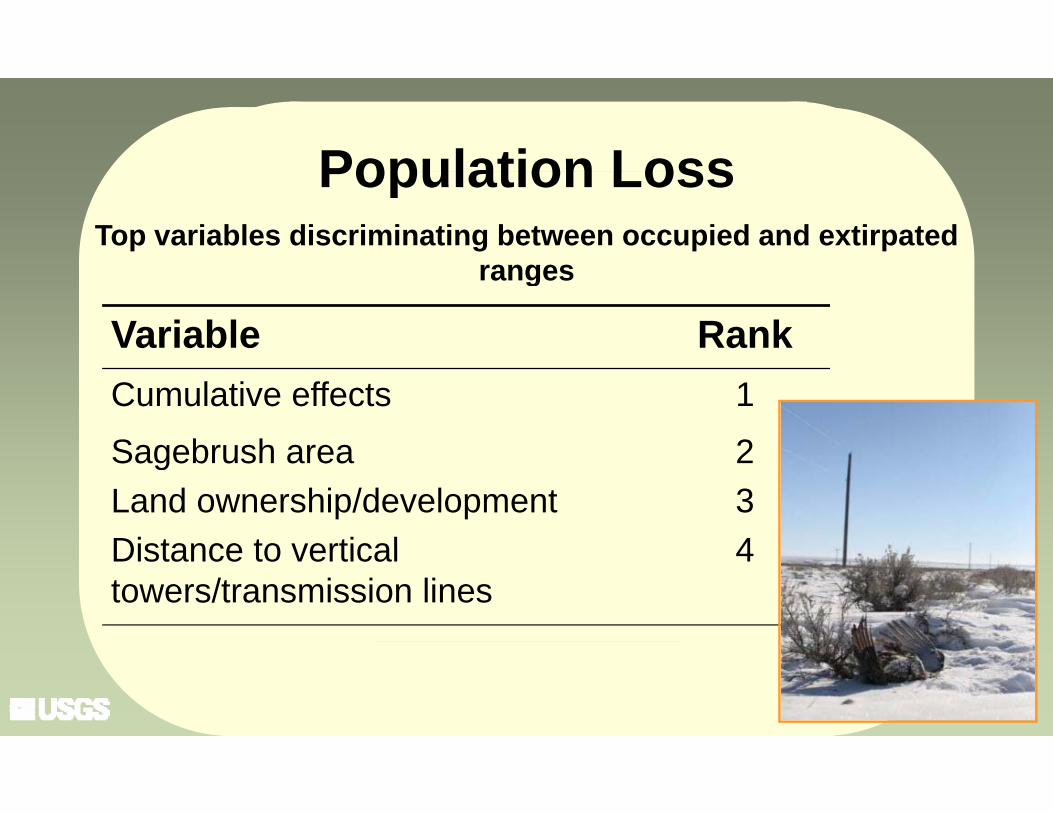
Population LossPopulation LossTop variables discriminating between occupied and extirpated
rangesranges
Variable RankCumulative effects 1
Sagebrush area 2Sagebrush area Land ownership/developmentDistance to vertical
234Distance to vertical
towers/transmission lines4
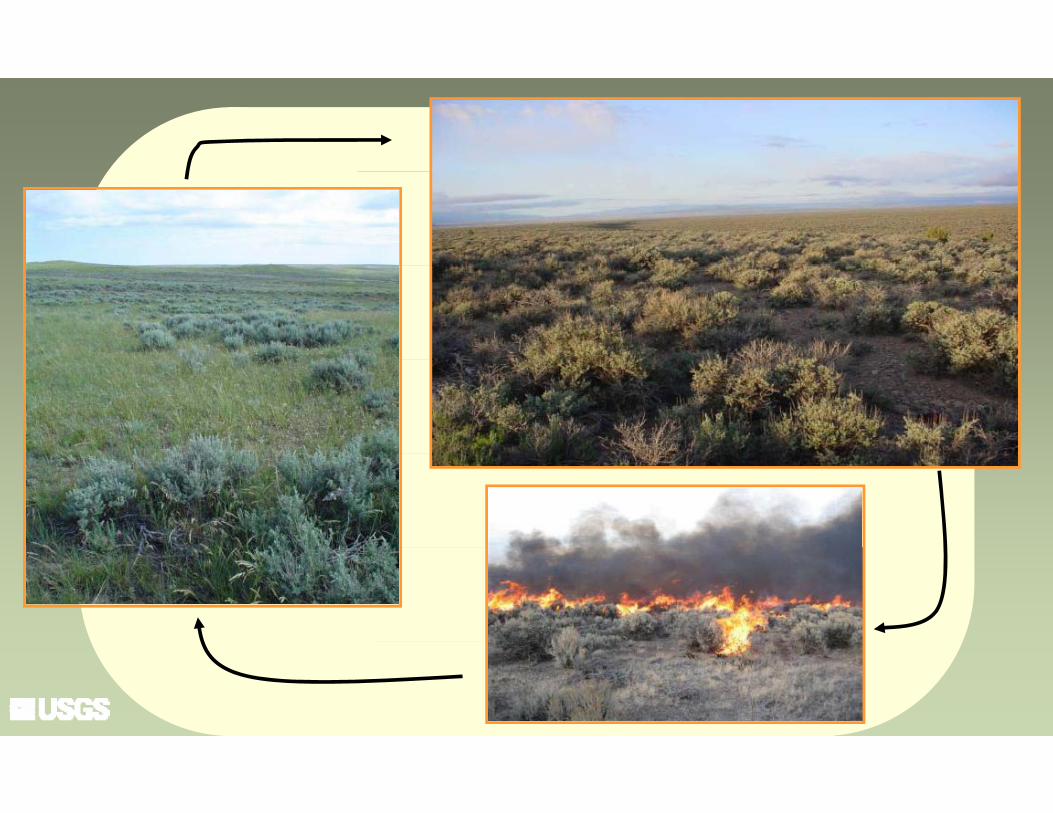
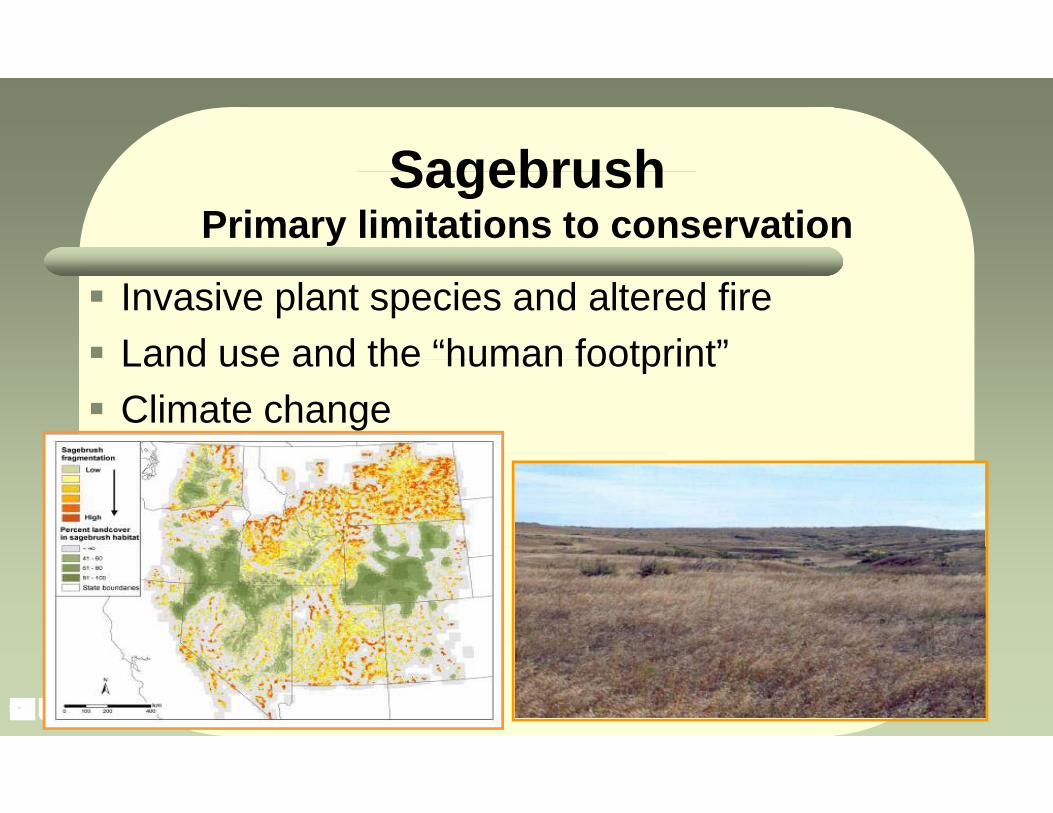
SagebrushSagebrushPrimary limitations to conservation
Invasive plant species and altered fire Land use and the “human footprint”Land use and the human footprint Climate change
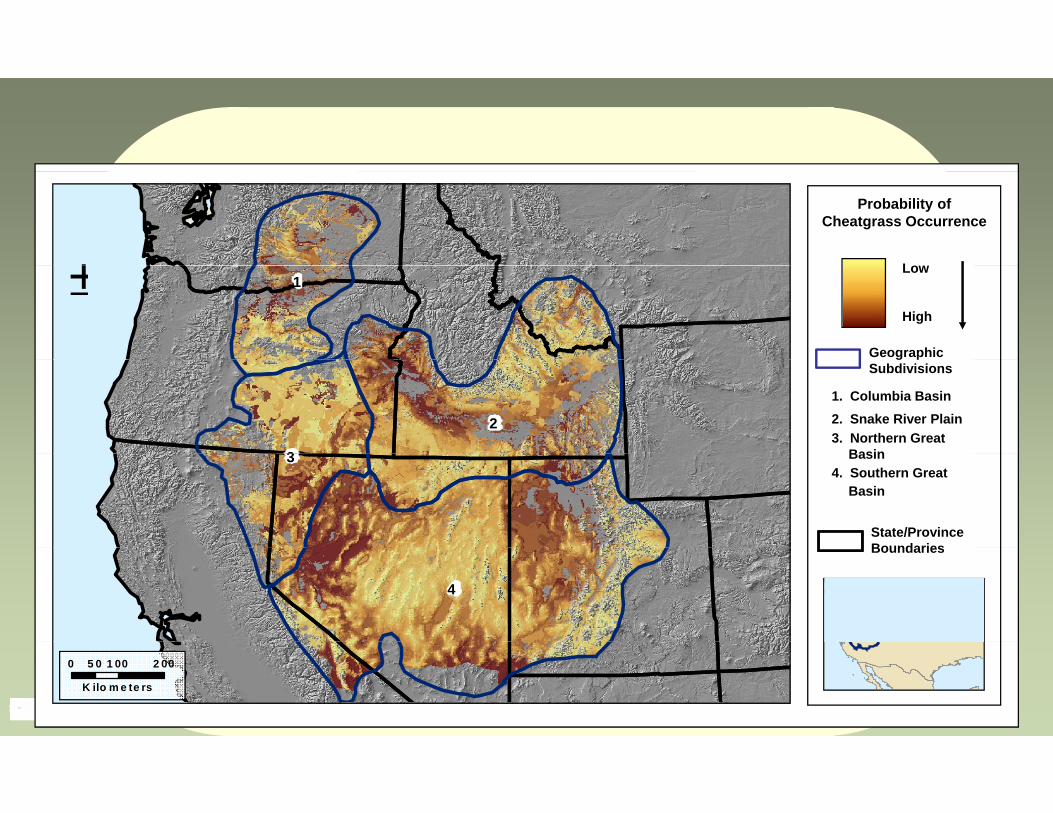
±Probability of
Cheatgrass Occurrence
Low1±
Geographic
Low
High
2
3
gSubdivisions
1. Columbia Basin2. Snake River Plain3. Northern Great
Basin3
State/Province Boundaries
Basin4. Southern Great
Basin
4
Boundaries
0 1 00 2 005 0
K ilo m e te rs
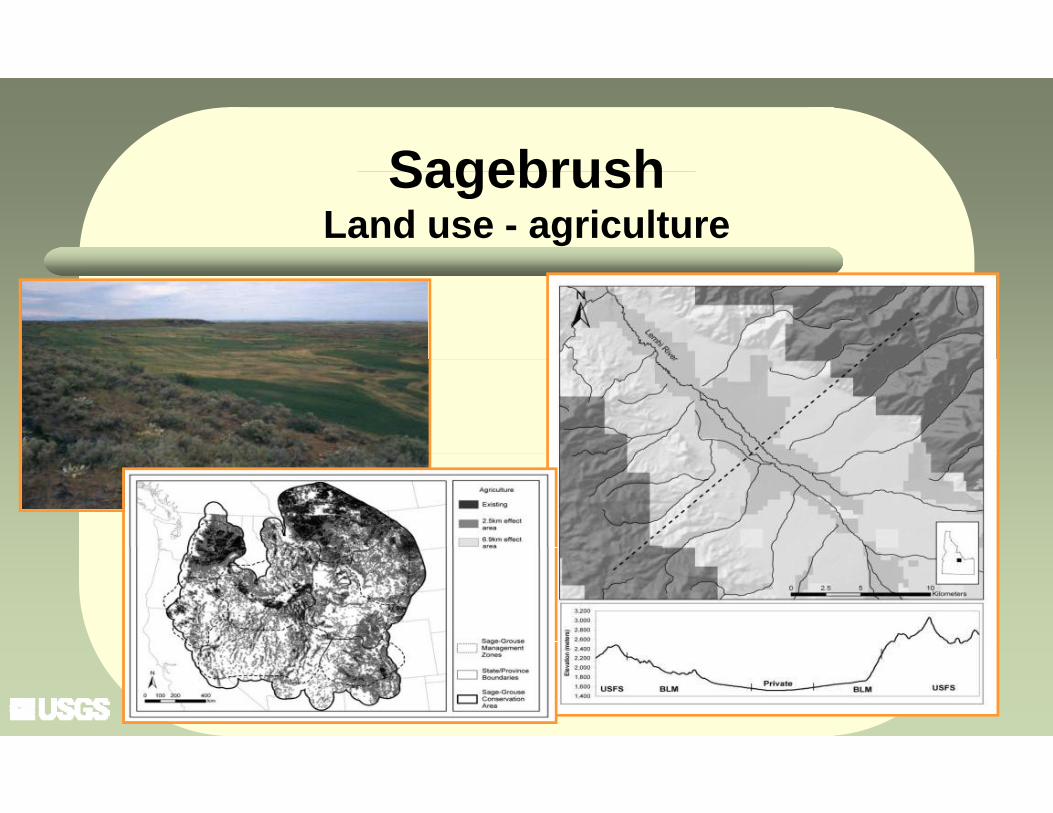
SagebrushSagebrushLand use - agriculture
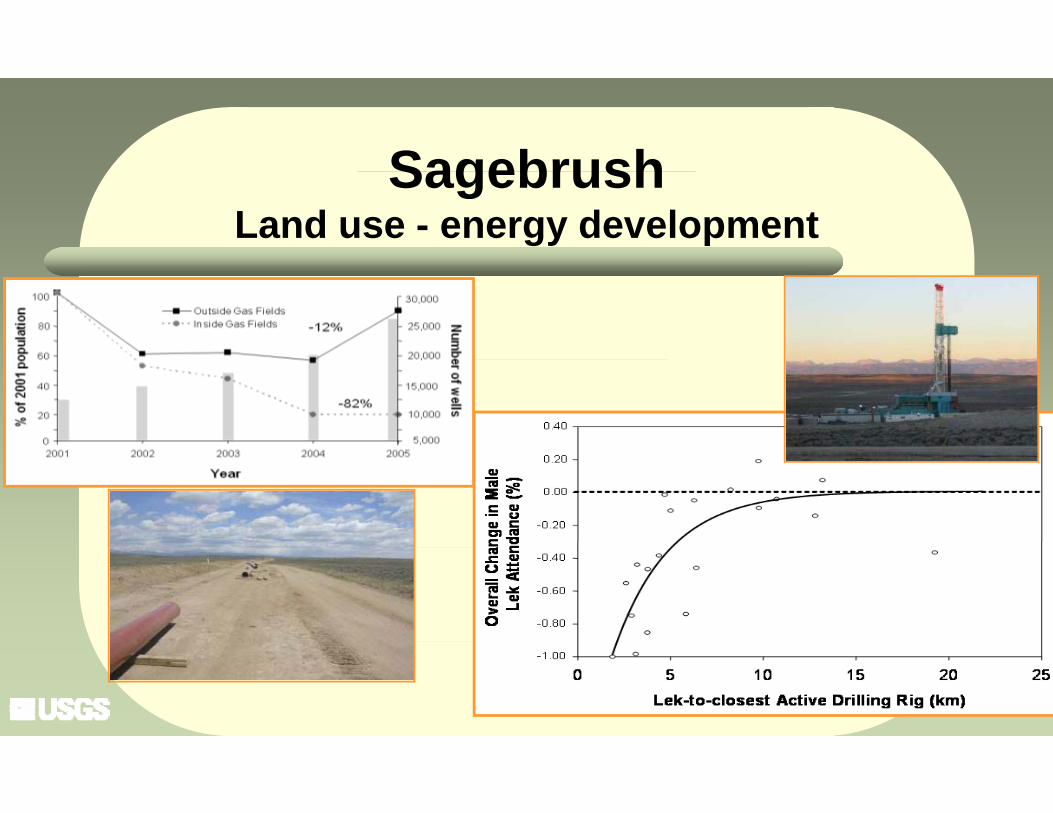
SagebrushSagebrushLand use - energy development
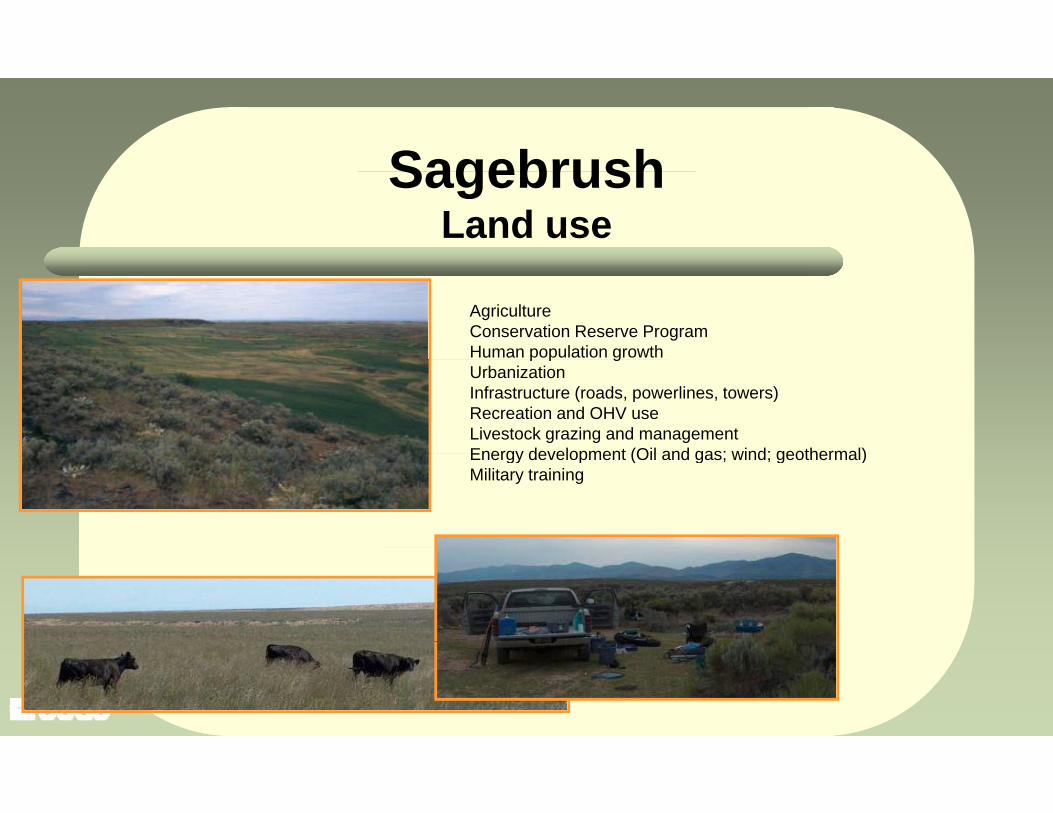
SagebrushSagebrushLand use
AgricultureConservation Reserve ProgramHuman population growthp p gUrbanizationInfrastructure (roads, powerlines, towers)Recreation and OHV useLivestock grazing and managementEnergy development (Oil and gas; wind; geothermal)Energy development (Oil and gas; wind; geothermal)Military training
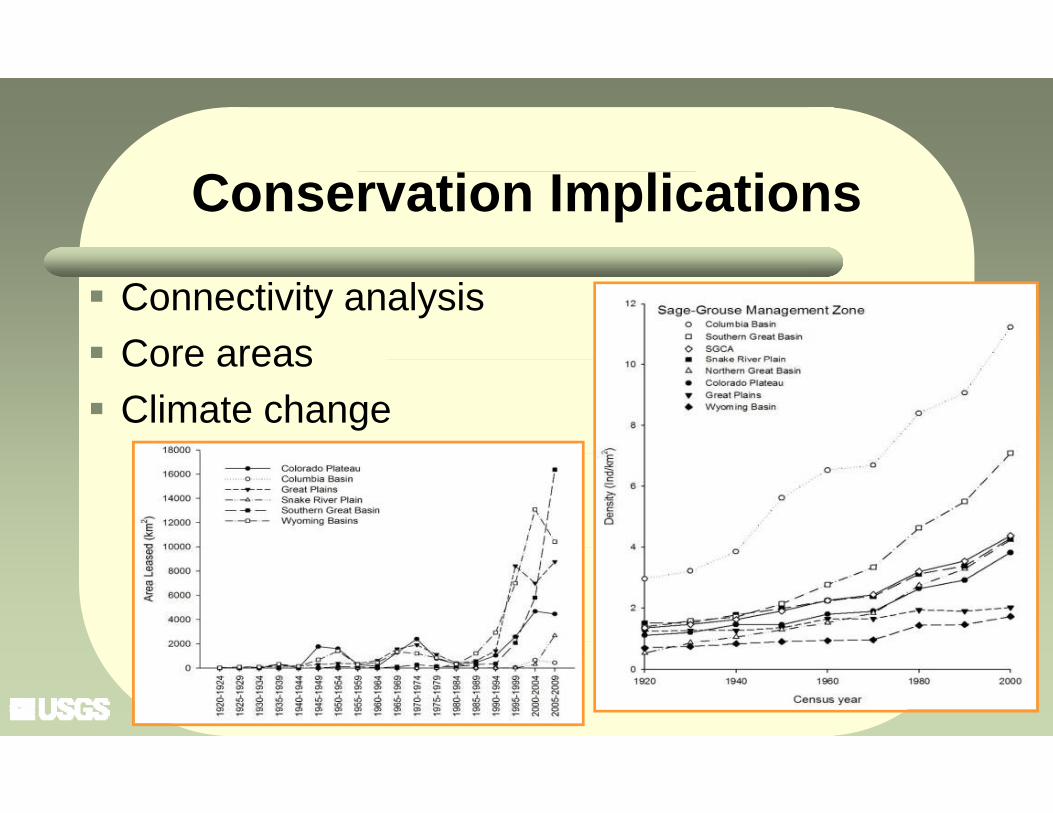
Conservation Implications
Connectivity analysis Core areasCore areas Climate change
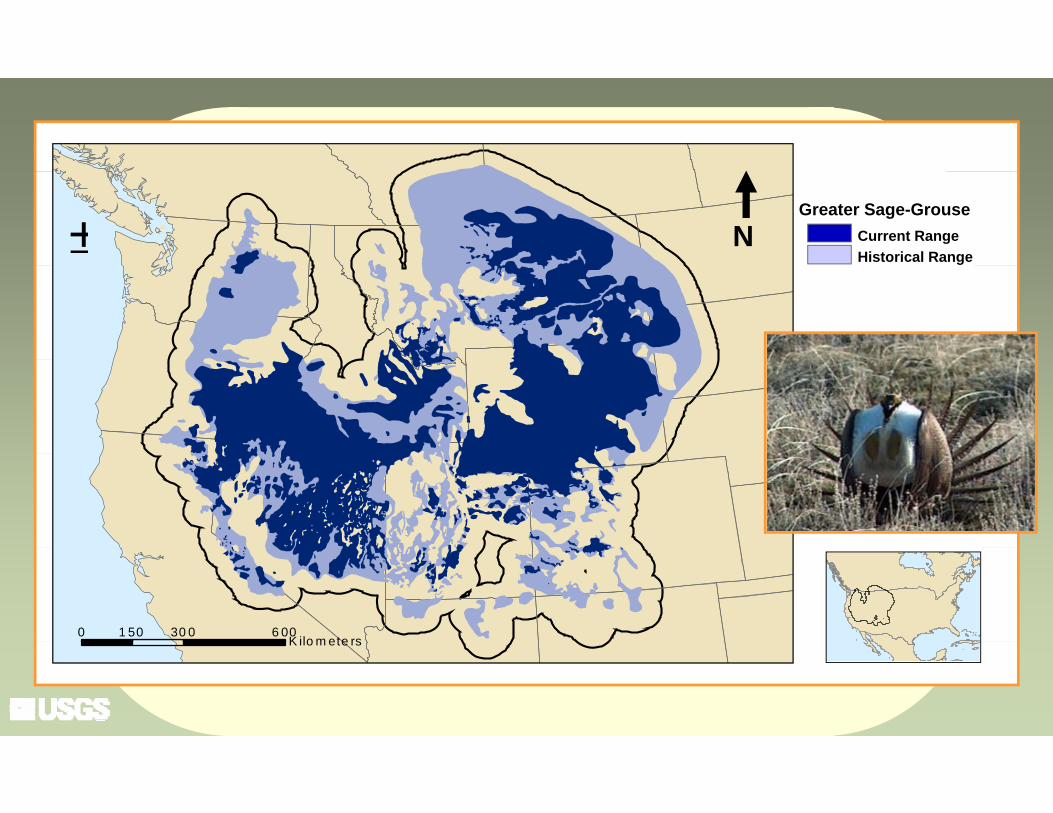
± NGreater Sage-Grouse
Historical RangeCurrent Range
0 30 0 6 001 50K ilo m ete rsK ilo m ete rs
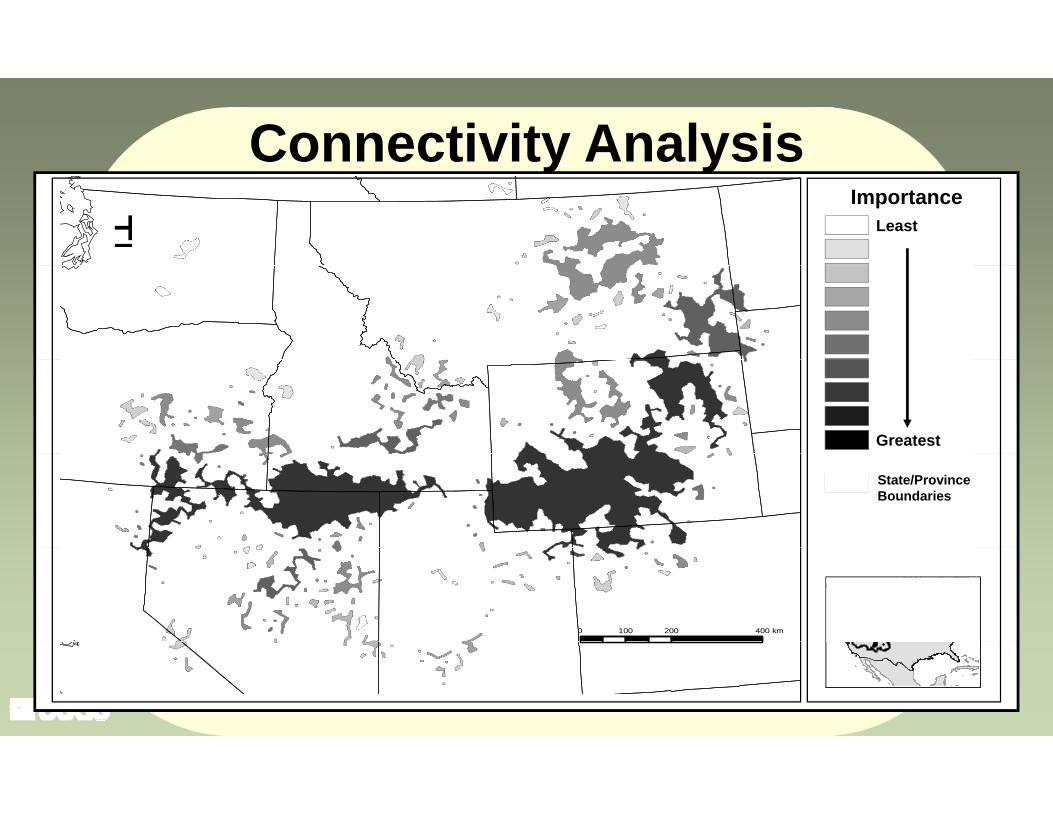
Connectivity Analysisy yImportance
± Least
Greatest
State/Province Boundaries
0 200 400100 km
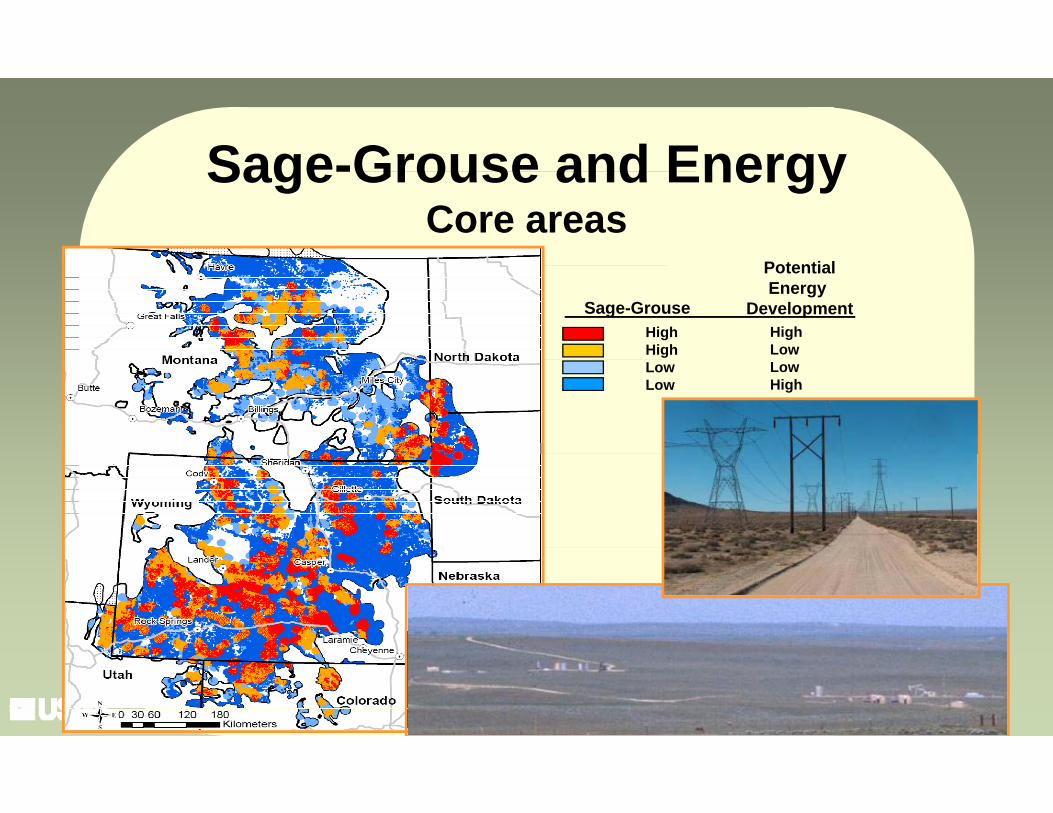
Sage-Grouse and EnergySage-Grouse and EnergyCore areas
Potential
HighHigh
HighLow
Sage-Grouse
PotentialEnergy
Development
LowLow
LowHigh
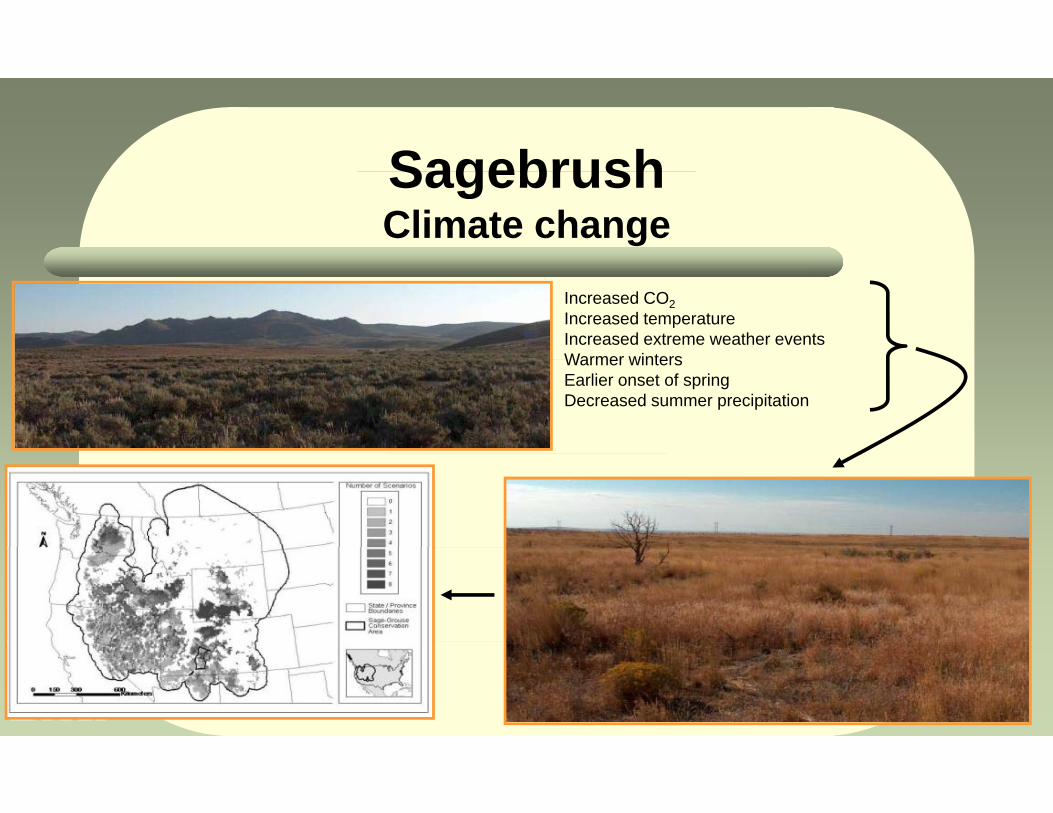
SagebrushSagebrushClimate change
Increased CO2Increased temperatureIncreased extreme weather eventsWarmer wintersWarmer wintersEarlier onset of springDecreased summer precipitation
Conclusions
Sage-grouse populations reduced Immediate stressors on sagebrush are invasive plant Immediate stressors on sagebrush are invasive plant
species, fire, human footprint Connectivity and core areas concepts delineating highConnectivity and core areas concepts delineating high
priority areas for conservation and restoration Climate change
History and our current use of the vast landscapes dominated by sagebrush can tell us much about land use, priorities, values, and resource management. The future will tell others about the effectiveness of conservation actions we implement today.
(Knick and Connelly, Introduction)
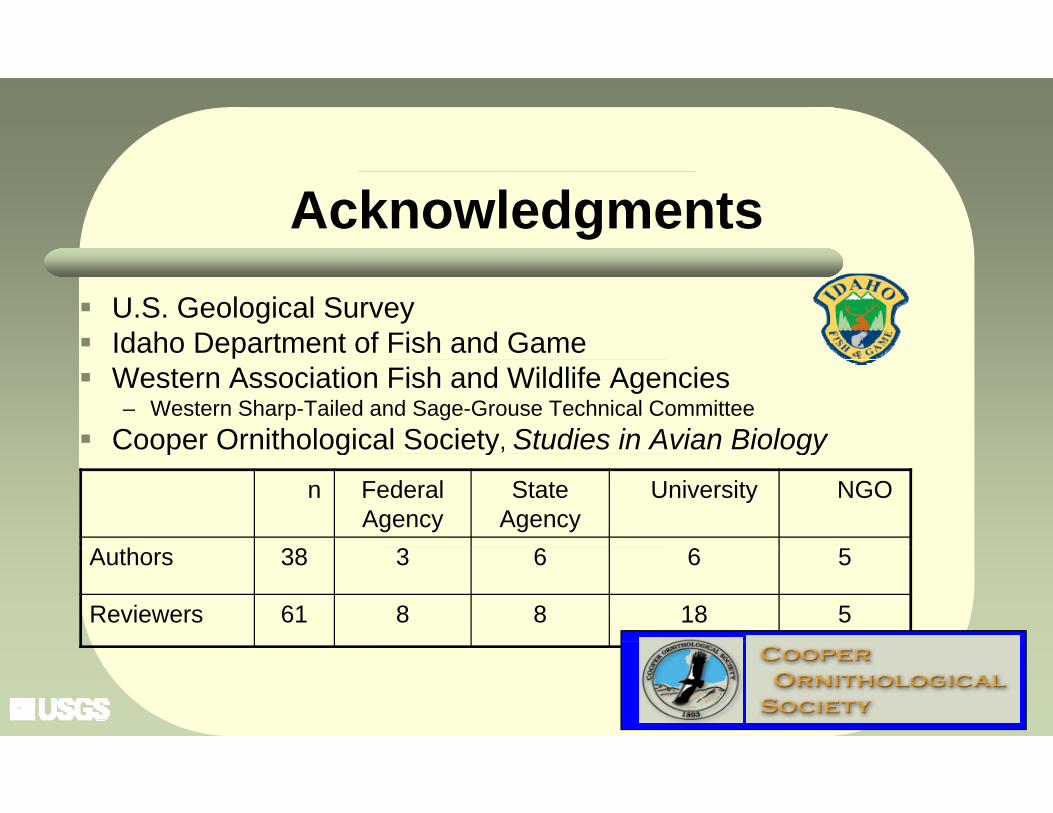
Acknowledgments U.S. Geological Survey Idaho Department of Fish and Game Western Association Fish and Wildlife Agencies
– Western Sharp-Tailed and Sage-Grouse Technical Committee Cooper Ornithological Society, Studies in Avian Biologyp g y gy
n Federal Agency
State Agency
University NGO
A h 38 3 6 6Authors 38 3 6 6 5
Reviewers 61 8 8 18 5
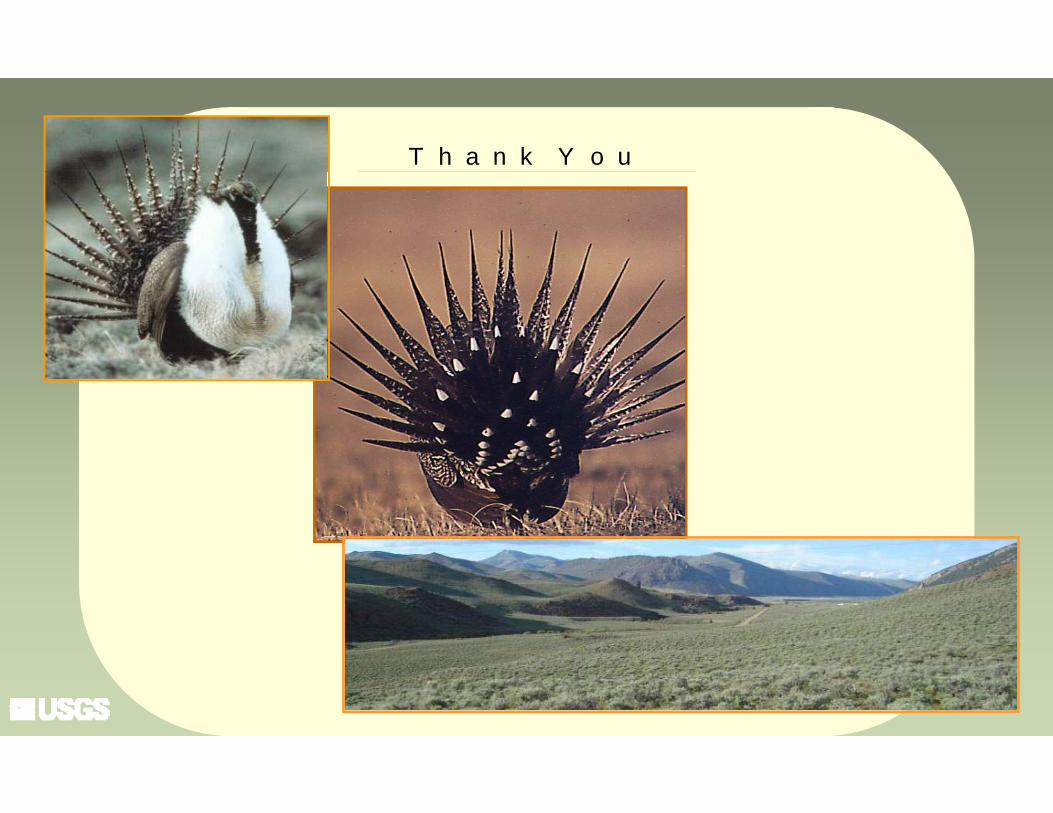
T h a n k Y o u