id411 dominance and symmetry in partner violence by male and female university students in 32...
TRANSCRIPT
ID41 1
DOMINANCE AND SYMMETRY IN PARTNER VIOLENCE BY MALE AND FEMALE
UNIVERSITY STUDENTS IN 32 NATIONS
Murray A. StrausFamily Research Laboratory, University of New Hampshire
Durham, NH 03824 603-862-2594 [email protected]: http://pubpages.unh.edu/~mas2
• Presented at the New Hampshire Commission on The Status of Men, Concord, NH 30 June 06. Based on paper presented at the conference on Trends In Intimate Violence Intervention, sponsored by the University of Haifa, Israel and New York University. New York City, May 22-25, 2006.
• Other publications on this and related issues can be downloaded from http//:www.pubpages.unh.edu/~mas2
• The work was supported by National Institute of Mental Health grant T32MH15161 and by the University of New Hampshire
ID41 2
DOMINANCE AND SYMMETRY IN PARTNER VIOLENCE BY MALE AND FEMALE
UNIVERSITY STUDENTS IN 32 NATIONS
SOME RESULTS FROM THE INTERNATIONAL DATING
VIOLENCE STUDY
Murray A. StrausUniversity Of New Hampshire

ID41 3
THE ISSUES
1. Is partner violence primarily perpetrated by men, as compared to women, and as compared to both partners engaging in violence?
2. To what extent is dominance by the male partner associated with partner violence, as compared to dominance by the female partner? In short is the issue one of male dominance or one of inequality between partners?
The answers to these questions can have profound implications for prevention and treatment of partner violence.
ID41 4

ID41 5
OBJECTIVES
1. DESCRIBE THE PREVALENCE OF THREE TYPES OF PHYSICAL VIOLENCE
• Female-Only• Male-Only• Both Violent
2. TEST HYPOTHESIS THAT DOMINANCE BY ONE PARTNER IS ASSOCIATED WITH AN INCREASED PROBABILITY OF ALL THREE TYPES
3. TEST HYPOTHESIS THAT THIS APPLIES TO DOMINANCE BY FEMALE PARTNERS AS WELL AS MALE PARTNERS
4. SUGGEST THE IMPLICATIONS FOR PREVENTION TREATMENT OF PARTNER VIOLENCE
ID41 6
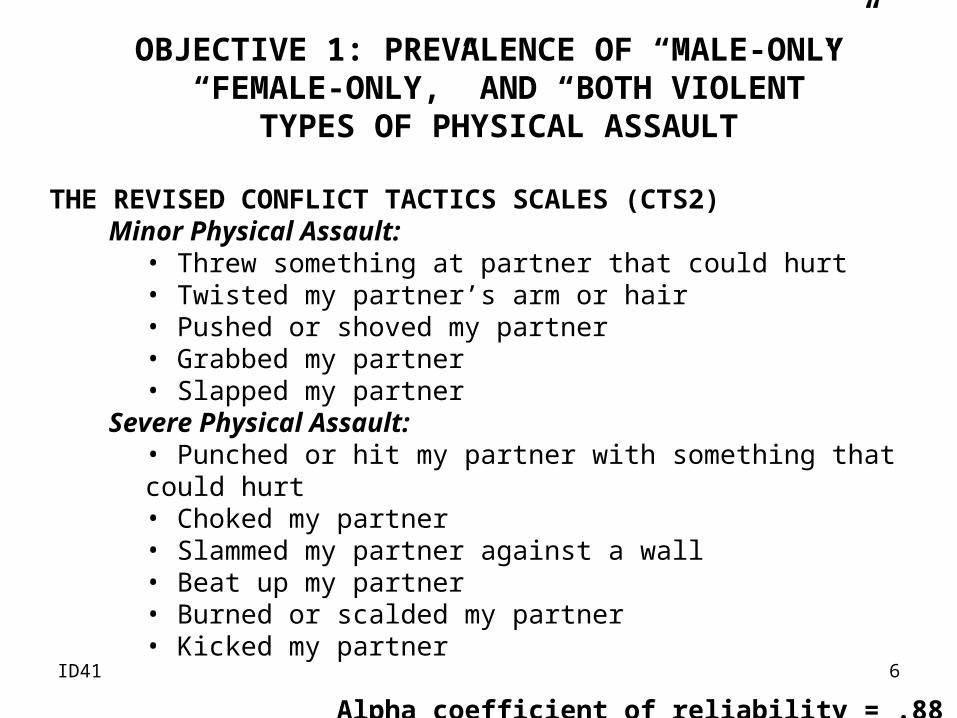
OBJECTIVE 1: PREVALENCE OF “MALE-ONLY” “FEMALE-ONLY,” AND “BOTH VIOLENT”
TYPES OF PHYSICAL ASSAULT
THE REVISED CONFLICT TACTICS SCALES (CTS2)Minor Physical Assault:
• Threw something at partner that could hurt• Twisted my partner’s arm or hair • Pushed or shoved my partner• Grabbed my partner• Slapped my partner
Severe Physical Assault:• Punched or hit my partner with something that could hurt• Choked my partner• Slammed my partner against a wall• Beat up my partner• Burned or scalded my partner• Kicked my partner
Alpha coefficient of reliability = .88

ID41 7
Table 3. Prevalence And Mutuality of Any Physical Violence
MUTUALITY TYPE
Nation
Assault Rate (%)
Male-Only %
Female-Only %
Both-Violent%
All (median) 31.2 9.9 21.4 68.6 IRN 77.1 4.0 1.3 94.6 MEX 44.1 6.6 15.5 77.7 ZAF 39.5 7.6 10.2 82.0 GBR 37.5 4.2 19.2 76.5 TZA 37.4 6.9 1.7 91.3 HKG 37.0 7.7 36.9 55.2 TWN 36.1 6.7 25.4 67.8 CHN 34.7 6.9 31.7 61.2 LTU 33.9 5.6 23.5 70.7 BEL 33.4 11.2 19.8 68.8 IND 32.3 8.3 16.6 75.0 KOR 32.2 8.0 19.3 72.5 RUS 32.2 2.8 27.1 70.0 ROU 31.9 6.9 25.5 67.4 NDL 31.7 4.6 24.2 71.0 USA 30.0 9.7 20.6 69.6 GRC 28.5 26.2 16.2 57.5 NZL 27.9 8.7 28.2 63.0 DEU 26.6 12.4 24.8 62.7 CAN 24.9 9.4 22.1 68.3 CHE 24.7 9.4 25.8 64.7 VEN 24.3 17.4 19.0 63.4 GTM 24.2 8.3 25.0 66.6 HUN 22.7 12.5 17.5 70.0 SGP 22.7 9.4 32.0 58.4 BRA 22. 15.2 13.5 71.1 JPN 21.4 7.6 11.5 80.7 AUS 20.2 14.0 21.0 64.9 MLT 19.1 21.7 30.4 47.8 ISR 18.6 9.8 27.8 62.3
SWE 17.9 11.8 28.4 59.7 PRT 16.6 13.6 22.7 63.6
NOTE
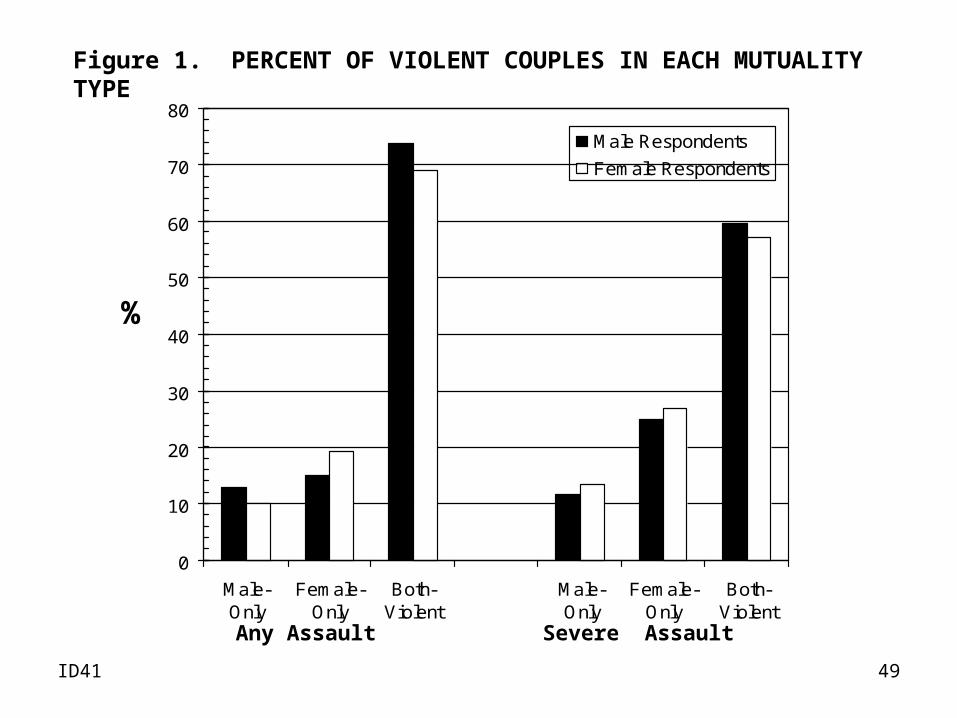
MALE-ONLY VIOLENCE Least frequent everywhere
FEMALE-ONLY VIOLENCE Double the rate of Male-Only
BOTH-VIOLENT Most common type everywhere
ID41 8
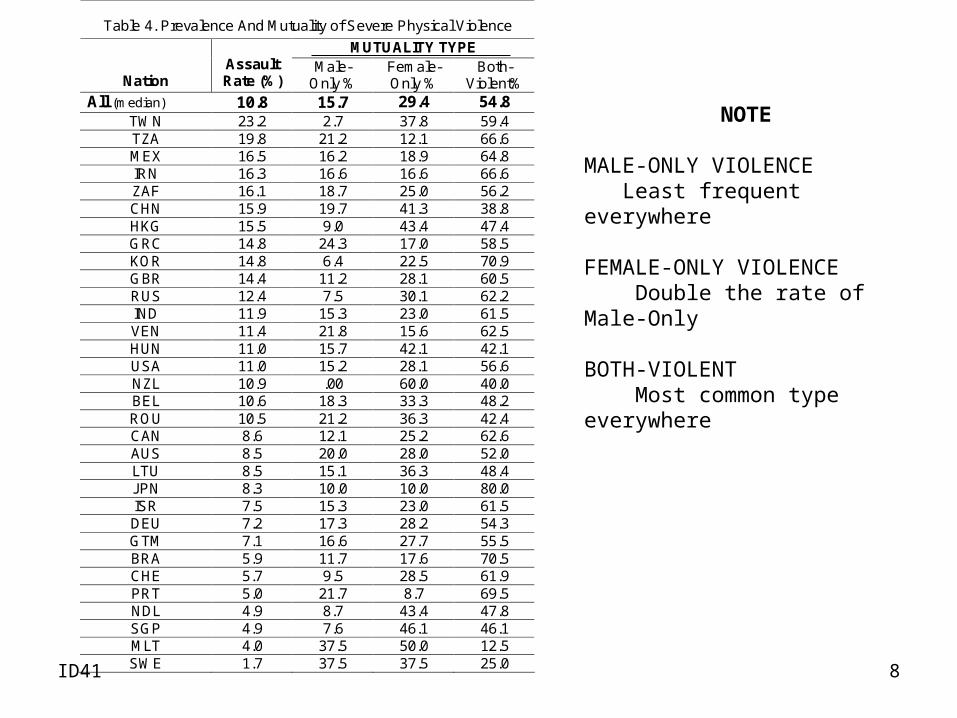
Table 4. Prevalence And Mutuality of Severe Physical Violence
MUTUALITY TYPE
Nation
Assault Rate (%)
Male-Only %
Female-Only %
Both-Violent%
All (median) 10.8 15.7 29.4 54.8 TWN 23.2 2.7 37.8 59.4 TZA 19.8 21.2 12.1 66.6 MEX 16.5 16.2 18.9 64.8 IRN 16.3 16.6 16.6 66.6 ZAF 16.1 18.7 25.0 56.2 CHN 15.9 19.7 41.3 38.8 HKG 15.5 9.0 43.4 47.4 GRC 14.8 24.3 17.0 58.5 KOR 14.8 6.4 22.5 70.9 GBR 14.4 11.2 28.1 60.5 RUS 12.4 7.5 30.1 62.2 IND 11.9 15.3 23.0 61.5 VEN 11.4 21.8 15.6 62.5 HUN 11.0 15.7 42.1 42.1 USA 11.0 15.2 28.1 56.6 NZL 10.9 .00 60.0 40.0 BEL 10.6 18.3 33.3 48.2 ROU 10.5 21.2 36.3 42.4 CAN 8.6 12.1 25.2 62.6 AUS 8.5 20.0 28.0 52.0 LTU 8.5 15.1 36.3 48.4 JPN 8.3 10.0 10.0 80.0 ISR 7.5 15.3 23.0 61.5 DEU 7.2 17.3 28.2 54.3 GTM 7.1 16.6 27.7 55.5 BRA 5.9 11.7 17.6 70.5 CHE 5.7 9.5 28.5 61.9 PRT 5.0 21.7 8.7 69.5 NDL 4.9 8.7 43.4 47.8 SGP 4.9 7.6 46.1 46.1 MLT 4.0 37.5 50.0 12.5 SWE 1.7 37.5 37.5 25.0
NOTE
MALE-ONLY VIOLENCE Least frequent everywhere
FEMALE-ONLY VIOLENCE Double the rate of Male-Only
BOTH-VIOLENT Most common type everywhere
ID41 9
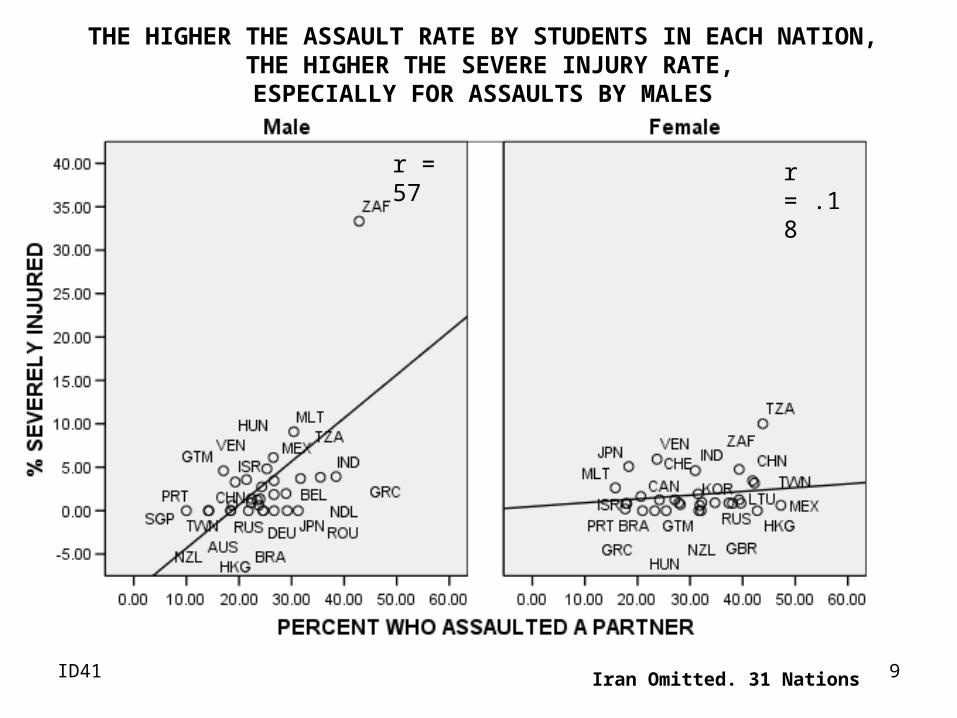
THE HIGHER THE ASSAULT RATE BY STUDENTS IN EACH NATION, THE HIGHER THE SEVERE INJURY RATE, ESPECIALLY FOR ASSAULTS BY MALES
r = 57 r = .18
Iran Omitted. 31 Nations

ID41 10
CONCLUSIONS ABOUT PREVALENCE AND MUTUALITY OF PHYSICAL ASSAULT
Students in some national settings have lower rates than elsewhere, but the rates are high even in low ranking countries such as Sweden and Portugal
About a third of the violence is “Severe” among these students, as in many other studies, and a
substantial percent are injuredThroughout the world, women students physically
assault dating partners at about the same rate as men Male-Only violence is rare among university student
couples throughout the world When there is violence, predominant pattern is
Both-Violent These assaults are a threat to the physical and mental
health of students

ID41 11
WOMEN HITTING MEN IS A SERIOUS PROBLEMEVEN "HARMLESS" ASSAULTS BY WOMEN ARE
SERIOUS AND NEED TO BE A FOCUS OF PREVENTION AND TREATMENT
DANGEROUS FOR WOMEN HARMFUL TO CHILDREN A CRIME MORALLY WRONG HELPS PERPETUATE THE IMPLICIT CULTURAL NORMS TOLERATING FAMILY VIOLENCE
ALSO
A SUBSTANTIAL NUMBER ARE NOT PHYSICALLY HARMLESS
* A THIRD OF ALL DOMESTIC HOMICIDES ARE BY WOMEN * 10 TO 40% OF PARTNER VIOLENCE INJURIES ARE INFLICTED
BY WOMEN

ID41 12
F = 14.8*** 7,597 WOMEN. CONTROLLING FOR SOCIAL DESIRABILITY
THE “HARMLESS SLAP” BY A WOMEN IS A THREAT TO HER HEALTH52% of the women in the IDVS approved of slapping a husband’s face. Those who approved were much more likely to have been severely assaulted and injured by
their partner

ID41 13
OBJECTIVE 2:TEST THE HYPOTHESIS THAT DOMINANCE BY ONE
PARTNER IS ASSOCIATED WITH AN INCREASED PROBABILITY OF ALL THREE TYPES PARTNER VIOLENCE
METHOD: Multinomial logistic regression
INDEPENDENT VARIABLE: Dominance scale score (Personal and Relationships Profile (PRP), Straus et al. 1999)
Example items:“I generally have the final say when my partner and I disagree”“My partner needs to remember that I am in charge.”
Response categories: 1 = Strongly Disagree, 2 = Disagree, 3 = Agree, 4 = Strongly Agree
. Scale score: mean of the nine items. Range of scores to 4A actual range: 1 to 3.96 (mean = 1 95, SD = 0.39).

ID41 14
DOMINANCE SCALE
Dominance describes relationships that are hierarchical and in which the person with greater advantage uses that advantage to gain status, privilege, or control over his or her partner. 3 dimensions
Authority166 DO09. Sometimes I have to remind my partner of who’s boss103 DO6. I generally have the final say when my partner and I disagree93 DO05. My partner needs to remember that I am in charge
Disparagement17 DO03R. My partner is basically a good person (R)7 DO02R. People usually like my partner (R)4 DO01. My partner doesn’t have enough sense to make important
decisionsRestrictiveness
54 DO04. I have a right to know everything my partner does152 DO08. I insist on knowing where my partner is at all times126 DO07. I have a right to be involved with anything my partner does

ID41 15
DOMINANCE SCALE SCORES
IN RANK ORDER OF MALE DOMINANCE SCORE (Mean of students in each nation)
Tanzania = most underdeveloped of the 32
Sweden = Nation known for its gender equality legislation
Partial correlation with United Nations Gender Empowerment Measure = .69
NATION MALES FEMALES
ALL 1.98 1.99 TZA 2.38 2.38 RUS 2.37 2.21 IRN 2.27 2.32
TWN 2.23 2.28 CHN 2.22 2.15 GRC 2.17 1.98 KOR 2.17 2.25 LTU 2.11 2.20 HKG 2.10 2.16 IND 2.10 2.18 HUN 2.08 1.93 MEX 2.03 2.10 VEN 2.03 1.93 ZAF 2.01 2.08 ROU 2.00 2.01 GTM 1.97 1.98 BRA 1.96 1.94 SGP 1.96 2.03 USA 1.93 1.91 JPN 1.90 1.97 PRT 1.89 1.89 DEU 1.82 1.90 ISR 1.81 1.86 AUS 1.80 1.83 GBR 1.80 1.87 BEL 1.77 1.80 MLT 1.75 1.95 NZL 1.75 1.82 CAN 1.73 1.81 CHE 1.73 1.76 NDL 1.67 1.70 SWE 1.65 1.68

ID41 16
Partial r = .-.69
THE HIGHER THE EMPOWERMENT OF WOMEN IN A NATION, THE LOWER THE DOMINANCE OF MEN IN DATING RELATIONSHIPS (29 Nations

ID41 17
Table 5. Logistic Regression For Relation of Dominance By One Partner To Violence Mutuality Types – All Violence, by Gender
ODDS RATIO FOR
Dependent Variable
Independent Variables
MALES FEMALE
Dominance Scale 2.29* 2.62**
Age (years) .96 .99
Relationship Length (months) 1.03* 1.03**
Socioeconomic Status Scale .91 1.05
Male- Only Violence
Social Desirability Scale .93 .90
Dominance Scale 1.97** 3.43**
Age (years) .97 .98**
Relationship Length (months) 1.04** 1.034**
Socioeconomic Status Scale 1.05 .98
Female- Only Violence
Social Desirability Scale .78 .42**
Dominance Scale 3.09** 4.22**
Age (years) .97** .96
Relationship Length (months) 1.05** 1.05**
Socioeconomic Status Scale 1.04 1.00
Both Violent
Social Desirability Scale .31** .35**

ID41 18
Table 6. Logistic Regression For Relation of Dominance By One Partner To Violence Mutuality Types - SEVERE Violence, by
Gender
ODDS RATIO FOR
Dependent Variable
Independent Variables
MALES FEMALE
Dominance Scale 5.147** 5.010**
Age (years) 0.983 1.005
Relationship Length (months) 1.038** 1.029**
Socioeconomic Status Scale 0.957 0.991
Male- Only Violence
Social Desirability Scale 0.663 0.863
Dominance Scale 1.678* 4.344**
Age (years) 0.977 0.977*
Relationship Length (months) 1.038** 1.034**
Socioeconomic Status Scale 0.912 1.117*
Female- Only Violence
Social Desirability Scale 0.530* 0.345**
Dominance Scale 4.497** 5.708**
Age (years) 0.991 0.973**
Relationship Length (months) 1.026** 1.041**
Socioeconomic Status Scale 1.047 0.982
Both Violent
Social Desirability Scale 0.403** 0375**
ID41 19
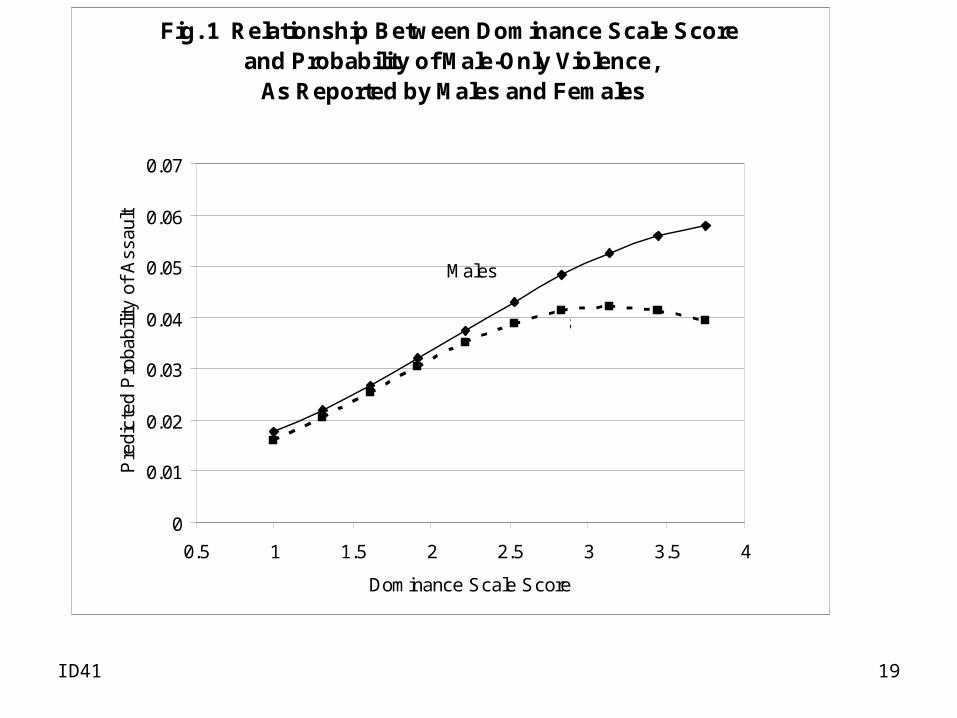
Fig. 1 Relationship Between Dominance Scale Score and Probability of Male-Only Violence, As Reported by Males and Females
0
0.01
0.02
0.03
0.04
0.05
0.06
0.07
0.5 1 1.5 2 2.5 3 3.5 4
Dominance Scale Score
Pre
dict
ed P
roba
bilit
y of
Ass
ault
Males
Females
ID41 20
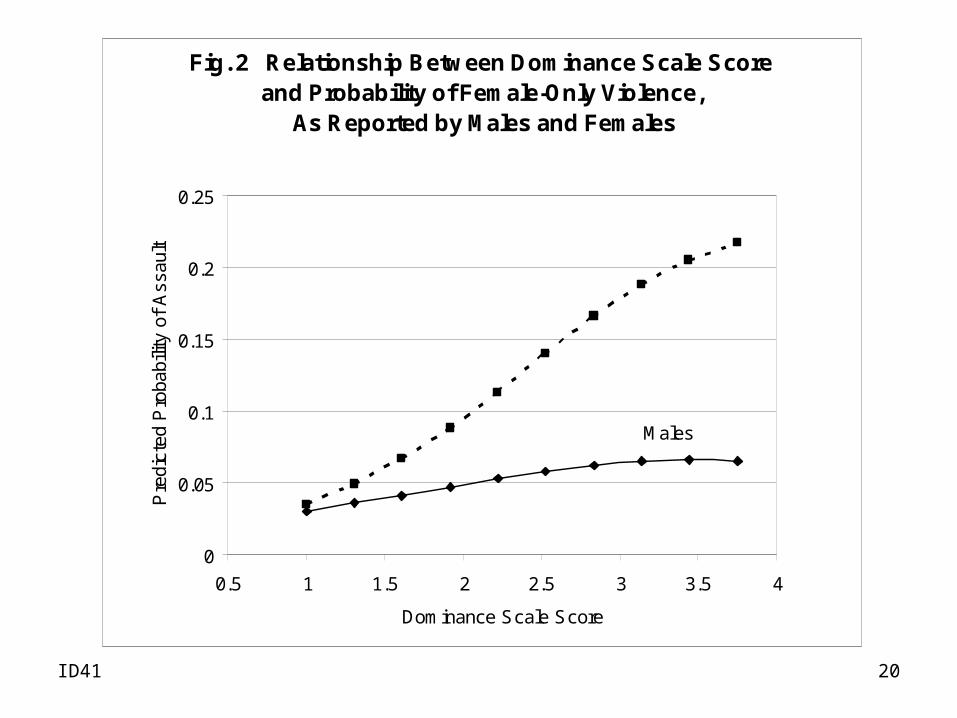
Fig. 2 Relationship Between Dominance Scale Score and Probability of Female-Only Violence,
As Reported by Males and Females
0
0.05
0.1
0.15
0.2
0.25
0.5 1 1.5 2 2.5 3 3.5 4
Dominance Scale Score
Pre
dict
ed P
roba
bilit
y of
Ass
ault
Males
Females

ID41 21
Fig. 3. Relationship Between Dominance Scale Score and Probability of Violence By Both Partners,
as Reported by Males and Females
0
0.1
0.2
0.3
0.4
0.5
0.6
0.7
0.5 1 1.5 2 2.5 3 3.5 4
Dominance Scale Score
Pre
dict
ed P
roba
bilit
y of
Ass
ault
MalesFemales

ID41 22
Significant Relation Between Violence And
Dominance By:
Study
Sample Males Females
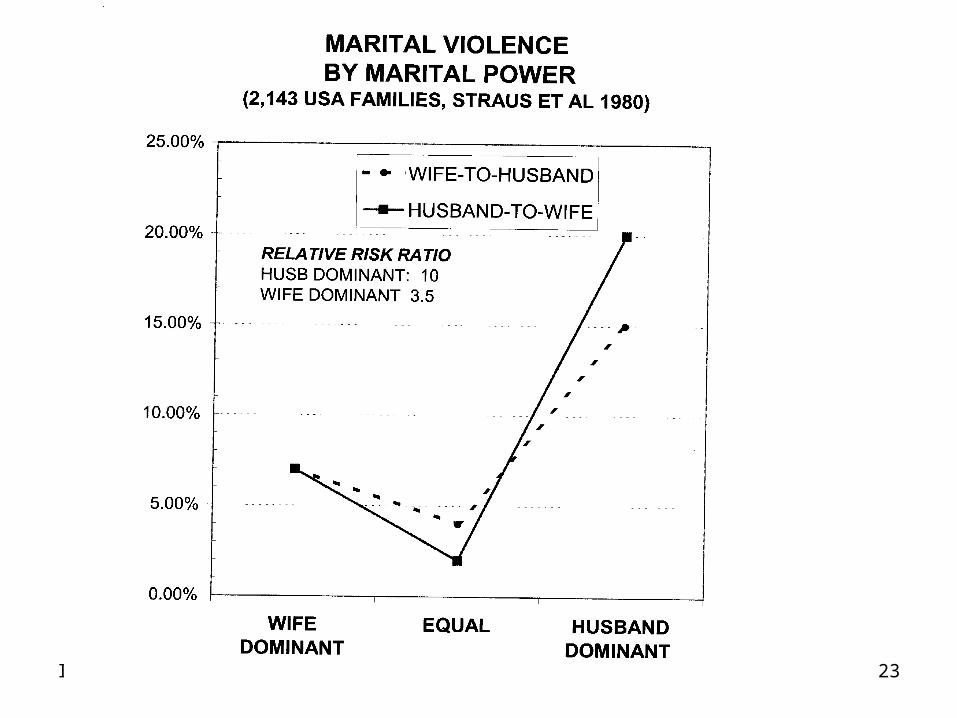
(Straus, Gelles, & Steinmetz, 1980)
US, National survey Yes Yes
Medeiros & Straus (2006) US, University students Yes Yes (So-Kum Tang, 1999) Hong Kong, community
sample Yes Yes
(Kim, 2003) Korea, National Yes Yes (Straus & Consortium - this paper)
University students in 32 countries
Yes Yes
Siguhara & Warner, 2002 US, Mexican American Yes Yes
K
FIVE OTHER STUDIES IN KOREA, HONG KONG, MEXICO, AND USAALSO FIND THAT DOMINANCE BY EITHER A MALE OR FEMALE PARTNER INCREASES THE PROBABILITY OF ASSAULT BY BOTH WOMEN AND MEN
INEQUALITY INCREASES THE PROBABILITY OF VIOLENCE, NO MATTER WHO IS DOMINANT
ID41 23

ID41 24
DOMINANCE IS ONLY ONEOF MANY CAUSES OF PARTNER VIOLENCE
AND NOT NECESSARILY THE MOST IMPORTANT
SOME OTHER CAUSES FOR WHICH THERE IS EVIDENCE:• Alcohol abuse• Antisocial and Borderline personality• Lack of social skills• Impulsivity• Stress• DepressionNext two slides• Implicit cultural norms that tolerate low-level violence• Corporal punishment
ID41 25
APPROVE %: MALES APPROVE %: FEMALES
NATION HUSB
SLAP WIFE WIFE SLAP
HUSB HUSB SLAP
WIFE WIFE SLAP
HUSB MEAN 29.5 50.9 25.4 53.2
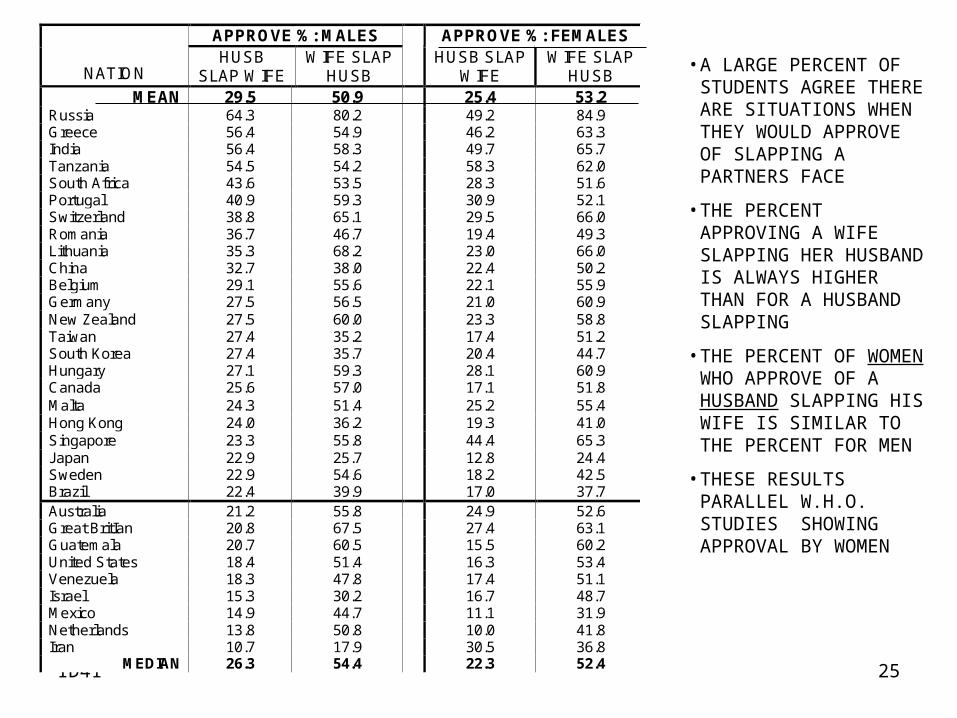
Russia 64.3 80.2 49.2 84.9 Greece 56.4 54.9 46.2 63.3 India 56.4 58.3 49.7 65.7 Tanzania 54.5 54.2 58.3 62.0 South Africa 43.6 53.5 28.3 51.6 Portugal 40.9 59.3 30.9 52.1 Switzerland 38.8 65.1 29.5 66.0 Romania 36.7 46.7 19.4 49.3 Lithuania 35.3 68.2 23.0 66.0 China 32.7 38.0 22.4 50.2 Belgium 29.1 55.6 22.1 55.9 Germany 27.5 56.5 21.0 60.9 New Zealand 27.5 60.0 23.3 58.8 Taiwan 27.4 35.2 17.4 51.2 South Korea 27.4 35.7 20.4 44.7 Hungary 27.1 59.3 28.1 60.9 Canada 25.6 57.0 17.1 51.8 Malta 24.3 51.4 25.2 55.4 Hong Kong 24.0 36.2 19.3 41.0 Singapore 23.3 55.8 44.4 65.3 Japan 22.9 25.7 12.8 24.4 Sweden 22.9 54.6 18.2 42.5 Brazil 22.4 39.9 17.0 37.7 Australia 21.2 55.8 24.9 52.6 Great BritIan 20.8 67.5 27.4 63.1 Guatemala 20.7 60.5 15.5 60.2 United States 18.4 51.4 16.3 53.4 Venezuela 18.3 47.8 17.4 51.1 Israel 15.3 30.2 16.7 48.7 Mexico 14.9 44.7 11.1 31.9 Netherlands 13.8 50.8 10.0 41.8 Iran 10.7 17.9 30.5 36.8
MEDIAN 26.3 54.4 22.3 52.4
• A LARGE PERCENT OF STUDENTS AGREE THERE ARE SITUATIONS WHEN THEY WOULD APPROVE OF SLAPPING A PARTNERS FACE
• THE PERCENT APPROVING A WIFE SLAPPING HER HUSBAND IS ALWAYS HIGHER THAN FOR A HUSBAND SLAPPING
• THE PERCENT OF WOMEN WHO APPROVE OF A HUSBAND SLAPPING HIS WIFE IS SIMILAR TO THE PERCENT FOR MEN
• THESE RESULTS PARALLEL W.H.O. STUDIES SHOWING APPROVAL BY WOMEN

ID41 26
SPANKING –THE PRIMORDIAL VIOLENCE
TEACHES THAT HITTING TO CORRECT MISBEHAVIOR IS MORAL BEHAVIOR

ID41 27

ID41 28
THE LARGER THE PERCENT WHO EXPERIENCED CORPORAL PUNISHMENTAS A CHILD, THE LARGER THE PERCENT WHO SEVERELY ASSAULTED A PARTNER
r = .28 r = .71
ID41 29
POLICY AND PROGRAM IMPLICATIONSABOUT DATING VIOLENCE
More recognition needed that:
Dating partner violence is about three times more prevalent than violence between married couples
It is a serious mental and physical health problem
More prevention & treatment effort for students is needed

ID41 30
IMPLICATIONS FOR PREVENTION AND TREATMENT
Victim services should continue to give priority to women because women are injured more, physically, psychologically, & economically
Time for major changes in prevention and offender treatment Give equal attention to prevention of partner violence by women and
treatment of female offenders because: Women are half the offenders. Ignoring this cripples prevention and treatment efforts Prevention of female violence needed to protect women because
violence by women is a major contributor to victimization of women. Therefore efforts to end partner violence by women will contribute to protecting women
Abandon the single-cause fallacy of male-dominance and attend to: Dominance by either partner The multiplicity of other factors, including the primordial violence
spanking children The similarity of causes of violence by men and women

ID41 31
IT IS TIME TO MAKE THE FOCUS
• Ending All Family violence
• Starting with spanking children
• Including violence BY women, not just violence against women
ONLY THEN WILL WOMEN, AS WELL AS ALL OTHER HUMAN BEINGS, BE
SAFE IN THEIR OWN HOMES

ID41 32
END FOR SOC 695
ID41 33
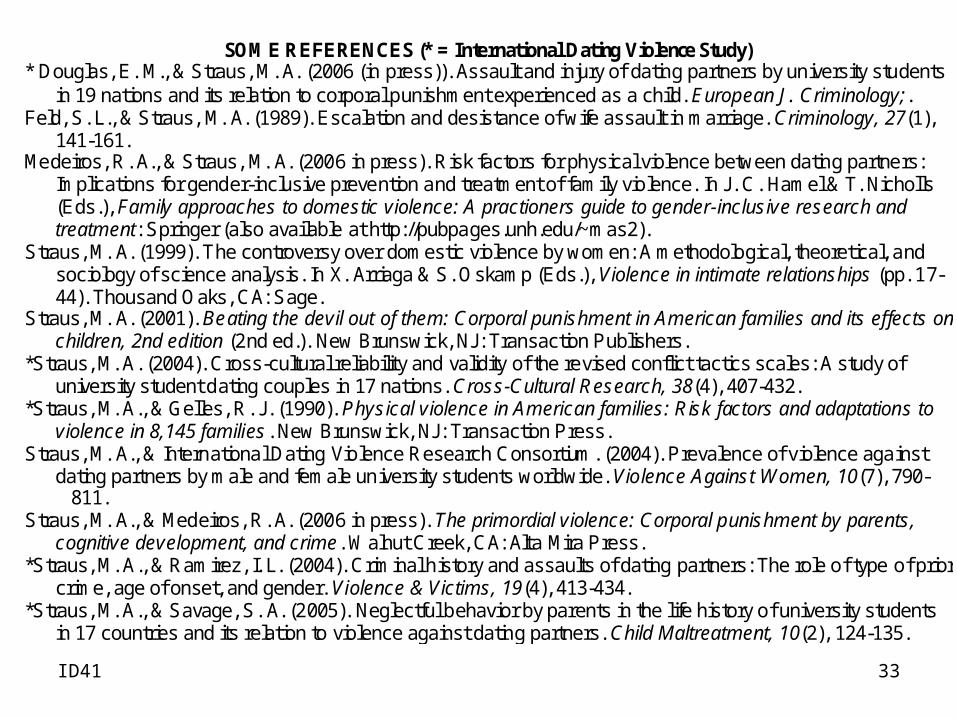
SOME REFERENCES (* = International Dating Violence Study) * Douglas, E. M., & Straus, M. A. (2006 (in press)). Assault and injury of dating partners by university students
in 19 nations and its relation to corporal punishment experienced as a child. European J. Criminology;. Feld, S. L., & Straus, M. A. (1989). Escalation and desistance of wife assault in marriage. Criminology, 27(1),
141-161. Medeiros, R. A., & Straus, M. A. (2006 in press). Risk factors for physical violence between dating partners:
Implications for gender-inclusive prevention and treatment of family violence. In J. C. Hamel & T. Nicholls (Eds.), Family approaches to domestic violence: A practioners guide to gender-inclusive research and treatment: Springer (also available at http://pubpages.unh.edu/~mas2).
Straus, M. A. (1999). The controversy over domestic violence by women: A methodological, theoretical, and sociology of science analysis. In X. Arriaga & S. Oskamp (Eds.), Violence in intimate relationships (pp. 17-44). Thousand Oaks, CA: Sage.
Straus, M. A. (2001). Beating the devil out of them: Corporal punishment in American families and its effects on children, 2nd edition (2nd ed.). New Brunswick, NJ: Transaction Publishers.
*Straus, M. A. (2004). Cross-cultural reliability and validity of the revised conflict tactics scales: A study of university student dating couples in 17 nations. Cross-Cultural Research, 38(4), 407-432.
*Straus, M. A., & Gelles, R. J. (1990). Physical violence in American families: Risk factors and adaptations to violence in 8,145 families. New Brunswick, NJ: Transaction Press.
Straus, M. A., & International Dating Violence Research Consortium. (2004). Prevalence of violence against dating partners by male and female university students worldwide. Violence Against Women, 10(7), 790- 811.
Straus, M. A., & Medeiros, R. A. (2006 in press). The primordial violence: Corporal punishment by parents, cognitive development, and crime. Walnut Creek, CA: Alta Mira Press.
*Straus, M. A., & Ramirez, I. L. (2004). Criminal history and assaults of dating partners: The role of type of prior crime, age of onset, and gender. Violence & Victims, 19(4), 413-434.
*Straus, M. A., & Savage, S. A. (2005). Neglectful behavior by parents in the life history of university students in 17 countries and its relation to violence against dating partners. Child Maltreatment, 10(2), 124-135.
ID41 34
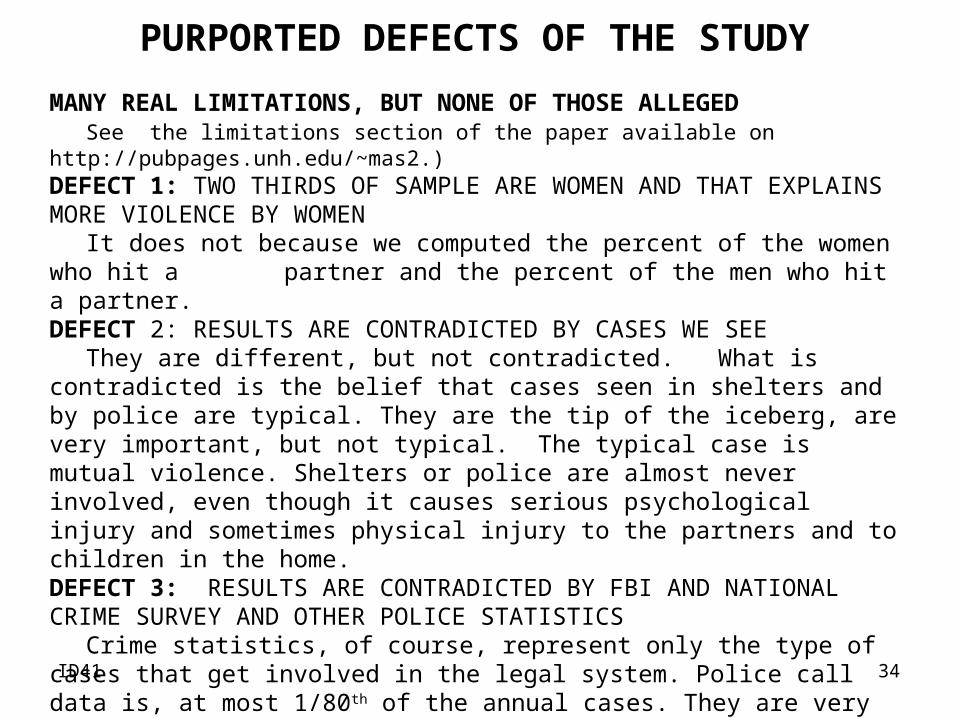
PURPORTED DEFECTS OF THE STUDY
MANY REAL LIMITATIONS, BUT NONE OF THOSE ALLEGEDSee the limitations section of the paper available on http://pubpages.unh.edu/~mas2.)
DEFECT 1: TWO THIRDS OF SAMPLE ARE WOMEN AND THAT EXPLAINS MORE VIOLENCE BY WOMEN
It does not because we computed the percent of the women who hit a partner and the percent of the men who hit a partner.
DEFECT 2: RESULTS ARE CONTRADICTED BY CASES WE SEEThey are different, but not contradicted. What is contradicted is the belief
that cases seen in shelters and by police are typical. They are the tip of the iceberg, are very important, but not typical. The typical case is mutual violence. Shelters or police are almost never involved, even though it causes serious psychological injury and sometimes physical injury to the partners and to children in the home.DEFECT 3: RESULTS ARE CONTRADICTED BY FBI AND NATIONAL CRIME SURVEY AND OTHER POLICE STATISTICS
Crime statistics, of course, represent only the type of cases that get involved in the legal system. Police call data is, at most 1/80th of the annual cases. They are very important and should have priority for services. But they are far far from typical and do not contradict the findings from over 200 studies showing about equal rates and a predominance of mutual violence. .
ID41 35
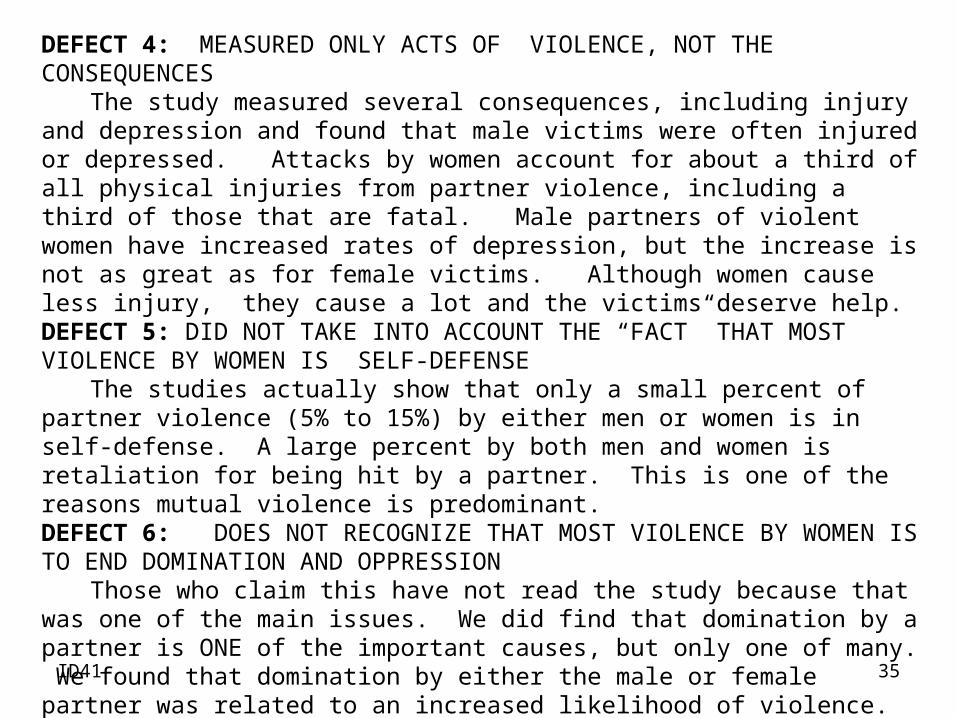
DEFECT 4: MEASURED ONLY ACTS OF VIOLENCE, NOT THE CONSEQUENCES
The study measured several consequences, including injury and depression and found that male victims were often injured or depressed. Attacks by women account for about a third of all physical injuries from partner violence, including a third of those that are fatal. Male partners of violent women have increased rates of depression, but the increase is not as great as for female victims. Although women cause less injury, they cause a lot and the victims deserve help. DEFECT 5: DID NOT TAKE INTO ACCOUNT THE “FACT” THAT MOST VIOLENCE BY WOMEN IS SELF-DEFENSE
The studies actually show that only a small percent of partner violence (5% to 15%) by either men or women is in self-defense. A large percent by both men and women is retaliation for being hit by a partner. This is one of the reasons mutual violence is predominant.DEFECT 6: DOES NOT RECOGNIZE THAT MOST VIOLENCE BY WOMEN IS TO END DOMINATION AND OPPRESSION
Those who claim this have not read the study because that was one of the main issues. We did find that domination by a partner is ONE of the important causes, but only one of many. We found that domination by either the male or female partner was related to an increased likelihood of violence. In addition, violence is not a moral or legal way to end domination by either a male or female partner.
ID41 36
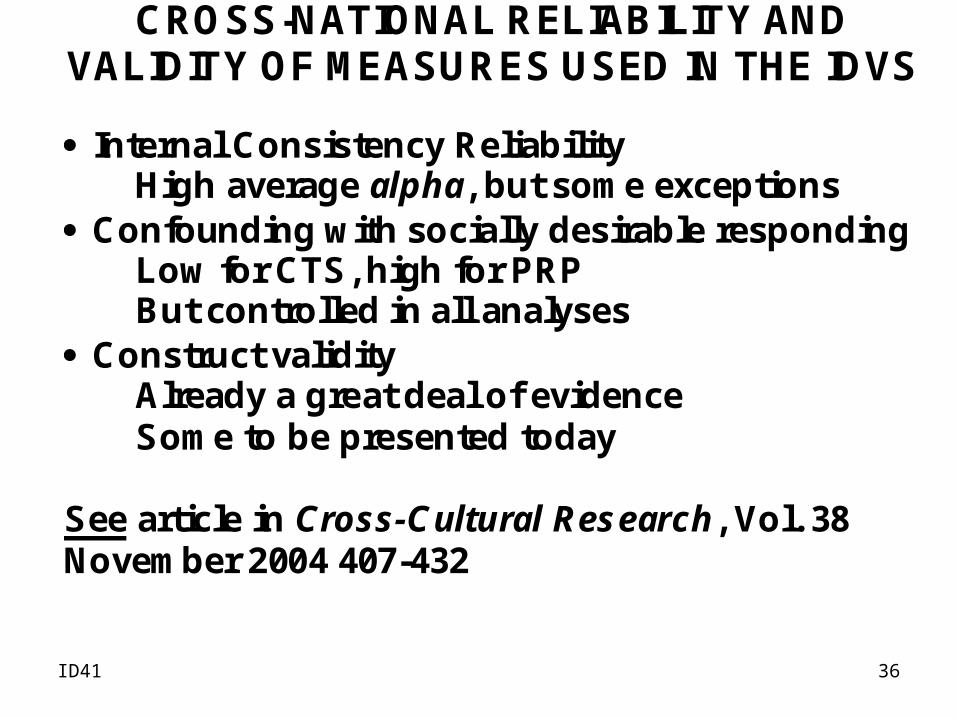
CROSS-NATIONAL RELIABILITY AND VALIDITY OF MEASURES USED IN THE IDVS
Internal Consistency Reliability High average alpha, but some exceptions
Confounding with socially desirable responding Low for CTS, high for PRP But controlled in all analyses
Construct validity Already a great deal of evidence Some to be presented today
See article in Cross-Cultural Research, Vol. 38 November 2004 407-432

ID41 37
Mutual Severe 12%
Female Severe 12%
Male Severe
8%
Gay/Lesbian Violence
6%
Male Minor 14%Felmale
Minor 12%
Mutual Minor 36%
TYPES AND RATES AND PARTNER VIOLENCE IN AMERICAN HOUSEHOLDS
Chart by Kenneth Corvo, based on a national sample of 2,143 household as reported in Straus, 1980, Amer. Behavioral Scientist, and other data.

ID41 38
CROSS-NATIONAL RELIABILITY AND VALIDITY OF MEASURES USED IN THE IDVS
Internal Consistency Reliability High average alpha, but some exceptions
Confounding with socially desirable responding Low for CTS, high for PRP But controlled in all analyses
Construct validity Already a great deal of evidence Some to be presented today
See article in Cross-Cultural Research, Vol. 38 November 2004 407-432

ID41 39
Assault Total Score, by Gender of Perpetrator, and Ratio 0f Female to Male Perpetration Rate
NATIONAL CONTEXT
ASSAULT TOTAL PERPETRATED BY: FEMALES MALES
RATIO OF FEMALE TO MALE RATE
Australia 20.2 19.5 1.0 Belgium 29.4 27.1 1.0 Brazil 21.7 22.0 .9 Canada 23.5 25.0 .9 Switzerland 23.6 28.5 .8 China 40.7 27.4 1.4 Germany 23.9 37.5 .6 Great Britian 37.6 25.8 1.4 Greece 24.3 68.4 .3 Hong Kong 41.8 26.2 1.5 India 28.8 46.8 .6 Israel 17.3 25.0 .6 South Korea 35.1 33.3 1.0 Lithuania 35.5 26.0 1.3 Mexico 46.6 34.2 1.3 Netherlands 29.5 35.2 .8 New Zealand 28.4 16.1 1.7 Portugal 17.5 16.5 1.0 Russia 37.2 27.4 1.3 Singapore 26.0 14.2 1.8 Sweden 16.2 19.5 .8 United States 28.7 33.0 .8
Mean 28.8 28.8 1.0 Median 28.5 26.7 1.1
BOTH MALE AND FEMALE STUDENTS HAVE HUGE RATES OF ASSAULT
EQUAL RATES FOR MEN AND WOMEN STUDENTS
LARGE NATION-TO- NATION DIFFERENCES
ID41 40
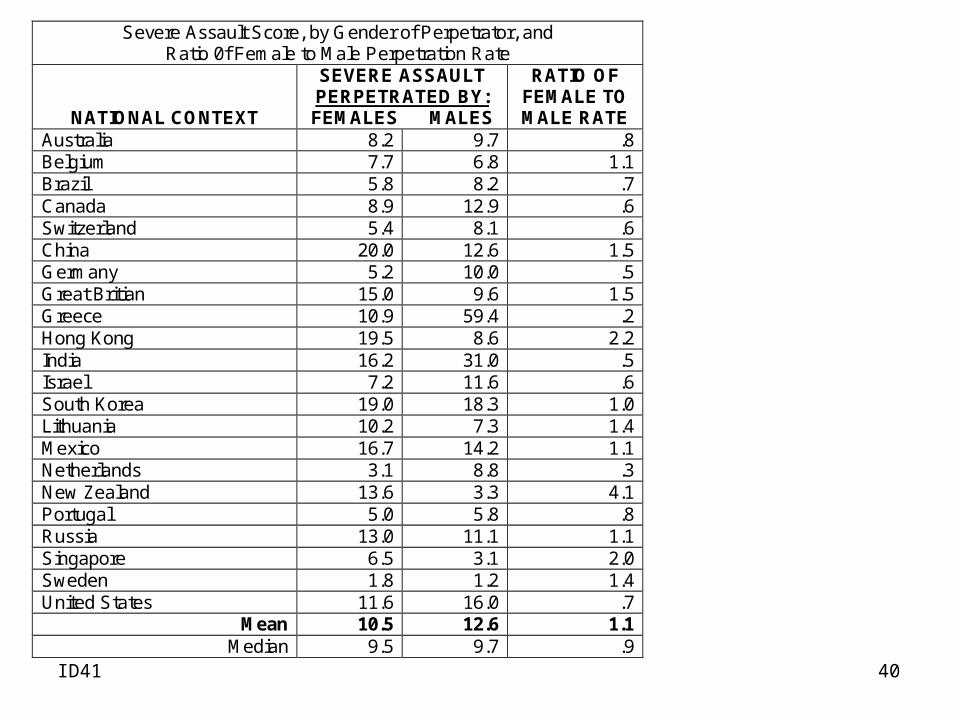
Severe Assault Score, by Gender of Perpetrator, and
Ratio 0f Female to Male Perpetration Rate
NATIONAL CONTEXT
SEVERE ASSAULT PERPETRATED BY: FEMALES MALES
RATIO OF FEMALE TO MALE RATE
Australia 8.2 9.7 .8 Belgium 7.7 6.8 1.1 Brazil 5.8 8.2 .7 Canada 8.9 12.9 .6 Switzerland 5.4 8.1 .6 China 20.0 12.6 1.5 Germany 5.2 10.0 .5 Great Britian 15.0 9.6 1.5 Greece 10.9 59.4 .2 Hong Kong 19.5 8.6 2.2 India 16.2 31.0 .5 Israel 7.2 11.6 .6 South Korea 19.0 18.3 1.0 Lithuania 10.2 7.3 1.4 Mexico 16.7 14.2 1.1 Netherlands 3.1 8.8 .3 New Zealand 13.6 3.3 4.1 Portugal 5.0 5.8 .8 Russia 13.0 11.1 1.1 Singapore 6.5 3.1 2.0 Sweden 1.8 1.2 1.4 United States 11.6 16.0 .7
Mean 10.5 12.6 1.1 Median 9.5 9.7 .9

ID41 41
Injury Total Score, by Gender of Perpetrator, and Ratio 0f Female to Male Perpetration Rate
NATIONAL CONTEXT
INJURY TOTAL INFLICTED BY:
FEMALES MALES
RATIO OF FEMALE TO MALE RATE
Australia 2.7 7.3 .3 Belgium 2.7 7.7 .3 Brazil 1.2 8.1 .1 Canada 3.0 15.5 .1 Switzerland 1.2 .0 -- China 3.9 10.8 .3 Germany 3.1 11.1 .2 Great Britian 5.6 9.6 .5 Greece 3.3 47.3 .0 Hong Kong 3.5 6.9 .5 India 8.8 28.5 .3 Israel 3.6 11.6 .3 South Korea 5.3 20.9 .2 Lithuania 3.1 10.5 .2 Mexico 9.8 11.7 .8 Netherlands .0 8.8 .0 New Zealand 4.2 16.1 .2 Portugal 1.6 5.0 .3 Russia 5.3 11.1 .4 Singapore .7 6.3 .1 Sweden 1.1 6.1 .2 United States 4.9 16.1 .3
Mean 3.6 12.6 .3 Median 3.2 10.6 .3
WOMEN STUDENTS INFLICTED ONLY A THIRD AS MUCH INJURY AS THE MEN IN THIS STUDY

ID41 42
Severe Injury Score by Gender of Perpetrator, and Ratio 0f Female to Male Perpetration Rate
NATIONAL CONTEXT
SEVERE INJURY INFLICTED BY:
FEMALES MALES
RATIO OF FEMALE TO MALE
RATE Australia .0 4.8 .0 Belgium .0 2.9 .0 Brazil .6 4.7 .1 Canada .3 9.4 .0 Switzerland .4 .0 ~ China .6 5.1 .1 Germany 1.0 4.2 .2 Great Britian .0 1.6 .0 Greece .0 48.6 .0 Hong Kong .0 4.0 .0 India 4.6 25.0 .1 Israel .8 6.6 .1 South Korea .9 11.6 .0 Lithuania .8 4.8 .1 Mexico 1.2 2.9 .4 Netherlands .0 .0 _ New Zealand .0 .0 _ Portugal .4 .8 .5 Russia .5 3.9 .1 Singapore .0 3.1 .0 Sweden .4 1.2 .3 United States 1.1 8.7 .1
Mean .6 7.0 .1 Median .4 4.1 .1
WOMEN STUDENTS INFLICT ONLY A TENTH AS MUCH SEVERE INJURY AS THE MEN IN THIS STUDY
THESE INJURY RATES SHOW THAT VIOLENCE BETWEEN DATING PARTNERS IS A SERIOUS CRIME WITH HARMFUL EFFECTS

ID41 43
WOMEN COMMIT 38% OF THE PHYSICAL ASSAULTSAGAINST PARTNERS
(PREVIOUS 12 MONTHS ESTIMATES FROM THENATIONAL VIOLENCE AGAINST WOMEN SURVEY,1995)
0
200,000
400,000
600,000
800,000
1,000,000
1,200,000
1,400,000
1,600,000
MALE PERPETRATOR FEMALE PERP
N=8,000RATE=0.9%
N=8,000 RATE =1.3%

ID41 44
Figure 1. Relationship Between Dominance Scale Score and Probability of Minor Assault on a Parter, by Gender
0
0.05
0.1
0.15
0.2
0.25
0.3
0 0.5 1 1.5 2 2.5 3 3.5
Dominance Scale Score
Pre
dict
ed P
roba
bilit
y
Males
Females
ID28
ID41 45
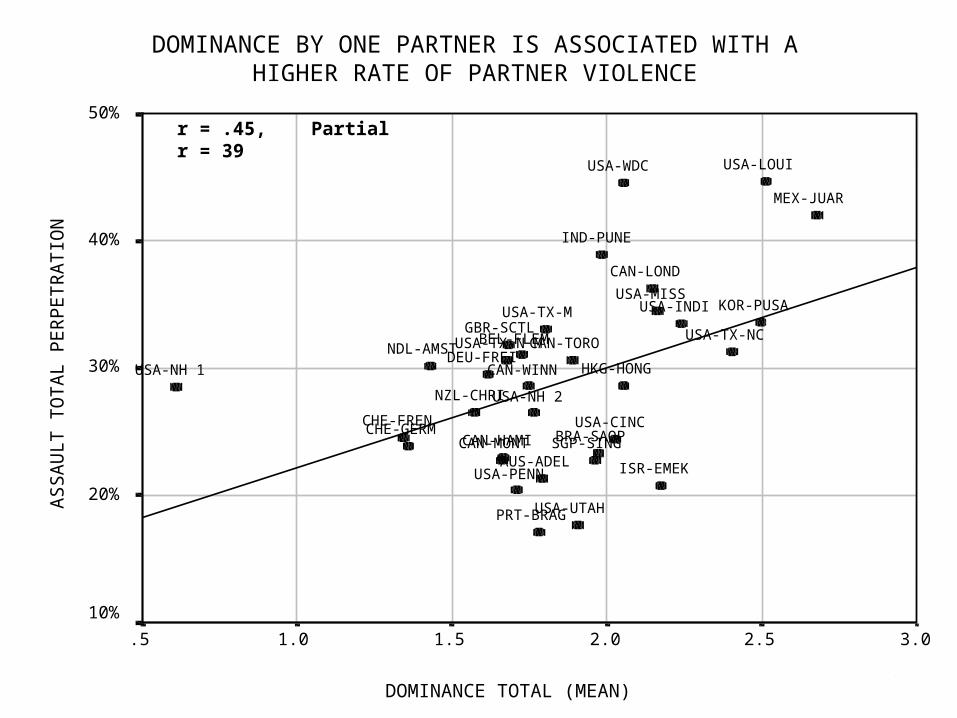
DOMINANCE BY ONE PARTNER IS ASSOCIATED WITH A HIGHER RATE OF PARTNER VIOLENCE
r = 0.44`Partial r = .39
DOMINANCE TOTAL (MEAN)
3.02.52.01.51.0.5
AS
SA
UL
T T
OT
AL
PE
RP
ET
RA
TIO
N
50%
40%
30%
20%
10%
ISR-EMEK
DEU-FREI
GBR-SCTLBEL-FLEM
PRT-BRAG
CHE-GERMCHE-FREN
NDL-AMST
NZL-CHRI
AUS-ADELSGP-SING
KOR-PUSA
HKG-HONG
IND-PUNE
USA-PENN
USA-WDC
USA-INDI
USA-TX-NC
USA-LOUI
USA-MISS
USA-NH 2
USA-CINC
USA-UTAH
USA-TX-N M
USA-TX-M
USA-NH 1
CAN-TORO
CAN-MONT
CAN-LOND
CAN-WINN
CAN-HAMI BRA-SAOP
MEX-JUAR
r = .45, Partial r = 39

ID41 46
CONCLUSIONS ABOUTPREVALENCE OF PARTNER VIOLENCE
THE HIGH RATES OF ASSAULT, INJURY, SEXUAL COERCION WORLD-WIDE ARE AN IMPORTANT THREAT TO PHYSICAL AND MENTAL HEALTH
RATES OF PHYSICAL ASSAULT BY WOMEN ARE SIMILAR TO THOSE BY MEN GENDER SYMMETRY IN PHYSICAL ASSAULT MAY BE
CHARACTERISTIC OF ALL SOCIETIES EXCEPT WHERE WOMEN ARE TOTALLY DOMINATED
RESULTS ARE CONSISTENT WITH MANY OTHER STUDIES OF STUDENT COUPLES

ID41 47
CONCLUSIONS ABOUT DOMINANCE
DOMINANCE BY WOMEN AS WELL AS BY MEN IS ASSOCIATED WITH A HIGHER PROBABILITY OF VIOLENCE
RESULTS ARE CONSISTENT WITH PREVIOUS STUDIES OF DOMINANCE IN THE US, KOREA, HONG KONG, AND MEXICO
RESULTS ARE CONSISTENT WITH REVIEW OF GENDER DIFFERENCES IN RISK FACTORS: THEY ARE MOSTLY THE SAME FOR WOMEN AND MEN (Medeiros & Straus, 2006)
ID41 48
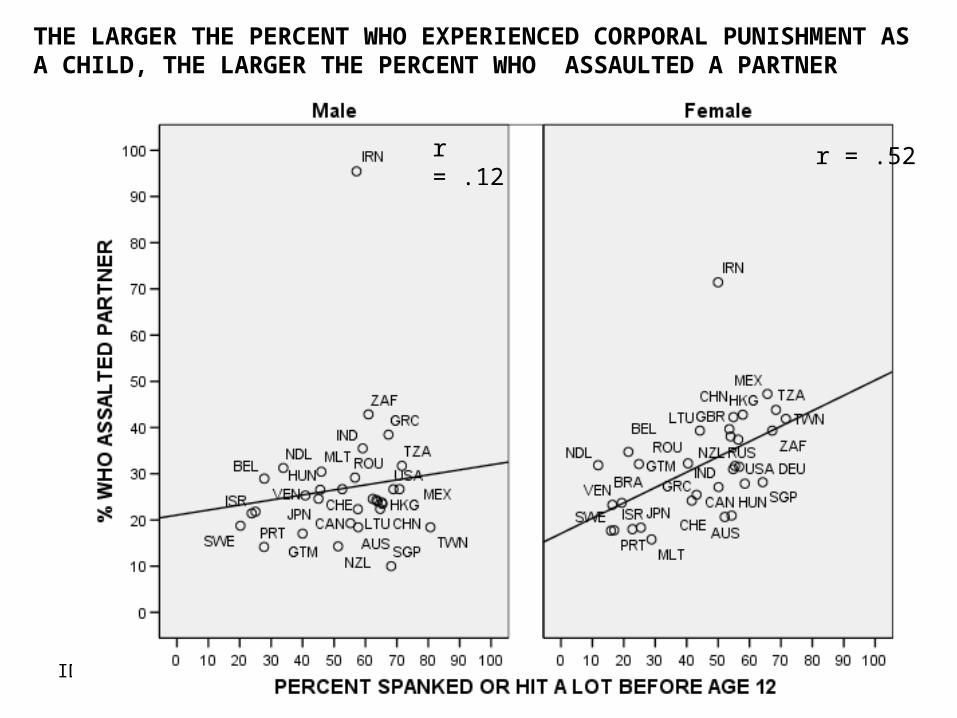
THE LARGER THE PERCENT WHO EXPERIENCED CORPORAL PUNISHMENT AS A CHILD, THE LARGER THE PERCENT WHO ASSAULTED A PARTNER
r = .12 r = .52
ID41 49
0
10
20
30
40
50
60
70
80
Male-Only
Female-Only
Both-Violent
Male-Only
Female-Only
Both-Violent
Male Respondents
Female Respondents
Any Assault Severe Assault
Figure 1. PERCENT OF VIOLENT COUPLES IN EACH MUTUALITY TYPE
%
ID41 50
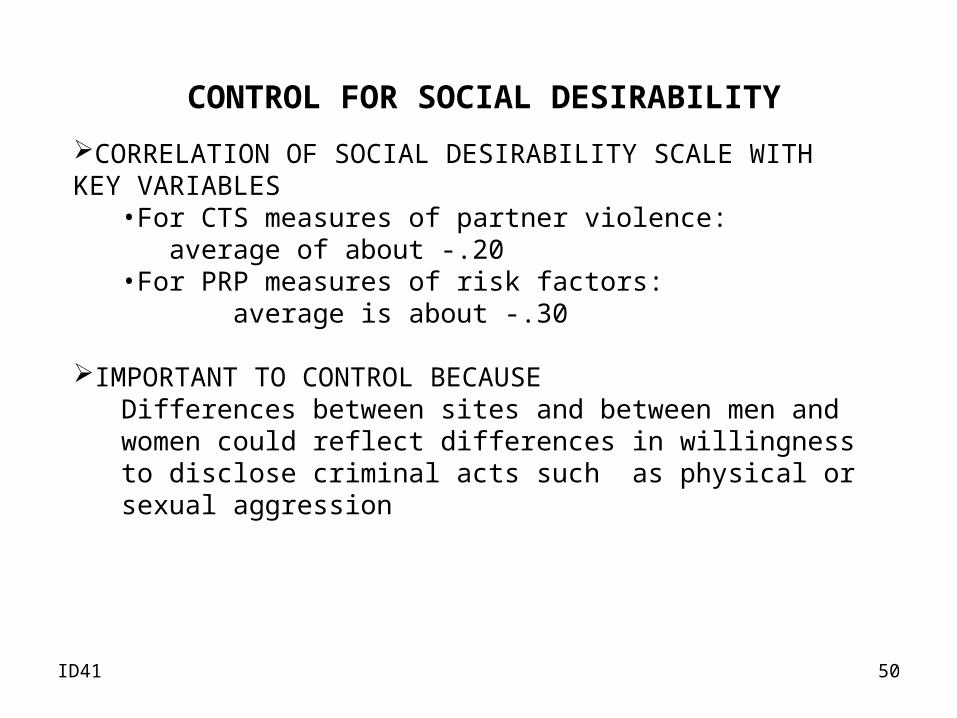
CORRELATION OF SOCIAL DESIRABILITY SCALE WITH KEY VARIABLES
•For CTS measures of partner violence: average of about -.20
•For PRP measures of risk factors: average is about -.30
IMPORTANT TO CONTROL BECAUSEDifferences between sites and between men and women could reflect differences in willingness to disclose criminal acts such as physical or sexual aggression
CONTROL FOR SOCIAL DESIRABILITY

ID41 51
THE INTERNATIONAL DATING VIOLENCE STUDY (IDVS)
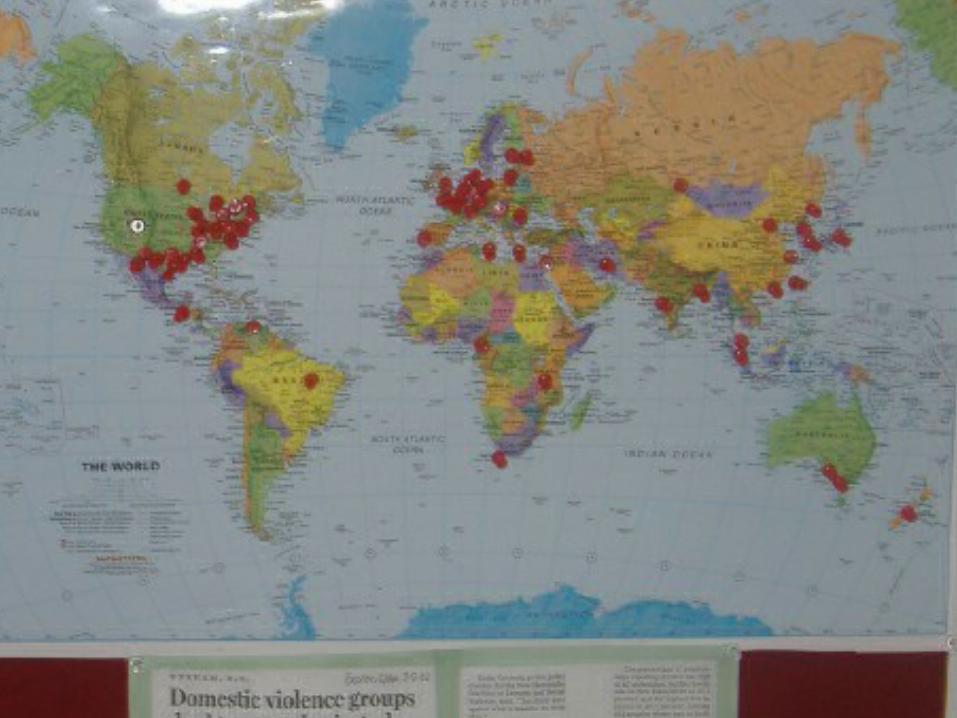
68 UNIVERSITIES IN 32 NATIONS – ALL MAJOR WORLD REGIONS
QUESTIONNAIRE (ONE CLASS PERIOD). FOUR PARTS1. Demographics2. Conflict Tactics Scales to measure Partner Violence3. Personal And Relationships Profile (23 risk factors for PV)4. Questions added by each consortium member. Examples:
` Importance of "saving face" Perceived deterrent effects of sanctionsReligious affiliation and beliefs
ALL ANALYSES CONTROL FOR OR EXAMINE INTERACTIONS WITH
* Gender* Age * Score on Social Desirability Response-set scale* Other variables needed for specific analyses

ID41 52
Table 1. Characteristics of Students by National Setting
National Setting N %
Female Age
M (SD)
Social Desirability Scale
M (SD)
All Nations 13,601 71.5 23.0 (6.22) 2.62 (.36) Africa: South Africa (ZAF) 85 94.1 23.2 (4.68) 2.66 (.33) Tanzania (TZA) 130 45.4 26.3 (4.72) 2.64 (.30) Asia: China (CHN) 763 62.3 21.5 (2.67) 2.58 (.26)
China-Hong Kong (HKG) 521 69.7 24.4 (5.16) 2.55 (.29) India (IND) 84 72.6 22.3 (2.38) 2.55 (.33) Japan (JPN) 120 49.2 20.3 (1.09) 2.38 (.39) Singapore (SGP) 199 71.4 24.5 (3.43) 2.53 (.31) South Korea (KOR) 183 61.2 24.7 (3.87) 2.47 (.29) Taiwan (TWN) 152 76.3 20.1 (1.86) 2.50 (.25)
Europe: Belgium (BEL) 686 78.4 27.5 (11.01) 2.64 (.36) Germany (DEU) 483 69.2 24.1 (4.87) 2.50 (.30) Greece (GRC) 213 77.0 21.2 (2.20) 2.72 (.36) Hungary (HUN) 152 68.4 22.3 (2.51) 2.61 (.35) Lithuania (LTU) 347 68.0 20.5 (2.50) 2.52 (.29) Malta (MLT) 97 76.3 22.4 (5.86) 2.60 (.37) Portugal (PRT) 352 68.2 21.7 (3.37) 2.74 (.33) Netherlands (NDL) 380 87.4 23.4 (6.79) 2.67 (.38) Romania (ROU) 236 89.8 21.0 (2.23) 2.77 (.38) Russian Federation (RUS) 398 59.5 20.0 (2.79) 2.51 (.35) Sweden (SWE) 671 76.2 28.5 (7.41) 2.64 (.36) Switzerland (CHE) 310 76.8 34.2 (10.48) 2.62 (.35) United Kingdom 407 86.0 20.9 (4.63) 2.57 (.37)
Latin America: Brazil (BRA) 236 67.4 21.0 (3.63) 2.66 (.39) Guatemala (GTM) 168 48.2 19.6 (2.55) 2.60 (.38) Mexico (MEX) 190 85.3 20.4 (3.56) 2.85 (.39) Venezuela (VEN) 209 62.7 23.9 (4.96) 2.91 (.41)
Middle East: Iran (IRN) 91 75.8 * 2.50 (.34) Israel (ISR) 287 81.5 31.1 (8.64) 2.64 (.39)
North America: Canada 1090 72.6 21.7 (4.26) 2.62 (.36) United States 4020 69.3 21.6 (4.89) 2.64 (.37)
Oceania: Australia (AUS) 214 83.2 23.5 (7.11) 2.62 (.35) New Zealand (NZD) 127 78.7 21.7 (5.82) 2.49 (.32)
ID41 53
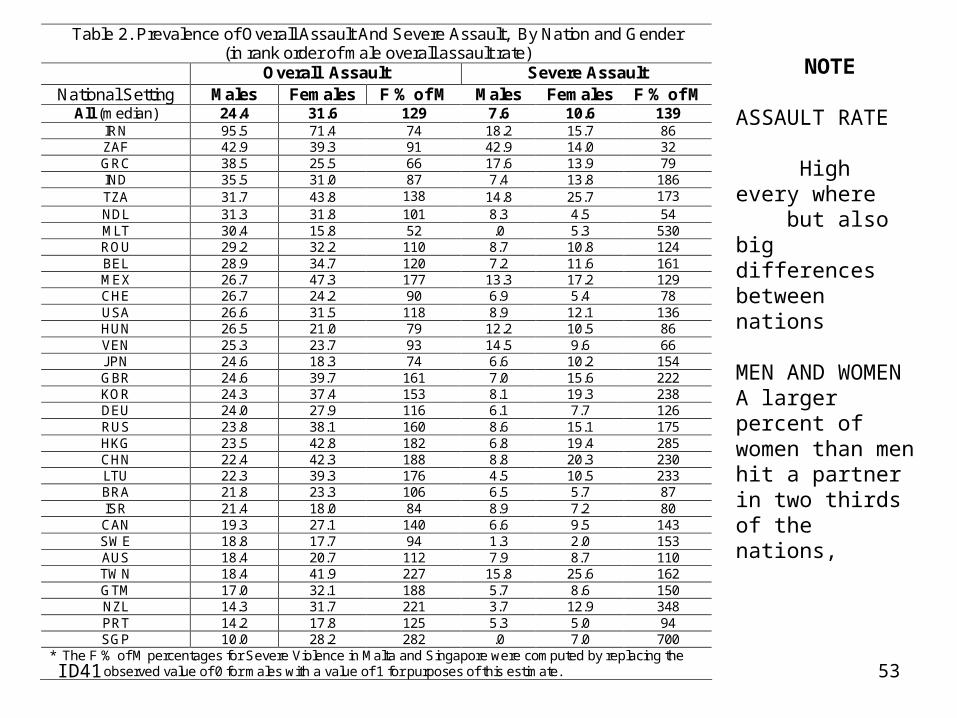
Table 2. Prevalence of Overall Assault And Severe Assault, By Nation and Gender (in rank order of male overall assault rate)
Overall Assault Severe Assault National Setting Males Females F % of M Males Females F % of M
All (median) 24.4 31.6 129 7.6 10.6 139 IRN 95.5 71.4 74 18.2 15.7 86 ZAF 42.9 39.3 91 42.9 14.0 32 GRC 38.5 25.5 66 17.6 13.9 79 IND 35.5 31.0 87 7.4 13.8 186 TZA 31.7 43.8 138 14.8 25.7 173 NDL 31.3 31.8 101 8.3 4.5 54 MLT 30.4 15.8 52 .0 5.3 530 ROU 29.2 32.2 110 8.7 10.8 124 BEL 28.9 34.7 120 7.2 11.6 161 MEX 26.7 47.3 177 13.3 17.2 129 CHE 26.7 24.2 90 6.9 5.4 78 USA 26.6 31.5 118 8.9 12.1 136 HUN 26.5 21.0 79 12.2 10.5 86 VEN 25.3 23.7 93 14.5 9.6 66 JPN 24.6 18.3 74 6.6 10.2 154 GBR 24.6 39.7 161 7.0 15.6 222 KOR 24.3 37.4 153 8.1 19.3 238 DEU 24.0 27.9 116 6.1 7.7 126 RUS 23.8 38.1 160 8.6 15.1 175 HKG 23.5 42.8 182 6.8 19.4 285 CHN 22.4 42.3 188 8.8 20.3 230 LTU 22.3 39.3 176 4.5 10.5 233 BRA 21.8 23.3 106 6.5 5.7 87 ISR 21.4 18.0 84 8.9 7.2 80 CAN 19.3 27.1 140 6.6 9.5 143 SWE 18.8 17.7 94 1.3 2.0 153 AUS 18.4 20.7 112 7.9 8.7 110 TWN 18.4 41.9 227 15.8 25.6 162 GTM 17.0 32.1 188 5.7 8.6 150 NZL 14.3 31.7 221 3.7 12.9 348 PRT 14.2 17.8 125 5.3 5.0 94 SGP 10.0 28.2 282 .0 7.0 700
* The F % of M percentages for Severe Violence in Malta and Singapore were computed by replacing the observed value of 0 for males with a value of 1 for purposes of this estimate.
NOTE
ASSAULT RATE High every where but also big differences between nations
MEN AND WOMENA larger percent of women than men hit a partner in two thirds of the nations,