ict value for money indicators guidance - audit · pdf fileict value for money indicators...
TRANSCRIPT

1
ICT Indicators
ICT value for money indicators guidance 1) Introduction This document sets out the indicators for the ICT Function. The guidance below starts by defining the scope of the function and goes onto identify key themes which cover the requirements of a modern, value for money ICT function. The scope and key themes are included as background information as well as the primary and secondary indicators. 2) Scope The term ICT has become widely accepted in the public sector, covering the convergence of computer and telecommunications technologies. A simple definition of the term „ICT‟ is a natural starting point. ‘Information and communications technology services refer to the total process for acquiring,
storing, manipulating or disseminating data and information.’ This process is usually automated, but also covers those procedures that are carried out manually. The terms information technology (IT) and information systems (IS) are also still in common parlance. IT refers to the technical components used to provide an information system. IS refers to the non-tangible parts of the system, ie software and data held on the
equipment. The scope of the ICT function covers all aspects of infrastructure, systems, processes and disciplines required to support: • the effective delivery of business objectives; • users of technology in the development of their skills and competencies through training and learning; • managing information as a corporate asset; • supporting business change through the innovative use of technology and; • promoting and supporting the adoption of good practice across a number of important areas including project and programme management and electronic service delivery. 3) Key themes In order to help derive our VFM indicators for the ICT function, we have identified some key themes that reflect a modern, value for money ICT function. • ICT Strategy • Business Engagement • Governance • ICT Architecture and Asset Management • Configuration, Development and Integration • Information Management • Information Security • Performance Management • Strategic Sourcing and Supplier Management • Portfolio, Programme and Project Management • Skills Management • Service Delivery

2
• Service Support These themes have been taken from the National e-Service Delivery Standards (NeSDS) programme (e-Service Delivery Standards, Consultation Draft 0.4.2 – November 2005), a programme which is developing “e” standards for a range of Local Government service areas including ICT. These themes provide a balanced view between the strategic and operational requirements of ICT for the delivery of services and are applicable across all areas of the public sector. Organisations will deliver services differently, e.g. managed services, shared services, outsourced, part outsourced, or all services provided in-house. These should not impact directly on the overall organisational performance of the business.

3
4) Summary list of indicators
Indicator
Primary Indicator 1
Cost of the ICT function (i.e. spend on the ICT department or equivalent including employee costs and associated overheads) as a percentage of organisational running costs (expenditure)
Primary Indicator 2
ICT competence of user The competencies are defined as follows: a) use e-mail, attach documents to email b) use search tools e.g. Google to find information from the intranet or internet c) use word processing software e.g. Word to compose letters and reports d) use software such as Powerpoint to produce presentations e) use software such as Excel to produce spreadsheets f) resolve basic problems yourself using help menus g) manage files and backing up your own work
Primary Indicator 3
(a) Percentage of incidents resolved within agreed
service levels (b) Number of incidents per user
Primary Indicator 4
Project delivery index. The top 10 projects by, for example, cost, risk, impact or importance.
Primary Indicator 5
Percentage of the top five transactional based activities which are made via e-enabled channels.
Primary Indicator 6
Commissioner and user satisfaction index - a composite indicator compiled from the responses to a set of statements by commissioners and users. Commissioner statements:
The ICT function effectively supports delivery of the organisation‟s strategic objectives.
The ICT function is proactive and innovative in providing technological solutions to meet business needs.

4
The ICT function manages the implementation, maintenance and enhancements of major business systems in a consistent, effective and timely manner.
The ICT function provides value for money.
The ICT function has the capacity and capability to support major business transformation.
User statements:
The ICT function responds to my problem quickly.
ICT systems are reliable.
The support provided by ICT meets my needs effectively.
The ICT function effectively supports the delivery of the organisation‟s strategic objectives
ICT systems provide me with the information I need when and where I need it.
Primary Indicator 7
Management practice indicator – the number of practices that have been adopted by the organisation out of a possible total of 10. ICT service 1) Formal Service Level Agreements are in place with key internal customers governing business requirements, with regular service review meetings held at agreed intervals. 2) There are formal procedures in place supporting the operation of the ICT function, based upon good practice guidance such as COBIT (Control Objectives for Information and Related Technology), ITIL (IT Infrastructure Library) ISO/IEC:2000 and/or other sector specific guidance / methods. 3). Information quality assurance and security management are managed and implemented in accordance with ISO27001(or its equivalent). 4) User satisfaction surveys are conducted at least every two years with results openly published, supported with improvement plans where necessary. 5) A short survey is undertaken upon resolution of a sample of reported incidents and the data is collated and analysed at least monthly and used to drive service improvements.

5
6) A comprehensive professional development programme is in place for ICT staff which ensures that they receive at least 5 days of continuing professional development (relevant accredited training) per annum, covering technical, management and business focused training. Governance 7) The most senior officer in the organisation with a dedicated ICT role has a direct report to the Executive / Corporate Management Team of the organisation 8) The organisations strategic management links governance, leadership and long term planning into the corporate strategy 9) The organisation has assessed the ICT competence of end users within the last 12 months and put in place an appropriate training and development programme to address areas of weakness and delivery of this programme is monitored on a quarterly basis. 10) Business continuity management processes (BS25777 are in place to recover business and ICT services in the timescales as specified by the business. These processes are tested at least annually and are reviewed on a regular basis to confirm appropriateness.
Secondary Indicator 1
Cost of providing support: a) Per user b) Per workstation
Secondary Indicator 2
Users per workstation
Secondary Indicator 3
Unavailability of ICT services to users.
Secondary Indicator 4
Percentage of users who are able to access the network and systems remotely
Secondary Indicator 5
Acquisition costs per:
a) Desktop b) Laptop

6
5) Detailed definitions for Primary indicators
Organisational focus
The following indicators relate to the organisation and not merely the ICT function.
Organisations will receive and utilise ICT services in different ways (i.e. via managed
services, shared services or internal departmental services), the organisation should
ensure that all ICT services it uses or receives are included in the responses. (For
example for primary indicator 1 on the cost of the ICT function include the in-house
ICT costs, and external SLA costs (if there are any). Include any small
departmental/specialist ICT costs if they exist.)
Reference number
Primary indicator 1
Description
Cost of the ICT function (i.e. spend on the ICT department or equivalent including employee costs and associated overheads) as a percentage of organisational running costs (expenditure)
Rationale and expected impact on behaviour
A headline indicator which looks at the cost-effectiveness of the ICT function. In interpreting their achievement against this indicator, organisations should also take into account their performance against measures of effectiveness such as primary indicators 3 (prompt resolution of incidents reported), 4 (the project governance and delivery index), 5 (percentage of take-up of e-delivery channels), 6 (Commissioner and user satisfaction index) and 7 (management practice indicator).
Definition
The indicator should be based on figures for the latest financial year. Cost of the ICT function should include:
employee costs of staff who work in the function (including employers NI, pension and recruitment costs)
all relevant accommodation costs e.g. data centres)
supplies / consumables
outsourcing costs (all related expenditure costs for outsourcing should be included)
investment in the ICT infrastructure and systems across the organisation as a whole
7
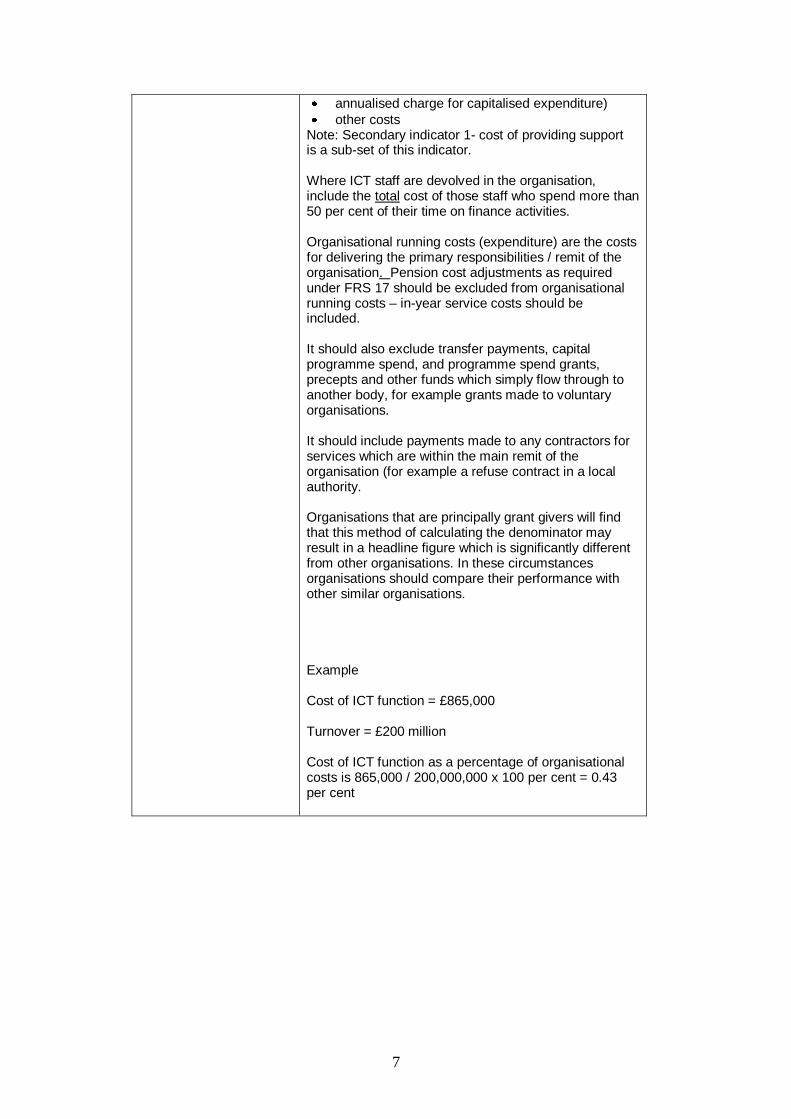
annualised charge for capitalised expenditure)
other costs Note: Secondary indicator 1- cost of providing support is a sub-set of this indicator. Where ICT staff are devolved in the organisation, include the total cost of those staff who spend more than 50 per cent of their time on finance activities. Organisational running costs (expenditure) are the costs for delivering the primary responsibilities / remit of the organisation. Pension cost adjustments as required under FRS 17 should be excluded from organisational running costs – in-year service costs should be included. It should also exclude transfer payments, capital programme spend, and programme spend grants, precepts and other funds which simply flow through to another body, for example grants made to voluntary organisations. It should include payments made to any contractors for services which are within the main remit of the organisation (for example a refuse contract in a local authority. Organisations that are principally grant givers will find that this method of calculating the denominator may result in a headline figure which is significantly different from other organisations. In these circumstances organisations should compare their performance with other similar organisations. Example Cost of ICT function = £865,000 Turnover = £200 million Cost of ICT function as a percentage of organisational costs is 865,000 / 200,000,000 x 100 per cent = 0.43 per cent

8
Reference number
Primary indicator 2
Description
ICT competence of user
Rationale and expected impact on behaviour
This indicator examines the ICT competency of users based upon a self-assessment against a framework of specific tasks. This enables organisations to assess their effectiveness in addressing the ICT training needs of users. A competent, well trained workforce is essential in supporting e-enabled organisations. Organisations should aim to achieve a period-on-period increase in user competence.
Definition A user is defined as an individual who is required to use ICT as part of their job role. For the purposes of this indicator this should be based on employees with a network account. The indicator focuses on seven key competencies as defined below. Users are asked to self-assess their level of achievement on a three point scale against each of the competencies,
1. My job does not require me to be able to to do this. 2. if I had more skills, I could do my job more effectively 3. I have sufficient skills to do my job
For ease it is suggested that organisations would run this survey in conjunction with a user/commissioner satisfaction survey for primary indicator 6. A basic survey is attached at Appendix 2. The competencies are defined as follows: a) use e-mail, attach documents to email b) use search tools e.g. Google to find information from the intranet or internet c) use word processing software e.g. Word to compose letters and reports d) use software such as Powerpoint to produce presentations e) use software such as Excel to produce spreadsheets f) resolve basic problems yourself using help menus g) manage files and backing up your own work

9
Reference number
Primary indicator 3
Description
(c) Percentage of incidents resolved within agreed
service levels (d) Number of incidents per user
Rationale and expected impact on behaviour
This indicator assesses the performance of the ICT function in restoring the service within an agreed timescale after an operational incident has been reported by a user. Resolution within locally agreed service levels has been used rather than resolution within defined timeframes, in recognition that the service levels are likely to be specific across sectors and within organisations (for example some organisations will need 24 hour, 7 day cover and others will not). Organisations would expect to achieve a period-on-period increase in the percentage of incidents resolved within agreed service levels.
Definition
For the latest financial year, the number of incidents resolved within agreed service levels divided by the total number of reported incidents. An incident is defined as any event which is not part of the standard operation of a service and which causes, or may cause, an interruption to, or a reduction in, the quality of that service. An incident should not include orders of equipment, requests for change, password changes and general queries that do not require any resolution activity. The agreed timescale should start when an incident is logged by the user (for example by phone, e-mail, in person etc). Incidents should be deemed resolved when the user is able to carry on with normal work even if through a temporary measure such as loan of equipment. The indicator measure restoration of the service rather than the technical fix for the problem. Example: (a) Percentage of incidents resolved within agreed service levels Total incidents = 6495 Number resolved within defined service level = 5678 Percentage of incidents resolves within defined service level is 5678 / 6495 x 100 per cent = 87.42 per cent

10
(b) Number of incidents per user Total incidents = 6,495 Number of users = 840 Number per user is 6495 / 840 = 7.7

11
Reference number
Primary indicator 4
Description
Project delivery index. The top 10 projects by, for example, cost, risk, impact or importance.
Rationale and expected impact on behaviour
This indicator assesses the effectiveness of the organisation‟s project management of ICT by assessing the top 10 against a set of defined criteria. Organisations should aim to secure a period-on-period increase in the average score achieved against the index.
Definition
The top 10 projects that have been completed within the latest financial year should be subject to assessment against the criteria set out below. Projects completed in the latest financial year but which commenced in a previous financial year should also be included. Any projects which commenced in the latest financial year but are not scheduled to complete in that year should not be included. The aim of this indicator is to establish the success of the organisation in managing ICT projects. It can therefore apply to projects regardless of who initiates/sponsors it, providing that the project is being managed internally by the organisation. All „yes‟ responses should be awarded a score of 1. All „no‟ responses should be awarded a zero score. This will allow the calculation of an overall score for each project. The indicator should then be based on an average score for all projects. The project index measures are as follows: To be completed by the ICT function: • Was the project managed using a formal project management methodology, such as PRINCE 2? • Was a business case produced and signed off by the project sponsor? • Did the business case include the definition of expected tangible and measurable benefits (both cashable and non cashable) to be realised by the project, complete with timescales for realisation? • Was a mechanism put in place for the measurement and exploitation of cashable and non cashable benefits? • Was a post-implementation review completed to

12
identify lessons learnt for use on future projects? To be completed by the project sponsor: • Was the project delivered within agreed timescales? • Was the project completed within budget? • Was the project completed to specification? • Have the anticipated business benefits been achieved?

13
Reference number
Primary indicator 5
Description
Percentage of the top five transactional based activities which are made via e-enabled channels.
Rationale and expected impact on behaviour
This indicator assesses the take-up by users of e-enabled channels to access public sector services. Organisations should aim to achieve a period-on-period increase in the average percentage of transactions conducted via e-enabled channels.
Definition
The indicator should be based on the latest financial year. Identify the organisation‟s top five transactional based activities based on total volume of interactions, which are/can be delivered via e-enabled as well as other channels. For each activity identify the percentage of interactions which are made via e-enabled channels. Then calculate the average across all five transactional activities. E-enabled channels can include the Internet, Digital TV and automated telephone services. There are a wide variety of transactions that take place in the public sector that could be delivered through e-enabled channels. The type of activities for this indicator might include: • Ordering of goods and services • Payments for goods and services • On-line recruitment • Community correspondence including complaints • Applications for grants, licences, benefits etc • Tax assessments / returns / claims • Appointment bookings • Applications for specific services • Payment of fines / charges • Facilities for online requests of demonstrations of Fire equipment and other safety procedures. Some organisations will have a less „customer-facing‟ operation than others but it should still be possible to identify transactional activities that are e-enabled. These do not necessarily have to be exclusively externally facing processes but could be transactional processes used internally within the organisation such as employee support systems such as: • Training course scheduling • Meeting room booking • Sickness absence recording • Appraisal

14
• Expenses submissions • Annual leave requests • Time recording Example Activity 1: Appointment bookings Number of bookings made on-line = 5,500 Total number of bookings (by phone, in person, on-line, in writing) = 26,500 Percentage via e-enabled channels: 5500/26500 x 100 = 20.75 per cent Activity 2 = 12.45 per cent Activity 3 = 87.6 per cent Activity 4 = 100 per cent Activity 5 = 29.34 per cent Average for all 5 activities: (20.75 + 12.45 + 87.6 + 100 + 29.34) / 5 = 50.03 per cent

15
Reference number
Primary indicator 6
Description
Commissioner and user satisfaction index - a composite indicator compiled from the responses to a set of statements by commissioners and users.
Rationale and expected impact on behaviour
This indicator examines the effectiveness of the ICT function by assessing the perceptions of its commissioners and users. The indicators have been identified because they are considered to indicate whether the function communicates effectively with its commissioners and users, and is responsive to the requirements of the organisation. Over time, organisations should aim to increase the proportion of commissioners and users agreeing with the statements. (Organisations may wish to incorporate these statements into existing surveys of users and commissioners.)
Definition
Commissioners are defined as senior mangers with responsibility for making decisions about ICT services or systems including the purchase of equipment. Users are internal staff that use the service for example, frontline managers and staff. The commissioner and user statements are as follows: (a) Commissioner statements:
The ICT function effectively supports delivery of the organisation‟s strategic objectives.
The ICT function is proactive and innovative in providing technological solutions to meet business needs.
The ICT function manages the implementation, maintenance and enhancements of major business systems in a consistent, effective and timely manner.
The ICT function provides value for money.
The ICT function has the capacity and capability to support major business transformation.
(b) User statements:
The ICT function responds to my problem quickly.

16
ICT systems are reliable.
The support provided by ICT meets my needs effectively.
The ICT function effectively supports the delivery of the organisation‟s strategic objectives
ICT systems provide me with the information I need when and where I need it.

17
Reference number
Primary indicator 7
Description
Management practice indicator – the number of practices that have been adopted by the organisation out of a possible total of 10.
Rationale and expected impact on behaviour
The aim of this indicator is to assess the extent to which the ICT function achieves a set of key management practices which will provide an indication of whether it is a well-run, modernised and mature function. It is not anticipated that most organisations will have adopted all of the practices listed when first measuring themselves against this indicator set. However organisations should expect that the number of practices that they have adopted would increase over time. (The list of practices will be updated, if appropriate, in future revisions of the indicator set).
Definition
The management practices indicator consists of 10 statements of management practice. The respondent should assess whether their organisation follows each practice as set out below: ICT service 1) Formal Service Level Agreements are in place with key internal customers governing business requirements, with regular service review meetings held at agreed intervals. 2) There are formal procedures in place supporting the operation of the ICT function, based upon good practice guidance such as COBIT (Control Objectives for Information and Related Technology), ITIL (IT Infrastructure Library) ISO/IEC:2000 and/or other sector specific guidance / methods. 3). Information assurance and security management are managed and implemented in accordance with ISO27001(or its equivalent). 4) User satisfaction surveys are conducted at least every two years with results openly published, supported with improvement plans where necessary. 5) A short survey is undertaken upon resolution of a sample of reported incidents and the data is collated and analysed at least monthly and used to drive service improvements. 6) A comprehensive professional development

18
programme is in place for ICT staff which ensures that they receive at least 5 days of continuing professional development (relevant accredited training) per annum, covering technical, management and business focused training. Governance 7) The most senior officer in the organisation with a dedicated ICT role has a direct report to the Executive / Corporate Management Team of the organisation 8) The organisations strategic management links governance, leadership and long term planning into the corporate strategy 9) The organisation has assessed the ICT competence of end users within the last 12 months and put in place an appropriate training and development programme to address areas of weakness and delivery of this programme is monitored on a quarterly basis. 10) Business continuity management processes (BS25777 are in place to recover business and ICT services in the timescales as specified by the business. These processes are tested at least annually and are reviewed on a regular basis to confirm appropriateness. For each practice tick „yes‟ if the organisation has fully implemented that practice. For each practice tick „no‟ if the organisation: • Does not have that practice in place; • Has the intention to develop this practice but it is currently not in place; or • Is currently implementing this practice but it is not yet fully in place. The organisation should then count the number of questions where they answered „yes‟ in order to calculate their score. The maximum score is therefore 10. The list below provides some further definitional details for specific practices: Management practice 2: COBIT is developed by the Information Systems Audit and Control Association (ISACA) and is widely being recognised as good practice across both the public and private sector. COBIT provides a business focused set of standards for guiding management on the governance of ICT. ITIL is developed by the Office of Government Commerce (OGC) and provides good practice processes for IT Service Management.

19
6) Detailed definitions for secondary indicators
Reference number
Secondary indicator 1
Description
Cost of providing support: a) Per user b) Per workstation
Rationale and expected impact on behaviour
This indicator measures the cost-effectiveness of the provision of support. Organisations would usually aim to achieve a period-on-period reduction in the unit cost of ICT support. However organisations should interpret the results of this indicator alongside primary indicator 3 (percentage of incidents resolved within agreed service levels), primary indicator 6 (user satisfaction index) (Note: A common measure adopted by organisations in this area is the ratio of user support staff to users. However where services are outsourced this indicator is not always easy to collect or useful).
Definition
The indicator should be based on figures for the latest financial year: a) Overall cost of support divided by the average number of users throughout the year. We have based this definition on performance indicators developed by the Society of Information Technology Management (SOCITM). Support would include staffing costs for the relevant ICT support staff and their line management and contract costs (where elements of support are provided by a third party), plus the costs of any dedicated support tools that they use. Support is defined by SOCITM as including: • Application Maintenance (general office products only) • Application Software ( general office products only – support costs but not costs of the products themselves) • Systems administration • Service desk • Security control • Technology provision • Equipment maintenance • System software support • Asset management • Problem Management • Virus Protection A user is defined as an individual who is required to use ICT as part of their job role. For the purposes of this

20
indicator this should be based on employees with a network account. b) Overall cost of support divided by the average number of workstations present throughout the year. The definition of a workstation is any device that accesses data - PCs, laptops, thin-client terminals and mainframe terminals. Devices such as PDAs, electronic organisers and palmtops are excluded and printers should be excluded. Example Cost of support = £456,000 Number of users = 1565 Number of workstations = 876 a) Cost per user = 456,000/1565 = £291.37 b) Cost per workstation = 456,000/876 = £520.55

21
Reference number
Secondary indicator 2
Description
Users per workstation
Rationale and expected impact on behaviour
This indicator assesses access to ICT equipment by end users. Organisations should assess whether their achievement against this indicator is consistent with the tasks that their employees are required to do and should compare their result for this indicator with that achieved by their peers.
Definition
To arrive at this figure, divide the average number of users for the latest financial year by the average number of workstations during the year. The definition of a workstation is any device that accesses data - PCs, laptops, thin-client terminals and mainframe terminals. Devices such as PDAs, electronic organisers and palmtops are excluded and printers should be excluded. A user is defined as an individual who is required to use ICT as part of their job role. For the purposes of this indicator this should be based on employees with a network account. Example Number of users = 1565 Number of workstations = 876 Number of users per workstations is 1565/876 = 1.79
22
Reference number
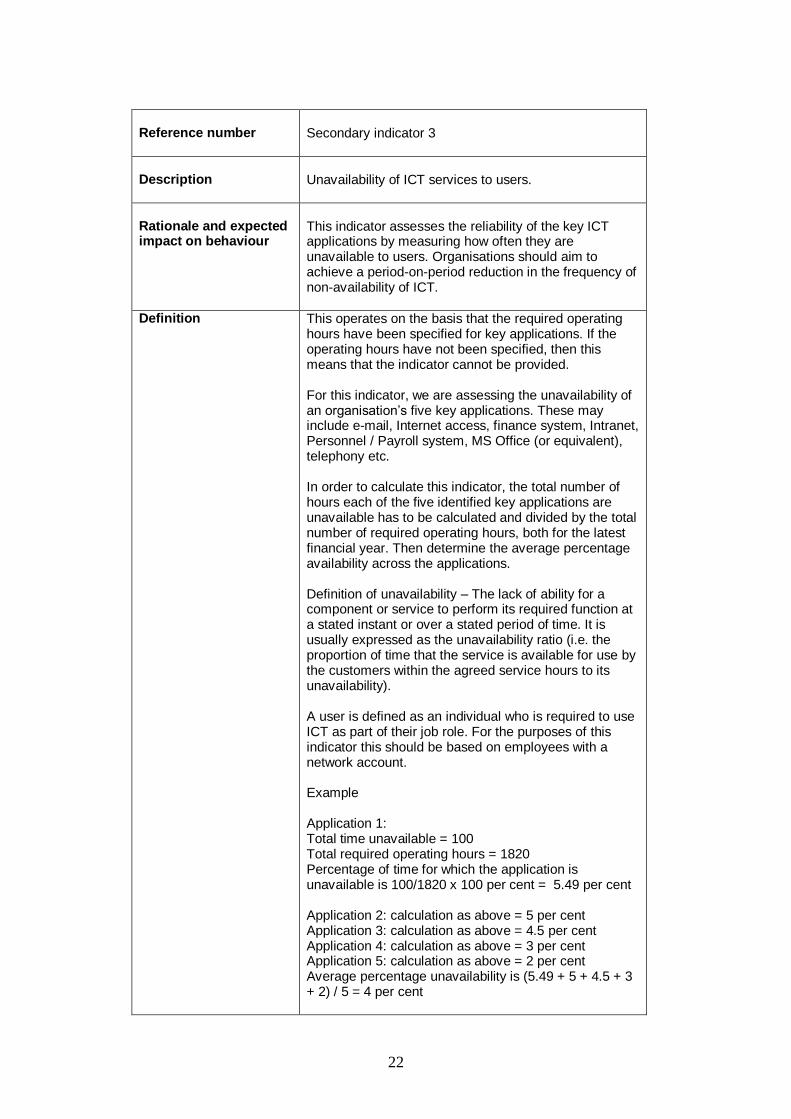
Secondary indicator 3
Description
Unavailability of ICT services to users.
Rationale and expected impact on behaviour
This indicator assesses the reliability of the key ICT applications by measuring how often they are unavailable to users. Organisations should aim to achieve a period-on-period reduction in the frequency of non-availability of ICT.
Definition This operates on the basis that the required operating hours have been specified for key applications. If the operating hours have not been specified, then this means that the indicator cannot be provided. For this indicator, we are assessing the unavailability of an organisation‟s five key applications. These may include e-mail, Internet access, finance system, Intranet, Personnel / Payroll system, MS Office (or equivalent), telephony etc. In order to calculate this indicator, the total number of hours each of the five identified key applications are unavailable has to be calculated and divided by the total number of required operating hours, both for the latest financial year. Then determine the average percentage availability across the applications. Definition of unavailability – The lack of ability for a component or service to perform its required function at a stated instant or over a stated period of time. It is usually expressed as the unavailability ratio (i.e. the proportion of time that the service is available for use by the customers within the agreed service hours to its unavailability). A user is defined as an individual who is required to use ICT as part of their job role. For the purposes of this indicator this should be based on employees with a network account. Example Application 1: Total time unavailable = 100 Total required operating hours = 1820 Percentage of time for which the application is unavailable is 100/1820 x 100 per cent = 5.49 per cent Application 2: calculation as above = 5 per cent Application 3: calculation as above = 4.5 per cent Application 4: calculation as above = 3 per cent Application 5: calculation as above = 2 per cent Average percentage unavailability is (5.49 + 5 + 4.5 + 3 + 2) / 5 = 4 per cent

23
Reference number
Secondary indicator 4
Description
Percentage of users who are able to access the network and systems remotely.
Rationale and expected impact on behaviour
This indicator examines the extent to which the organisation equips individuals to work more flexibly, in this case remotely. Organisations should compare their results against this indicator with those of peer organisations, investigating reasons for significant differences in provision of remote access. Given the increasing trend to enable flexible working most organisations would expect to achieve a period-on-period increase in the percentage of users with remote access. However a high achievement against this indicator compared with a low achievement against primary indicator 2 (user competence) may indicate potential problems.
Definition
This indicator is measured by calculating how many users have the ability to access the corporate network and systems remotely as a percentage of the total number of users at the end of the latest financial year. Base the calculation on full-time equivalent users. A user is defined as an individual who is required to use ICT as part of their job role. In order to identify end users, it may be appropriate to define a user as an employee who has a network account. Remote access means having the ability to use the corporate network and systems outside of an organisation‟s premises, for example in the home. This must mean full access to the corporate network. It does not merely mean being able to access, for example, emails. Example Number of users with remote access = 345 Total users = 1565 Percentage of users with remote access is 345/1565 x 100 = 22.04 per cent Note: It is recognised that the level of remote access required will to an extent depend on the nature of the organisation and therefore needs to be considered in the context of this.

24
Reference number
Secondary indicator 5
Description
Acquisition costs per :
a) Desktop b) laptop
Rationale and expected impact on behaviour
This indicator examines the cost effectiveness of the organisation‟s procurement of workstations. (Note: this indicator is derived from SOCITM‟s Key Performance Indicator 4, “Acquisition costs of workstation” )
Definition
We are using the SOCITM definition of a workstation: “Any device which accesses data which for this indicator is restricted to PCs and laptops. It excludes printers, scanners, devices such as PDAs, netbooks and thin clients. . The workstation includes where relevant:
Keyboard
Monitor
CPU
Network card
Sound card
Speakers
CD, floppy and DVD drivers
Desktop operating system The annual acquisition cost of a workstation should comprise the following:
The equipment and software costs
The initial costs of procurement and installation which include: o Administrative cost of procurement o Physical cost of installation o Initial hand over training o Asset management o Setting up help desk o Management overheads, including an
appropriate share of support service costs charged to the ICT service (costs of financial, personnel, legal and premises)
o Travel time and vehicle costs o Disposal of a workstation
Equipment and operating system costs
Procurement and installation costs o Procurement administration o Configuration (including asset
management activity)

25
o Installation and hand-over training In the case of leased/ hired ICT equipment, then the organisation‟s annual lease / rental costs should be multiplied by 3 to give an equivalent outright purchase cost. (Excluding any support or maintenance contract costs within this). Should an organisation use a combination of leased and purchased equipment, then each should be calculated separately and then an average determined. Example Total cost of procurement and installation = £345,000 Number of workstations purchased during the year = 280 Acquisition cost per workstation is 345,000 / 280 = £1232.14 per work station
26
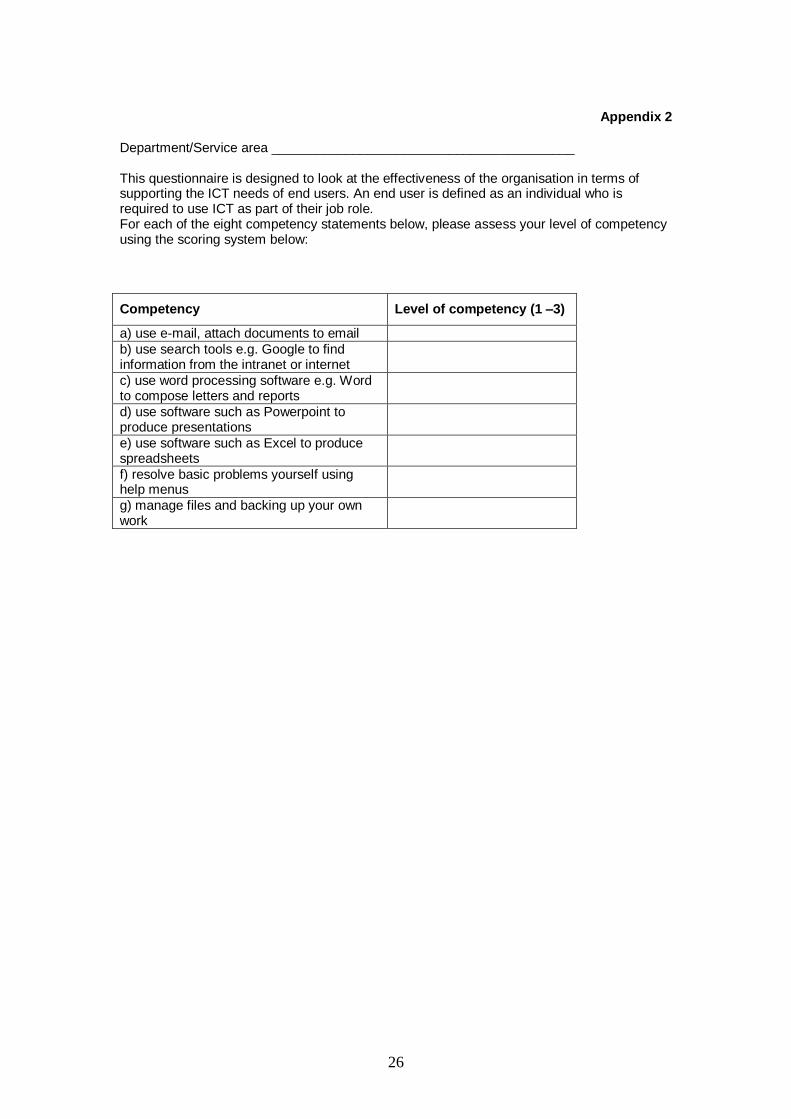
Appendix 2
Department/Service area _________________________________________ This questionnaire is designed to look at the effectiveness of the organisation in terms of supporting the ICT needs of end users. An end user is defined as an individual who is required to use ICT as part of their job role. For each of the eight competency statements below, please assess your level of competency using the scoring system below:
Competency Level of competency (1 –3)
a) use e-mail, attach documents to email
b) use search tools e.g. Google to find information from the intranet or internet
c) use word processing software e.g. Word to compose letters and reports
d) use software such as Powerpoint to produce presentations
e) use software such as Excel to produce spreadsheets
f) resolve basic problems yourself using help menus
g) manage files and backing up your own work